Article

Verification of Redox Flow Batteries’ Functionality by Electrochemical Impedance Spectroscopy Tests

1
Volterion GmbH, Carlo-Schmid-Allee 3, D-44263 Dortmund, Germany
2
German Aerospace Center, Institute of Engineering Thermodynamics, Pfaffenwaldring 38-40, D-70569 Stuttgart, Germany
3
Institute of Energy Storage, University of Stuttgart, Pfaffenwaldring 31, D-70569 Stuttgart, Germany
*
Author to whom correspondence should be addressed.
Batteries 2018, 4(4), 58; https://doi.org/10.3390/batteries4040058
Submission received: 28 September 2018 / Revised: 24 October 2018 / Accepted: 30 October 2018 / Published: 6 November 2018
(This article belongs to the Special Issue Vanadium Redox Flow Battery and Its Applications)

Abstract

:
The state-of-the-art functionality test of classic redox-flow-stacks measures the current–voltage characteristic with the technical electrolyte. This research paper aims to simplify the validation of redox flow batteries’ functionality by conducting electrochemical impedance spectroscopy (EIS) on redox flow stacks. Since the electrolyte used in the batteries is usually toxic and aggressive, it would be a significant simplification to verify the functionality with an alternative, non-toxic fluid. EIS measurements on batteries with larger sized electrodes, multiple cells, and different fluids were performed. It was demonstrated that all impedances are repeatable, thereby validating this procedure as a qualification method for full-size and complex batteries with an alternative fluid. EIS measurements were able to detect deliberately manipulated cells. This research uses three different analysis methods for the acquired data to identify errors. The respective approaches are, firstly, (1) a comparison of the Nyquist plots; secondly, (2) a comparison of the Bode plots; and thirdly, (3) a comparison of the calculated characteristic values of the equivalent circuits. The analysis found that all methods are suitable to detect errors in the batteries. Nevertheless, the bode-plot comparison method proves to be especially advantageous, because it enables a quantitative statement.

1. Introduction

The worldwide energy supply is undergoing a radical change. If the Paris climate conference (COP21) goals are to be met, the amount of renewable energies will need to increase constantly in the future. Solar and wind power will provide most of the additional green electrical energy. Because these are fluctuating power sources, options need to be found to make the energy transition as cheap as possible. Besides grid expansion and smart grids, energy storage will be an essential part of the energy system [1].
Storage is needed for different capacities or time ranges (seconds to days) and different power ranges (kW to GW). Redox flow batteries (RFBs) are a promising technology that meet these requirements, because the power and the capacity in these batteries are not coupled [2,3,4,5].
Their advantages over Lithium-Ion batteries are their long lifetime and good scalability. Since the cost of these batteries is still relatively high, research is necessary to make the production and installation of these batteries more efficient [4,6,7]
A cost aspect in production is the characterization of the batteries at the end of the manufacturing process to demonstrate their functionality. Usually, the quality of batteries is tested with current–voltage-cycles using the technical electrolyte, e.g., a vanadium ion solution in sulfuric acid. Disadvantages are the long duration of these cycles and the used toxic and highly aggressive technical electrolyte. In lithium batteries and supercapacitors and lead acid batteries, electrochemical impedance spectroscopy tests are already being used to obtain important characteristics like the state of charge (SOC) [8,9,10,11,12]. Electrochemical impedance spectroscopy has the advantage of being non-destructive; fast; and well-established, e.g., standardly used to analyze corrosion processes [13]. To date, the existing scientific literature exclusively discusses impedance measurements with RFB on single cells with small electrode surfaces. Such impedance measurements were mostly conducted to characterize single parts of the batteries [14,15,16].
To simplify the proof of redox-flow batteries’ functionality, EIS measurements on batteries with larger sized electrodes and multiple cells were conducted with different fluids. Testing with less toxic and less aggressive fluids would be an important simplification, because special precautions to handle the hazardous materials for transportation would be superfluous.
Three different evaluation methods were used to identify errors in damaged batteries. Firstly, (1) a comparison of the Nyquist plots; secondly, (2) a comparison of the Bode plots; and thirdly, (3) the calculated characteristic values of the equivalent circuits were compared. In all these methods, twice the standard deviation of the error-free batteries was compared to the mean value of the damaged battery.

2. Experimental

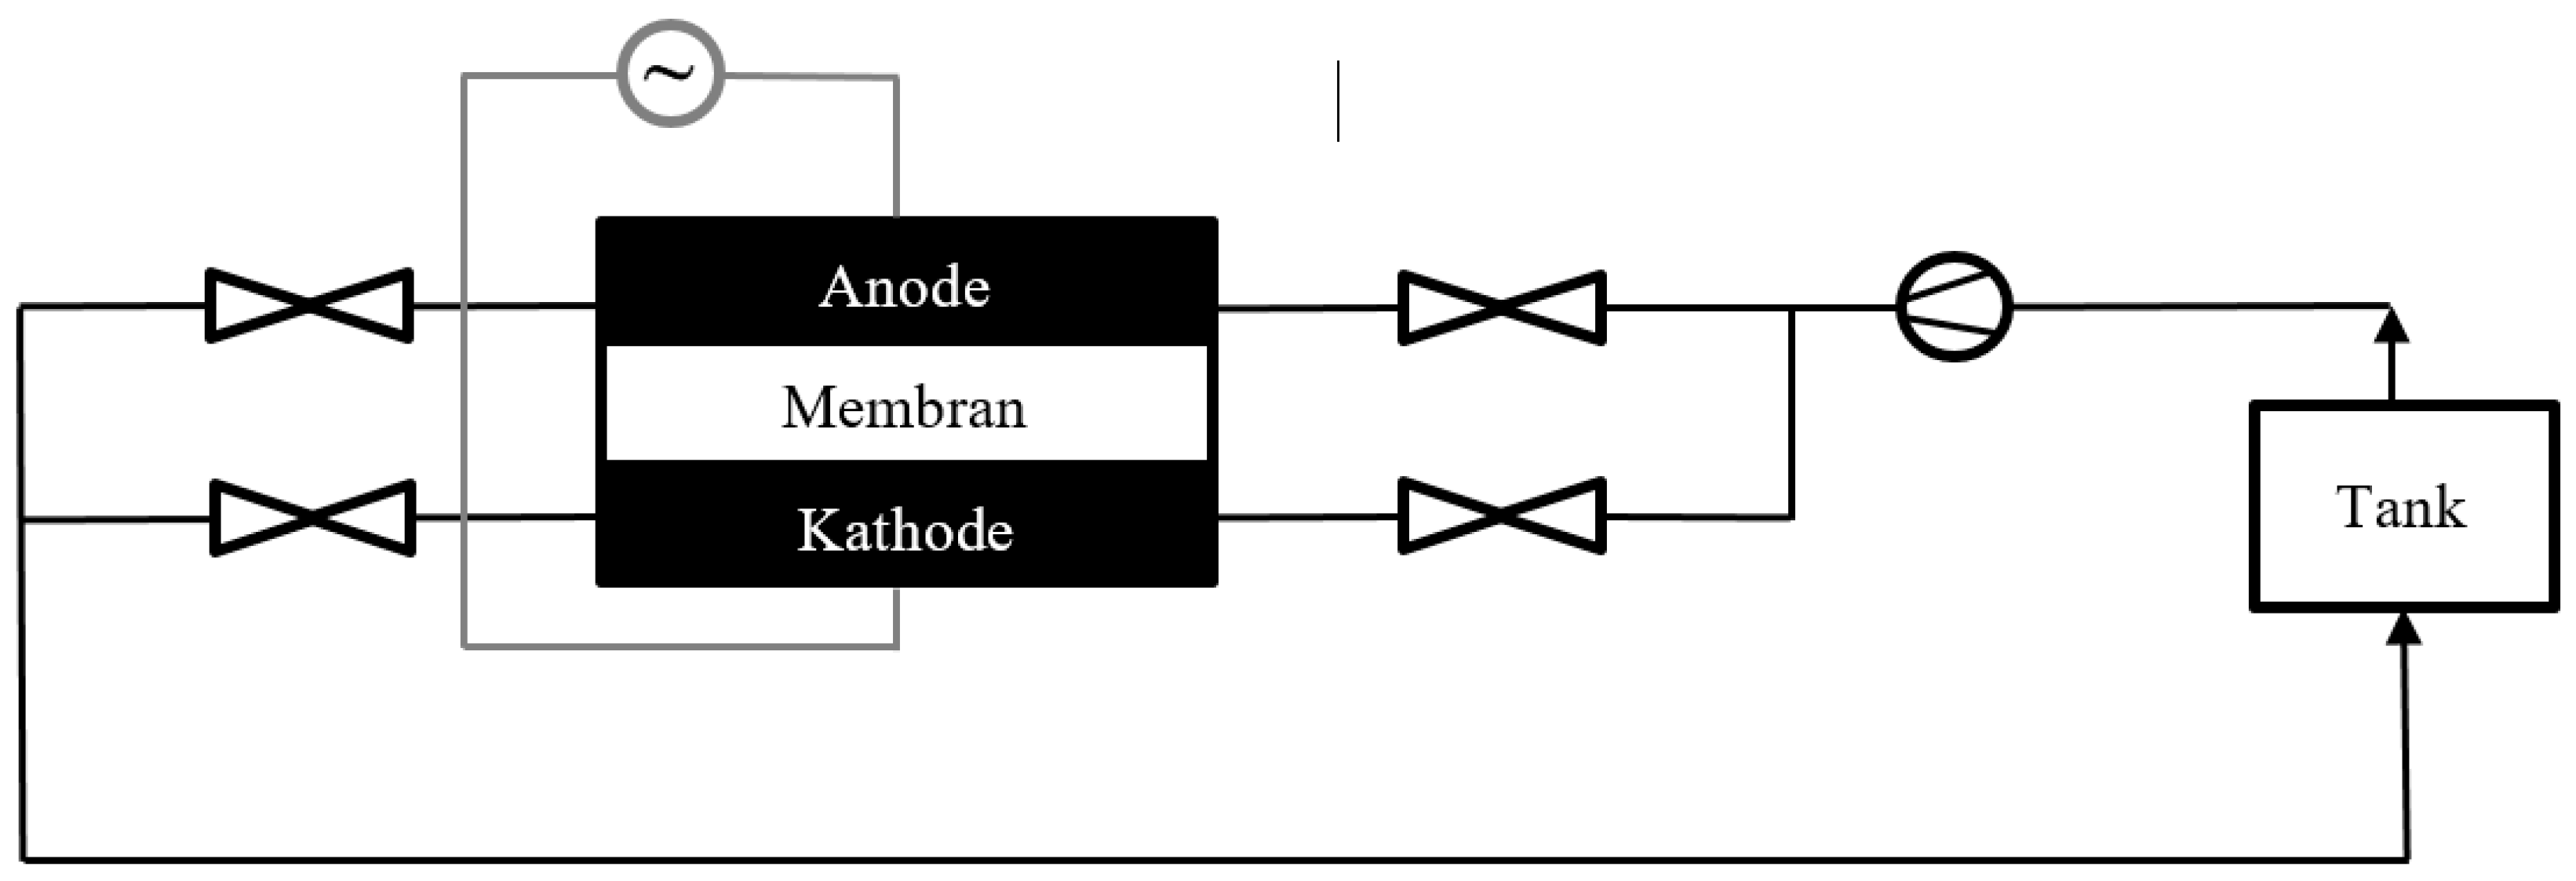
2.1. Set-Up of the Test Stand and the Battery

The electrochemical experiments were performed with a symmetric cell configuration (Figure 1), which has been demonstrated as a useful setup by Sun et al. [14]. Valves control the flow of the inlet and the outlet. One pump circulates the same fluid from the tank (5 L) through the anode and the cathode. The electrodes are connected to the electrical test system. A pulsation dampener as described by Sun et al. [14] was not necessary, because most of the measurements are conducted without flow and a rotary pump instead of a peristaltic pump is used.
The experiments are conducted with different batteries. The first small test cell is square shaped (8 × 8 cm). The schematic of the setup of the battery is shown in Figure 2. One cell consists of two frames (PP), two bipolar plates (Volterion graphite plates), one membrane (Fumatech FAP membrane, Anion exchange), and felts (SGL GFD 2.5 graphite felt) on both sides of the stack. The outer bipolar plates at the end of the stack are plated for contact resistance minimization. Four cell gaskets are used to seal the bipolar plates with the frames and the membrane. To minimize the internal resistance, compression of the felts is necessary. Therefore, three felts are used in each half cell, resulting in a felt compression of 25%.
Furthermore, batteries with more cells and with larger sized electrodes (493 cm2) were measured. The basic design of these cells is the same as in the smaller test cells, except the thinner frames and electrodes. Because the frames are welded, no sealings are necessary.
Four different batteries with different electrode surfaces and different numbers of cells were tested:
Battery A 1 cell, 64 cm2; battery B 2 cells, 64 cm2; battery C: 1 cell, 493 cm2; battery D: 10 cells, 493 cm2.

2.2. Measurement Parameters and Settings

Electrochemical measurements are performed using a Scienlab test system. The frequency ranges from 2 kHz to 0.2 Hz with different sinusoidal excitation voltage (0.08 V to 0.5 V) and a maximum resulting current of 0.5 A depending on the used test fluid. Each of the fifteen characteristic frequencies is measured 20 times.
Electrochemical measurements are conducted with different fluids (air, deionized water, and sulfuric acid (0.0001 molar, 0.01 molar, 1 molar, and 2 molar) and vanadium electrolyte (1.6 MV, 2 M and H2SO4)). The aim of these tests is to find a less toxic and less aggressive fluid than the vanadium electrolyte.
The different fluids are evaluated in terms of:
  • Hazard potential: How toxic and aggressive is the fluid?
  • Repeatability: Is it possible to measure almost the same impedances several times? In general, the application of EIS requires that the following three conditions are fulfilled [16]:
    (1)
    Causality: the outgoing signal only reacts to the incoming signal (no outliers);
    (2)
    Stationarity: the system does not change with time;
    (3)
    Linearity: Linear systems should not generate higher harmonics. If there are no harmonics, the output signal should only have frequency components of the incoming signal. This can be proven by lowering the excitation amplitude until no changes of the impedance-spectrum can be measured.
  • Distinguishability: do the evaluated diagrams (Bode- and Nyquist plots) have characteristics that are easy to distinguish (high points or turning points)?

2.3. Possible Errors in the Battery

After measuring the error-free redox-flow-batteries, the batteries are manipulated. The effect of different damages on the electrochemical impedance measurements are examined. In the following section, the different errors in the four batteries will be described:

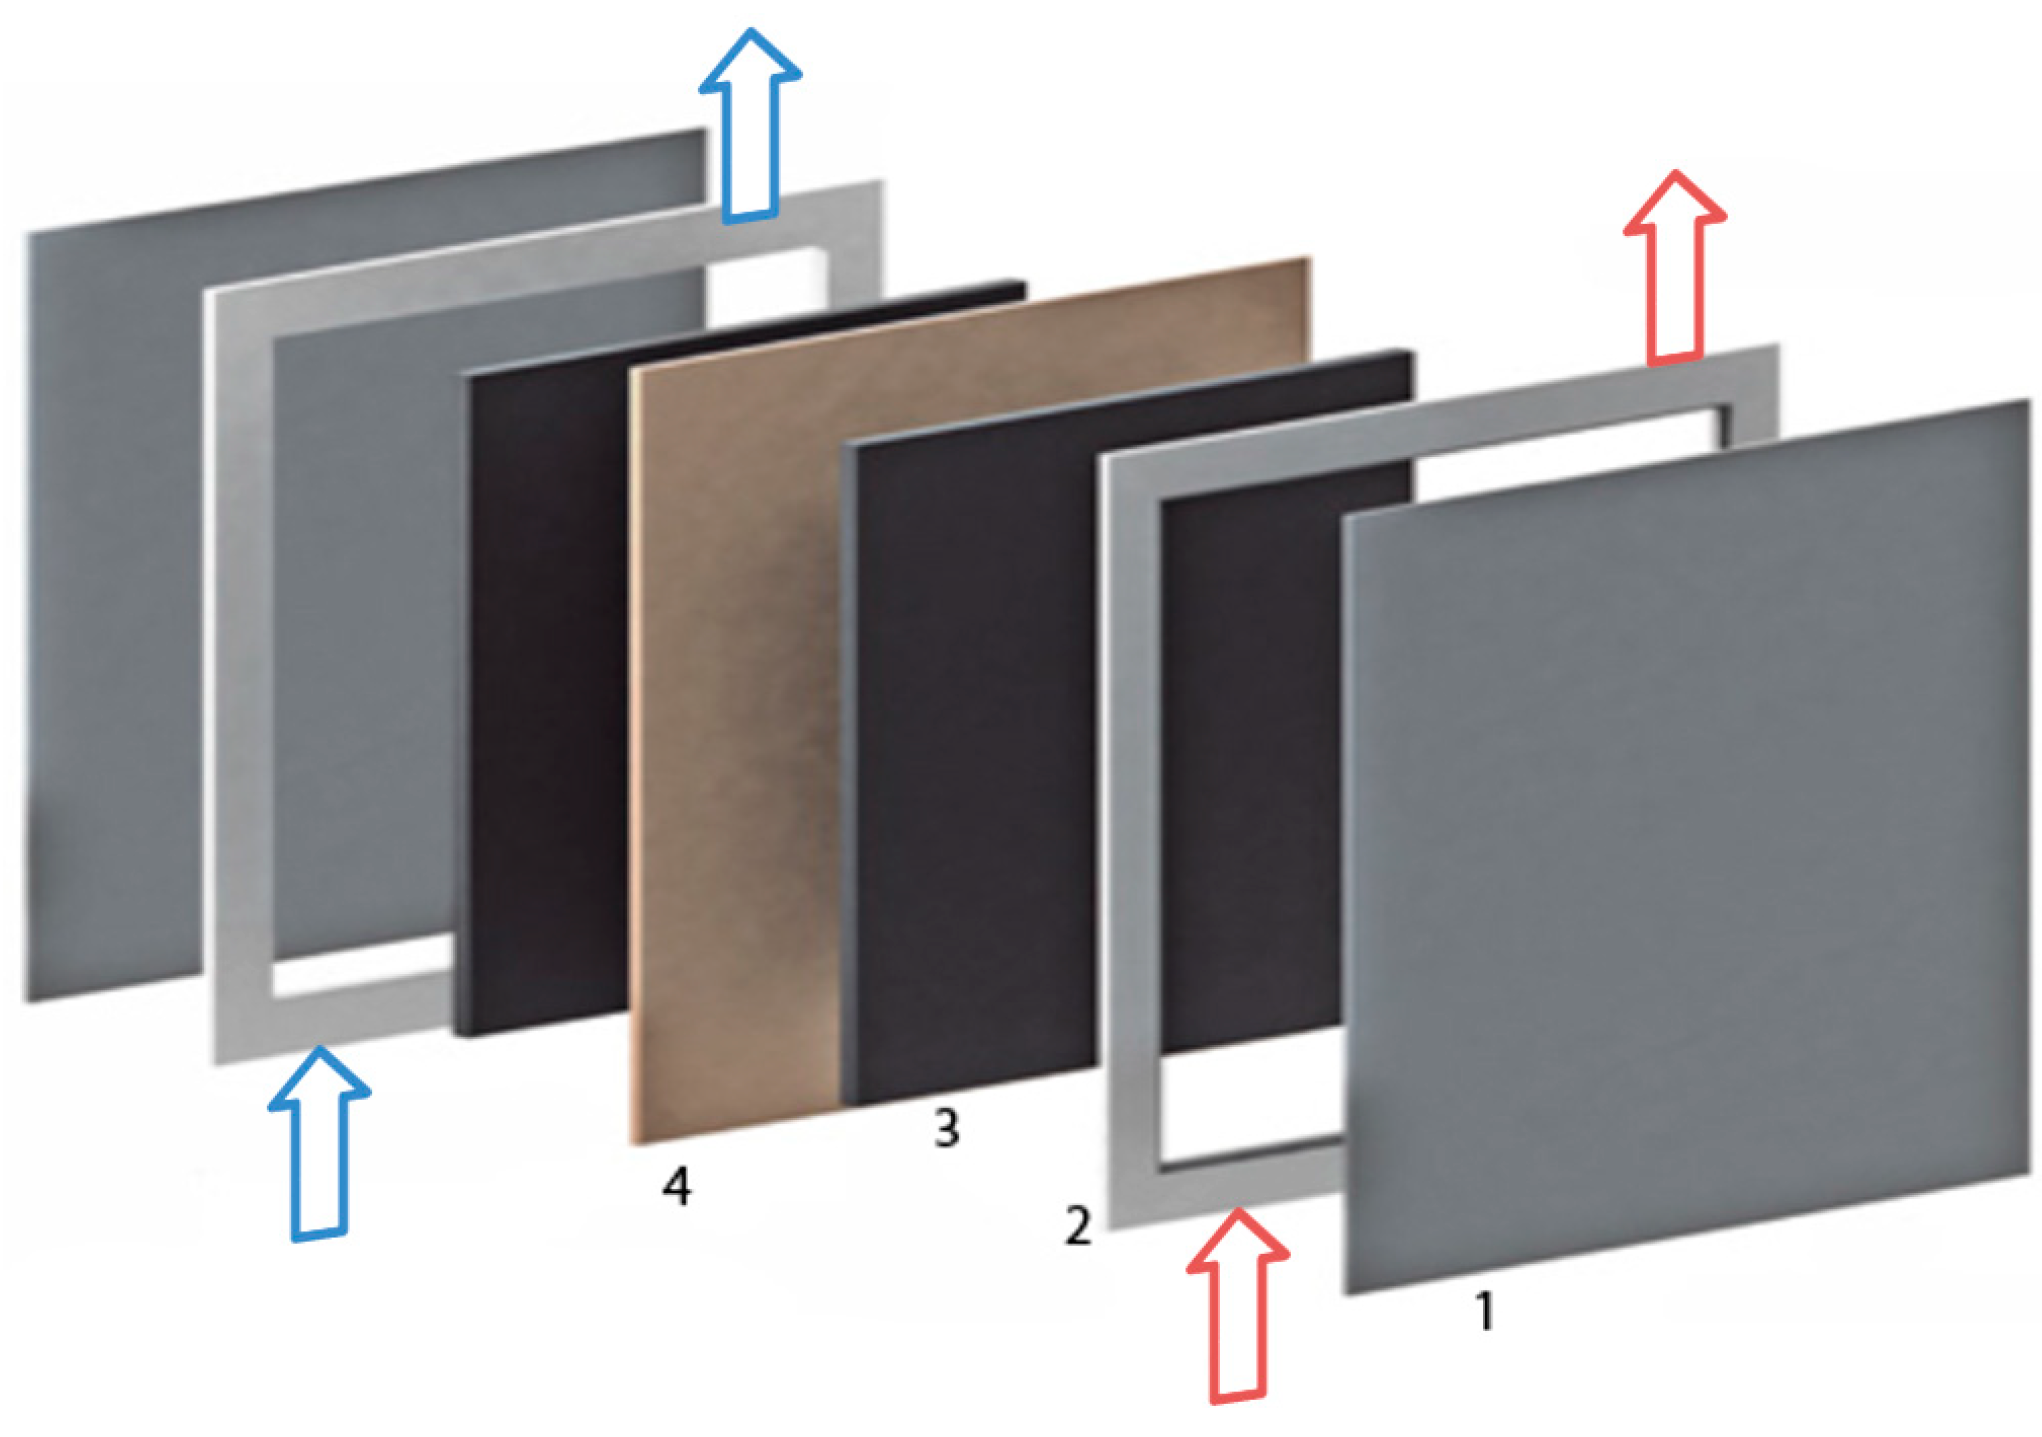
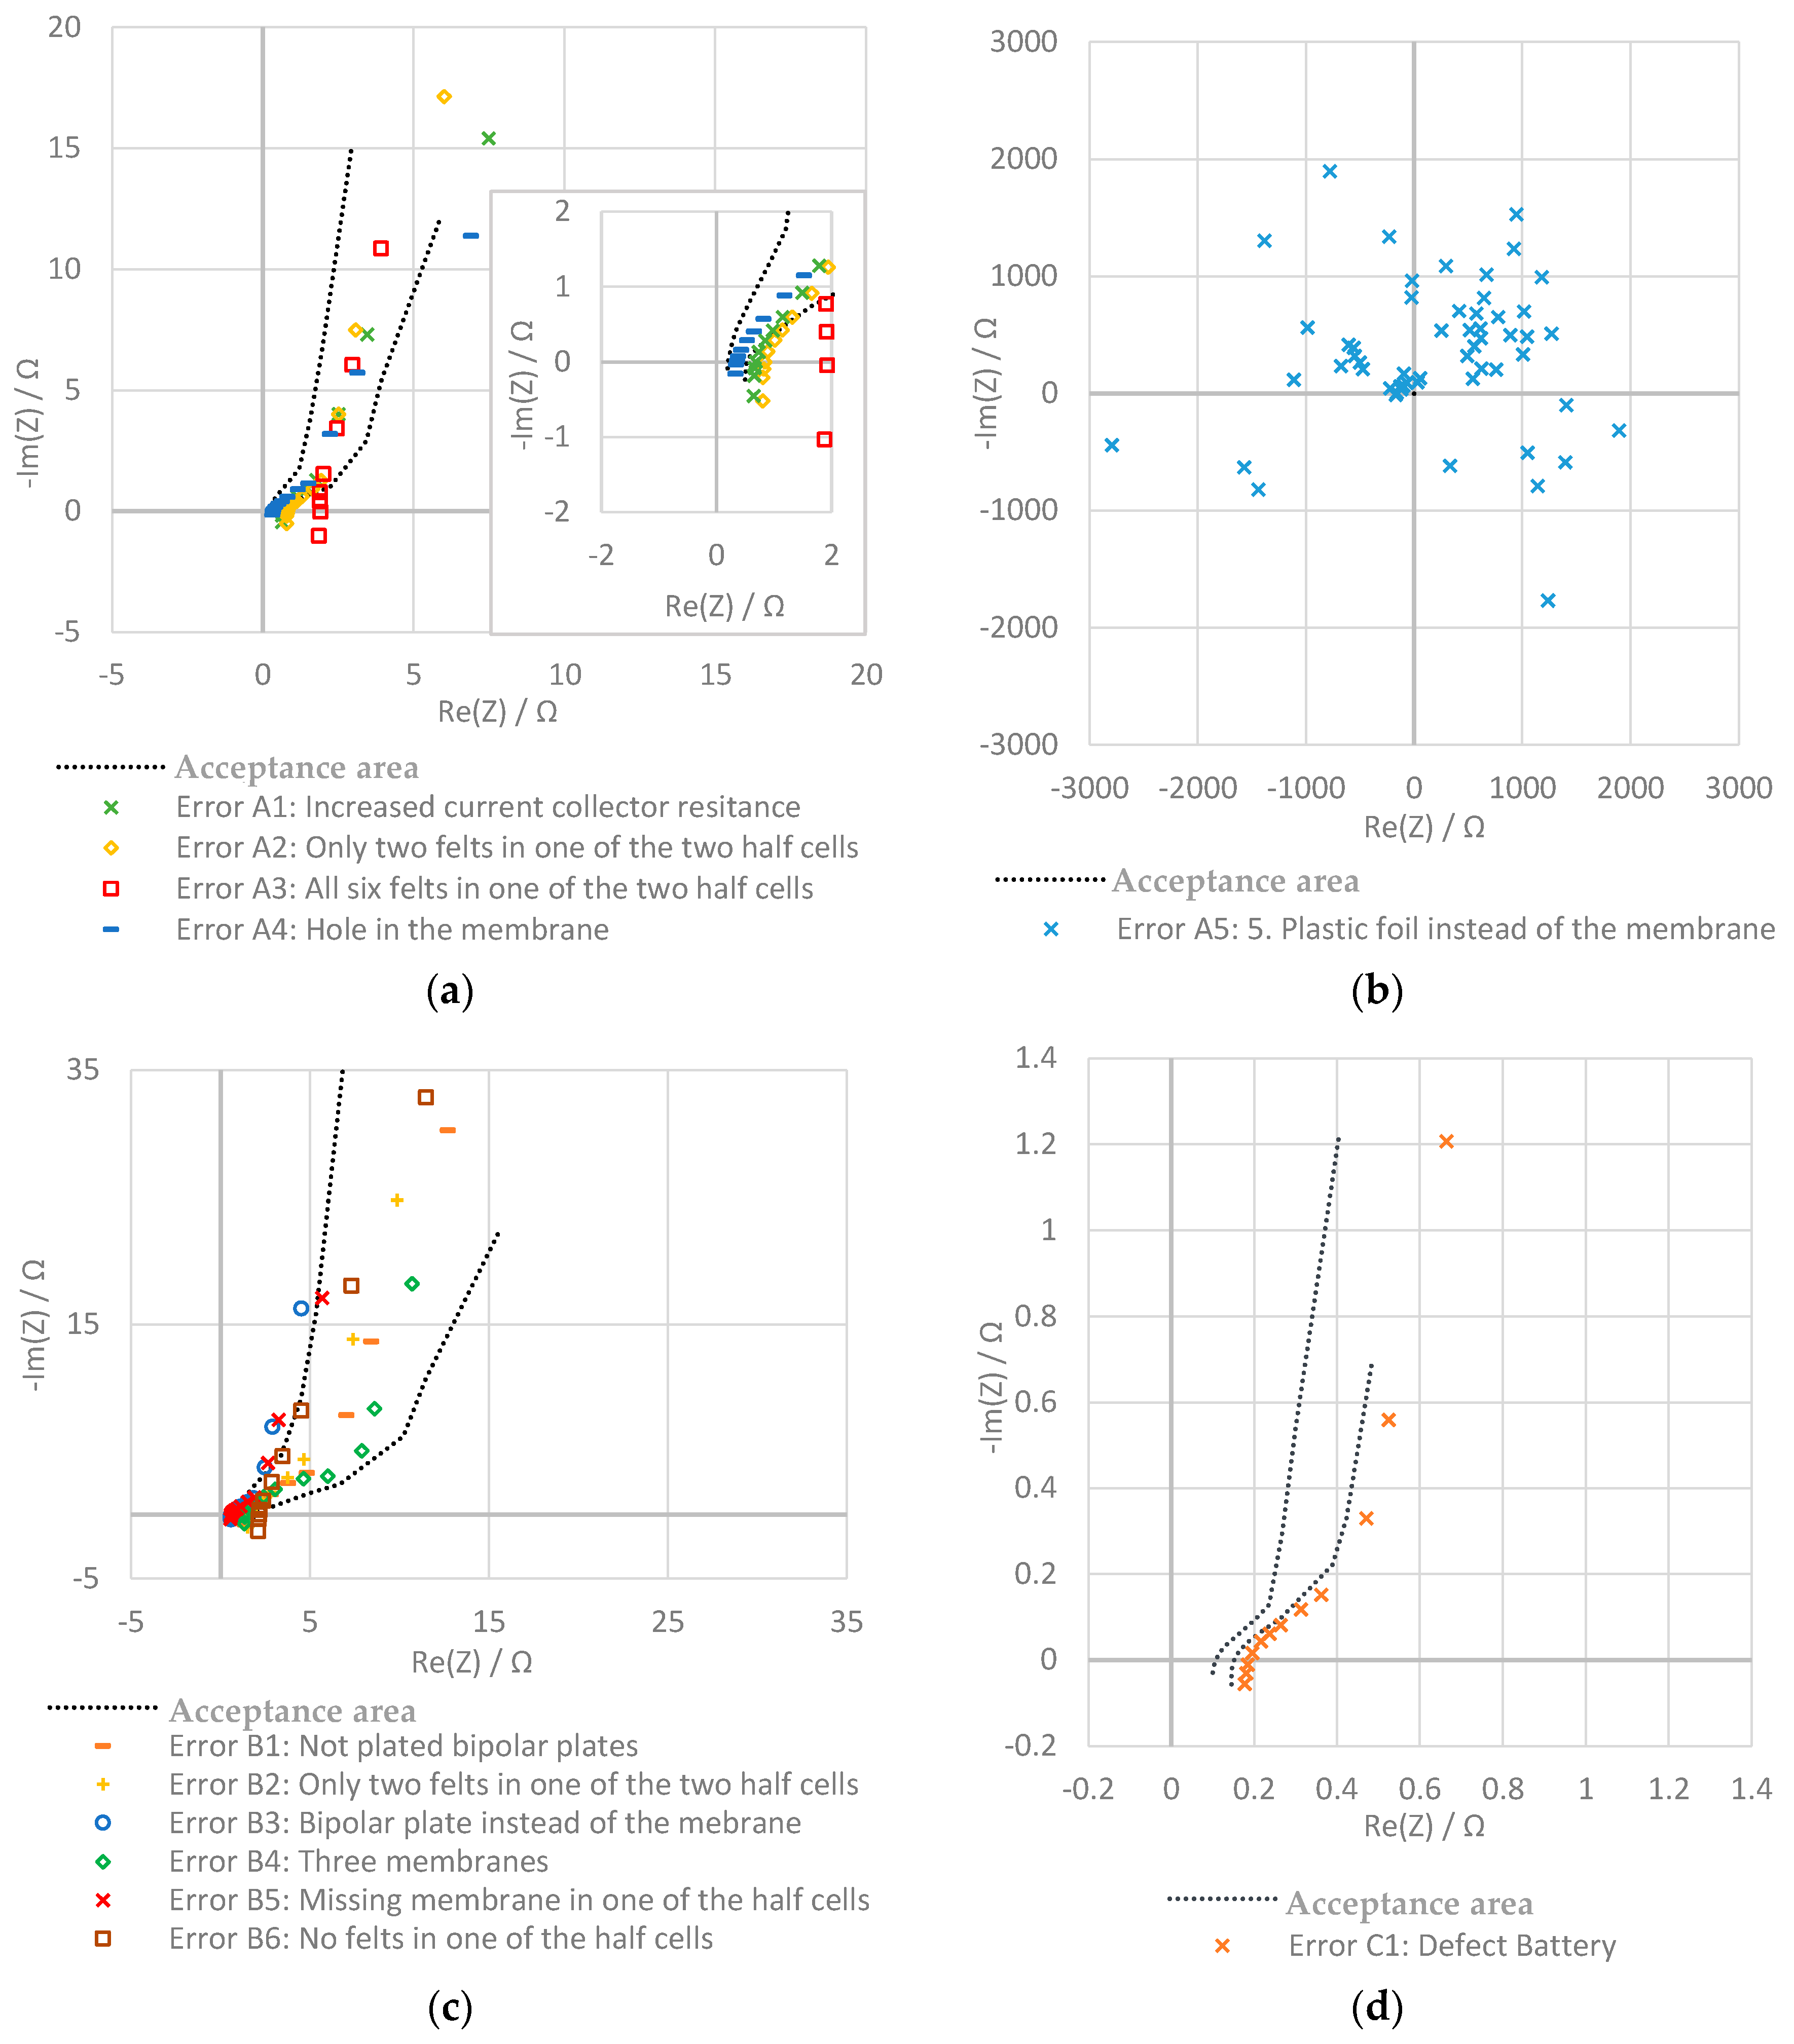
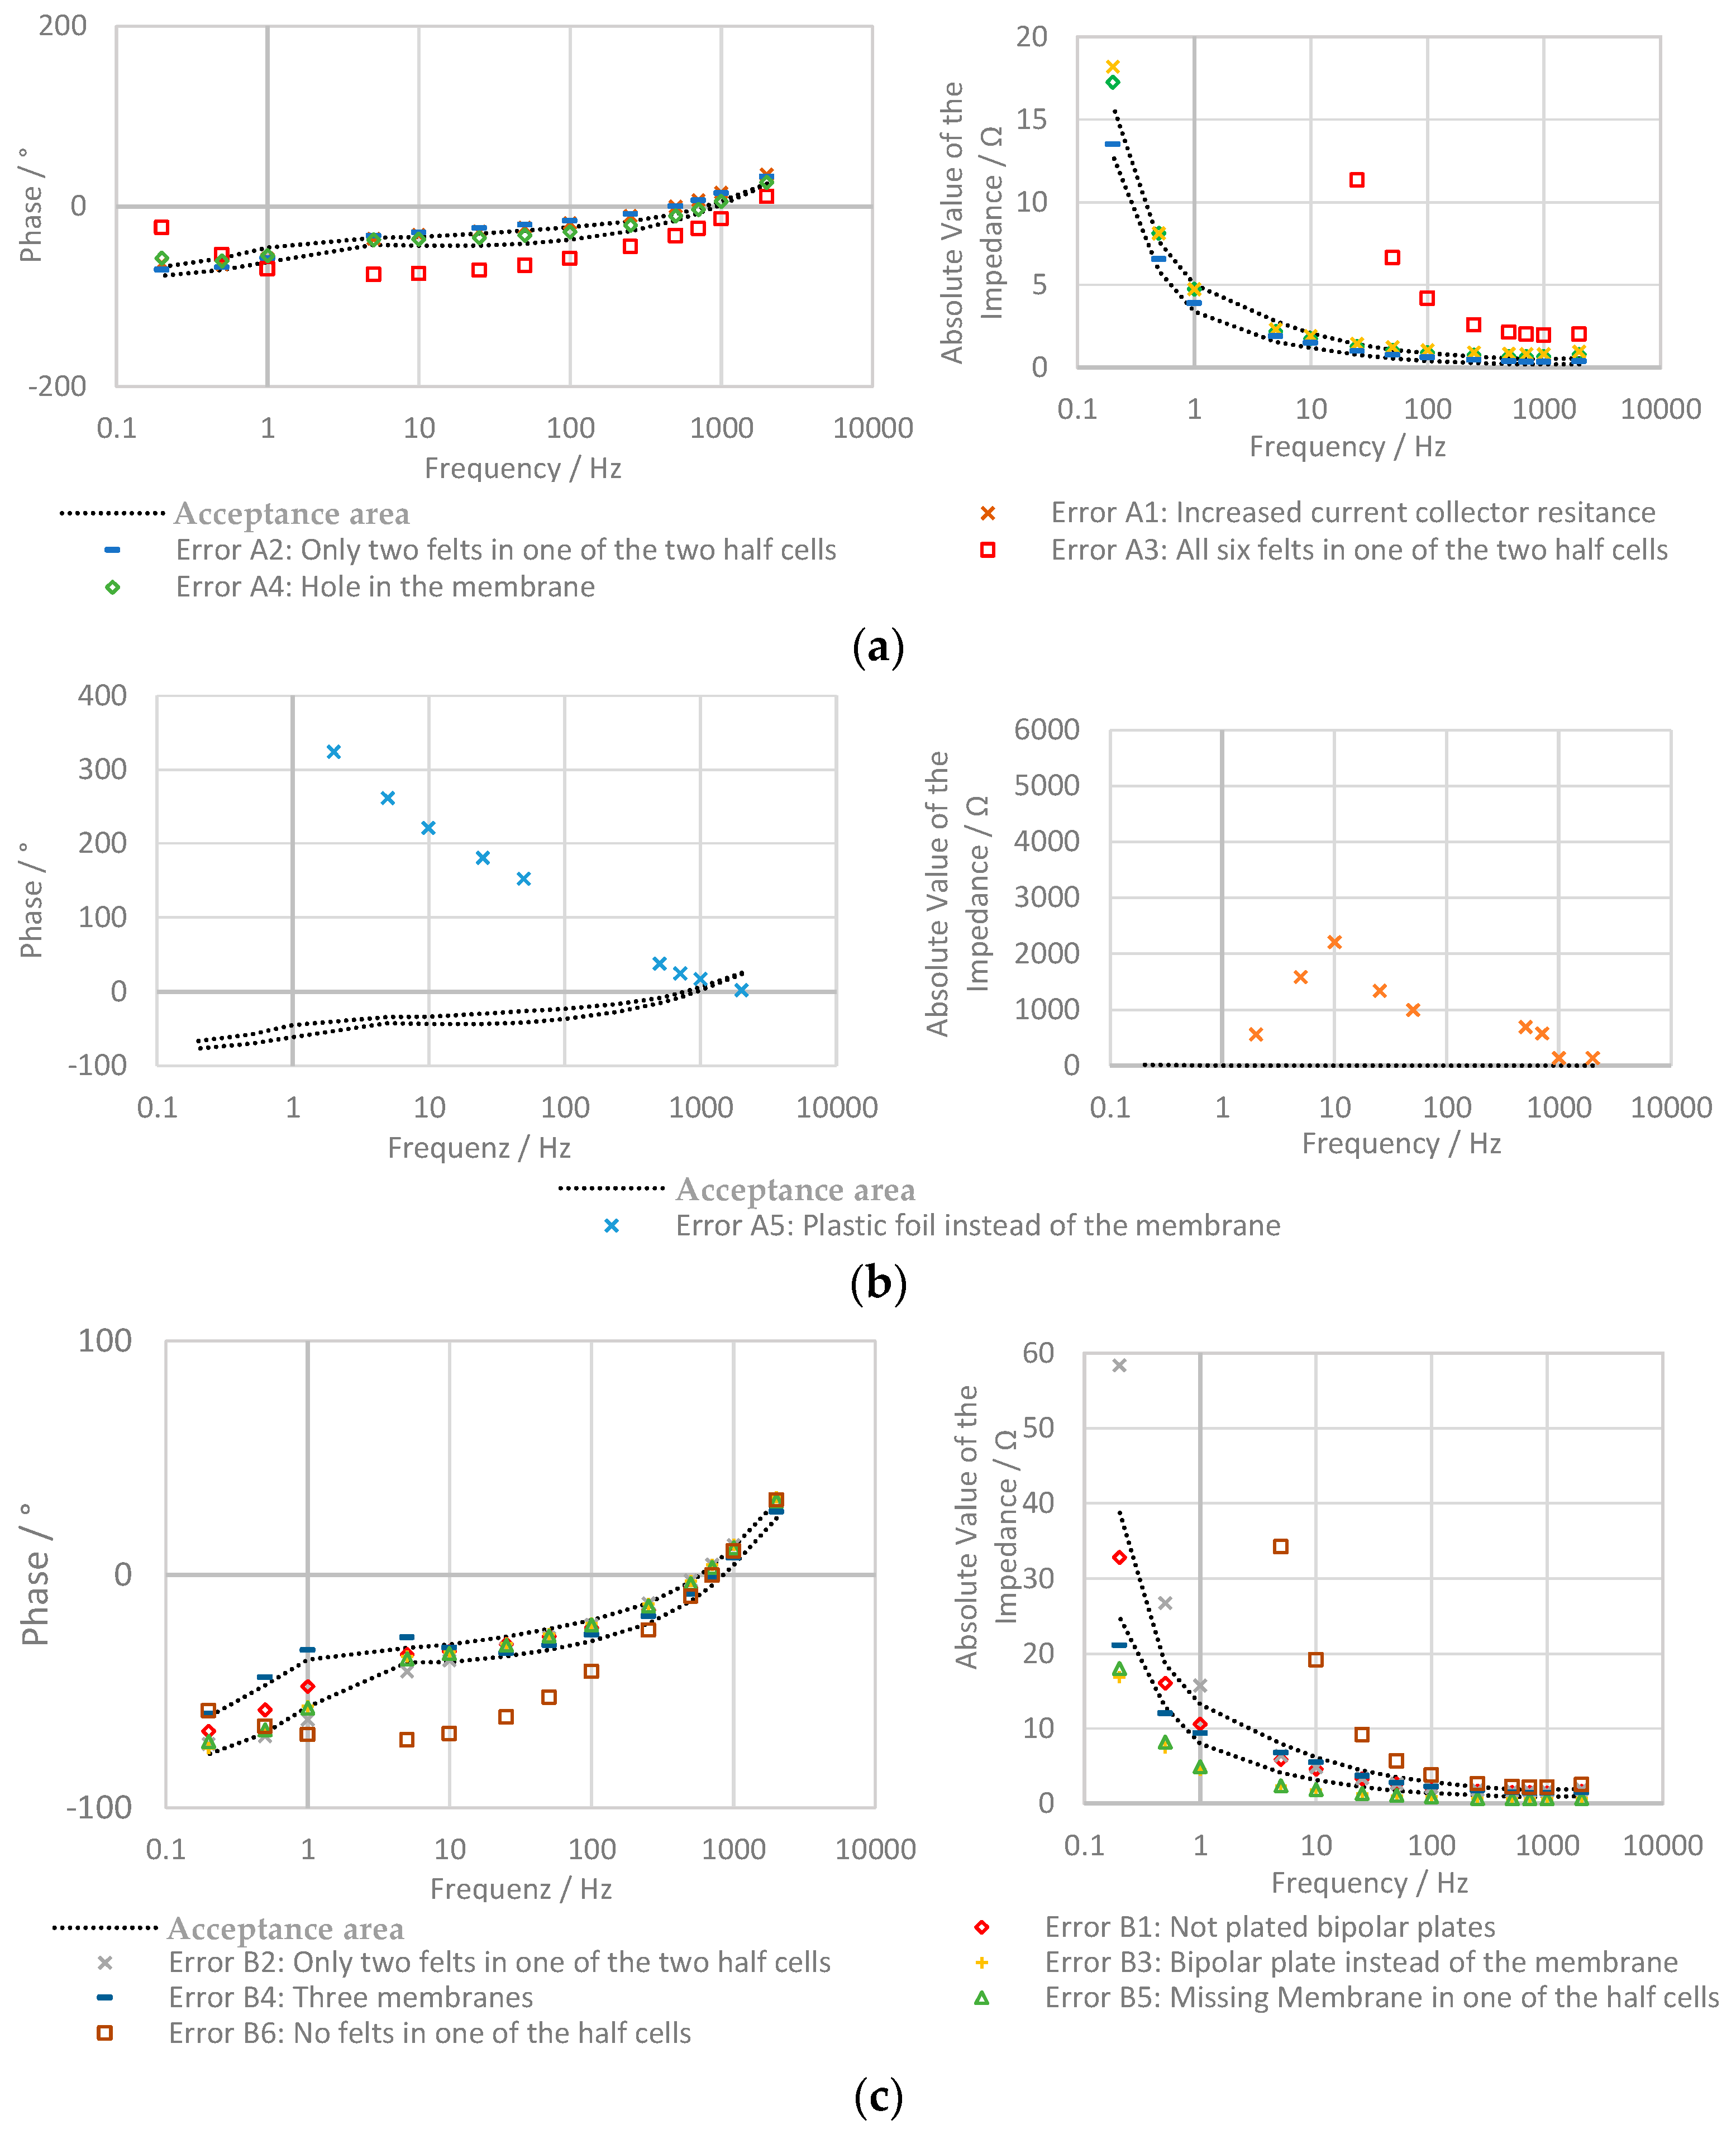
2.3.1. Battery A: One Cell, Electrode Surface: 64 cm2

  • Increased current collector resistance: To decrease the ohmic resistance of the battery, the outer two bipolar plates with contact to the current collectors are normally nickle-plated. In this experiment, the impact of not plated bipolar plates was examined.
  • Only two felts in one of the two half cells: in one of the two half cells, only two instead of three felts are used.
  • All six felts in one of the two half cells: in this test, all felts are in the same half-cell of the stack and no felts are on the other side.
  • Hole in the membrane: a hole with a diameter of about 2 mm was pierced into the membrane.
  • Plastic foil instead of the membrane: in this experiment, the membrane is replaced by a non-conducting, tight plastic foil.

2.3.2. Battery B: Two Cells, Electrode Surface: 64 cm2

In principle, the same errors in batteries with multiple cells could occur. Because of the higher number of cells and components, there are additional possible causes of failure:
  • Increased current collector resistance: see the section above.
  • Only two felts in one of the two half cells: during this test, one of the four half cells only contains two felts.
  • Bipolar plate instead of the membrane: in this experiment, one of the two membranes is replaced by a bipolar plate.
  • Three membranes: the bipolar plate is replaced by a membrane.
  • Missing Membrane in one of the half cells: one of the two membranes is removed.
  • No felts in one of the half cells: in one of the half-cells, the felts are removed.

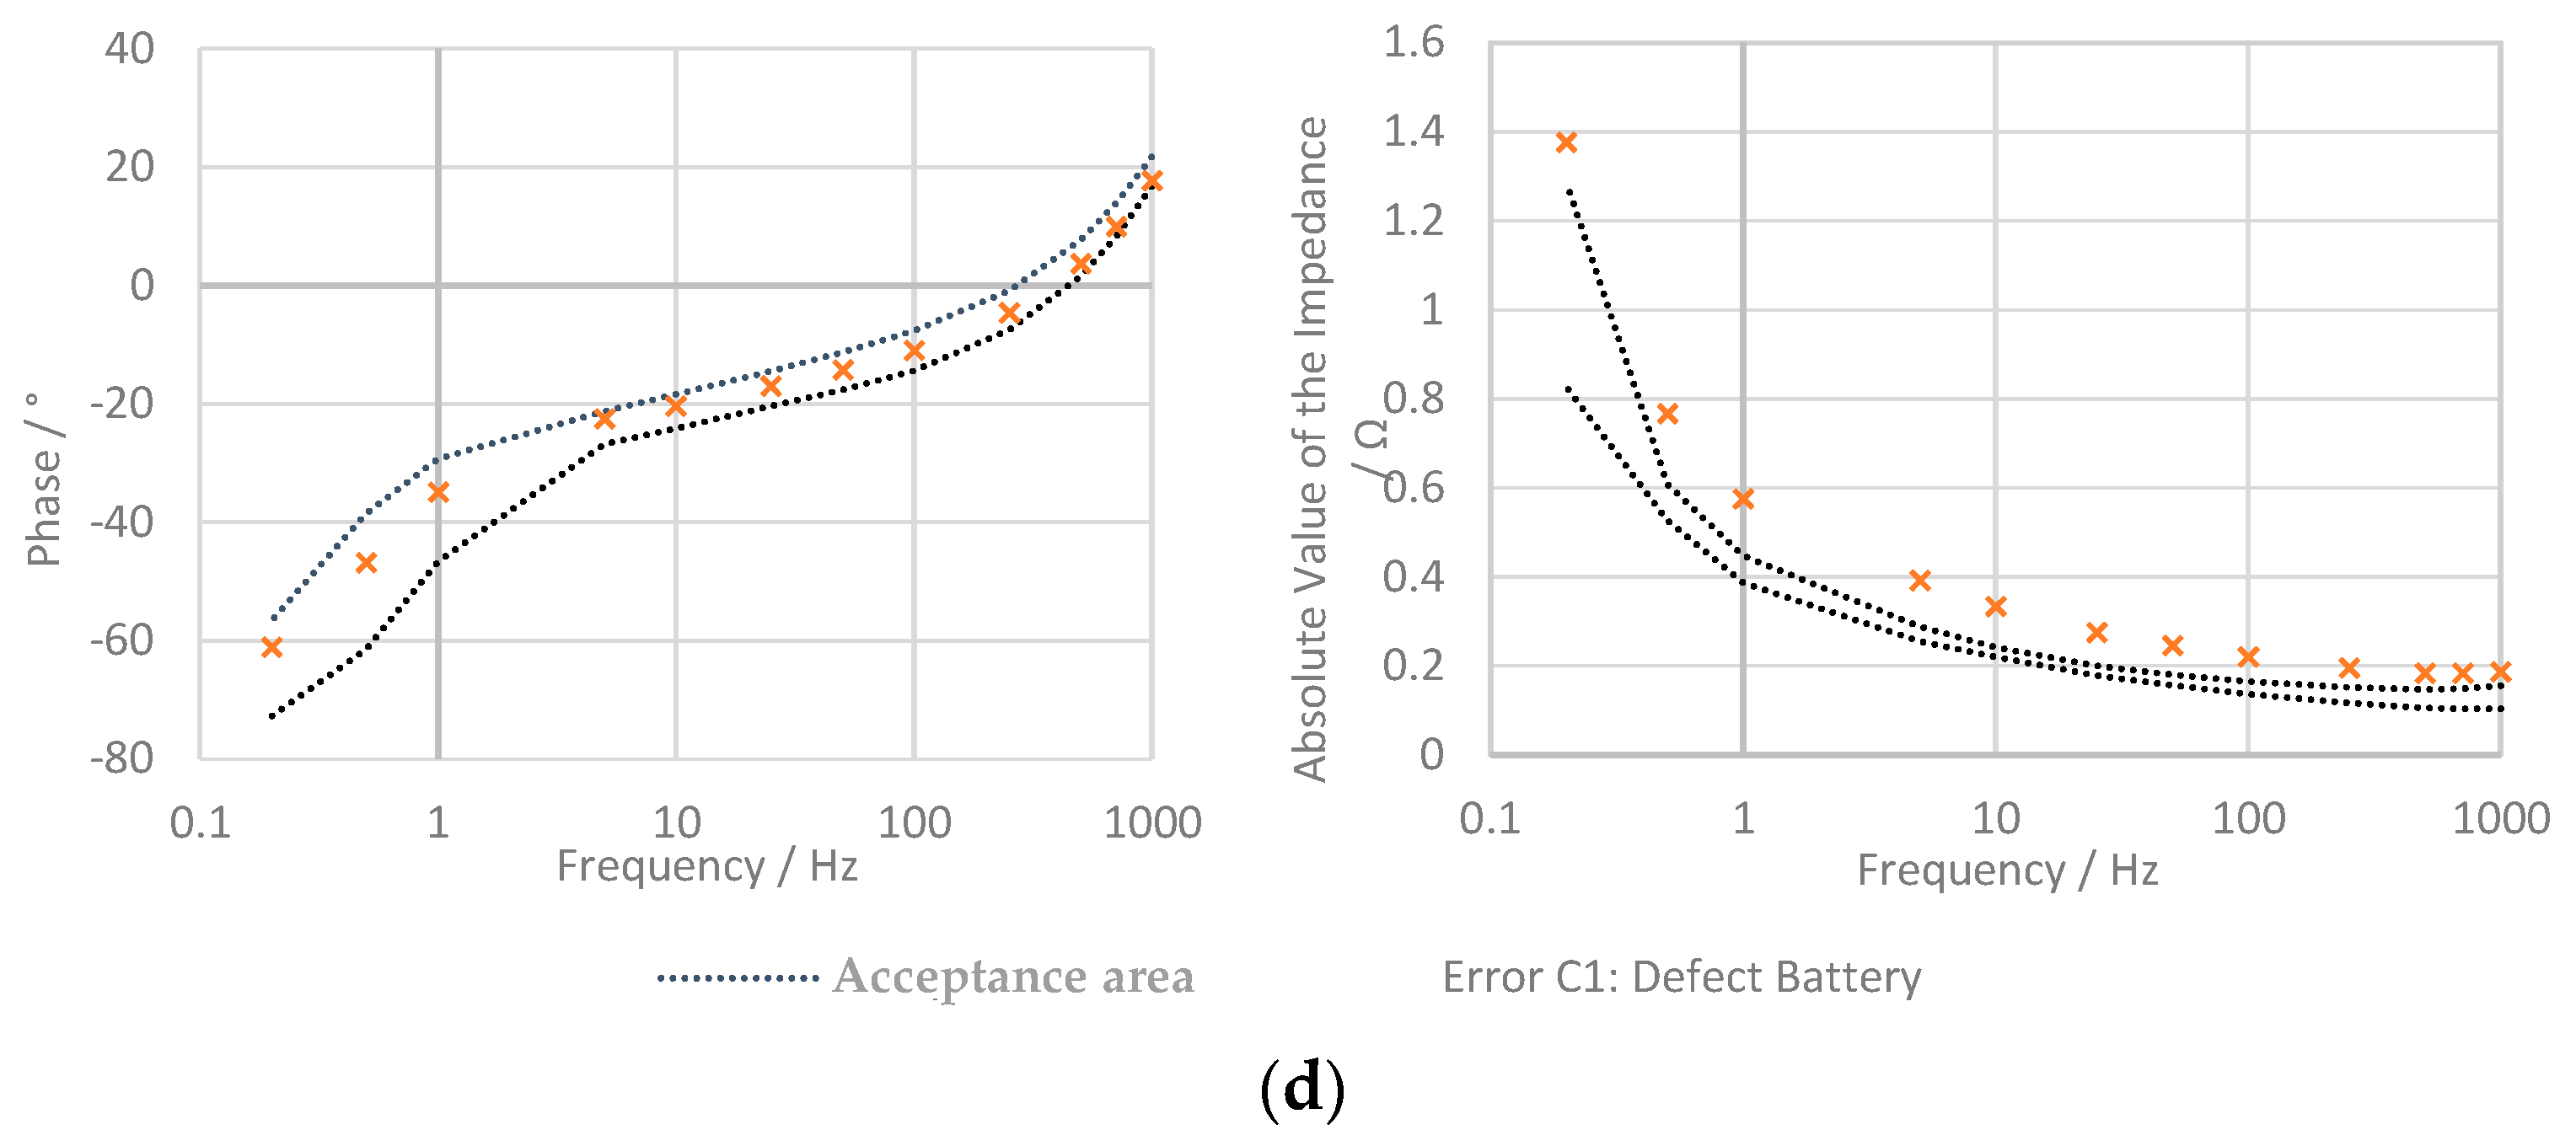
2.3.3. Battery C: One Cell, Electrode Surface: 493 cm2

To date, the scientific literature has exclusively discussed impedance measurements on single cells with small electrode surfaces. The reason for this might be the limited current of the impedance measuring test systems. The usage of 0.01 molar sulfuric acid causes lower currents and allows these tests. In this experimental run, two error-free and one damaged stack are measured. The purpose of these tests is to demonstrate that stacks with bigger surfaces can be measured repeatedly with the performed impedance measurement. The error-free battery was damaged for test reasons by drilling a small hole (1.5 mm diameter) in the stack.

2.3.4. Battery D: Ten Cells, Electrode Surface: 493 cm2

Usually, Redox-Flow-Batteries consist of many cells. In this experiment, the repeatability of the measurement of a stack with ten cells and an electrode surface of 493 cm2 is shown.

2.4. Measurement Analysis

Three different methods are used to analyze the defects of the batteries. The first method uses the Nyquist plots, the second uses Bode plots, and in the third method the numerical calculated values for the components of the equivalent circuits of the error-free and the manipulated batteries are compared.

2.4.1. Nyquist Plot

One way to test whether the batteries have defects is to compare the Nyquist plots of the damaged test cell with the error-free batteries. In order to do so, a multiple of the standard deviation of the error-free battery is defined as the accepted area (See Figure 3). Using twice the standard deviation, almost every measurement series of the reference stack without failures is within the accepted area.
The mean values of the defect batteries were calculated and compared to the acceptance area. If one of the mean values is outside the boundary of the accepted area, the battery is classified as defect.

2.4.2. Bode Plot

In the bode plot, the frequency is plotted on the vertical, the electrical phase shift, and the absolute value of the impedance on the horizontal axis. In contrast to the Nyquist plot, the Bode plot explicitly contains the frequency scale so that each measurement of error-free and defect batteries can be directly compared at the same frequency. The analysis of the functionality is otherwise similar to the Nyquist plot method. In addition to the graphical analysis, an analytical method is used that examines the deviation from the acceptance area of the error-free battery in the Bode plot.

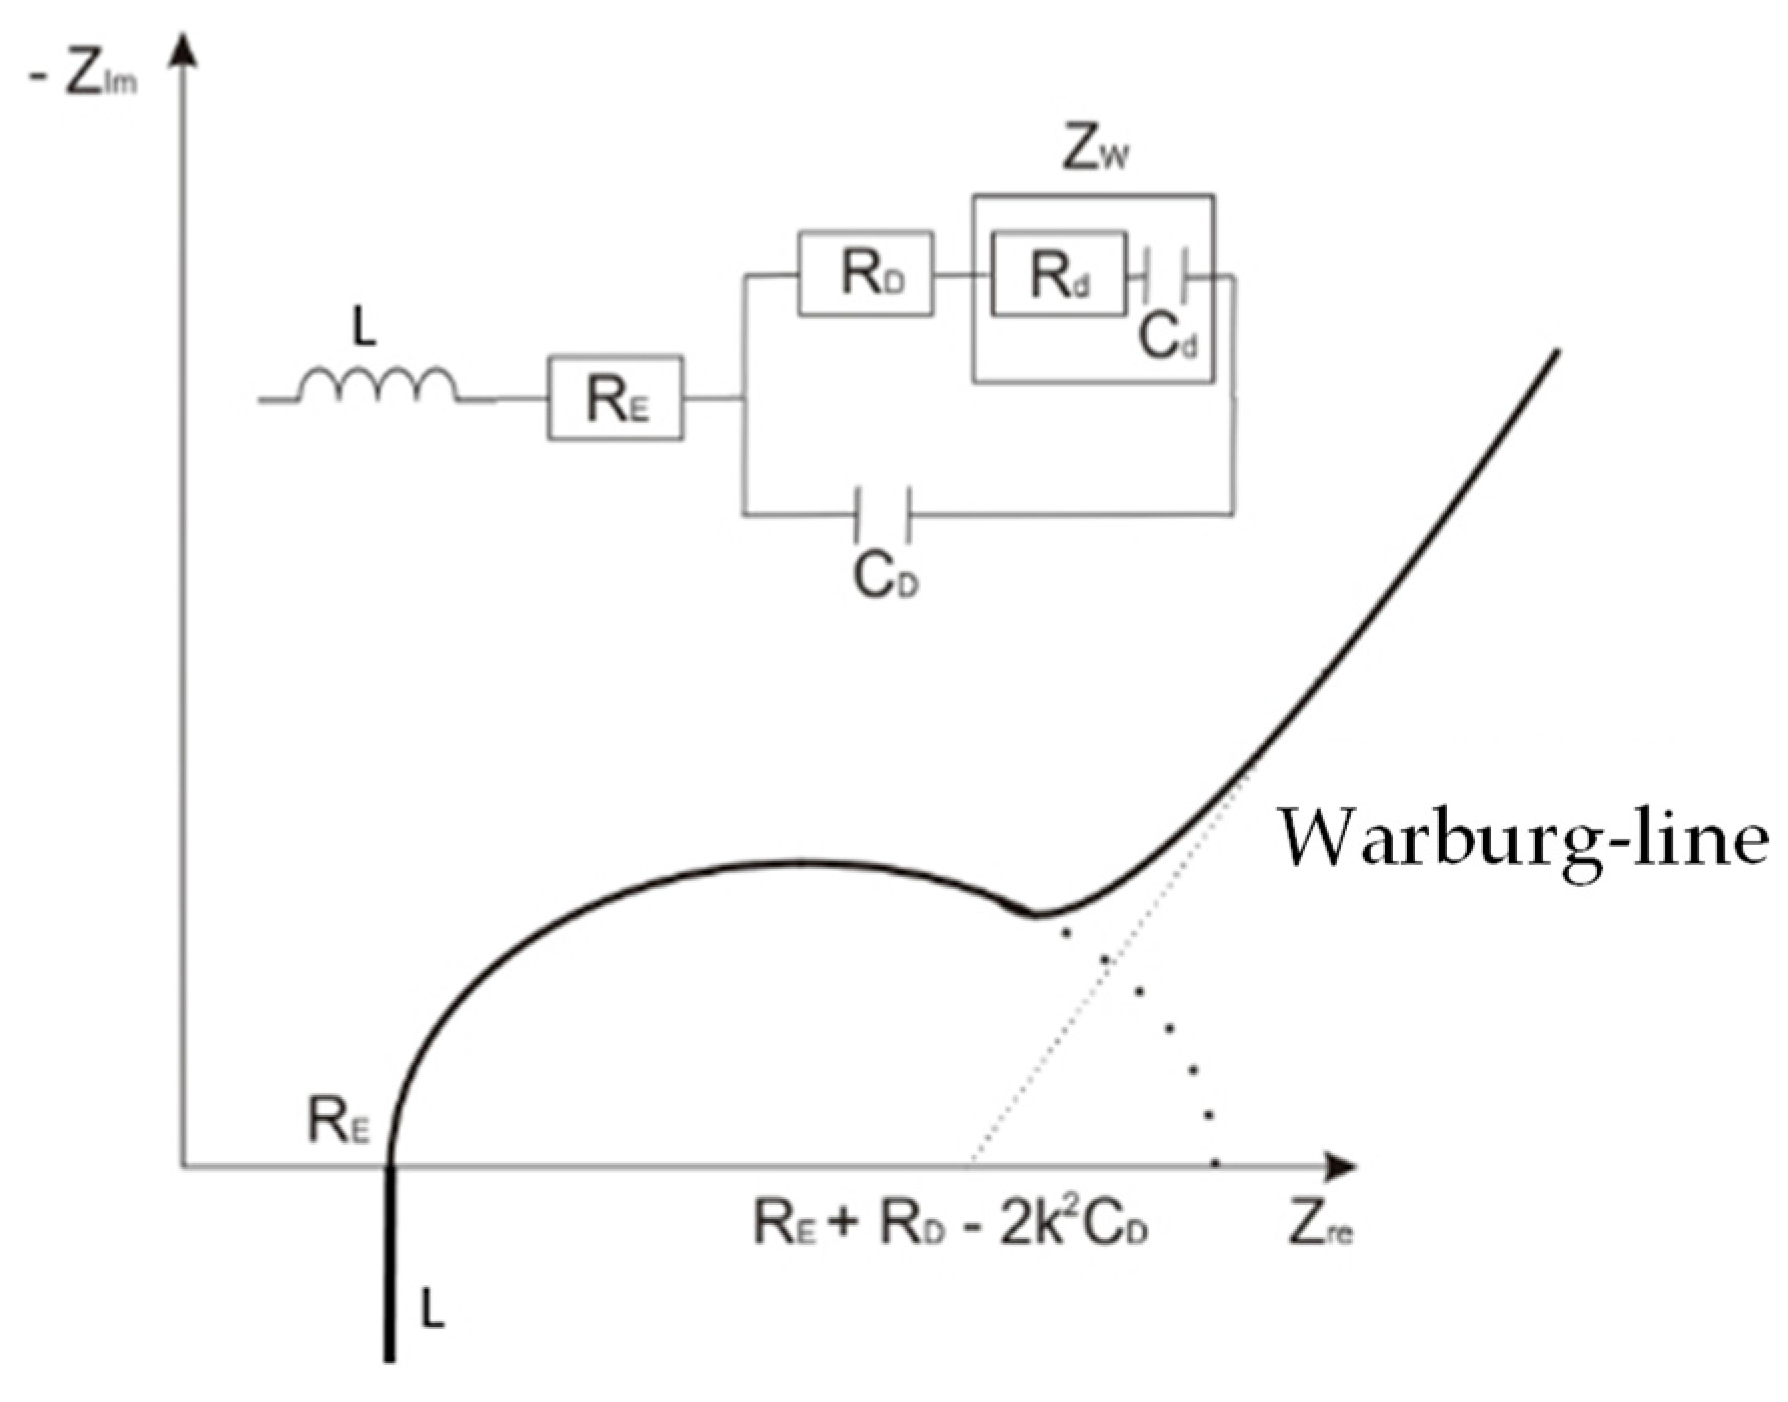
2.4.3. Analysis of the Equivalent Circuit

In the existing scientific literature, equivalent circuits are used to characterize components or processes in batteries [14,15,16,18,19,20,21,22]. Figure 4 shows the typical shape of a Nyquist plot for electrochemical cells and a common electrochemical equivalent circuit to describe it, which is also used in this work. L stands for the inductance, RE is the contact resistance, CD stands for the double layer capacity, and RD for the charge transfer resistance. The Warburg part ZW describes the mass transport-limited diffusion effects in the low-frequency region [23].
By comparing the calculated values for the components of the equivalent circuit of the error-free battery and the tested battery, defect batteries can be found. For evaluation of the elements, a fit of the data to equivalent circuit is performed with the software EC-Lab.

3. Results and Discussion
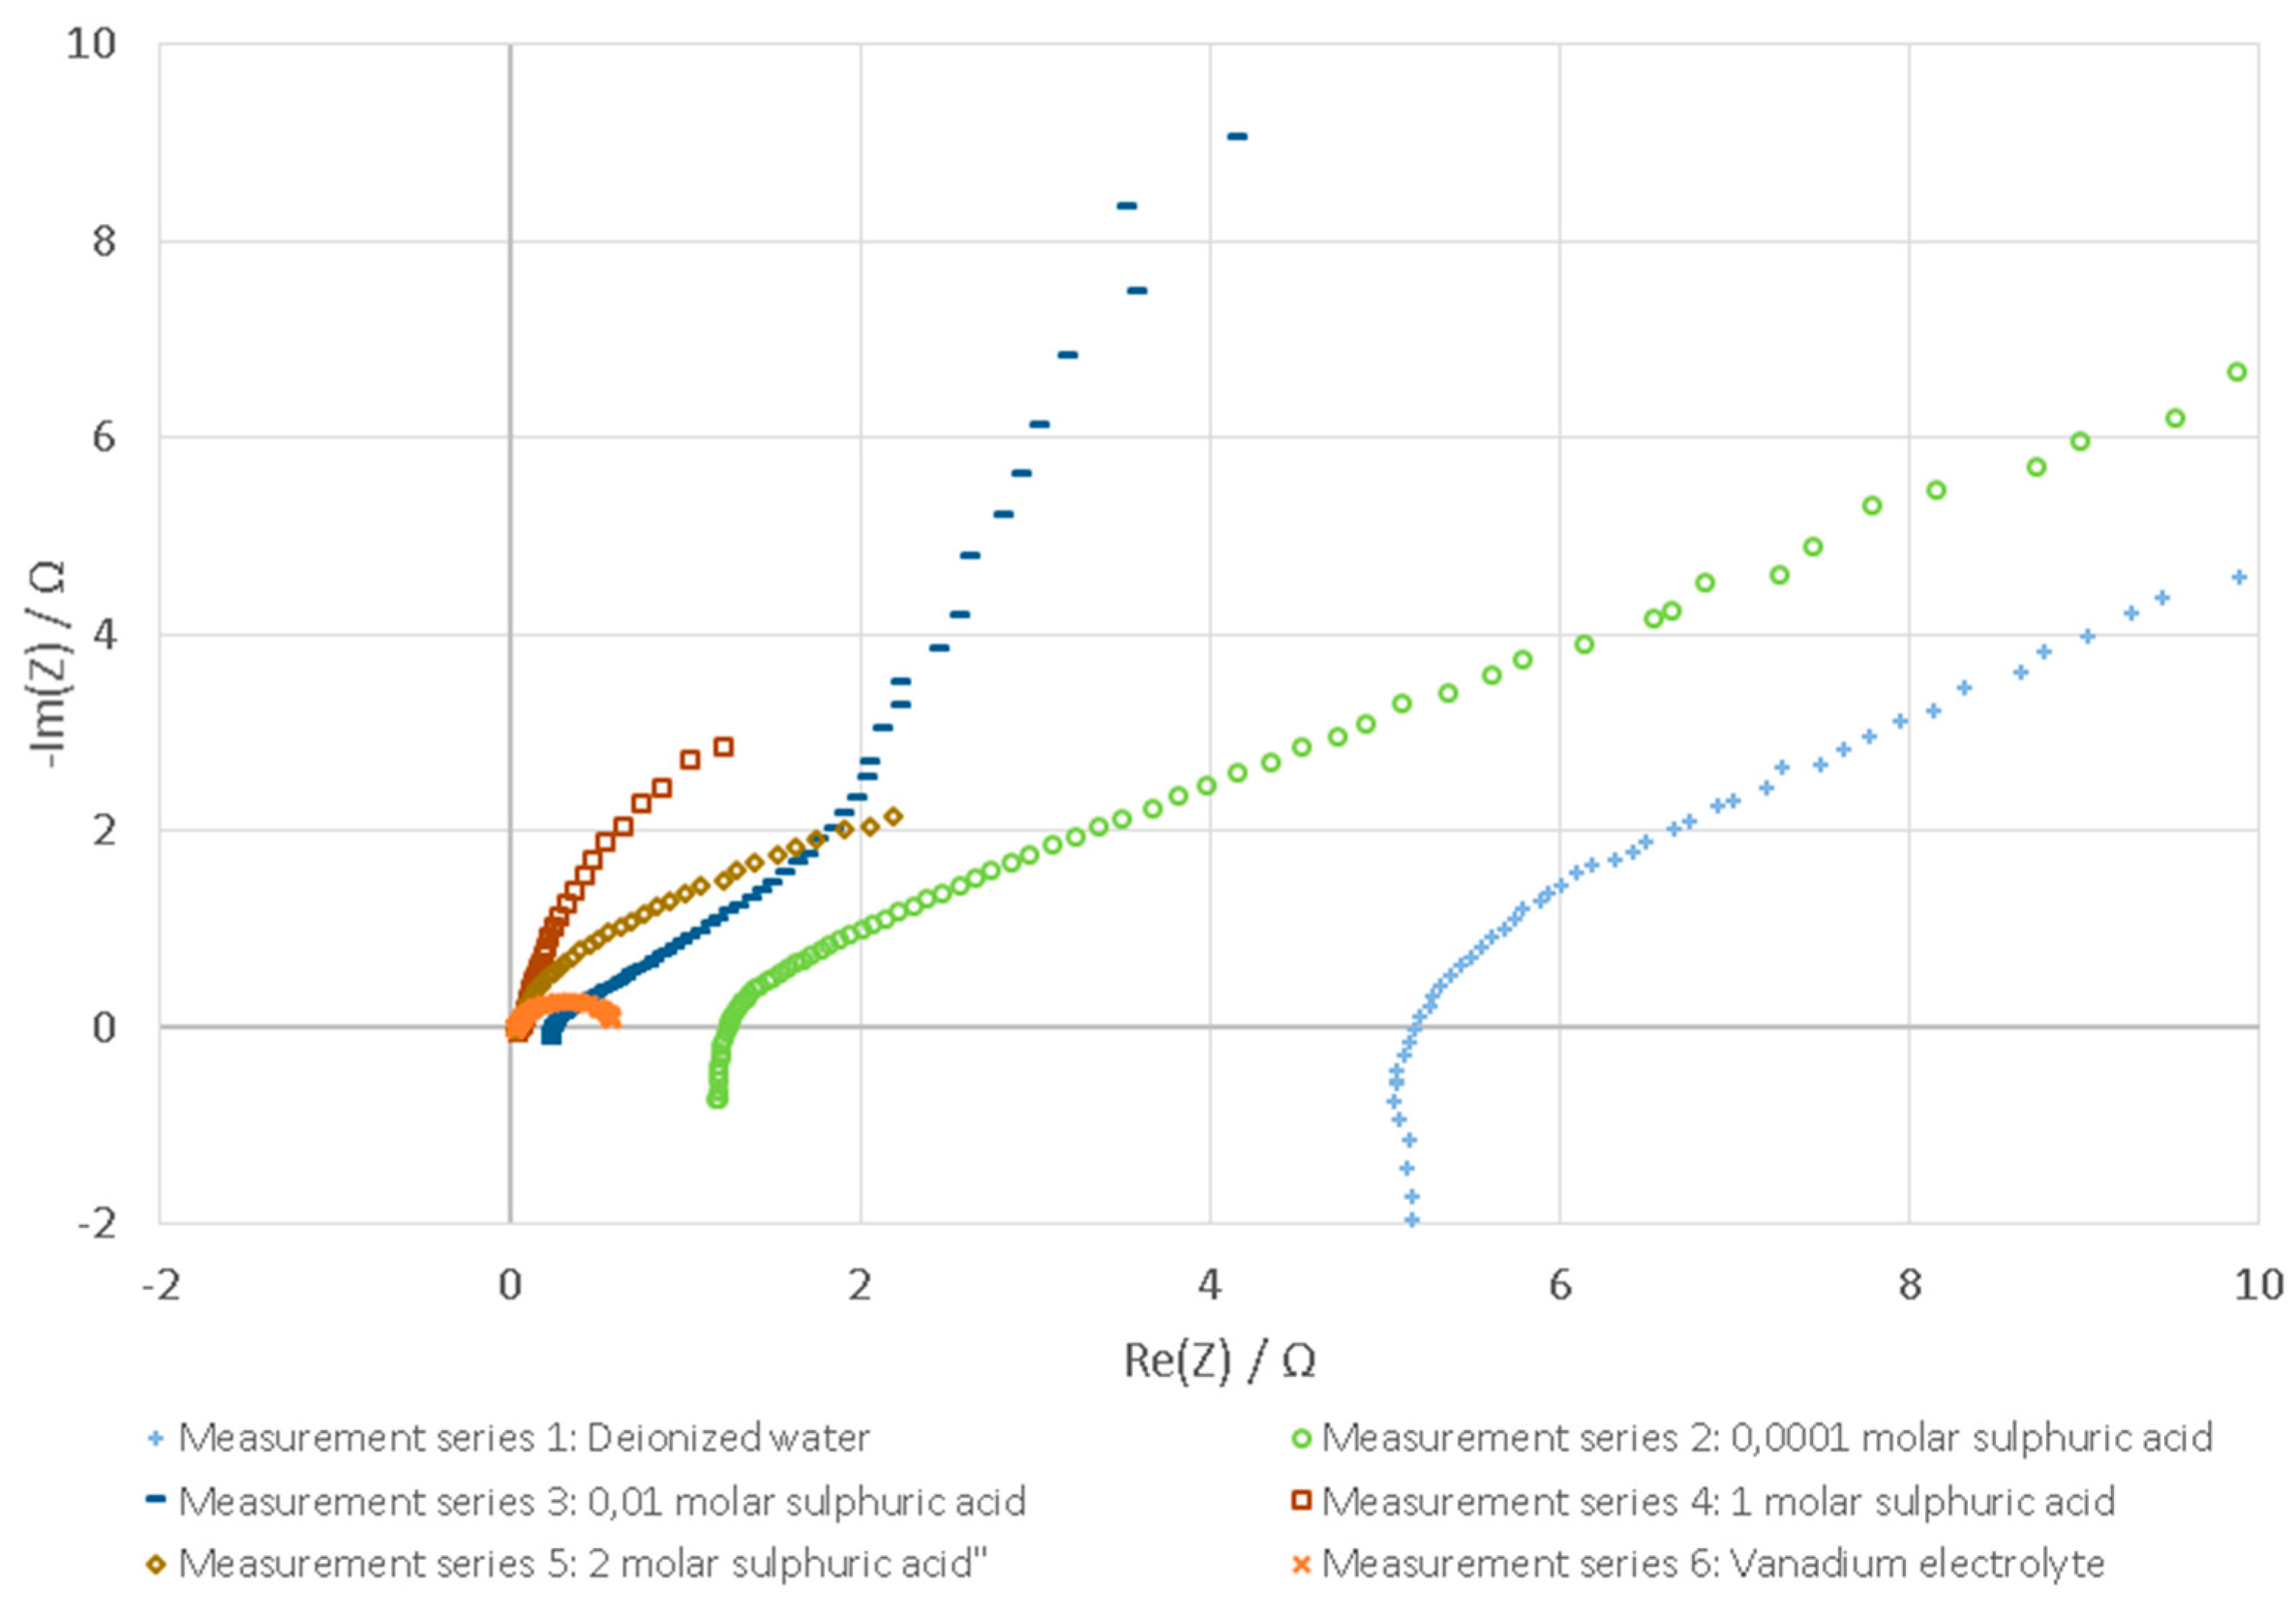
In the following section, the validation results for the tested fluids are shown (Section 3.1) and the results of the three analysis methods are shown and discussed (Section 3.2, Section 3.3 and Section 3.4).

3.1. Tested Fluids

In Figure 5, the Nyquist plots for different tested fluids in a battery with one cell and an electrode surface of 64 cm2 are shown. The curves of the six measurement series vary widely. The shape of the Nyquist plot of the vanadium electrolyte (measurement series 6) is a circular arc. All the other graphs have linear parts, and, as expected, the internal resistance (the point in the graph that intersects the imaginary axis) decreases with decreasing conductivity of the tested fluid.
A qualitative evaluation of the different fluids for testing the new and damaged batteries is based on three criteria: hazard potential, distinguishability, and repeatability. The results are shown in Table 1.
The hazard potential of the vanadium electrolyte is very high. One and two molar sulphuric acids is very toxic and therefore marked as critical. The hazard potential of the other tested fluids is rated as low.
The electrochemical measurements of 0.0001 molar sulphuric acid, deionized water, and air are not repeatable and not distinguishable and therefore are labelled in yellow and red.
The conditions hazard potential, repeatability, and distinguishability are fulfilled with 0.01 molar sulphuric acid with a sinusoidal excitation voltage of 0.5 VDC best. The measurements are repeatable and highly distinguishable, and the hazard potential is low.

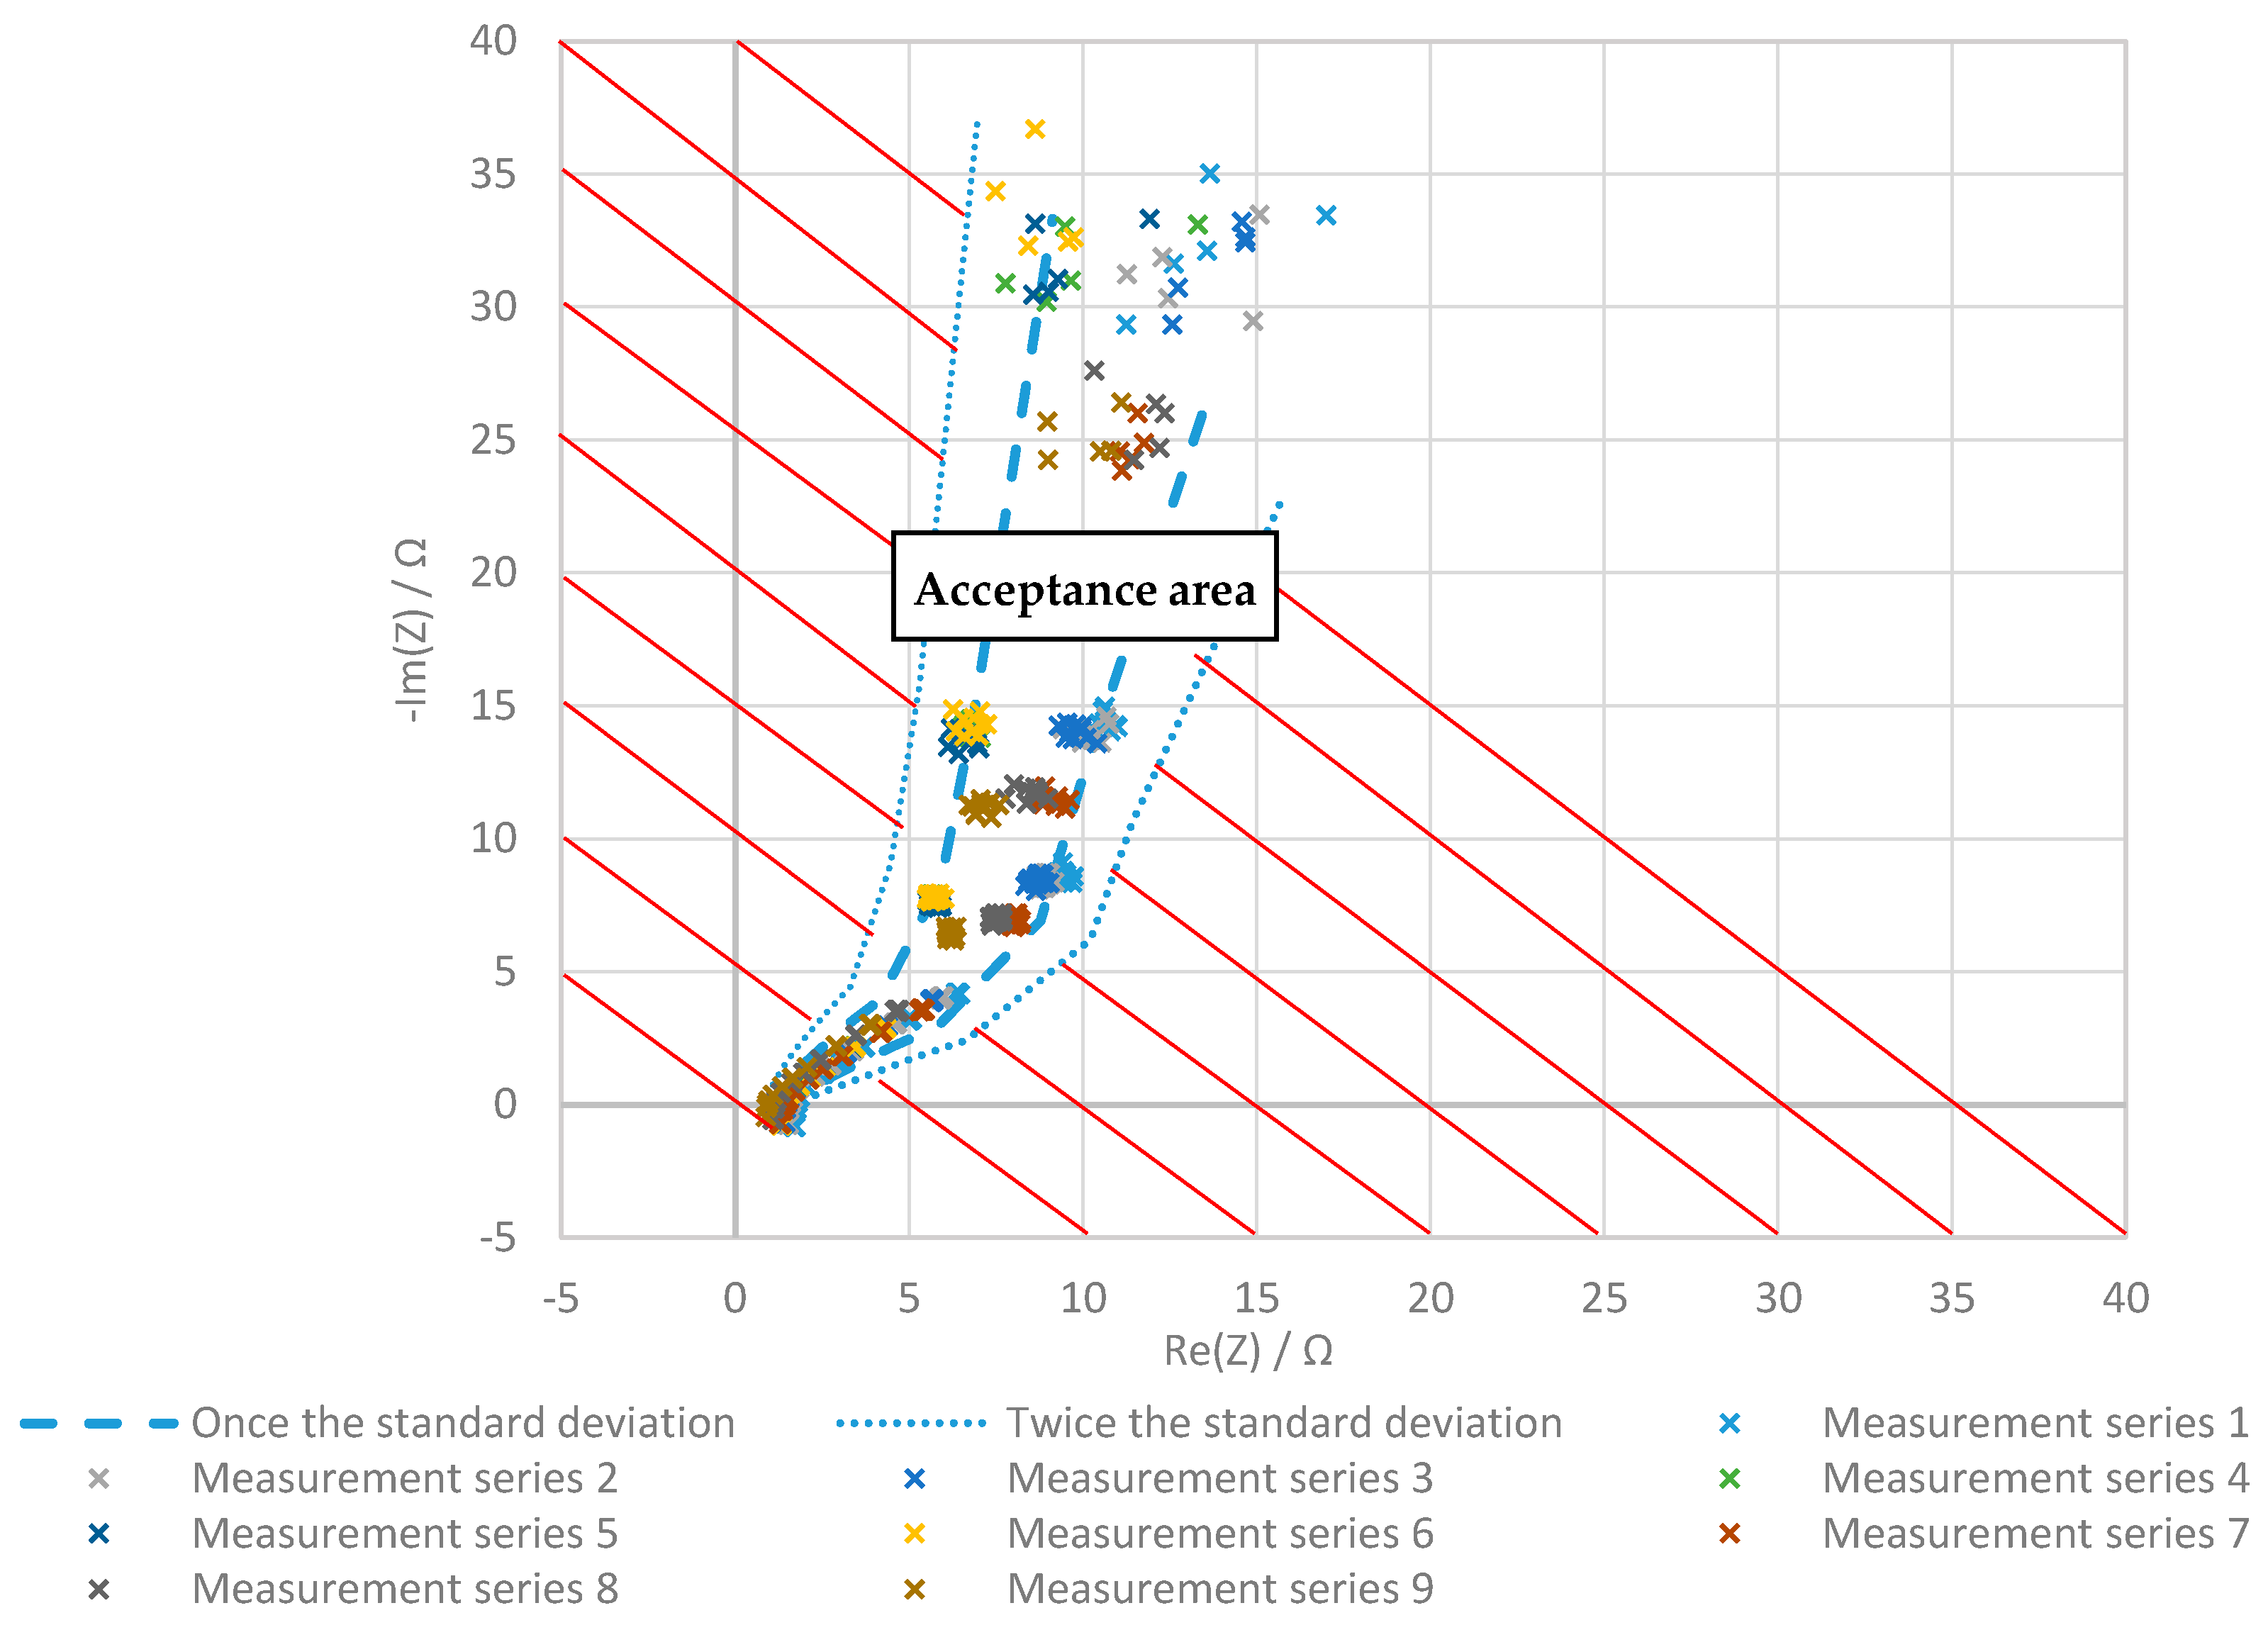
3.2. Evaluation with Nyquist Plot

In Figure 6, the Nyquist plots of the error-free battery (with acceptance area) and the mean values of four batteries with different errors are shown.
In Figure 6a, the Nyquist plot for the batteries with one cell and a surface of 64 cm2 is plotted. Except for the batteries with error A3 (“Six felts on the same half-cell”), the shape of the manipulated batteries is similar to the boundaries of the error-free reference battery. However, all of them deviate from the acceptance area. Especially, the internal resistance of most of the batteries is higher. The internal resistance of the battery with error A3 is six times higher compared to the error-free battery.
In Figure 6b, the results of the battery A5 is shown. The mean value of the defect battery deviates a lot. None of the measured values is inside the accepted area. This can be explained with the ionic and electrical insulation of the plastic foil.
The Nyquist plot evaluation of the battery “B” with a surface of 64 cm2 and two cells is plotted in Figure 6c. The mean value of the battery B3 with a “Bipolar plate instead of the membrane” and the measurement series B5 are similar and parallel outside to the left boarder of the accepted area. The mean values of the battery C6 (“No felts in one of the half cells”) have a bigger internal resistance and deviate from the error-free battery as well. The measurement results of the remaining three batteries are inside the accepted area of the reference battery.
The Nyquist plot of the battery C with two cells and an electrode surface of 493 cm2 is shown in plot 6d. All the mean values of the measured defect battery deviate from the error-free battery.

3.3. Evaluation with Bode Plot

In Figure 7, the acceptance area (double standard deviation) of the error-free battery and the mean values of the defect batteries are plotted in the Bode plot.
In all the measurement series of the battery with a surface of 64 cm2 and one cell (Figure 7a—Battery A), at least one of the calculated mean values deviates from the reference battery, especially the values of the battery with error 3 (“Six felts in one of the two half cells”). Most of the measured phase shifts and impedances of the batteries with the error 1 (“Increased current collector resistance”) and the one with error A2 (“Only two felts in one of the half-cell”) are outside the acceptance area. The calculated mean values of the battery with error A4 (“Hole in the membrane”) deviate only for small frequencies from the acceptance area.
All the values of the manipulated Battery A with the error A5 (“Plastic foil instead of the membrane” in Figure 7b) deviate from the reference battery.
The Bode analysis of the battery with two cells and an electrode surface of 64 cm2 (Battery B) is shown in Figure 7c. Most of the mean values of the phase shifts of the manipulated batteries, except the values for the batteries with error B6 (“No felts in one of the half-cell”) and the battery error B4 (“With three membranes”), are inside the accepted area, Which is in contrast to the Bode plot with the plotted impedances, in which most of the measurement series deviate from the error-free battery. Especially, the values of the batteries with the error B2 (“Only two felts in one of the two half cells”), error B3 (“Bipolar plate instead of the membrane”), and error B5 (“Missing membrane in one of the half cells”) deviate strongly.
The deviation for the battery B4 (“With three membranes”) can be detected in the phase shift diagram better. The values of the battery with error B1 (“Not plated bipolar plates”) are mostly inside the accepted area.
As can be seen in Figure 7d, all the measured phase shifts of the defect battery C1 are inside the acceptance area, while all the values of the impedance are outside the area.
Using the data of the Bode plot, the deviation of the defect batteries can also be evaluated with an analytical method. It is calculated which percentage of the mean values of the damaged batteries are outside the accepted area of the reference cell. The results are shown in Table 2.
Not all measured values of the reference cells (batteries A, B, and C) are inside the acceptance area. 0.4% of the phase shift values and about 2% of the impedance values are outside the accepted area. For the batteries B and C, the mean value of the error-free batterie deviates less.
The deviations of the manipulated batteries with one cell and a cell surface of 64 cm2 (battery A), except the test series with error A4 (“Hole in the membrane”), are much higher than 50%. In some of the series of tests, almost all the measured values are outside the acceptance area. The deviations of the battery B with two cells and a surface of 64 cm2 (except the test series B1 (“Increased current collector resistance”)) are comparably high. Especially noticeable is the test series error B5 (“Missing membrane in one of the half cells”), error B3 (‘’Bipolar plate instead of the membrane”), and error B6 (“No felts in one of the half cells”), for which the impedance deviates by 100%.
As shown in Figure 7, all impedance values of the manipulated battery C1 with two cells and a surface of 493 cm2 are outside the acceptance area of the error-free battery.

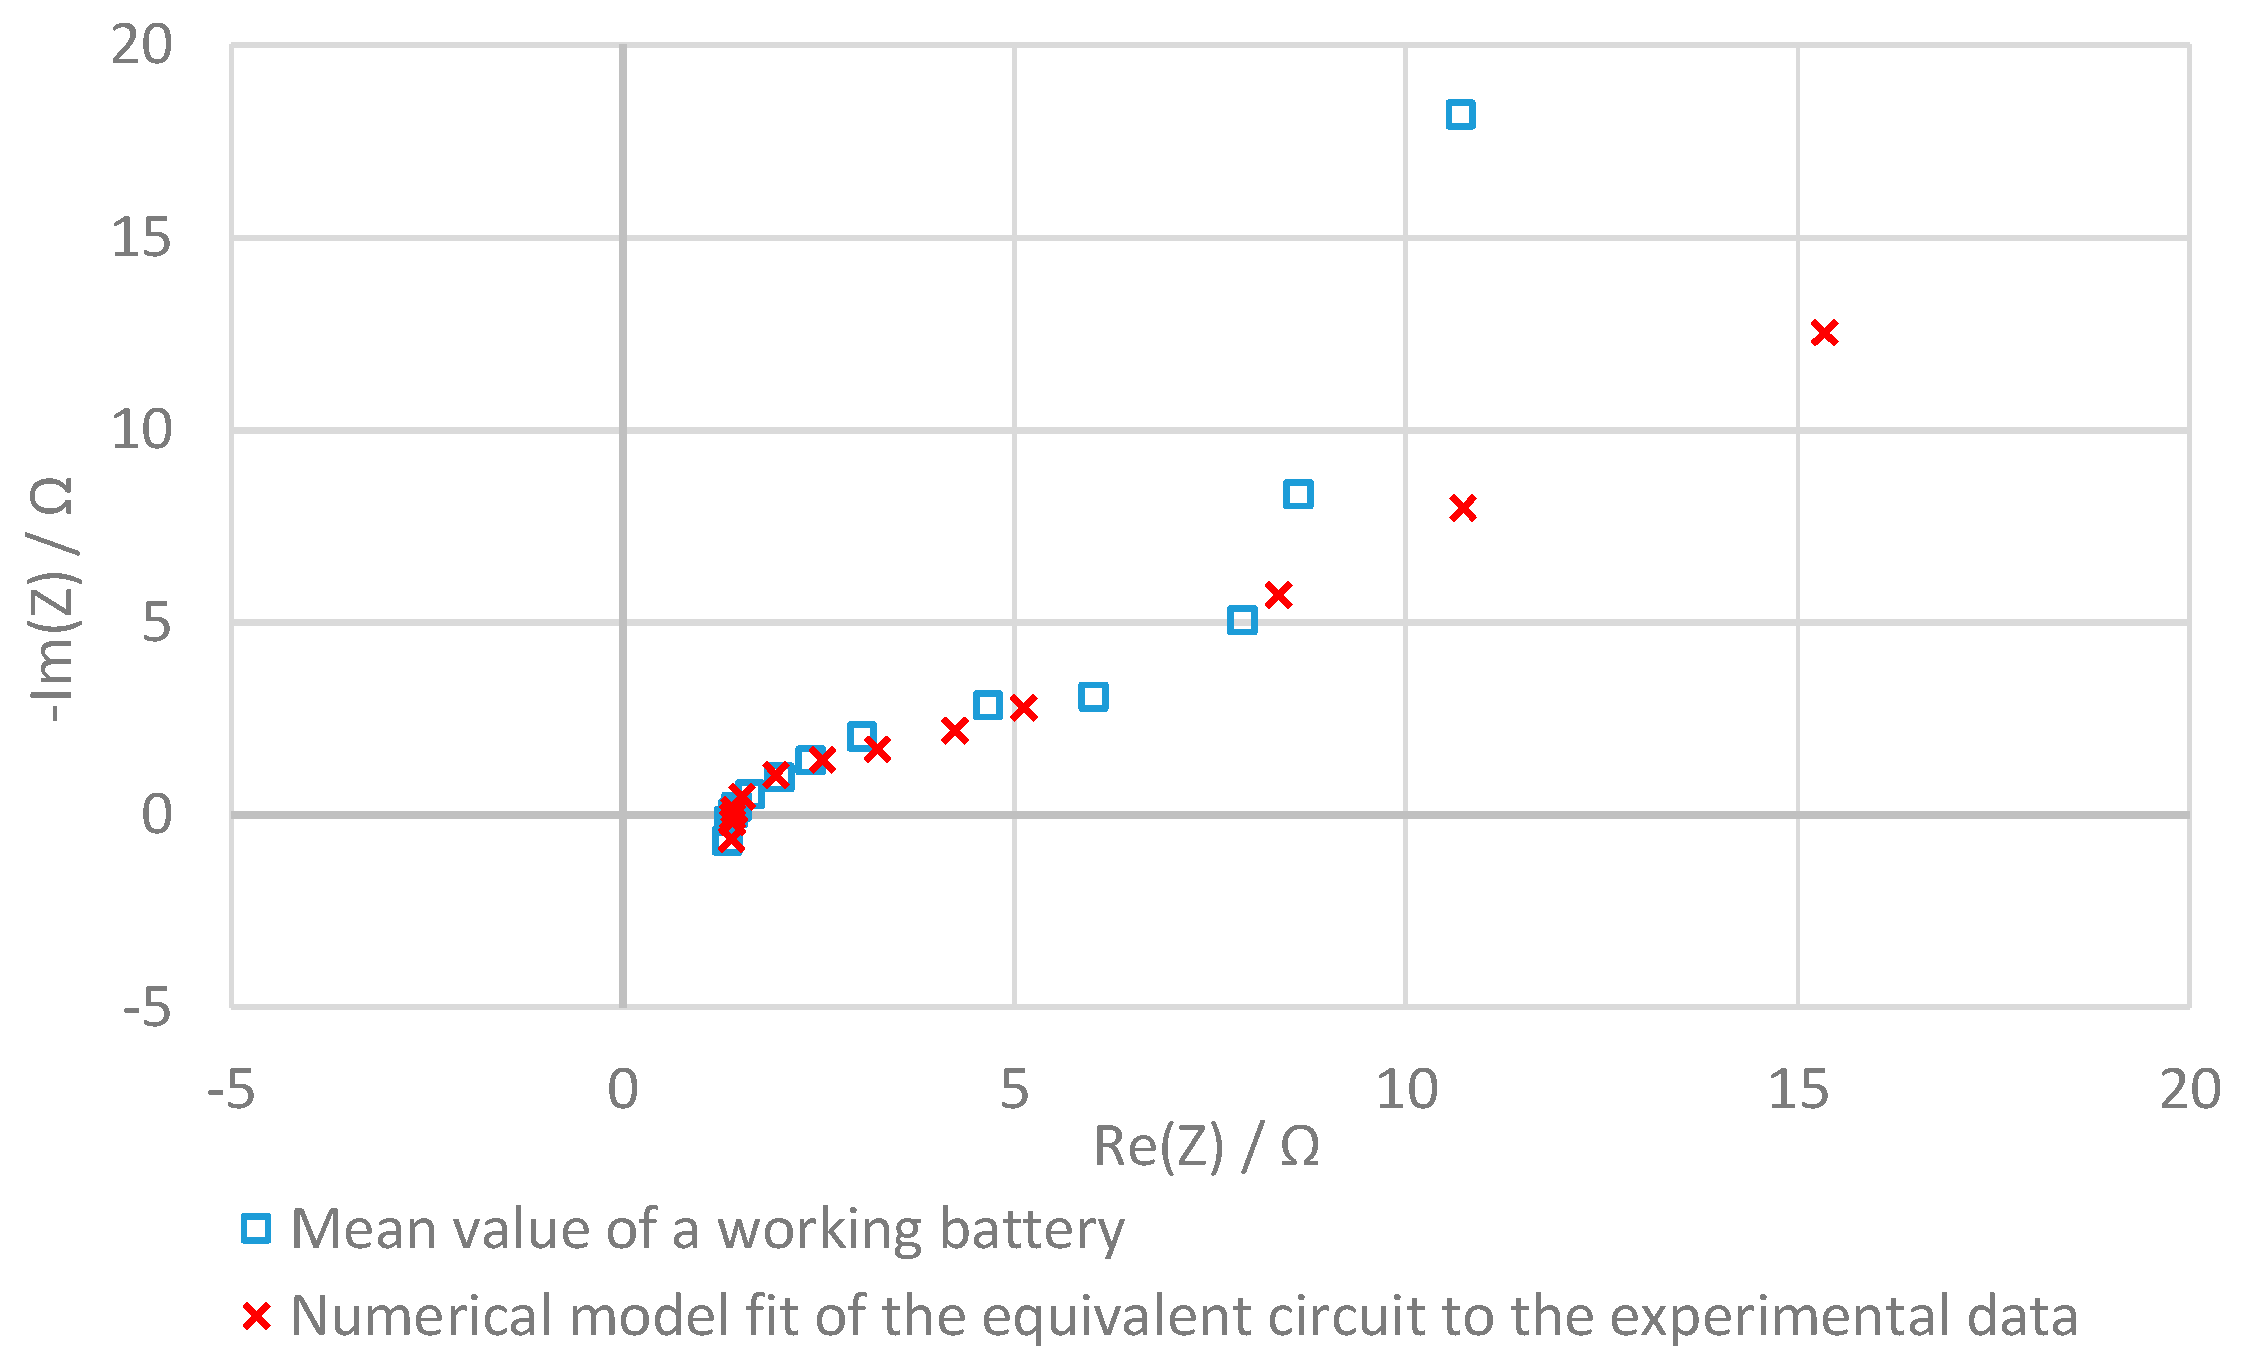
3.4. Evaluation with the Equivalent Circuit

By calculating the components (L, RE, RD, Zw, and CD) of the equivalent circuit (shown in Figure 4) of the error-free and the defect batteries and comparing them, defect batteries can be detected.
Firstly, the values for the lower and upper boundary of the accepted areas of the error-free batteries are calculated numerically. A fit of a measurement series is shown in Figure 8. The graph of the numerical model is a good fit, especially for low frequencies. Subsequently, the values for the components for the damaged batteries are calculated. It is checked whether these are between the values of the error-free battery.
The results of these evaluations are shown in Table 3. The numerical calculated values for every component of the defect battery that deviate significantly from the error-free battery are marked in red. If the values of the defect batteries are within the range of values corresponding to the error-free battery, they are marked in green.
The parameter R2 influences the course of the fit in a limited way. A change of this parameter does not have a big impact on the shape of the fit and should be considered with care. The parameter L1, which describes the inductive part in the Nyquist plot, should also not be overrated, because of its low informative value concerning the functionality about the battery. The other three parameters have a big impact on the course of the fit.
In most of the measurement series, at least two parameters deviate from the reference measurement. In five measurement rows, all the parameters of the defect battery are different to the functional battery.

4. Assessment of the Results

With all three analysis methods, the implemented errors in the batteries are detectable. The analysis method using Nyquist plots is not as informative as the other analysis methods, because measurements are not compared at the same frequency. This leaves room for coincidental agreement. With the other two methods, it was unequivocally demonstrated that errors can be detected, as the measured impedances deviate significantly from the error-free battery.

5. Conclusions

This research paper aims at simplifying the validation of redox flow batteries’ functionality by conducting electrochemical impedance spectroscopy tests on redox flow batteries. This work also provides the first impedance analysis of full-size stacks and adds to existing scientific literature, which up to now has exclusively discussed impedance measurements on single cells with small electrode surfaces. This work demonstrates the use of electrochemical impedance spectroscopy with larger sized electrodes, multiple cells, and different fluids. It finds that 0.01 molar sulphuric acid delivers repeatable results and is therefore appropriate for detecting damaged batteries by EIS. Using this non-toxic and non-aggressive fluid is an important simplification for a cheaper and faster quality-control, demonstrating the functionality of the batteries. This error detection capability was shown by manipulating cells and demonstrating that subsequent EIS measurements differ from a defined acceptance.
Three analysis methods were presented to identify different errors. Firstly, (1) a comparison of the Nyquist plots; secondly, (2) a comparison of the Bode plots; and thirdly, (3) a comparison of the calculated characteristic values of the equivalent circuits. The analysis found that all methods are in principle suited to detect errors in the batteries in a short time and without measuring the current–voltage characteristic with the electrolyte. However, methods (2) and (3) are preferred, as the identification of defective batteries is improved due to a more significant comparison between measurements.

Author Contributions

D.M. designed and performed the experiments and wrote the paper. All authors discussed and analyzed the experiments and the data.

Funding

This research received no external funding

Conflicts of Interest

The authors declare no conflict of interest.

References

  1. Roberts, B.P.; Sandberg, C. The Role of Energy Storage in Development of Smart Grids. Proc. IEEE 2011, 99, 1139–1144. [Google Scholar] [CrossRef]
  2. Parasuraman, A.; Lim, T.M.; Menictas, C.; Skyllas-Kazacos, M. Review of material research and development for vanadium redox flow battery applications. Electrochim. Acta 2013, 101, 27–40. [Google Scholar] [CrossRef]
  3. Soloveichik, G.L. Flow Batteries: Current Status and Trends. Chem. Rev. 2015, 115, 11533–11558. [Google Scholar] [CrossRef] [PubMed]
  4. Alotto, P.; Guarnieri, M.; Moro, F. Redox flow batteries for the storage of renewable energy: A review. Renew. Sustain. Energy Rev. 2014, 29, 325–335. [Google Scholar] [CrossRef]
  5. Skyllas-Kazacos, M.; Kazacos, M. State of charge monitoring methods for vanadium redox flow battery control. J. Power Sources 2011, 196, 8822–8827. [Google Scholar] [CrossRef]
  6. Chakrabarti, M.H.; Brandon, N.P.; Hajimolana, S.A.; Tariq, F.; Yufit, V.; Hashim, M.A.; Hussain, M.A.; Low, C.T.J.; Aravind, P.V. Application of carbon materials in redox flow batteries. J. Power Sources 2014, 253, 150–166. [Google Scholar] [CrossRef]
  7. Weber, A.Z.; Mench, M.M.; Meyers, J.P.; Ross, P.N.; Gostick, J.T.; Liu, Q. Redox flow batteries: A review. J. Appl. Electrochem. 2011, 41, 1137. [Google Scholar] [CrossRef]
  8. Blanke, H.; Bohlen, O.; Buller, S.; de Doncker, R.W.; Fricke, B.; Hammouche, A.; Linzen, D.; Thele, M.; Sauer, D.U. Impedance measurements on lead–acid batteries for state-of-charge, state-of-health and cranking capability prognosis in electric and hybrid electric vehicles. J. Power Sources 2005, 144, 418–425. [Google Scholar] [CrossRef]
  9. Lambert, S.M.; Armstrong, M.; Attidekou, P.S.; Christensen, P.A.; Widmer, J.D.; Wang, C.; Scott, K. Rapid Nondestructive-Testing Technique for In-Line Quality Control of Li-Ion Batteries. IEEE Trans. Ind. Electron. 2017, 64, 4017–4026. [Google Scholar] [CrossRef]
  10. Repp, S.; Harputlu, E.; Gurgen, S.; Castellano, M.; Kremer, N.; Pompe, N.; Wörner, J.; Hoffmann, A.; Thomann, R.; Emen, F.M.; et al. Synergetic effects of Fe3+ doped spinel Li4Ti5 O12 nanoparticles on reduced graphene oxide for high surface electrode hybrid supercapacitors. Nanoscale 2018, 10, 1877–1884. [Google Scholar] [CrossRef] [PubMed]
  11. Kurzweil, P.; Shamonin, M. State-of-Charge Monitoring by Impedance Spectroscopy during Long-Term Self-Discharge of Supercapacitors and Lithium-Ion Batteries. Batteries 2018, 4, 35. [Google Scholar] [CrossRef]
  12. Genc, R.; Alas, M.O.; Harputlu, E.; Repp, S.; Kremer, N.; Castellano, M.; Colak, S.G.; Ocakoglu, K.; Erdem, E. High-capacitance hybrid supercapacitor based on multi-colored fluorescent carbon-dots. Sci. Rep. 2017, 7, 11222. [Google Scholar] [CrossRef] [PubMed]
  13. Rammelt, U.; Reinhard, G. Anwendung der elektrochemischen Impedanzspektroskopie (EIS) zur Beurteilung der Lochkorrosion und ihrer Inhibition. Mater. Corros. 1990, 41, 391–395. [Google Scholar] [CrossRef]
  14. Sun, C.-N.; Delnick, F.M.; Aaron, D.S.; Papandrew, A.B.; Mench, M.M.; Zawodzinski, T.A. Probing Electrode Losses in All-Vanadium Redox Flow Batteries with Impedance Spectroscopy. ECS Electrochem. Lett. 2013, 2, A43–A45. [Google Scholar] [CrossRef]
  15. Derr, I.; Przyrembel, D.; Schweer, J.; Fetyan, A.; Langner, J.; Melke, J.; Weinelt, M.; Roth, C. Electroless chemical aging of carbon felt electrodes for the all-vanadium redox flow battery (VRFB) investigated by Electrochemical Impedance and X-ray Photoelectron Spectroscopy. Electrochim. Acta 2017, 246, 783–793. [Google Scholar] [CrossRef]
  16. Sun, C.-N.; Delnick, F.M.; Aaron, D.S.; Papandrew, A.B.; Mench, M.M.; Zawodzinski, T.A. Resolving Losses at the Negative Electrode in All-Vanadium Redox Flow Batteries Using Electrochemical Impedance Spectroscopy. J. Electrochem. Soc. 2014, 161, A981–A988. [Google Scholar] [CrossRef]
  17. SGL Group (2017). Available online: https://www.sglgroup.com/cms/international/products/product-groups/cfrc_felt/specialty-graphites-for-energy-storage/redox-flow-batteries.html?__locale=en (accessed on 5 November 2018).
  18. Manka, D. Elektrochemisch-Optische Impedanzspektroskopie; KIT Scientific Publishing: Karlsruhe, Germany, 2016. [Google Scholar]
  19. Dassisti, M.; Cozzolino, G.; Chimienti, M.; Rizzuti, A.; Mastrorilli, P.; L’Abbate, P. Sustainability of vanadium redox-flow batteries: Benchmarking electrolyte synthesis procedures. Int. J. Hydrog. Energy 2016, 41, 16477–16488. [Google Scholar] [CrossRef]
  20. Pezeshki, A.M.; Sacci, R.L.; Delnick, F.M.; Aaron, D.S.; Mench, M.M. Elucidating effects of cell architecture, electrode material, and solution composition on overpotentials in redox flow batteries. Electrochim. Acta 2017, 229, 261–270. [Google Scholar] [CrossRef]
  21. Pezeshki, A.M.; Clement, J.T.; Veith, G.M.; Zawodzinski, T.A.; Mench, M.M. High performance electrodes in vanadium redox flow batteries through oxygen-enriched thermal activation. J. Power Sources 2015, 294, 333–338. [Google Scholar] [CrossRef] [Green Version]
  22. Zago, M.; Casalegno, A. Physically-based impedance modeling of the negative electrode in All-Vanadium Redox Flow Batteries: Insight into mass transport issues. Electrochim. Acta 2017, 248, 505–517. [Google Scholar] [CrossRef]
  23. Mielke, W. Modellierung von Kennlinien, Impedanzspektren und thermischem Verhalten einer Lithium-Eisenphosphat-Batterie. Master’s Thesis, Universität Stuttgart, Stuttgart, Germany, 2011. [Google Scholar]
Figure 1. Schematic of the set-up that has also been used by Sun et al. [14]. This set-up was used in this work for all experiments. The pump circulated the tank from the tank through the stack.
Batteries 04 00058 g001
Figure 2. Modular cell assembly with incoming and flowing out fluid in blue and red. 1: bipolar plate, 2: frame, 3: felt, and 4: membrane [17].
Batteries 04 00058 g002
Figure 3. Nyquist plot of the electrochemical impedance measurement with 0.01 molar sulphuric acid with a test cell (surface 64 cm2) and sinusoidal excitation voltage of 0.5 VAC. Nine test rows are conducted. The single and the double standard deviation are shown. Twice the standard deviation is defined as the accepted area.
Batteries 04 00058 g003
Figure 4. Typical equivalent circuit for electrochemical storages with Warburg element.
Batteries 04 00058 g004
Figure 5. Nyquist plots: test in a battery with one cell and 64 cm2 electrode surface with different test fluids at room temperature with a 0.5 VAC for the measurement series 1–5 and 0.08 VAC for the vanadium electrolyte.
Batteries 04 00058 g005
Figure 6. Comparison of the Nyquist plots of the electrochemical impedance measurements of the error-free battery (double standard deviation/accepted area) with the mean values of the defect batteries. Different batteries were measured with 0.01 molar sulphuric acid. (a) Batteries A1–A4: one cell with an electrode surface of 64 cm2; (b) battery A5: one cell with an electrode surface of 64 cm2; (c) batteries B1–B5: two cells with an electrode surface of 64 cm2; (d) battery C1: two cells with an electrode surface of 493 cm2.
Batteries 04 00058 g006
Figure 7. Comparison of the Bode plots of the electrochemical impedance measurements of the error-free battery (double standard deviation/accepted area) with the mean values of the defect batteries. Different batteries were measured with 0.01 molar sulphuric acid. (a) Batteries A1–4: one cell with an electrode surface of 64 cm2; (b) battery A5: one cell with an electrode surface of 64 cm2; (c) batteries B1–6: two cells with an electrode surface of 64 cm2; (d) battery C1: two cells with an electrode surface of 493 cm2.
Batteries 04 00058 g007aBatteries 04 00058 g007b
Figure 8. Results of the numerical calculation of the equivalent circuit for an error-free battery in the Nyquist plot.
Batteries 04 00058 g008
Table 1. Evaluation of the tested fluids. Green means the used medium is highly suitable, yellow means the medium should be seen critical, and red means the medium does not fulfill the criteria.
MediumAmplitudeHazard PotentialRepeatabilityDistinguishability
Air0.5 VAC
Deionized water0.5 VAC
0.0001 molar sulphuric acid0.5 VAC
0.01 molar sulphuric acid0.5 VAC
1 molar sulphuric acid0.5 VAC
2 molar sulphuric acid0.5 VAC
Vanadium electrolyte0.08 VAC
Table 2. Evaluation of the Bode plot. The deviation of the damaged batteries from the accepted area in the Bode plot (Impedance and phase shift) are shown.
BatteryErrorValues Outside the Acceptance Area
Phase ShiftImpedance
Battery A
One cell,
64 cm2
Error-freeMean value of the error-free battery0.4%2%
Error A1Increased current collector resistance70%55%
Error A2Only two felts in one of the two half cells78%73%
Error A3All six felts in one of the two half cells92%99%
Error A4Hole in the membrane17%4%
Error A5Plastic foil instead of the membrane100%100%
Battery B
Two cells,
64 cm2
Error-freeMean value of the error-free battery0.4%0.9%
Error B1Increased current collector resistance6%5%
Error B2Only two felts in one of the half cells61%24%
Error B3Bipolar plate instead of the membrane32%100%
Error B4With three membranes33%13%
Error B5Missing membrane in one of the half cells21%100%
Error B6No felts in one of the half cells74%100%
Battery C
Two cells,
493 cm2
Error-freeMean value of the error-free battery0%4%
Error C1Damaged battery0%100%
Table 3. Results of the evaluation with the equivalent circuit described in Section 2.4.3. L stands for the inductance, R1 is the contact resistance, C2 stands for the double layer capacity, R2 for the charge transfer resistance, and W1 is the Warburg part. Meaning of the colors: red means that the calculated values of the equivalent circuit of the damaged battery deviate from the error-free battery and green that the values are inside the tolerance.
BatteryErrorL1R1C2R2W1
Battery A
One cell,
64 cm2
No ErrorMean value of the error-free battery
Error A1Increased current collector resistance
Error A2Only two felts in one of the two half cells
Error A3All six felts in one of the two half cells
Error A4Hole in the membrane
Error A5Plastic foil instead of the membrane
Battery B
Two cells,
64 cm2
No ErrorMean value of the error-free battery
Error B1Increased current collector resistance
Error B2Only two felts in one of the half cells
Error B3Bipolar plate instead of the membrane
Error B4With three membranes
Error B5Missing membrane in one of the half cells
Error B6No felts in one of the half cells
Battery C
Two cells,
493 cm2
No ErrorMean value of the error-free battery
Error C1Damaged battery

