1. Introduction
Lithium ion (Li-ion) battery sales into transportation sectors are forecast to grow from 18.5 GWh in 2015 to 40.3 GWh in 2020 [
1]. This has driven work into the investigation of the sustainability of producing electric vehicles (EVs), which contain embedded electrochemical energy storage systems (ESS). Circular economy principles have underpinned much of this research. Circular economy concepts champion any alternative framework to the traditional linear economic model (make, use, dispose) by maximising how long crucial resources are retained within the supply chain and extracting as much value as possible from them whilst in use before undertaking the process of restoring materials and products at the end of their useful service life [
2].
Circular economy strategies for EVs are underpinned by implicit assumptions about the state of health (SOH) of the ESS [
3,
4,
5]. This crucial battery diagnostic quantifies the ESS’s capability for energy storage power delivery capabilities compared to battery conditions when new [
6]. Since SOH is a function of multiple battery characteristics and does not correspond to one physical attribute, there is no widely accepted method within the literature as to how SOH should be quantified [
7,
8,
9,
10]. However, capacity and internal resistance are the dominant metrics used, since these capture the ESS’s capability to store energy and deliver power, respectively. Since capacity has been addressed previously [
11], this research focusses on internal resistance, which is more pertinent for hybrid electric vehicles (HEVs) where power is more important than available energy. In these applications, end of life (EOL) is commonly defined as being attained when the battery internal resistance has doubled [
12].
The performance of Li-ion batteries (LIB) is known to degrade during usage: crucial characteristics such as internal resistance and capacity deteriorate because of ageing mechanisms, such as the growth of the solid electrolyte interphase (SEI) [
13,
14,
15]. Increased internal resistance is detrimental because it limits the power that can be extracted from the cell and causes additional heat to be generated [
16]. It is crucial for the battery cooling system to extract the extra heat produced efficiently, since this phenomenon is in fact a positive feedback loop. It has already been shown that the ageing rate has a strong dependence with the cell temperature, and can be characterised by the Arrhenius equation [
17,
18,
19,
20]:
where
k is the rate constant,
T is the absolute temperature (Kelvin),
A is the pre-exponential factor,
Ea is the activation energy for the reaction (Joules·mol
−1), and
R is the universal gas constant. Operating cells at higher temperatures therefore results in accelerated ageing, i.e., reduced capacity and increased internal resistance, the latter causing an increase in heat production and accelerating ageing further. Eventually, the cells’ internal resistance will rise to a point where they will have to be replaced as the cells will no longer be able to meet the power demand for the application. The additional heat generation causes additional cooling requirements. Furthermore, if the cell temperature cannot be managed to an appropriate level, it may have catastrophic consequences such as thermal runaway [
21,
22,
23].
It has been argued that the battery management system (BMS) should monitor the battery SOH, and make the estimates available to all stakeholders within the supply chain via vehicle communication networks and standard diagnostic interfaces [
24,
25]. This would help to inform EOL strategy, and to facilitate the remanufacture, reuse, or repair of the battery system. However, reviewing commercially available EVs and HEVs highlights that this is not always the case: e.g., the Tesla vehicle BMS does not make battery SOH information available to third parties independent from the manufacturer. Consequently, to evaluate the Tesla battery degradation, it is necessary to remove the battery system from the vehicle and physically open the battery pack, which damages the mechanical structure of the sealed pack, in order to test each module’s capacity and internal resistance individually to quantify their SOH. This SOH estimation challenge is aggravated since it has been reported that vehicle batteries will be presented to the supply-chain with varying levels of functionality and unknown provenance [
26]. This therefore poses a challenge to stakeholders wishing to categorise used vehicle ESS for the most appropriate circular economy strategy, i.e., battery repair, reuse, remanufacturing, or materials recycling, in order to exploit the remaining value within the battery.
Lead acid batteries in conventional internal combustion engine (ICE) cars are required to power ancillaries and to crank the engine. A fast method to estimate cold cranking amps was devised by Champlin in 1975 [
27], and lead acid battery resistance is commonly estimated using the alternating current (AC) conductance method at 1 kHz. However, this method is not suitable for LIBs since they are used to power traction motors as opposed to starter motors. Starter motors require a large current for up to 30 s to crank the ICE. The lead acid battery is then charged by the alternator; consequently, it remains close to a full state of charge during usage, whereas the LIB will be required to deliver a wide range of currents for the duration of a drive cycle, utilising a much larger state of charge (SOC) window. There are currently no established rapid methods for measuring a representative resistance for LIBs. In addition, accelerated energy capacity measurements of Li-ion cells have already been highlighted as being important to support future circular economy strategies for EVs [
11]. It is equally imperative to investigate internal resistance, since it is the crucial cell property for determining available power, energy efficiency, and heat generation. There are international standards and best-practice guides available for both EV and HEV battery systems that describe the performance evaluation requirements. These cover different domain requirements for safety, performance, and robustness, and they address how testing should be carried out at either a system [
28] or a cell level [
29,
30]. Within the context of this research, and in order to align with the requirements to improve the power capability estimation to assess battery SOH, particular focus is given to the recommended procedures for cell-level internal resistance measurements. Regardless of the test standard utilised, commonly, the test duration can be excessively time consuming, in particular when taking into account the time required for the cell to equilibrate electrochemically and thermally after a change in the state of charge (SOC) or ambient temperature. Consequently, the authors contend that these testing protocols are potentially prohibitive for specialist energy storage suppliers and vehicle manufacturers desiring to grade or sort used vehicle battery systems in order to determine the most appropriate circular economy strategy. In order to reduce the EOL test time for an EV LIB, it is desirable to measure internal resistance more rapidly than current standards whilst maintaining accuracy within expected measurement error.
The aim of this research is to investigate whether internal resistance measurements can be accelerated, as reducing the experiment duration may facilitate further EOL options for the EV and HEV battery systems used. Depending on the internal resistance, the EOL options include: remanufacturing, reuse within a grid storage application, and materials recycling. Furthermore, this research intends to quantify the trade-off relationship between experiment time and accuracy, in order to facilitate an optimal stakeholder evaluation strategy.
A detailed analysis of the different EOL strategies for automotive battery systems is discussed in [
11] and is not repeated here. This paper is structured as follows:
Section 2 contains a literature review on the topic of internal resistance assessment from the perspective of international standards. The cell selection and experimental method is described in
Section 3. The experimental results are shown in
Section 4 and discussed in
Section 5. Finally, the main conclusions from the research are summarised
Section 6.
2. Measuring Internal Resistance
The internal resistance of Li-ion cells is not only the essential cell property for determining available power, but also for energy efficiency and heat calculations, since ohmic heating is the overriding heat generation mechanism in high power Li-ion cells [
31,
32,
33,
34,
35]. As a result, precise measurement of this cell characteristic is crucial for LIB SOH estimation at EOL.
However, this is a non-trivial research problem, as LIBs are not pure ohmic devices; they are complex electrochemical devices that exhibit capacitive and inductive behaviour. Consequently, LIBs will perform differently when excited at different input signal frequencies. It is crucial to ensure that the measurement frequency is sufficiently high so that the battery’s capacitive behaviour does not distort the test results, whilst ensuring that it is also appropriately low so that the battery’s inductance does not affect the measurements.
LIBs are non-linear systems, since the internal resistance of the Li-ion cells depends significantly on variables, such as the operating temperature, state of charge (SOC), the current rate, and the settling time [
36,
37,
38]. Settling time refers to the time that is taken for a Li-ion cell to reach its thermal and electrochemical equilibrium after a charge or discharge event. In addition, LIB parameters, such as internal resistance and capacity, are time variant, since these degrade over time due to ageing [
13,
14,
15]. It is therefore inherently complex to measure LIBs’ internal resistance, and sophisticated measurement procedures are required.
Whilst numerous methods for measuring internal resistance have been reported in the literature, direct wave (DC) pulse [
39,
40] and AC electrochemical impedance spectroscopy (EIS) [
16,
36] are the prevalent techniques that are used for LIB internal resistance characterisation. A novel application of multisine signals [
41,
42] has also recently been developed to quantify the dynamic behaviour of LIBs. Multisine excitations are frequently utilised in system identification to quantify the frequency response of nonlinear systems, and they have not been applied to LIBs until recently [
43]. A new procedure known as pulse-multisine (PM) has been developed [
42] that combines a multisine and a pulse signal, and it has similarities with the DC pulse power method. However, instead of dividing the overpotential at a fixed time point by the magnitude of the current pulse to obtain the internal resistance of the cell, an equivalent circuit model (ECM) is fitted to the whole response. ECMs are a relatively simple lumped parameter model ubiquitous in estimation algorithms for describing LIB electrochemical behaviour in real time [
44,
45,
46,
47]. Whilst this does increase the measurement calculation complexity, it improves the measurement accuracy [
42]. Performing a least squares fit to the whole voltage response is also more robust than a simple division of two measurements.
The other main difference of the PM approach compared with the DC pulse power method is that instead of using a 10 s constant current pulse to estimate the internal resistance, the battery is excited with a more dynamic current signal, both in terms of amplitude and frequency [
41,
42]. This PM signal is a periodic signal that is generated by summing sinusoids, providing the researcher with the flexibility to alter the amplitude spectrum and harmonic content. In terms of the frequency spectrum, the signal provides a more representative estimate data set than a DC pulse, i.e., during operation, the automotive battery drive cycle demands are not simple square pulses, but continuous signals containing a range of frequencies. In addition to improving the model accuracy over the desired frequency spectrum, this characterisation approach covers a wide current range during a short excitation signal, allowing a broad and more representative range to be characterised.
Method Selection and Discussion
Other techniques such as energy methods and calorimeter based methods are rarely used, as they are time consuming and do not offer any improved accuracy. For a more detailed review of methods for determining internal resistance, see [
48,
49].
As discussed previously, it is important to characterise internal resistance at EOL. Whilst using EIS to determine cell impedance (i.e., resistance plus reactance) is more sophisticated than a pulse, and it provides detailed impedance estimations over a wide range of frequencies, it suffers from complex experimentation and difficulties in relating the AC impedance values to DC resistances. It is therefore generally the preferred method for diagnostics and the investigation of electrochemical phenomena. On the other hand, the current pulse method is considerably easier to implement and is more characteristic of the signals that the LIBs actually experience during operation in EVs. A recent investigation has shown that LIBs require 4 h relaxation times before undertaking EIS, in order to obtain accurate measurements [
50], whereas the standards only stipulate a 1 h wait before applying DC pulses [
39]. Consequently, current pulses are often used over EIS to characterise LIBs, since they are faster and more convenient [
51].
The Idaho National Laboratory (INL) 2010 standard [
39] calculates the direct current resistance with a 10 s overvoltage. A commonly used approach that many researchers use, however, involves the measurement of direct current resistance using different set time points; typically 2, 10, and 18 s, based on VDA procedures (Verband der Automobilindustrie, Frankfurt am Main, Germany) [
40]. This is not widely accepted; for example, in [
52], the authors fit a straight line to the 5–10 s part of the voltage response and extrapolated back to the start of the pulse and propose this value is closer to EIS measurements. In any case, the use of 10 pulses is widely employed in many standards (such as [
29,
30]); consequently, if a 30 minutes rest time is implemented in between pulses, this equates to a 272 min signal. In contrast, a five minute pulse-multisine (PM) signal has been utilised to characterise an 18,650 cell [
42], saving significant amounts of characterisation time whilst improving accuracy, compared to the same ECM characterised with DC pulses.
Whilst the PM signal method has been shown to be faster and more accurate, it is more complex and it is the least established method, and there are no published standards for its application. Therefore, DC pulse measurements are also performed for benchmark comparison. The preconditioning before each method is also accelerated in order to establish whether further time savings are attainable.
3. Experimental Method
In order to assess the feasibility of reducing the test time associated with the internal resistance measurements, the new PM approach was compared to the DC pulse method. For the DC pulse, the cells were tested using the Hybrid Pulse Power Characterisation (HPPC) method defined in IEC-62660 [
29], which includes long preconditioning sequences for the cell to attain thermal and electrochemical equilibrium. This experiment constitutes the benchmark test, and this is used as a comparison against a HPPC, performed with reduced preconditioning as proposed in [
11]. The preconditioning is accelerated in order to establish whether it can be reduced without sacrificing measurement accuracy. This approach is then repeated for the PM signal described in [
41,
42], comparing a PM benchmark test with the standard preconditioning sequence and an PM test with accelerated preconditioning.
3.1. Cell Selection
Two different cell formats were selected for evaluation in this study: a pouch and 18,650 cylindrical cells.
Table 1 summarises the pertinent electrical performance data for each cell that is utilised. The pouch cell is manufactured with low internal resistance for power applications such as HEV, whereas the 18,650 cell is more suitable for energy applications such as battery electric vehicles (BEVs). The 18,650 energy cell internal chemistry is comprised of nickel cobalt aluminium oxide (NCA) with a LiC
6 (graphite) anode. Conversely, the pouch power cell is classified as high power nickel manganese cobalt oxide (NMC). The anode is also composed of graphite; however the cell active material of the cathode is Li
yMn
1/3Ni
1/3Co
1/3 [
53,
54]. These cells were selected because they cover two chemistries that are currently being commercialised by system integrators and vehicle OEMs. For example, Nissan
© have opted for the NMC chemistry within the Leaf, whilst Tesla
© is employing NCA. Similarly, both cell formats that were utilised in this study are under consideration by a number of automotive OEMs that are researching the integration of LIB packs within future HEVs and EVs. For example, Tesla
© have opted for cylindrical 18,650 cells, whilst the commercially available Nissan Leaf
© and BMW i3
© favour the pouch option. The use of commercially available chemistries and cell formats ensures the applicability and relevance of the research undertaken with respect to impact on the broader industrial sector.
3.2. Experimental Facilities and Experiment Setup
With a view to increase the confidence in the accuracy of the comparisons, six cells of each type (12 in total) were tested within the experiment programme. Based on internal WMG reports detailing an analysis of the relative accuracy of the experimental facilities utilised within the test facilities and the manufacturing tolerances of the cell types employed, e.g., measured open circuit voltage (OCV) and internal resistance repeatability and reproducibility, a sample size of six for each cell type was selected, and it was found to provide a mean measurement error of 1.13% and 0.34% for the pouch power, and 18,650 energy cells, respectively. Unless otherwise stated, the results are an average of six cells, with error bars representing standard error (SE) defined as the standard deviation divided by the square root of the sample size of six.
Figure 1a presents a schematic diagram of the experimental set-up and
Figure 1b shows a photograph of the cell mounting fixture employed to electrically connect the 12 cells under test to a commercially available cell cycler (Bitrode MCV 16-100-5). Given the electrical rating of the cell cycler (100 A at 5 V per channel), in order to meet the desired electrical loading each pouch power cell was driven from two output channels connected in parallel providing an effective capability of 200 A at 5 V. The photograph in
Figure 1c of the actual laboratory equipment employed shows the host personal computer (PC), a Bitrode cell cycler, and an Espec thermal chamber. From the manufacturer’s documentation, the output current resolution of the battery cycler is 10 mA. The cell’s terminal voltage was measured at a sample rate of 100 ms, and with an accuracy of 50 mV/bit using the on-board 10-bit analogue-to-digital converter. The Espec thermal chamber controlled the ambient temperature for the cells at the target temperature of 25 °C to an accuracy of ±1 °C. In order to monitor the surface temperature of the cells during the experiments, T-type thermocouples were connected to the surface of the cells in the locations shown in
Figure 2. The cell surface temperature was recorded at a sample rate of 1 Hz with an accuracy of 0.5% of the measured value.
3.3. Experimental Procedure
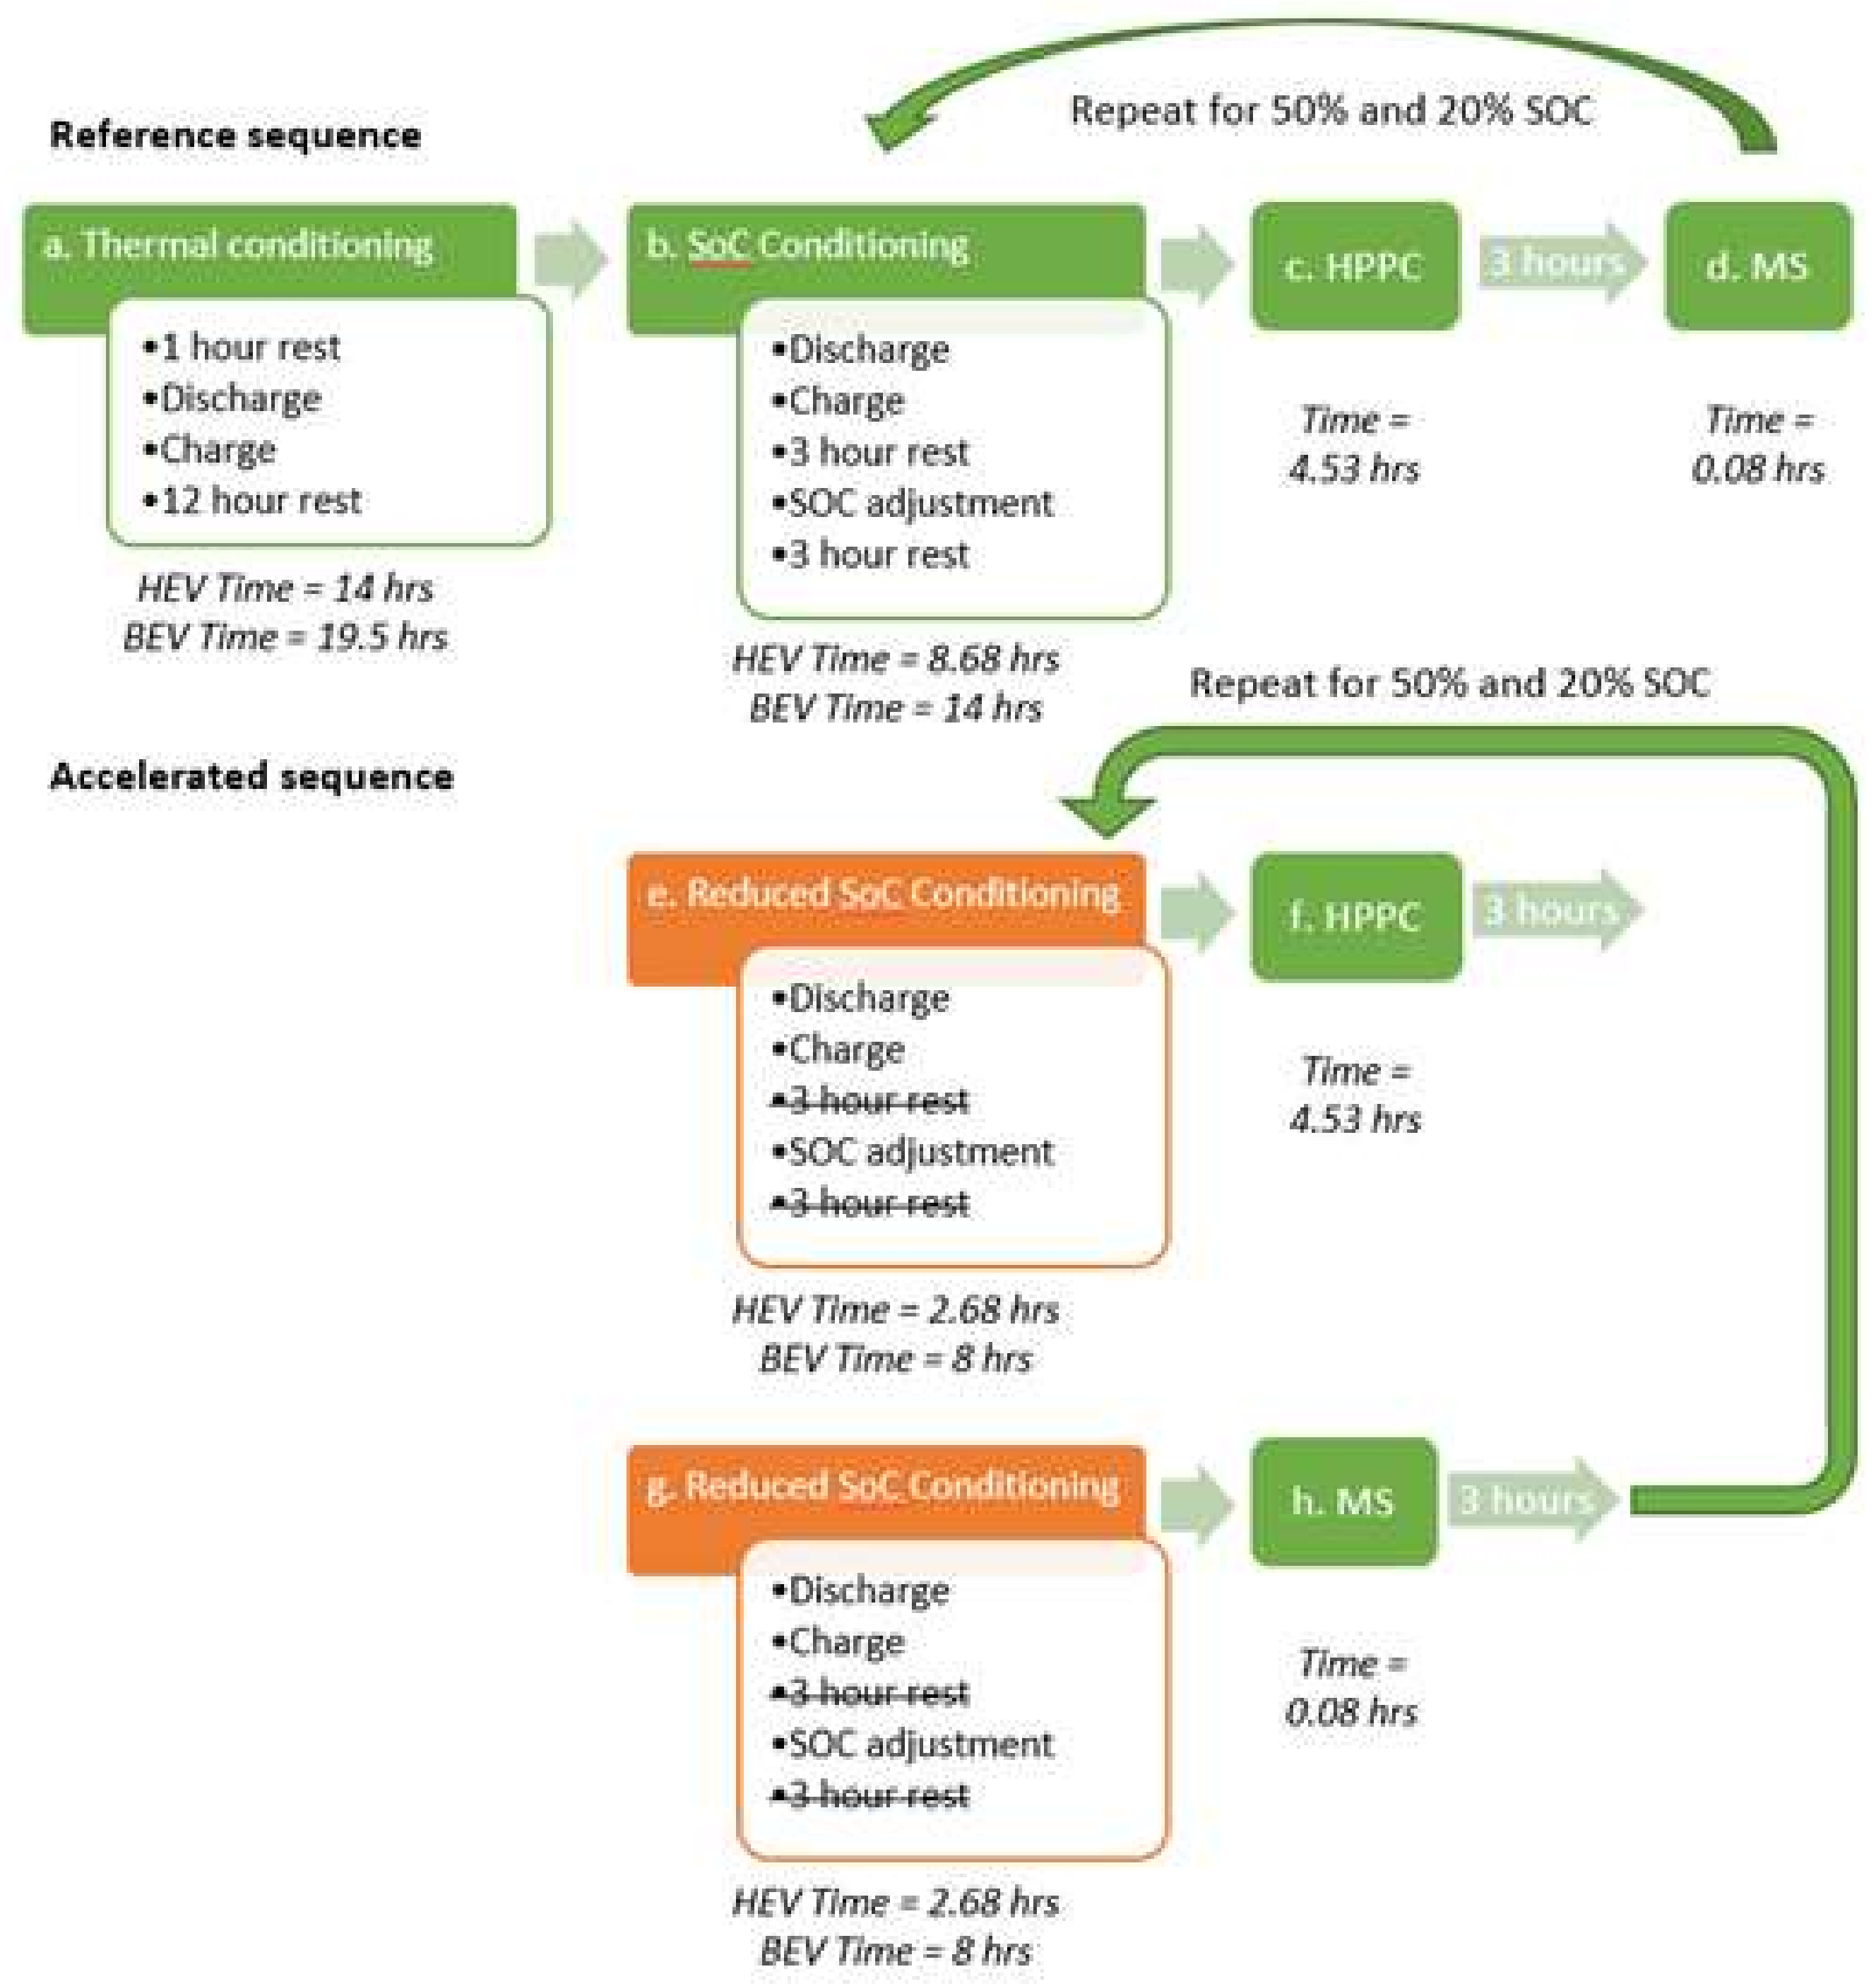
The test sequences for the reference tests and the accelerated tests with test times are shown in
Figure 3. The HPPC (step c and f) and PM (step d and h) signals, which are described in
Section 3.3.2, respectively were the same for both sequences, in order to isolate the effect of accelerated SoC conditioning. From [
11], the shortest experiment for pouch power cells that remained within the acceptable error bounds (±1.13%) was at 25 °C, with no wait period and maximum C-rate. This equated to a 92% (220 min) saving in time compared to the reference experiment. For the 18,650 energy cells, the shortest test that remained within the acceptable error bounds (±0.34%) was at 25 °C, with no wait period and 1C-rate. This equated to a 58% saving in time compared to the 8 h reference test.
3.3.1. Reference Internal Resistance Measurements
Reference sequence Step a (
Figure 3) was the cell thermal conditioning, performed as specified in the IEC-62660 standard [
29], to ensure that the cells reached thermal stabilisation. This was followed by the SOC conditioning (step b), which is split in five parts, as per IEC-62660 [
35]. Firstly, the cell was discharged at a constant C rate (C/3 for BEV and 1C for HEV) to the end of the discharge voltage specified by the manufacturer. Secondly, the cell was charged using the constant current constant voltage (CC-CV) method. The constant current (CC) used was 0.91 and 40 A for the 18,650 energy cells and pouch power cells, respectively. In the constant voltage (CV) step, the cells were held at 4.1 V until the current decreased to 0.1 and 2 A for the 18,650 energy cells and pouch power cells, respectively. The maximum charge voltage for the pouch cell was specified at 4.1 V on the manufacturer datasheet. To maintain consistency in the experimental approach, the same charge voltage was applied to the energy cell. Thirdly, a 3 h wait to ensure the cells have reached thermal stabilisation, which is defined in IEC-62660 [
29] is attained once the rate of change of temperature is less that 1 K/h for a 1 h time interval. Fourthly, a SOC adjustment is performed by discharging the cell at a constant C rate (C/3 for BEV and 1C for HEV). Finally, another 3 h wait was done to ensure the cells have reached thermal stabilisation.
3.3.2. Accelerated Internal Resistance Measurements
The cell thermal conditioning is not performed again prior to the accelerated sequence since it has been implemented before the reference sequence and a 3 h rest is sufficient to ensure the cells have reached thermal and electrochemical equilibrium. The reference SOC conditioning is accelerated for the accelerated sequence (step e and g), i.e., no rest to allow for thermal stabilisation in between discharge and charge, and after the charge (
Table 2). A three-hour rest period was implemented in between the reference sequence and the accelerated sequence to allow for thermal stabilisation. Similarly, following the HPPC (step f), a 3 h rest is introduced to ensure the cells have reached thermal and electrochemical equilibrium before repeating accelerated sequence 2 for the remaining SOCs.
3.3.3. Hybrid Pulse Power Characterisation (HPPC) Method
The HPPC results were calculated from 10 pulses applied at the 90%, 50%, and 20% SOC at 25 °C. The HPPC method is based on the HPPC defined in IEC-62660 [
29]: a series of 10 single pulses are applied for 10 s with a wait time of 30 min to allow the cell to reach thermal equilibrium between each pulse. The sequence alternates between charge and discharge pulses of equal amplitude in order to minimise SOC change.
Since the HPPC is performed at high and low SOC (90% and 20% respectively), it is necessary to modify the pulse amplitudes from IEC-62660 [
29] otherwise the cell terminal voltage will reach the cut-offs shown in
Table 1. The maximum discharge pulse at 20% SOC will cause the cell terminal voltage to reach the lower voltage cut-off. Similarly, the maximum charge pulse at 90% SOC will cause the cell terminal voltage to reach the upper voltage cut-off. In both scenarios, the cell cycler reduces the current in order to maintain the cell within the voltage thresholds. This causes the pulses to be abated, which affects the resulting internal resistance calculations. The current values for the pulses are shown in
Table 3. Where a pulse C rate has been altered, the length of the pulse has been modified in order to maintain the area under the curve to keep the whole pulse sequence charge neutral.
In order to calculate the internal resistance (
Rint) of the cell, the cell voltage after 10 s and the corresponding current were recorded for each of the five discharge pulses. The charge pulses are not utilised, as typically, LIB internal resistance can be 5–20% higher during charging [
49]. The internal resistance
Rint is estimated using a linear regression of the five pulses, given by:
where
xi is the applied pulse current,
yi is the voltage value after 10 s,
n = is the number of pulses, and
i is the
ith pulse.
3.3.4. Pulse-Multisine Method
The pulse-multisine (PM) method utilises the dynamic nature of the PM current and voltage response to estimate the internal resistance (at a given SOC) in two steps. The first step includes the estimation of a non-parametric estimate of the battery internal resistance as a function of the PM signal frequency content (
Figure 4). This step is similar to an EIS test, whereby the measured PM current and voltage signal are transformed to the frequency domain (via a Discrete Fourier transformation), and the internal resistance is estimated (see [
42] for details of this procedure). The second step includes parameterization of the internal resistance with an ECM. The internal resistance of the cell is then calculated as the total sum of the resistive elements of the ECM. A second-order ECM (i.e., a two resistor-capacitor network) is found to fit the internal resistance based on the PM procedure across all the SOCs. The advantage of this two-step procedure is that the non-parametric internal resistance together with its standard deviation can be estimated. A weighted (with the standard deviation) non-linear optimisation can then be performed to estimate the ECM parameters, which makes the procedure robust to measurement and battery dynamic uncertainty (see [
41] on details of the model estimation).
4. Results
The percentage difference between the reference and accelerated internal resistance from HPPC and PM for both cell types (18,650 energy cell and pouch power cell) are shown in
Figure 5.
Table 4 shows the statistically significant differences between reference and accelerated results using a two-tailed paired student t-test with 5% significance level.
The 20.7% underestimation at 20% SOC for the energy cell appeared quite large; however it was within the range that was expected for this cell, i.e., in [
41]; the internal resistance at 20% SOC increased from 43 mΩ at 45 °C to 205.6 mΩ at 0 °C, which was an increase of 378%.
Table 5 shows the reference conditioning and HPPC sequence took 13.2 and 18.5 h, whilst the accelerated condition only took 7.2 and 12.5 h representing a 45% and 32% time saving in total test time for the pouch power and 18,650 energy cells, respectively. Similarly, the reference conditioning and 5 min PM sequence took 8.8 and 14.1 h whilst the accelerated condition only takes 2.8 and 8.1 h representing a 68% and 43% time saving in total test time for the pouch power and 18,650 energy cells, respectively.
Figure 6 shows the surface temperature of the six 18,650 energy cells during the reference sequence at 90% SOC (
a), and during the accelerated sequence at 20% (
b). A different SOC is used in
Figure 6b, compared to
Figure 6a (90%), in order to highlight the difference in temperature increase during the SOC adjustments. The ISR788 thermocouple trace in
Figure 6b is included for completeness, however this thermocouple was found to be detached from the cell, and it does not represent the surface temperature of cell ISR788.
5. Discussion
Figure 5 shows that the accelerated internal resistance from HPPC is more accurate that the accelerated internal resistance from PM for both cell types (18,650 energy cell and pouch power cell). This loss in accuracy is mostly due to the cell temperatures shown in
Figure 6. A 1C full discharge is found to heat the cells up to 36 °C from 25 °C ambient, conversely a 1/3C full charge event only increases surface temperature by 1 °C. Although there are some small variations in internal resistance between charge and discharge [
52], the large difference in self-heating is due to the different C rates utilised. The SOC adjustment from 100% to 90% SOC causes the cell’s surface temperature to heat up by up to 2 °C (
Figure 6a). However, due to the long rest times in between the events, the cells have reached thermal equilibrium (25 °C) at the start of the HPPC and PM tests.
Since there are no wait times for the accelerated sequences, the cells do not have sufficient time to reach thermal equilibrium. In
Figure 6b, a 1C full discharge is found to heat the cells by up 10 °C; however, during the ensuing 1/3C full charge event the cell surface temperature returns to within 1 °C of ambient. The lower C rate allows the cells to cool down, and due to the CV part at the end of the charge, where the current gradually reduces down to 0.1 A at the end of the charge (see 3.3.1 for charging protocol details), the cells have returned to 25 °C. However, the subsequent SOC adjustment from 100% to 20% SOC causes the cells surface temperature to heat up by up to 6 °C. Consequently, the HPPC and PM tests start at elevated temperatures instead of ambient, as for the reference sequence. Since the SOC adjust have different temporal amplitudes, both tests start at 1.7 °C and 4 °C higher for the 90% and 50% SOC, respectively. Using linear interpolation for the tabulated model values from [
42], these temperature increases correspond to:
which accounts for most of the variations in the PM measurements shown in
Table 4. It is suspected that the remaining variation is due to two factors. Firstly, the cell internal temperature may be different to the surface temperature, and therefore the cell is operating at a higher temperature than what is measured. A difference of up to 10 °C was observed between the centre of the battery and the surface of the lithium iron phosphate (LFP) 26,650 cylindrical cells [
55]. The second is that the cells are not at electrochemical equilibrium.
Similarly, for the pouch power cells the accelerated tests begin at 1, 2, and 3 °C higher than the reference sequences for 90%, 50%, and 20% SOC respectively. The temperatures are lower, since the pouch power cells have lower internal resistance and generate less heat. Those temperature increases correspond to 4%, 5%, and 3% internal resistance decrease for characterisation performed at 90%, 50%, and 20% SOC respectively. However, the variations in the PM measurements shown in
Table 4 are significantly larger. This variation is likely due to the cells not being at electrochemical equilibrium; this effect is more significant on the pouch power cells since they are discharged at 1C, compared with C/3 for the 18,650 energy cells.
The HPPC measurement is not as greatly affected by the temperature increase from the SOC adjustment, as it is estimated from a least squares fit of all five pulses and from
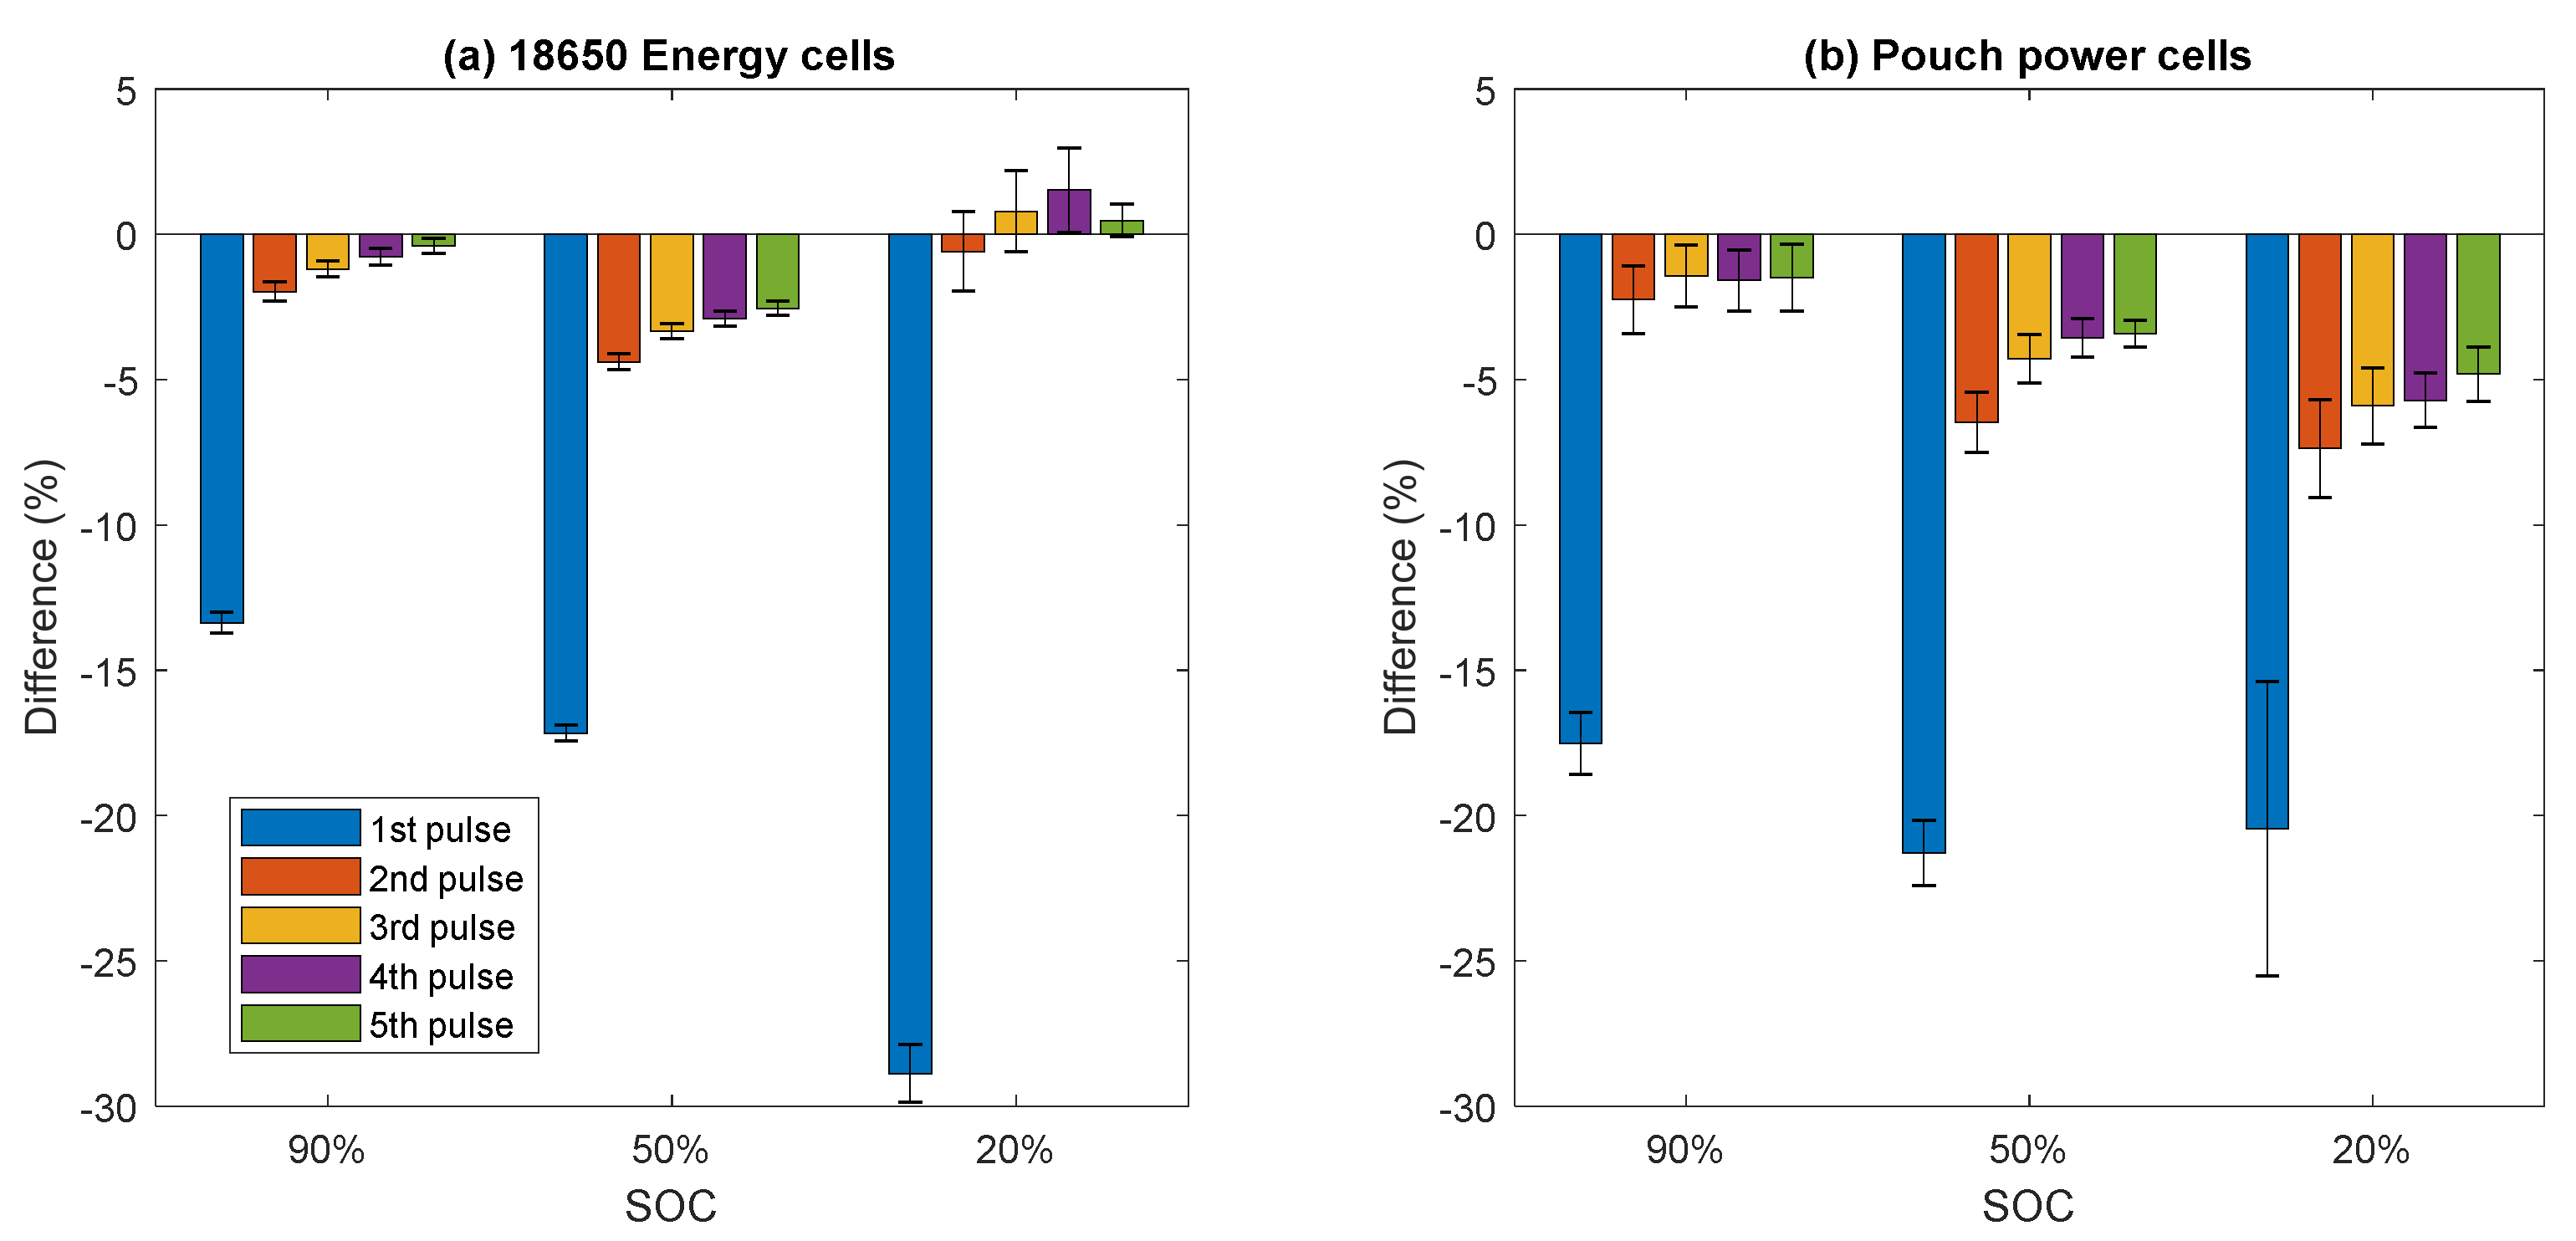
Figure 6b that only the first discharge pulse is carried out at a higher temperature. This is corroborated by measuring the internal resistance of individual pulses:
Figure 7 shows the percentage difference in resistance between the accelerated and reference HPPC measurements for each discharge pulse.
It can be seen from
Figure 7 that the first pulse is the most greatly affected, and that the effect decays over the subsequent pulses, as there is 30 min rest in between each pulse. As the HPPC sequence alternates between discharge and charge pulses, this results in the discharge pulses being spaced out by one hour, giving the cell significant time to move towards thermal and electrochemical equilibrium in between pulses.
The first pulse effect (13–29%) is much larger than the temperature contribution calculated above (3–13%). This is likely due to two effects: firstly, the temperature of the core of the cell is more elevated than the surface, and the cell is therefore operating at a higher effective temperature. Secondly, the cell has not had time to reach electrochemical equilibrium from the SOC adjust.
The PM signal is 5 min long, whilst the HPPC duration is 272 min due to the 30 min rest time in between pulses. Since the first pulse effect is larger than the PM variation shown in
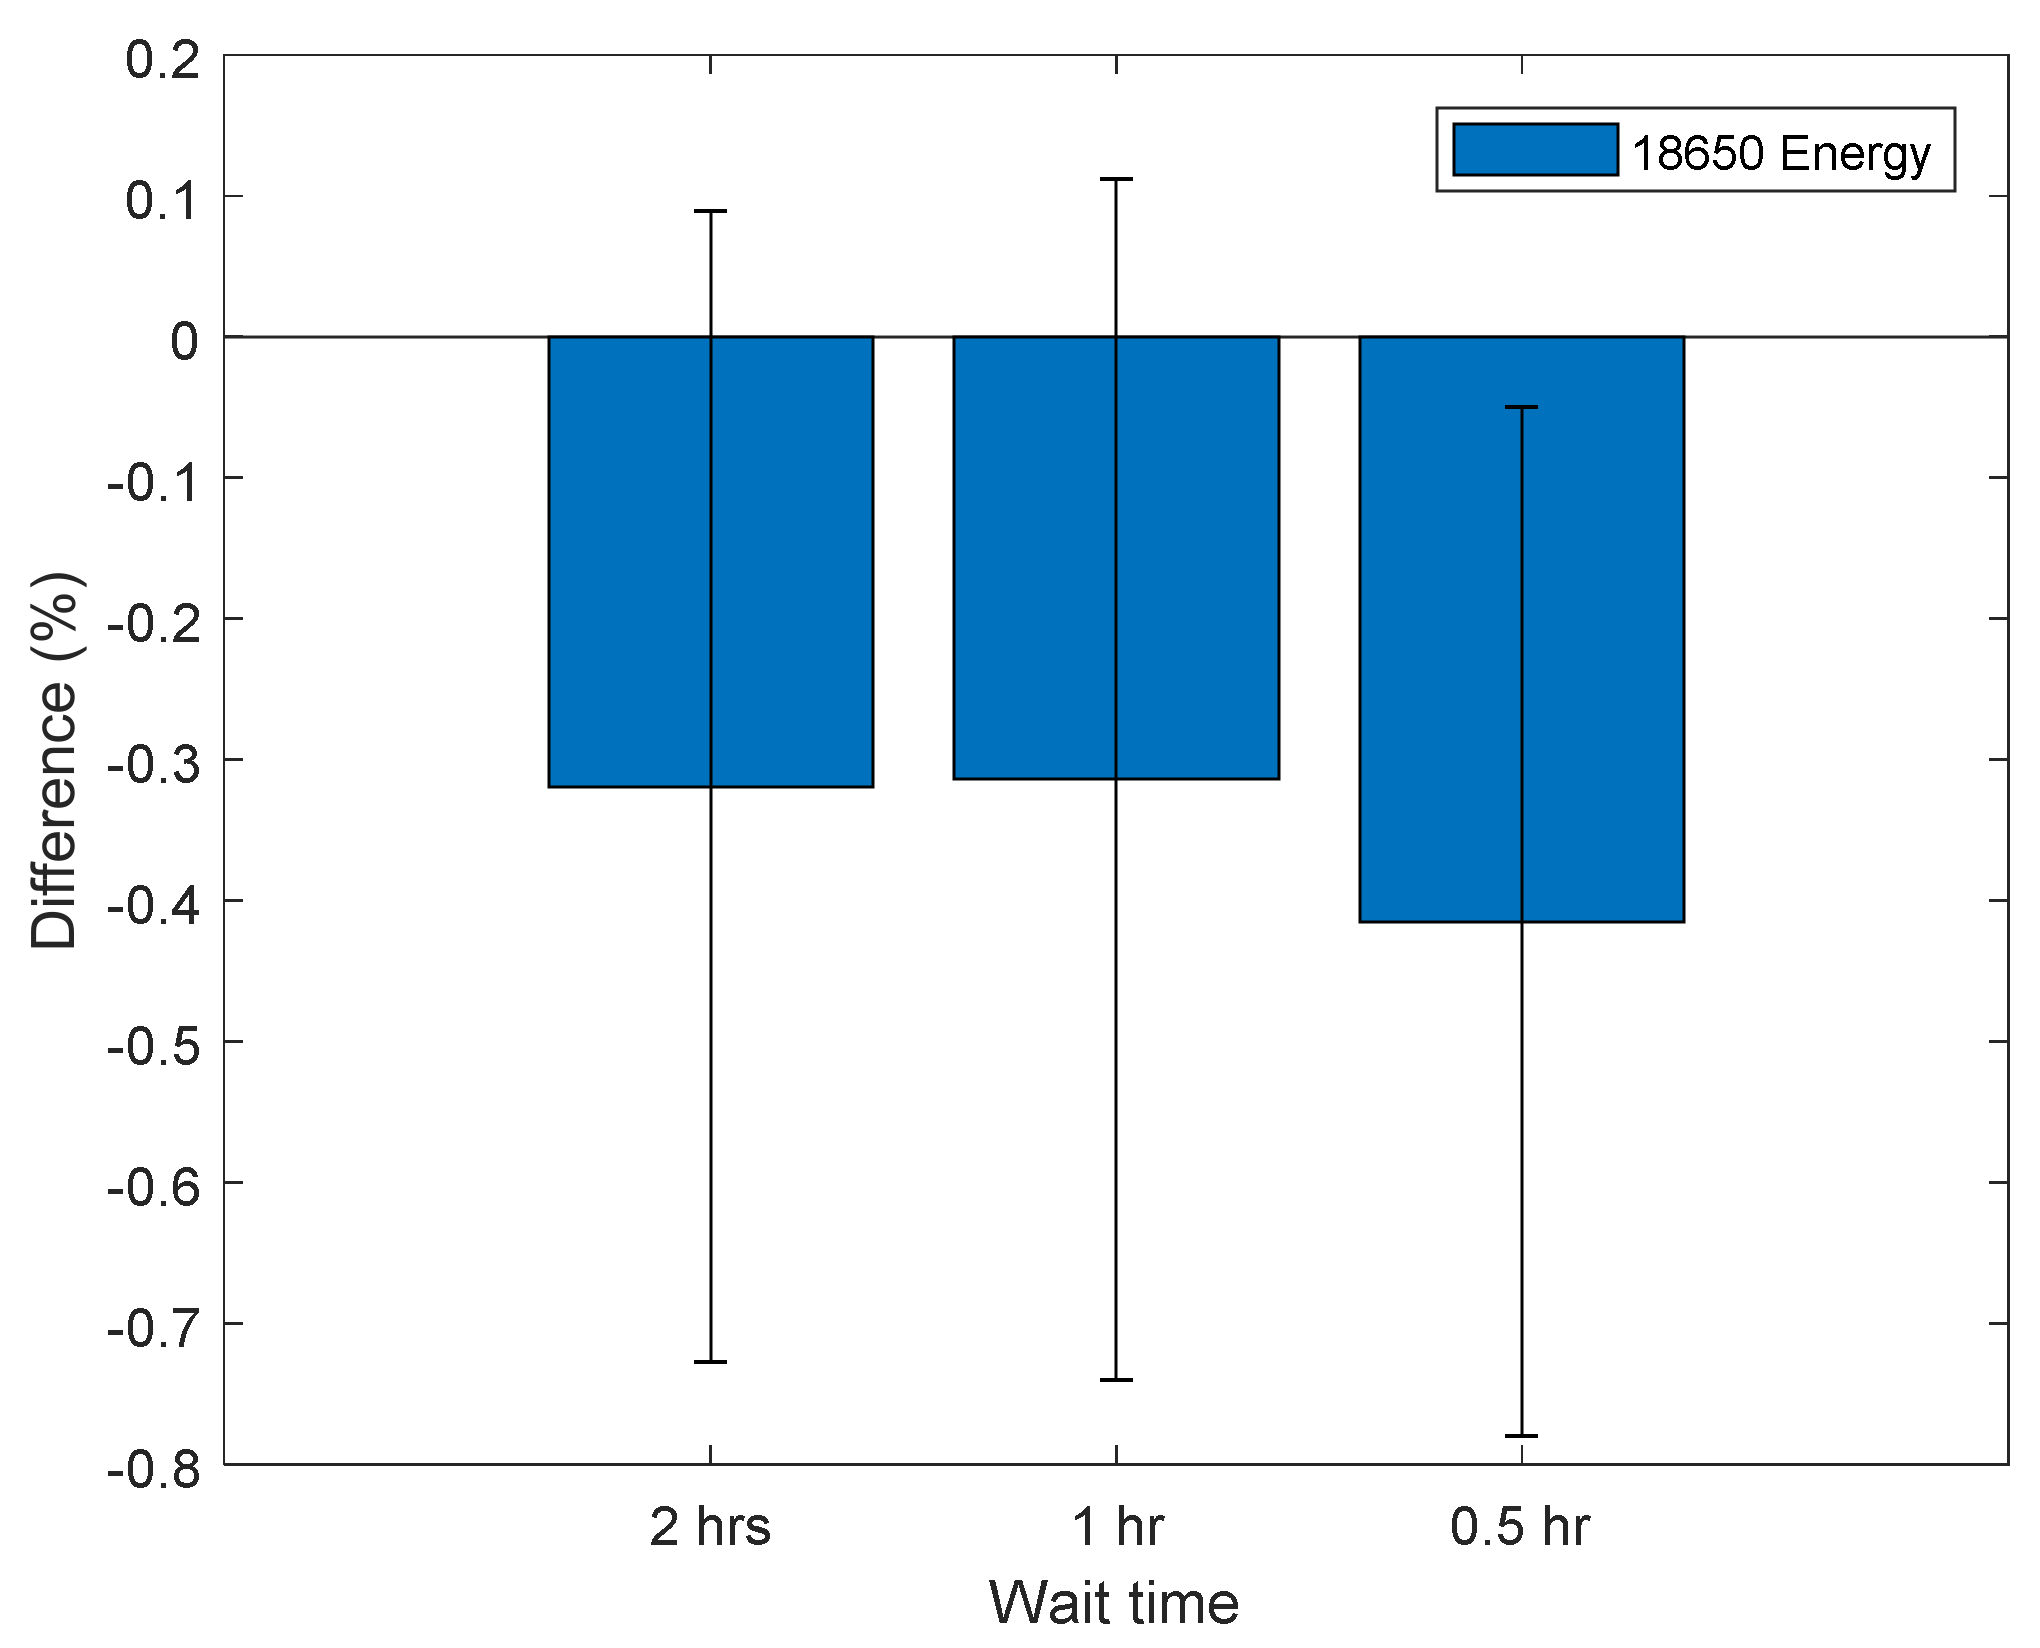
Figure 5, it suggests that the PM method is in fact more robust than an individual pulse. This is reaffirmed by performing a PM sequence with the reduced SOC conditioning (step g) at 50% SOC followed by a reduced rest time as shown in
Figure 8.
Figure 8 shows that the accelerated PM sequence is within measurement error (0.34%) with a 1 or 2 h wait time, and only underestimates the internal resistance by 0.42 ± 0.37% with a 30 min wait time.
The PM signal performed at 50% SOC with an hour wait time characterises the internal resistance within the measurement error (0.34%) and it only takes 65 min, compared to a 3.2 ± 0.3% underestimation for the full accelerated HPPC sequence performed at 50% (see
Figure 5), which takes 272 min to perform. The PM method is therefore more robust than the HPPC sequence, whilst taking less than a quarter of the time (65/272) of the full HPPC sequence. It is therefore recommended that PM be performed with 1 h wait after accelerated preconditioning, as this test is faster, more robust, and provides more meaningful measurements than a full HPPC test. The PM method with one hour wait only requires 3.8 and 8.2 h to perform for HEV and BEV cells, respectively, compared to the standard HPPC protocol in [
29], which takes 13.2 and 18.5 h respectively, which yields a time saving of 10 h. These results confirm that internal resistance measurements can be accelerated for 18,650 energy and pouch power cells, whilst maintaining accuracy within the measurement error (0.34%), and this suggest that large reductions in EOL test time for EV LIB are attainable. Reducing the experiment duration may facilitate further EOL options for the EV and HEV battery systems used. Furthermore, accelerated internal resistance measurements may speed up and increase throughput in LIB manufacturing and remanufacturing, thereby using less energy and reducing CO
2 emissions. This is predominantly important in remanufacturing, where it is likely that all LIB will be tested at the beginning of the remanufacturing process, in order to identify which cells require remanufacturing/replacing. In order to meet the commonly accepted requirement that a remanufactured item should be of identical quality as the original product, the remanufacturers will also want to test all their products to ensure that they have the same performance. The recommend testing protocol would allow up to two and four times as many cells to be tested for BEV and HEV applications respectively.
Further Work
The results highlight that the new PM method [
41,
42] is able to reduce the test duration that is required to assess the power capability (and thus SOH) for Li-ion cells by 10 h, whilst improving robustness, and remaining within the measurement accuracy (0.34%). This is a faster and more robust method of determining internal resistance supports decision-making at battery EOL. Expanding the experimental scope to include Li-ion cells from a broader selection of manufacturers and wider range of chemistries will add additional confidence and further highlight the applicability of these findings to other LIB technologies. Using these findings, the authors are currently investigating the scalability of the framework. Due to assembly constraints, vehicle OEMs and specialist suppliers are likely to seek that categorization of EV batteries at the module or pack level, rather than at the individual cell level. Research is therefore being undertaken to ascertain whether improved levels of test accuracy and experiment time are achievable when characterizing complete battery modules or pack assemblies.
6. Conclusions
Accelerated preconditioning can affect internal resistance measurements of a single pulse by up to 29 ± 1% and 21 ± 1% for 18,650 energy cells and pouch power cells, respectively. The long test length (270 min) of the HPPC means that the cells have time to move towards thermal and electrochemical equilibrium during the sequence. Fitting a straight line through the five discharge pulses yields am improved method for estimating internal resistance to within 3.2 ± 0.3% and 5.7 ± 1.2% accuracy when compared to the reference test for 18,650 energy cells and pouch power cells respectively. The accelerated preconditioning HPPC offers a 6 h time saving in total test time.
The faster PM method (5 min) with a one hour rest time offers even larger total test time savings of 10 h, whilst maintaining the accuracy within measurement error (0.34%) for the 18,650 energy cells. Consequently, for optimum rapid testing, it is recommended to perform PM measurements with accelerated preconditioning followed by one hour rest time.
The experimental results presented here show that internal resistance measurements can be significantly accelerated whilst maintaining accuracy. Since accurate measurement of the battery’s SOH underpins all the different EOL strategies, reducing the experiment duration facilitates further EOL options for used EV and HEV battery systems and helps to inform stakeholders to optimise the evaluation strategy they employ within the context of their respective commercial sectors.

 ,
, 


