
Studies on Incorporation of Mg in Zr-Based AB2 Metal Hydride Alloys


Abstract
:
1. Introduction
2. Experimental Setup
3. Results and Discussion
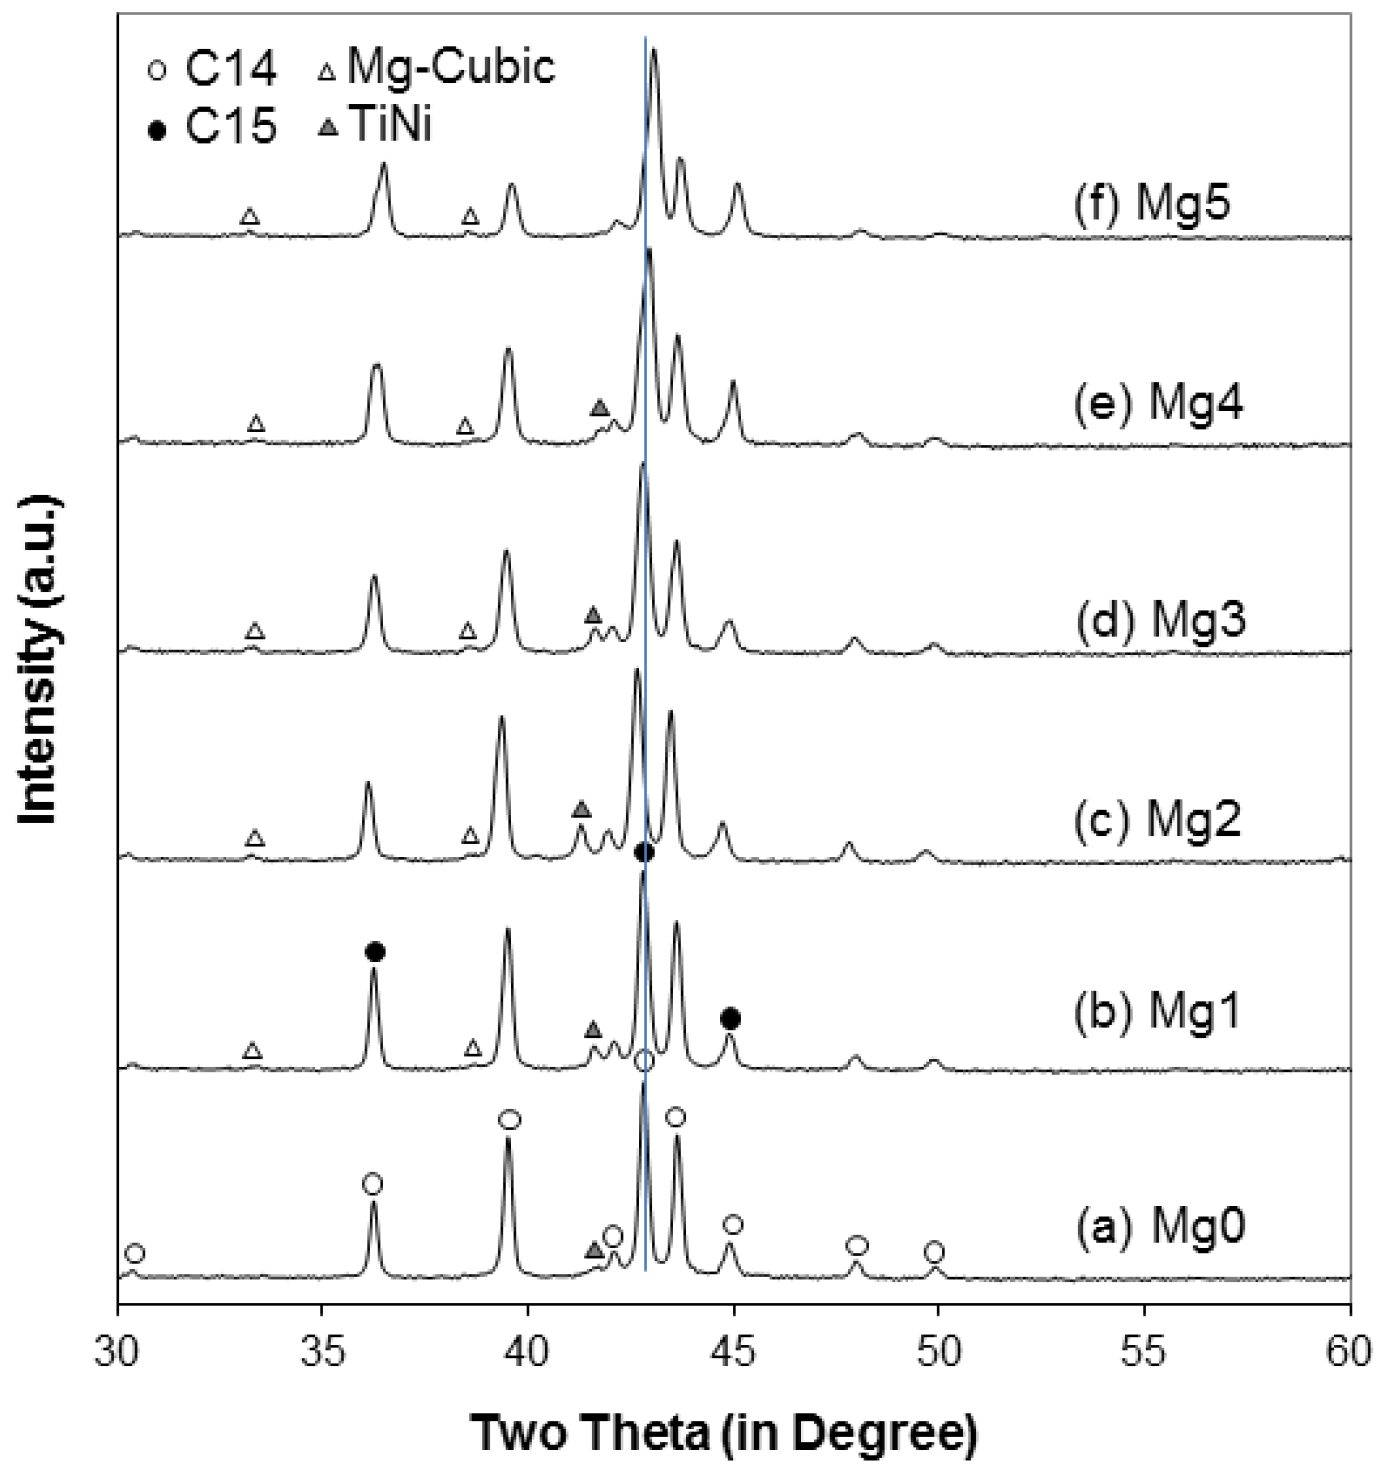
3.1. X-Ray Diffractometer Analysis
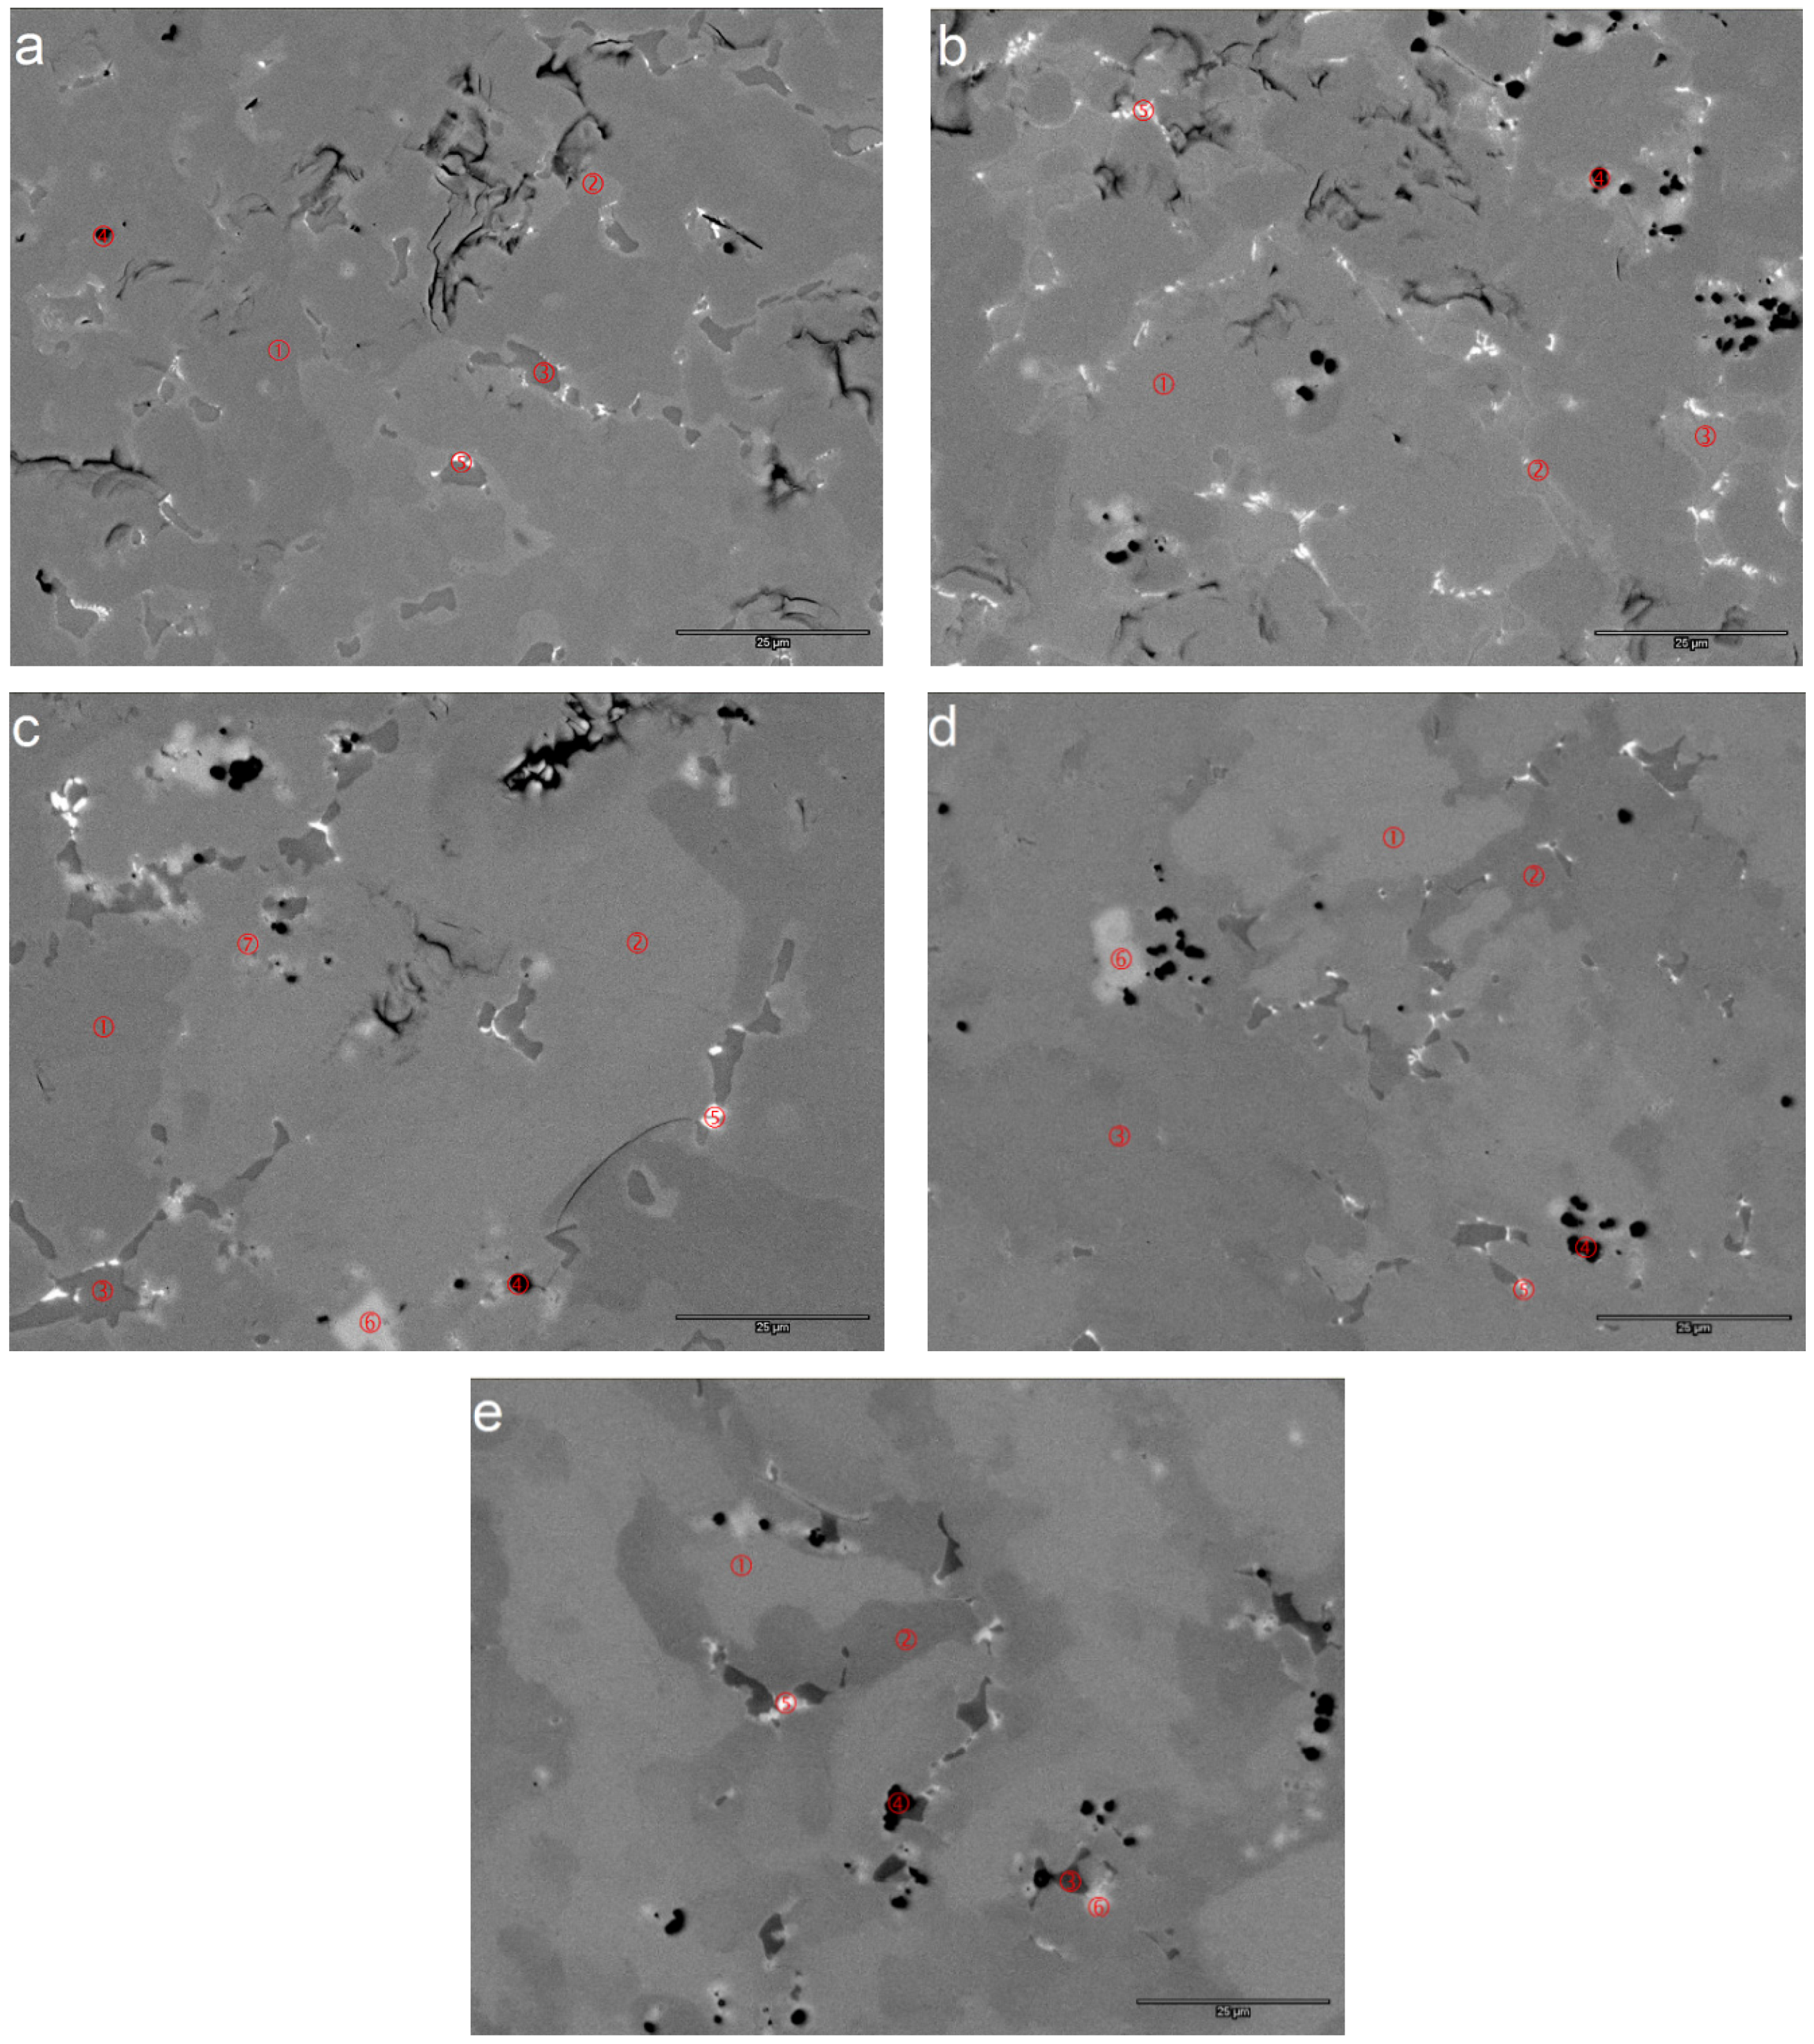
3.2. Scanning Electron Microscope/Energy Dispersive Spectroscopy Analysis
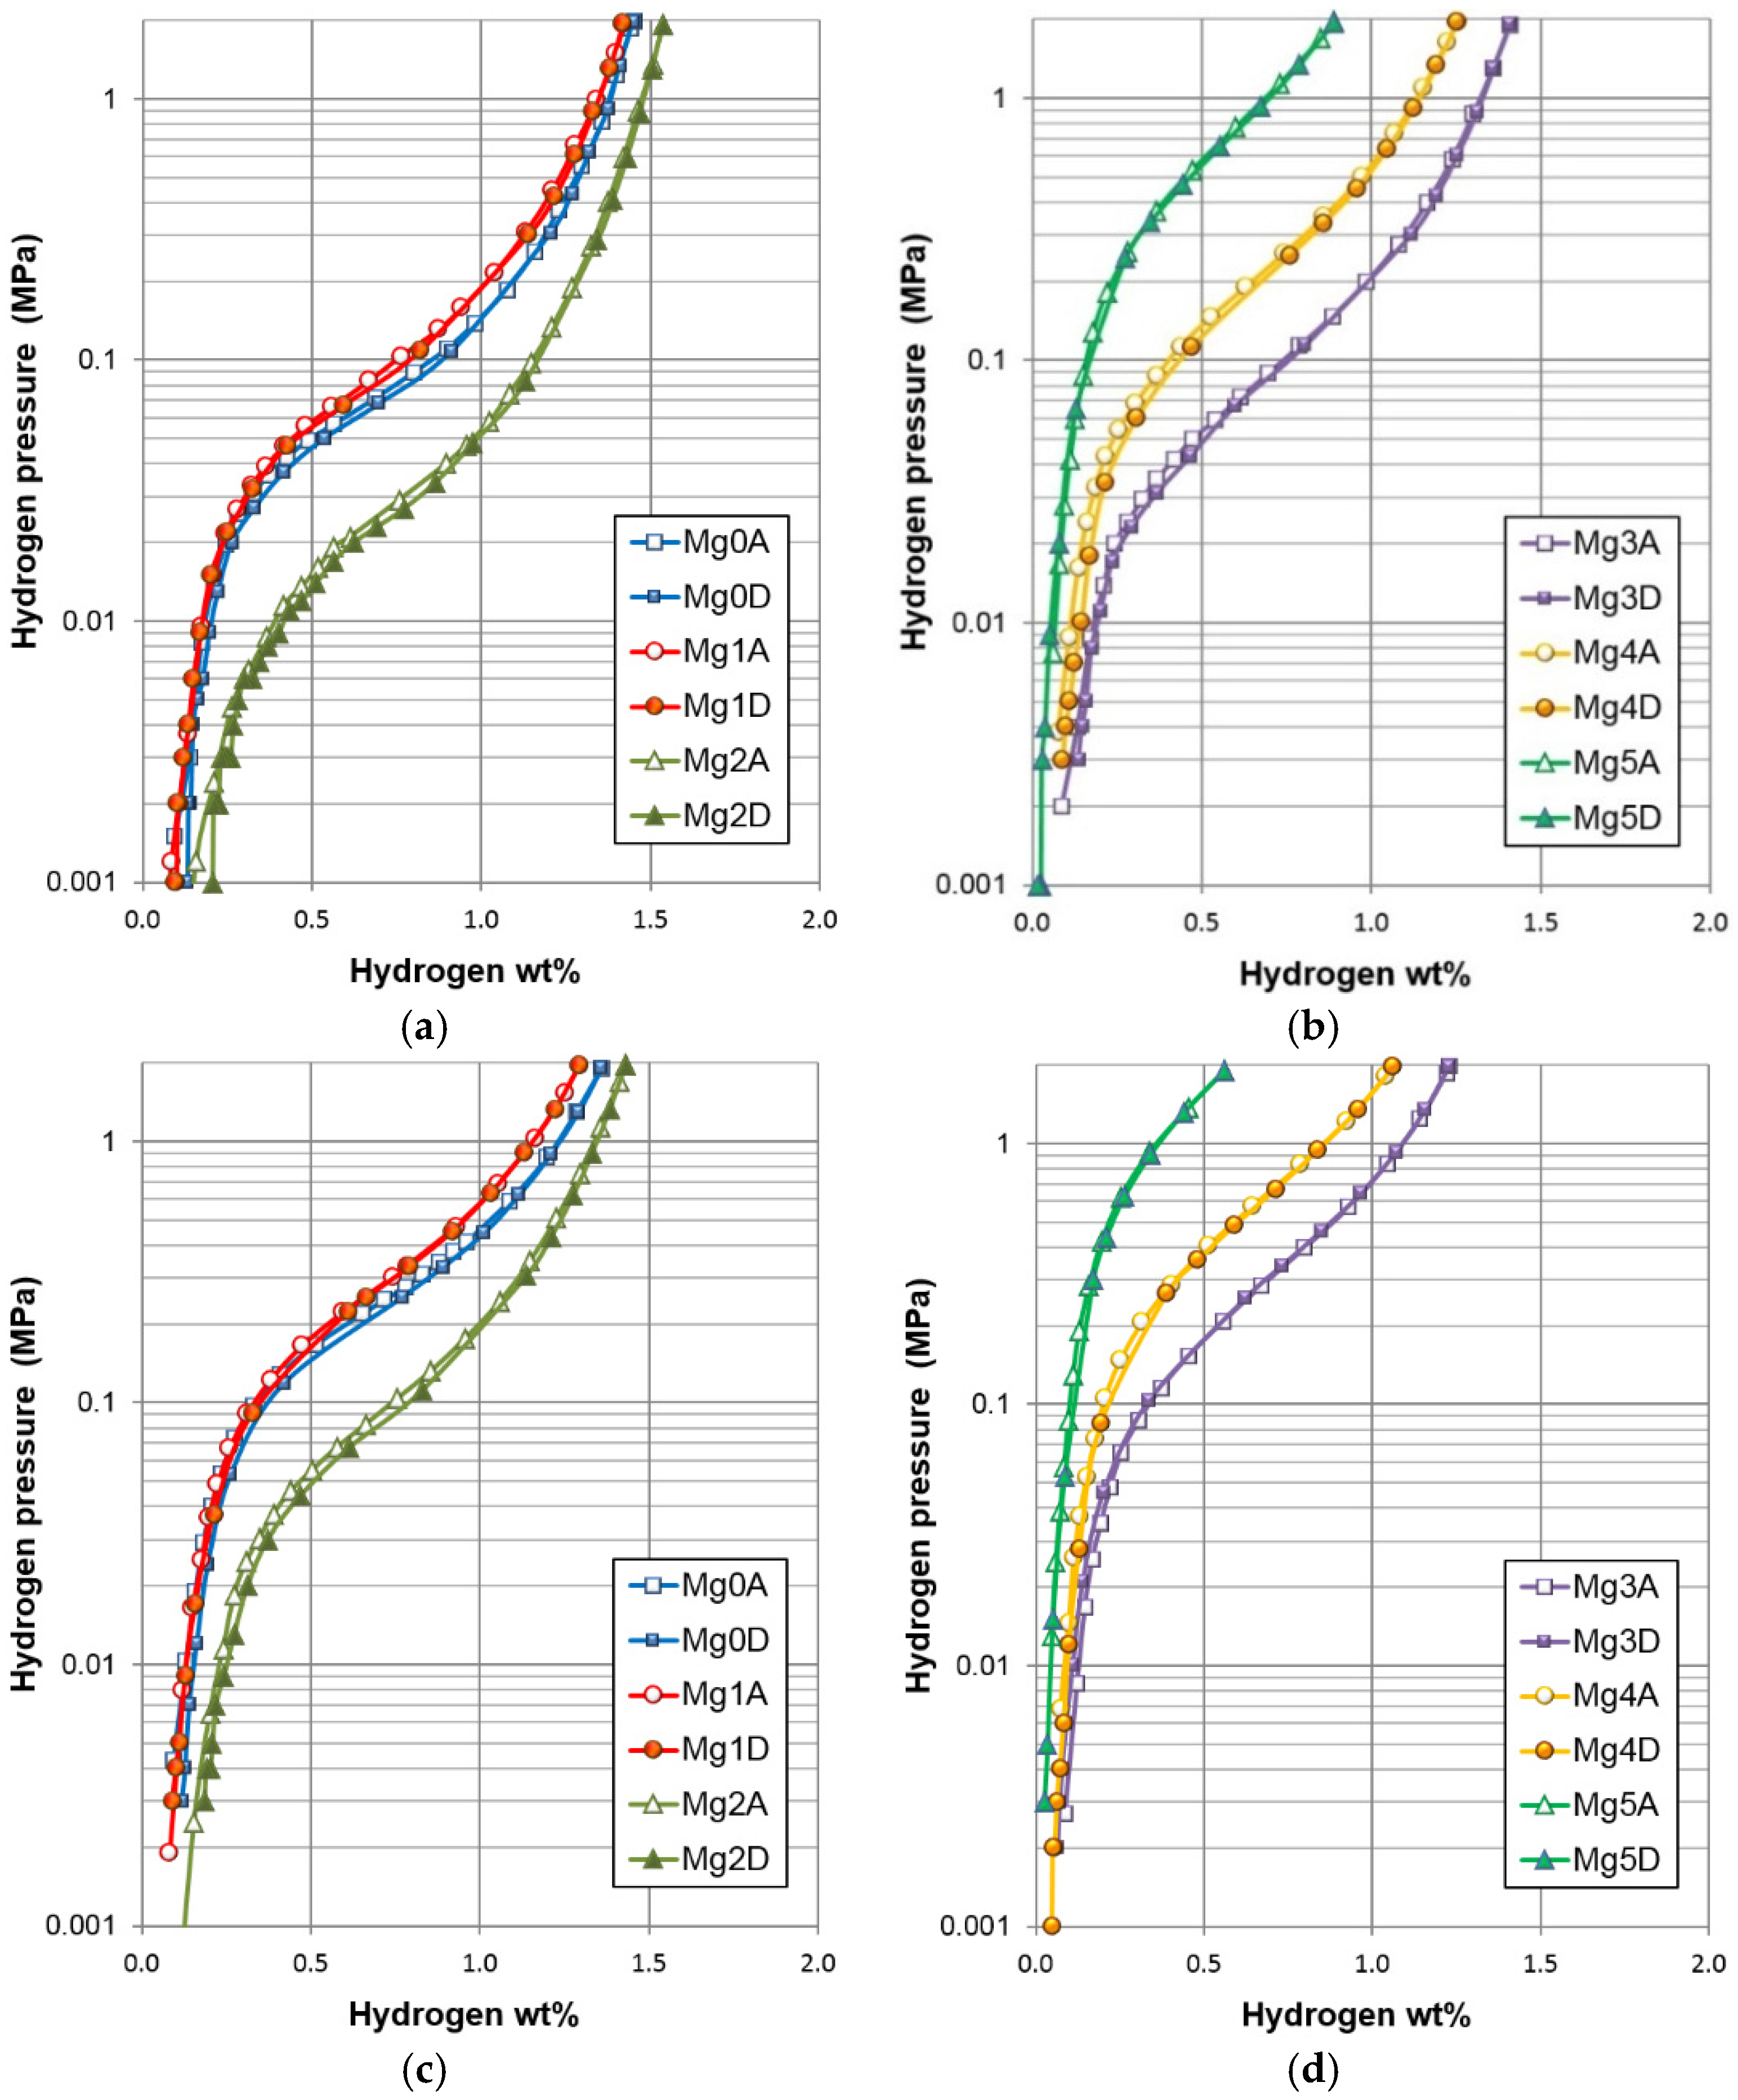
3.3. Pressure-Concentration-Temperature Analysis
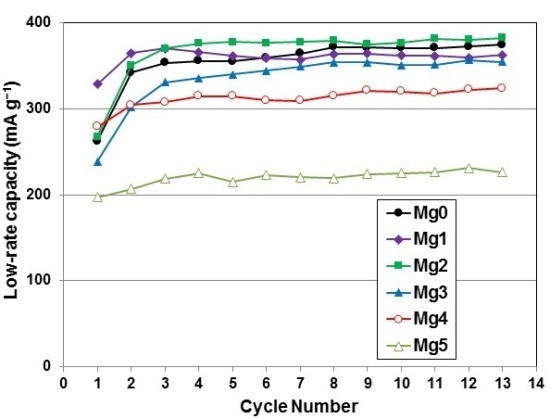
3.4. Electrochemical Analysis
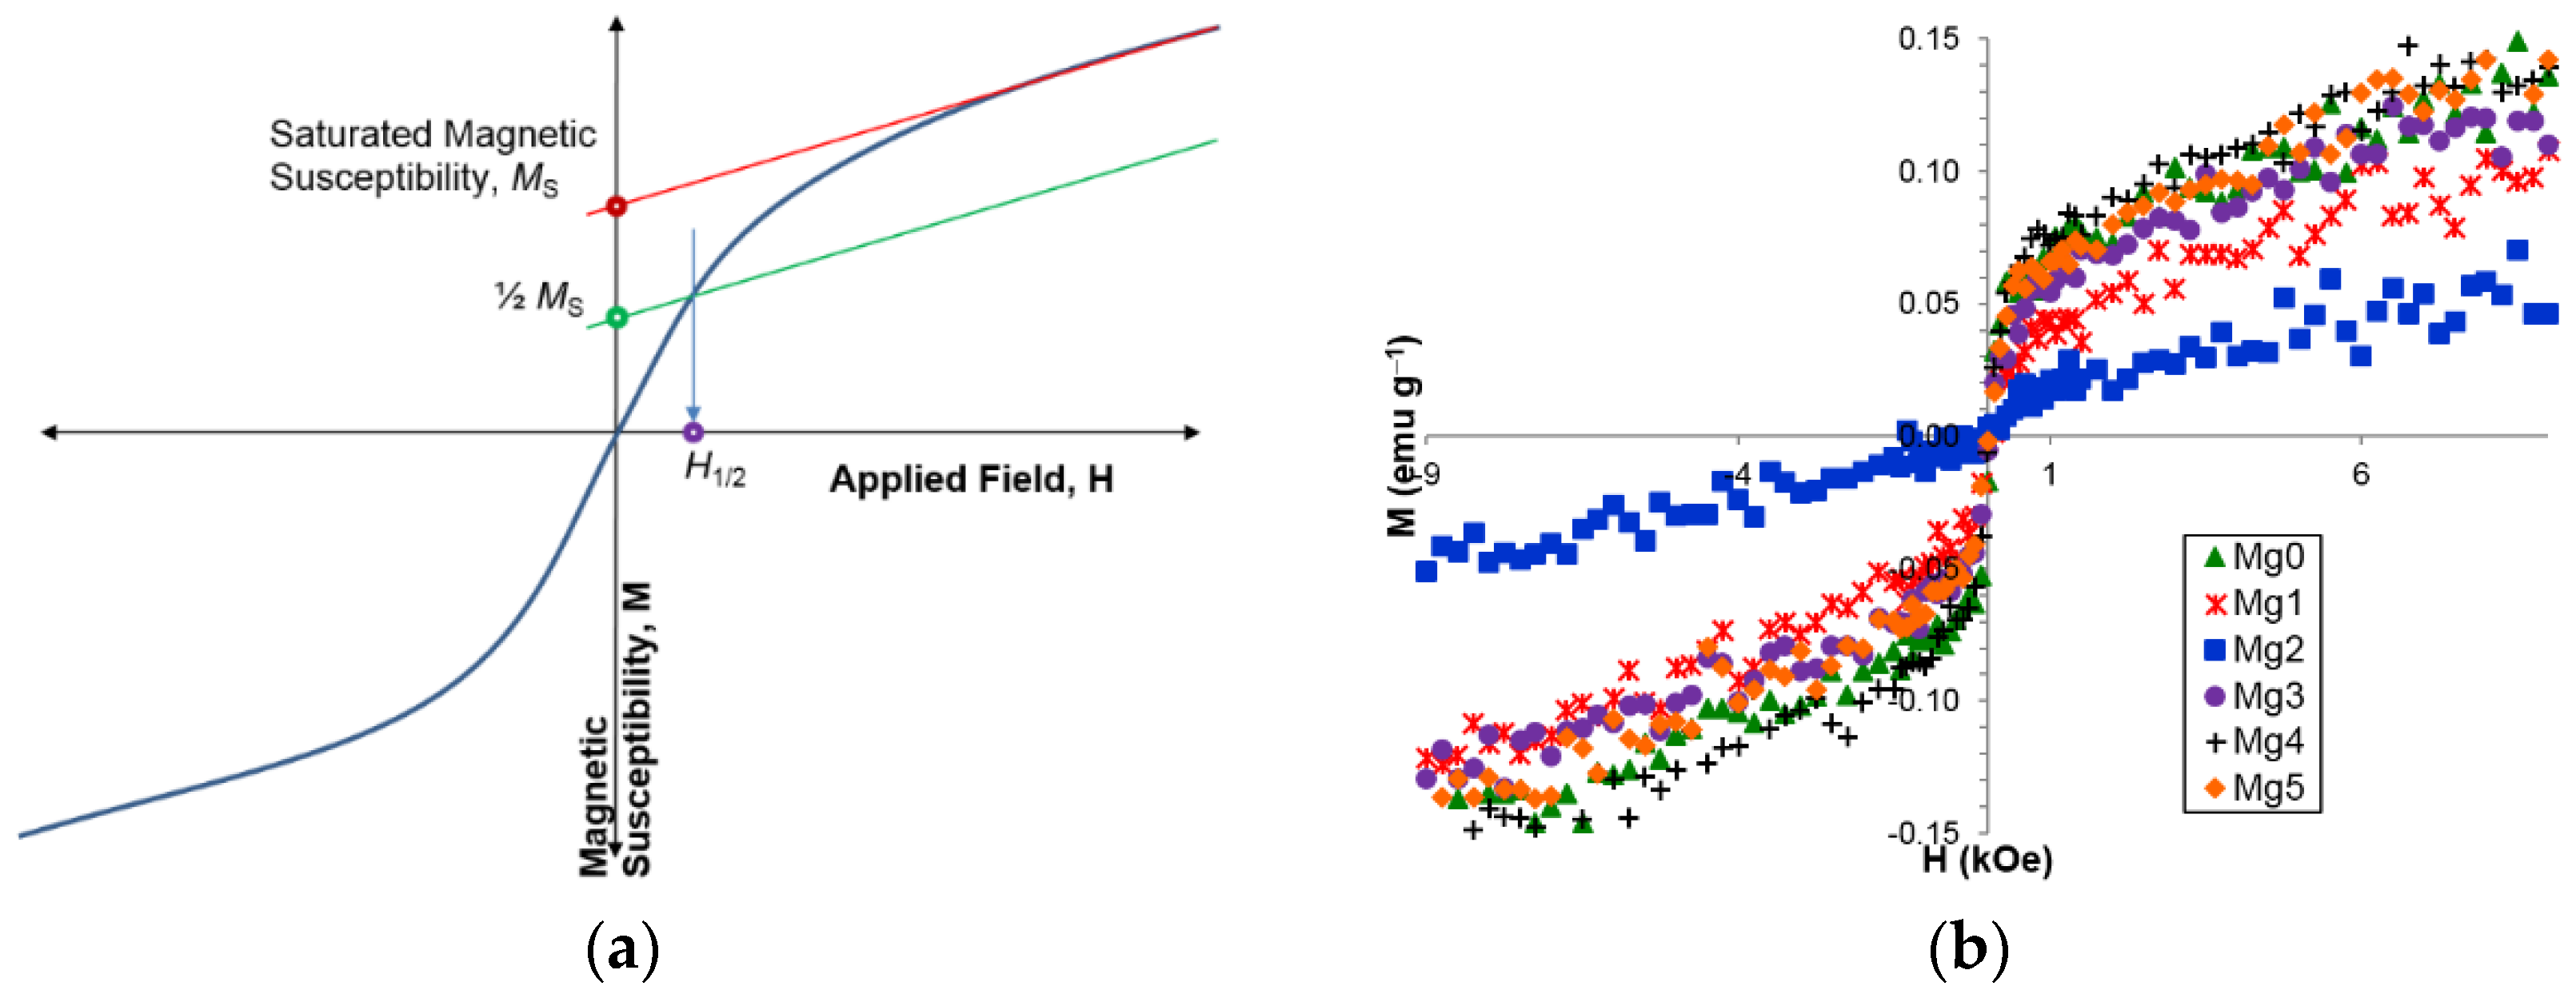
3.5. Magnetic Properties
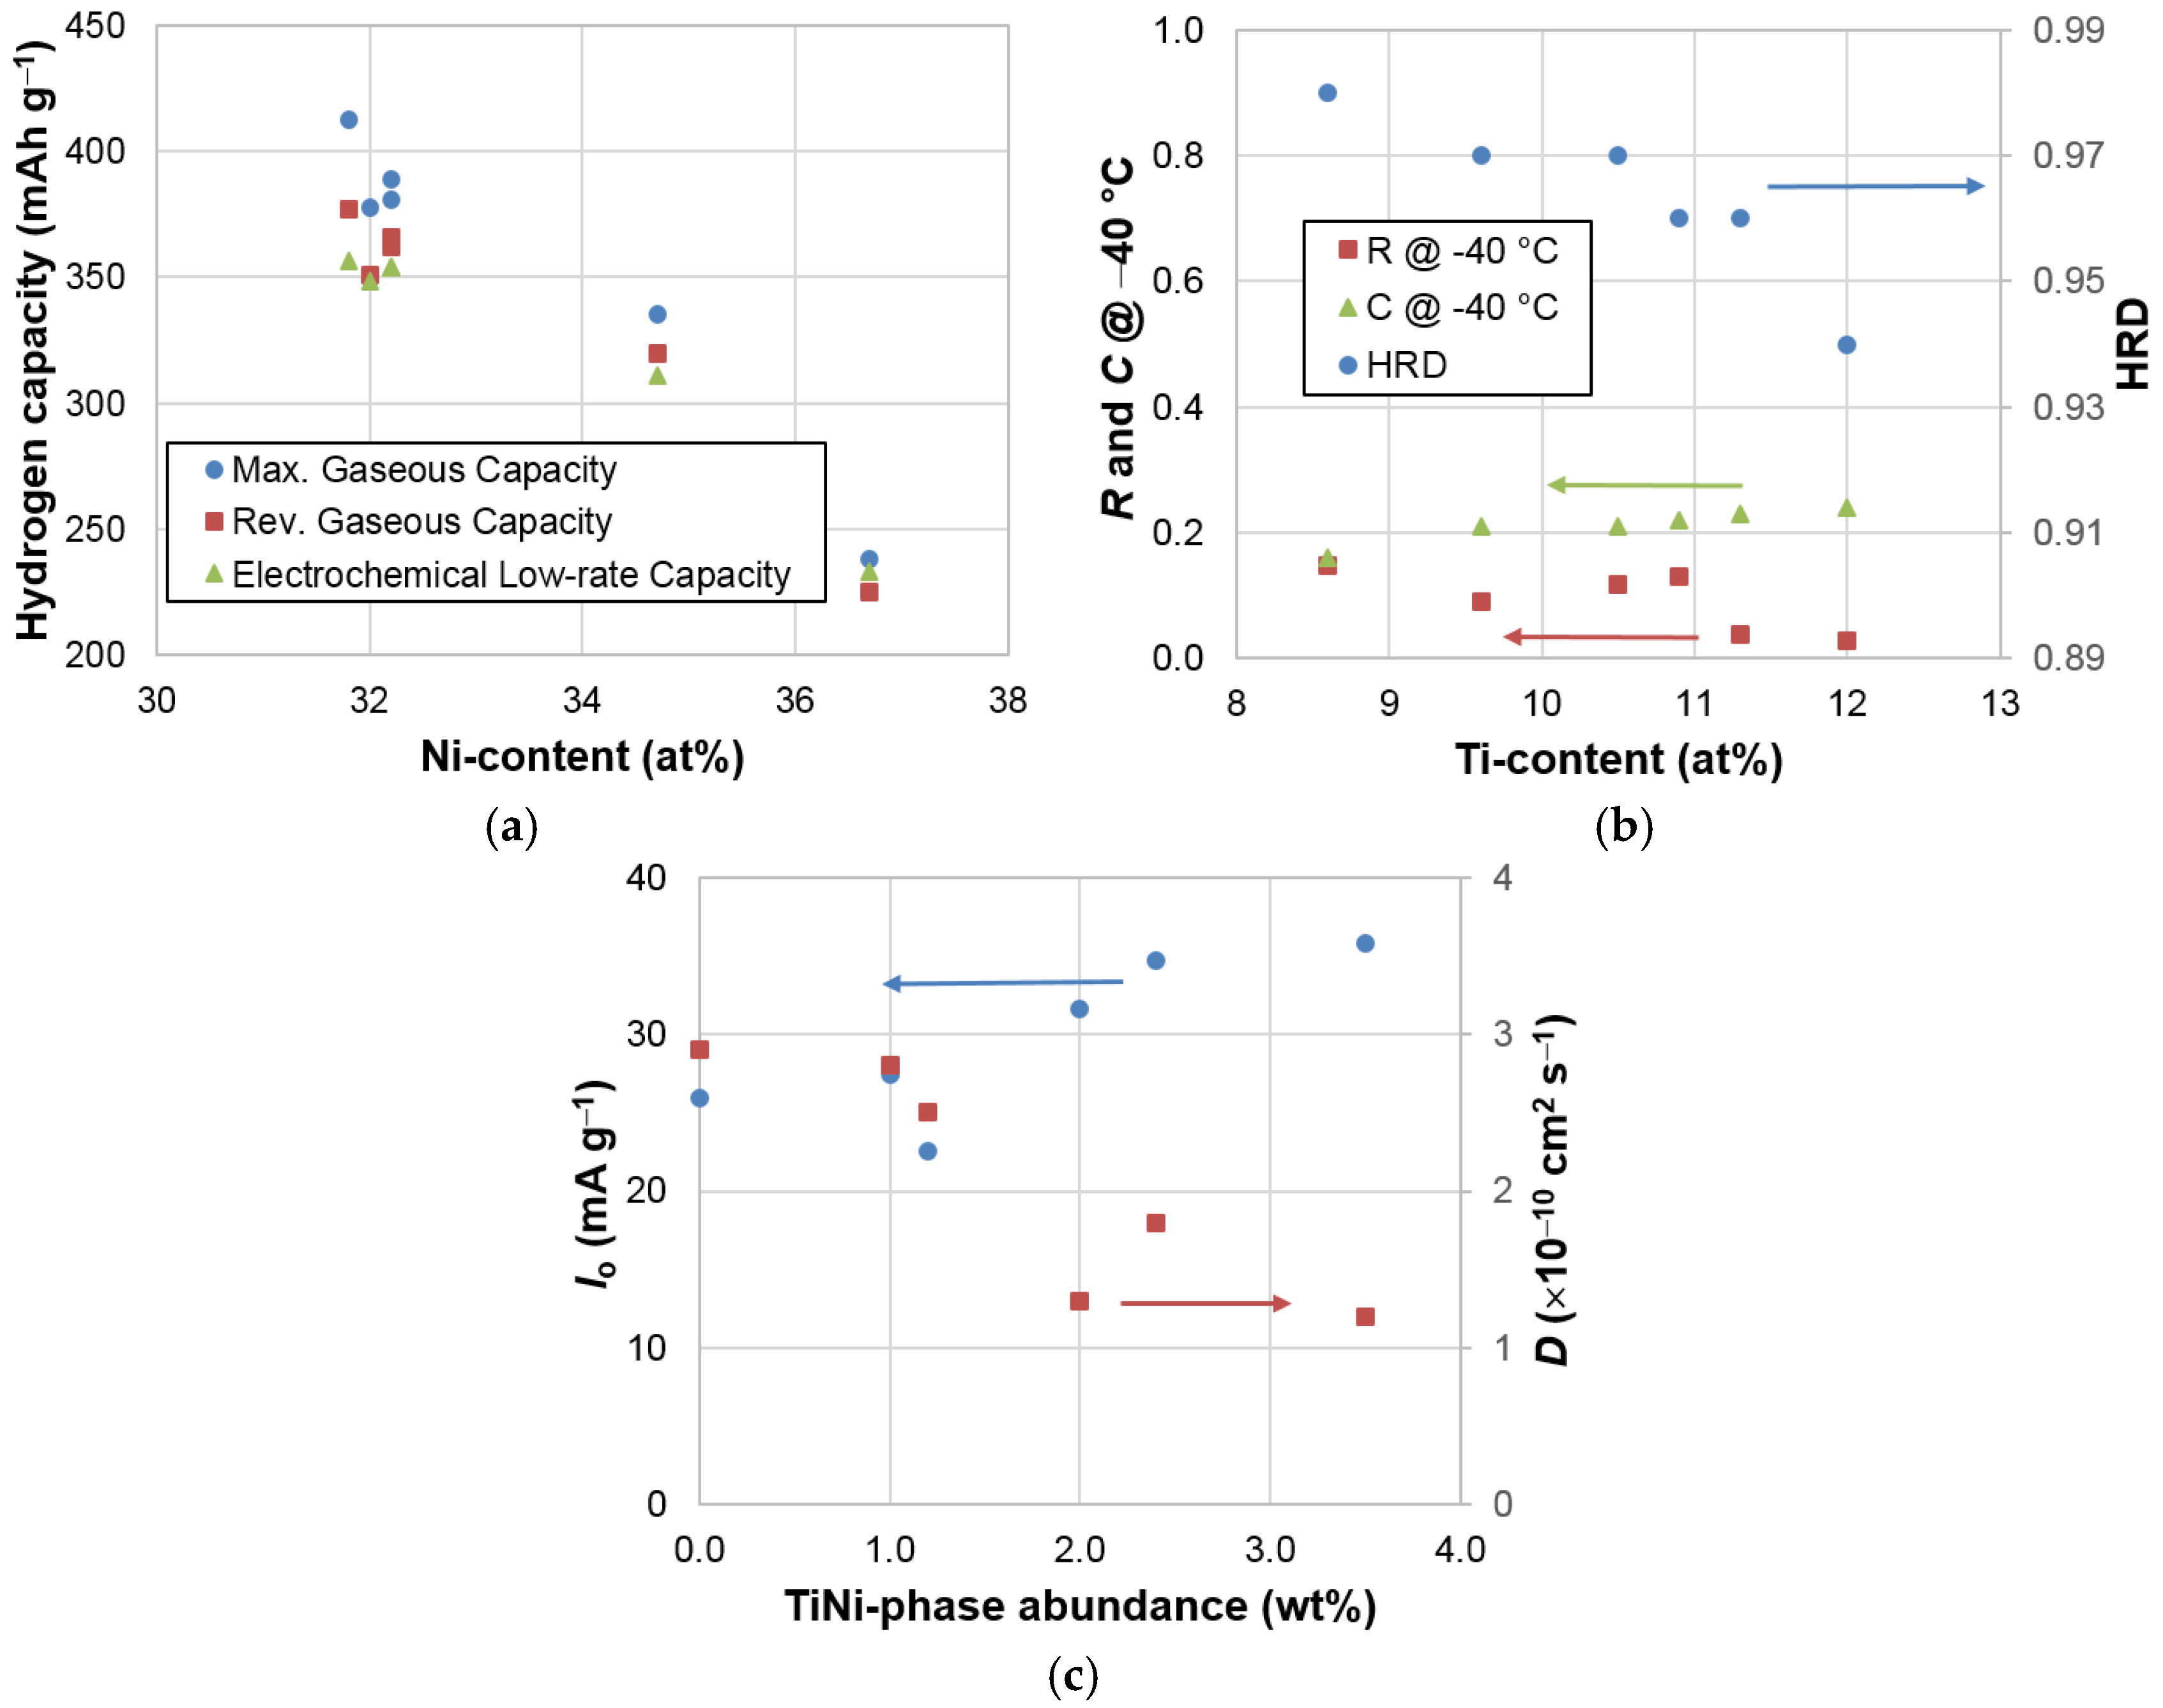
3.6. Correlations
4. Conclusions
Acknowledgments
Author Contributions
Conflicts of Interest
Abbreviations
| MH | Metal hydride |
| ICP-OES | Inductively coupled plasma-optical emission spectrometer |
| XRD | X-ray diffractometer |
| SEM | Scanning electron microscope |
| EDS | Energy dispersive spectroscopy |
| PCT | Pressure-concentration-temperature |
| e/a | Average electron density |
| ND | Non-detectable |
| BEI | Back-scattering electron image |
| DOD | Degree of disorder |
| D | Diffusion constant |
| Io | Surface exchange current |
| Ms | Saturated magnetic susceptibility |
| H1/2 | Magnetic field strength at one-half of the Ms value |
| RT | Room temperature |
References
- Jacob, I.; Stern, A.; Moran, A.; Shaltiel, D.; Davidov, D. Hydrogen absorption in (ZrxTi1−x)B2 (B = Cr, Mn) and the phenomenological model for the absorption capacity in pseudo-binary Laves-phase compounds. J. Less Comm. Met. 1980, 73, 1369–1376. [Google Scholar] [CrossRef]
- Young, K.; Ouchi, T.; Koch, J.; Fetcenko, M.A. The role of Mn in C14 Laves phase multi-component alloys for NiMH battery application. J. Alloys Compd. 2009, 477, 749–758. [Google Scholar] [CrossRef]
- Hu, W.; Noréus, D. Rare-earth-based AB5-type hydrogen storage alloys as hydrogen electrode catalysts in alkaline fuel cells. J. Alloys Compd. 2003, 356, 734–737. [Google Scholar] [CrossRef]
- Zhang, Y.; Wang, G.; Dong, X.; Guo, S.; Ren, J.; Wang, X. Effect of substituting Co with Fe on the cycle stabilities of the as-cast and quenched AB5-type hydrogen storage alloys. J. Power Sources 2005, 148, 105–111. [Google Scholar] [CrossRef]
- Züttle, A.; Meli, F.; Schlapbach, L. Electrochemical and surface properties of Zr(VxNi1−x)2 alloys as hydrogen absorbing electrodes in alkaline electrolyte. J. Alloys Compd. 1994, 203, 235–241. [Google Scholar] [CrossRef]
- Liu, B.; Jung, J.; Lee, H.; Lee, K.; Lee, J. Improved electrochemical performance of AB2-type metal hydride electrodes activated by the hot-charging process. J. Alloys Compd. 1996, 245, 132–141. [Google Scholar] [CrossRef]
- Yang, X.G.; Lei, Y.Q.; Shu, K.Y.; Lin, G.F.; Zhang, Q.A.; Zhang, W.K.; Zhang, X.B.; Lu, G.L.; Wang, Q.D. Contribution of rare-earths to activation property of Zr-based hydride electrodes. J. Alloys Compd. 1999, 293–295, 632–636. [Google Scholar] [CrossRef]
- Liu, B.; Li, Z.; Higuchi, E.; Suda, S. Improvement of the electrochemical properties of Zr-based AB2 alloys by an advanced fluorination technique. J. Alloys Compd. 1999, 293–295, 702–706. [Google Scholar] [CrossRef]
- Young, K.H.; Fetcenko, M.A.; Ovshinsky, S.R.; Ouchi, T.; Reichman, B.; Mays, W.C. Improved surface catalysis of Zr-based Laves phase alloys for NiMH Battery. In Hydrogen at Surface and Interface; Jerkiewicz, G., Feliu, J.M., Popov, B.N., Eds.; Electrochemical Society: Pennington, NJ, USA, 2000; pp. 60–71. [Google Scholar]
- Young, K.; Huang, B.; Regmi, R.K.; Lawes, G.; Liu, Y. Comparisons of metallic clusters imbedded in the surface of AB2, AB5, and A2B7 alloys. J. Alloys Compd. 2010, 506, 831–840. [Google Scholar] [CrossRef]
- Xu, Y.-H.; Chen, C.-P.; Wang, X.-L.; Wang, Q.-D. The electrode properties of the Ti1.0Zr0.2Cr0.4Ni0.8V0.8−xAlx (x = 0.0, 0.02, 0.4 and 0.6) alloys. Mater. Chem. Phys. 2003, 77, 1–5. [Google Scholar] [CrossRef]
- Li, L.; Wang, W.; Fan, X.; Jin, X.; Wang, H.; Lei, Y.; Wang, Q.; Chen, L. Microstructure and electrochemical behavior of Cr-added V2.1TiNi0.4Zr0.06Cr0.152 hydrogen storage electrode alloy. Int. J. Hydrog. Energy 2007, 32, 2434–2438. [Google Scholar] [CrossRef]
- Zhu, Y.F.; Pan, H.G.; Wang, G.Y.; Gao, M.X.; Ma, J.X.; Chen, C.P.; Wang, Q.D. Phase structure, crystallography and electrochemical properties of Laves phase compounds Ti0.8Zr0.2V1.6Mn0.8−xMxNi0.6 (M = Fe, Al, Cr, Co). Int. J. Hydrog. Energy 2001, 26, 807–816. [Google Scholar] [CrossRef]
- Züttle, A.; Meli, F.; Schlapbach, L. Effects of electrode compacting additives on the cycle life and high-rate dischargeability of Zr(V0.25Ni0.75)2 metal hydride electrodes in alkaline solution. J. Alloys Compd. 1994, 206, 31–38. [Google Scholar] [CrossRef]
- Young, K.; Ouchi, T.; Huang, B.; Reichman, B.; Fetcenko, M.A. Studies of copper as a modifier in C14-predominant AB2 metal hydride alloys. J. Power Sources 2012, 204, 205–212. [Google Scholar] [CrossRef]
- Young, K.; Ouchi, T.; Huang, B.; Reichman, B.; Fetcenko, M.A. The structure, hydrogen storage, and electrochemical properties of Fe-doped C14-predominating AB2 metal hydride alloys. Int. J. Hydrog. Energy 2011, 36, 12296–12304. [Google Scholar] [CrossRef]
- Young, K.; Ouchi, T.; Huang, B.; Reichman, B. Effect of molybdenum content on structural, gaseous storage, and electrochemical properties of C14-predominant AB2 metal hydride alloys. J. Power Sources 2011, 196, 8815–8821. [Google Scholar] [CrossRef]
- Erika, T.; Ricardo, F.; Fabricio, R.; Fernando, Z.; Verónica, D. Electrochemical and metallurgical characterization of ZrCr1−xNiMox AB2 metal hydride alloys. J. Alloys Compd. 2015, 649, 267–274. [Google Scholar] [CrossRef]
- Young, K.; Ouchi, T.; Lin, X.; Reichman, B. Effects of Zn-addition to C14 metal hydride alloys and comparisons to Si, Fe, Cu, Y, and Mo-additives. J. Alloys Compd. 2016, 655, 50–59. [Google Scholar] [CrossRef]
- Ruiz, F.C.; Peretti, H.A.; Visintin, A.; Triaca, W.E. A study on ZrCrNiPtx alloys as negative electrode components for NiMH batteries. Int. J. Hydrog. Energy 2011, 36, 901–906. [Google Scholar] [CrossRef]
- Ruiz, F.C.; Peretti, H.A.; Visintin, A. Electrochemical hydrogen storage in ZrCrNiPdx alloys. Int. J. Hydrog. Energy 2010, 35, 5963–5967. [Google Scholar] [CrossRef]
- Liu, Y.; Zhang, S.; Li, R.; Gao, M.; Zhong, K.; Miao, H.; Pan, H. Electrochemical performance of the Pd-added Ti-V-based hydrogen storage alloy. Int. J. Hydrog. Energy 2008, 33, 728–734. [Google Scholar] [CrossRef]
- Young, K.; Wong, D.F.; Nei, J.; Reichman, B. Electrochemical properties of hypo-stoichiometric Y-doped AB2 metal hydride alloys at ultra-low temperature. J. Alloys Compd. 2015, 643, 17–27. [Google Scholar] [CrossRef]
- Qiao, Y.; Zhao, M.; Zhu, X.; Cao, G. Microstructure and some dynamic performances of Ti0.17Zr0.08V0.24RE0.01Cr0.1Ni0.3 (RE = Ce, Dy) hydrogen storage electrode alloys. Int. J. Hydrog. Energy 2007, 32, 3427–3434. [Google Scholar] [CrossRef]
- Young, K.; Wong, D.F.; Ouchi, T.; Huang, B.; Reichman, B. Effects of La-addition to the structure, hydrogen storage, and electrochemical properties of C14 metal hydride alloys. Electrochim. Acta 2015, 174, 815–825. [Google Scholar] [CrossRef]
- Sun, J.C.; Li, S.; Ji, S.J. The effects of the substitution of Ti and La for Zr in ZrMn0.7V0.2Co0.1Ni1.2 hydrogen storage alloys on the phase structure and electrochemical properties. J. Alloys Compd. 2007, 446–447, 630–634. [Google Scholar] [CrossRef]
- Wong, D.F.; Young, K.; Nei, J.; Wang, L.; Ng, K.Y.S. Effects of Nd-addition on the structural, hydrogen storage, and electrochemical properties of C14 metal hydride alloys. J. Alloys Compd. 2015, 647, 507–518. [Google Scholar] [CrossRef]
- Young, K.; Ouchi, T.; Huang, B.; Reichman, B.; Blankensip, R. Improvement in −40 °C electrochemical properties of AB2 metal hydride alloy by silicon incorporation. J. Alloys Compd. 2013, 575, 65–72. [Google Scholar] [CrossRef]
- Li, S.; Wen, B.; Li, X.; Zhai, J. Structure and electrochemical property of ball-milled Ti0.26Zr0.07Mn0.1Ni0.33V0.24 alloy with 3 mass% B. J. Alloys Compd. 2016, 654, 580–585. [Google Scholar] [CrossRef]
- Johnson, R.L.; Hoffmann, R.Z. Structure-bonding relationships in the Laves Phases. Z. Anorg. Allg. Chem. 1992, 616, 105–120. [Google Scholar] [CrossRef]
- Pearson, W.B. The Crystal Chemistry and Physics of Metals and Alloys; Wiley & Sons: New York, NY, USA, 1971; pp. 514–515. [Google Scholar]
- Chen, C.; Wang, C.; Lee, P.; Lin, C. Hydrogen absorption performance of mechanically alloys (Mg2Ni)100−xTix powder. Mater. Trans. 2007, 48, 3170–3175. [Google Scholar] [CrossRef]
- Gupta, A.; Shervani, S.; Faisal, M.; Balani, K.; Subramaniam, A. Hydrogen storage in Mg-Mg2Ni-carbon hybrids. J. Alloys Compd. 2015, 601, 280–288. [Google Scholar] [CrossRef]
- Zadorozhnyy, V.Y.; Menjo, M.; Zadogozhnyy, M.Y.; Kaloshkin, S.D.; Louzguine-Luzgin, D.D. Hydrogen sorption properties of nanostructured bulk Mg2Ni intermetallic compound. J. Alloys Compd. 2014, 586, S400–S404. [Google Scholar] [CrossRef]
- Zhang, Y.; Li, C.; Cai, Y.; Hu, F.; Liu, Z.; Guo, S. Highly improved electrochemical hydrogen performances of the Nd-Cu-added Mg2Ni-type alloys by melt spinning. J. Alloys Compd. 2014, 584, 81–86. [Google Scholar] [CrossRef]
- Zhu, Y.; Yang, C.; Zhu, J.; Li, L. Structural and electrochemical hydrogen storage properties of Mg2Ni-based alloys. J. Alloys Compd. 2011, 509, 5309–5314. [Google Scholar] [CrossRef]
- Cui, N.; Luo, J.L.; Chuang, K.T. Nickel-metal hydride (Ni-MH) battery using Mg2Ni-type hydrogen storage alloy. J. Alloys Compd. 2000, 302, 218–226. [Google Scholar] [CrossRef]
- Zhang, Y.; Zhang, G.; Yang, T.; Hou, Z.; Guo, S.; Qi, Y.; Zhao, D. Electrochemical and hydrogen absorption/desorption properties of nanocrystalline Mg2Ni-type alloys prepared by melt spinning. Rare Metal Mater. Eng. 2012, 41, 2069–2074. [Google Scholar]
- Zhang, Y.; Ren, H.; Hou, Z.; Zhang, G.; Li, X.; Wang, X. Investigation on gaseous and electrochemical hydrogen storage kinetics of as-quenched nanocrystalline Mg2Ni-type alloys. Rare Metal Mater. Eng. 2012, 41, 1516–1521. [Google Scholar]
- Zhang, Y.; Li, B.; Ren, H.; Hu, F.; Zhang, G.; Guo, S. Gaseous and electrochemical hydrogen storage kinetics of nanocrystalline Mg2Ni-type alloy prepared by rapid quenching. J. Alloys Compd. 2011, 509, 5604–5610. [Google Scholar] [CrossRef]
- Shao, H.; Li, X. Effect of nanostructure and partial substitution on gas absorption and electrochemical properties in Mg2Ni-based alloys. J. Alloys Compd. 2016, 667, 191–197. [Google Scholar] [CrossRef]
- Massalski, T.B. Binary Alloy Phase Diagram, 2nd ed.; ASM International: Materials Park, OH, USA, 1990; pp. 2529–2530. [Google Scholar]
- Ovshinsky, S.R.; Fetcenko, M.A. Electrochemical Hydrogen Storage Alloys and Batteries Fabricated from Mg Containing Base Alloys. U.S. Patent 5,506,069, 9 April 1996. [Google Scholar]
- Yan, S.; Young, K.; Ng, S. Effects of salt additives to the KOH electrolyte used in Ni/MH batteries. Batteries 2015, 1, 54–73. [Google Scholar] [CrossRef]
- Young, K.; Ng, S.K.Y.; Bendersky, L.A. A technical report of robust affordable next generation energy storage system-BASF program. Batteries 2016, 2. [Google Scholar] [CrossRef]
- Young, K.; Ouchi, T.; Huang, B.; Fetcenko, M.A. Effects of B, Fe, Gd, Mg, and C on the structure, hydrogen storage, and electrochemical properties of vanadium-free AB2 metal hydroxide alloy. J. Alloys Compd. 2012, 511, 242–250. [Google Scholar] [CrossRef]
- Liu, Y.; Cao, Y.; Huang, L.; Gao, M.; Pan, H. Rare earth-Mg-Ni-based hydrogen storage alloys as negative electrode materials for Ni/MH batteries. J. Alloys Compd. 2011, 509, 675–686. [Google Scholar] [CrossRef]
- Nei, J.; Young, K.; Salley, S.O.; Ng, K.Y.S. Effects of annealing on Zr8Ni19X2 (X = Ni, Mg, Al, Sc, V, Mn, Co, Sn, La, and Hf): Structural characteristics. J. Alloys Compd. 2012, 516, 144–152. [Google Scholar] [CrossRef]
- Nei, J.; Young, K.; Salley, S.O.; Ng, K.Y.S. Effects of annealing on Zr8Ni19X2 (X = Ni, Mg, Al, Sc, V, Mn, Co, Sn, La, and Hf): Hydrogen storage and electrochemical properties. Int. J. Hydrog. Energy 2012, 37, 8418–8427. [Google Scholar] [CrossRef]
- Young, K.; Fetcenko, M.A.; Li, F.; Ouchi, T. Structural, thermodynamics, and electrochemical properties of TixZr1−x(VNiCrMnCoAl)2 C14 Laves phase alloys. J. Alloys Compd. 2008, 464, 238–247. [Google Scholar] [CrossRef]
- Young, K.; Fetcenko, M.A.; Koch, J.; Morii, K.; Shimizu, T. Studies of Sn, Co, Al, and Fe additives in C14/C15 Laves alloys for NiMH battery application by orthogonal arrays. J. Alloys Compd. 2009, 486, 559–569. [Google Scholar] [CrossRef]
- Nei, J.; Young, K.; Salley, S.O.; Ng, K.Y.S. Determination of C14/C15 phase abundance in Laves phase alloys. Mat. Chem. Phys. 2012, 136, 520–527. [Google Scholar] [CrossRef]
- Zhu, Y.; Pan, H.; Gao, M.; Ma, J.; Lei, Y.; Wang, Q. Electrochemical studies on the Ti-Zr-V-Mn-Cr-Ni hydrogen storage electrode alloys. Int. J. Hydrog. Energy 2003, 28, 311–316. [Google Scholar] [CrossRef]
- Pan, H.; Zhu, Y.; Gao, M.; Liu, Y.; Li, R.; Lei, Y.; Wang, Q. A study on the cycling stability of the Ti-V-based hydrogen storage electrode alloys. J. Alloys Compd. 2004, 364, 271–279. [Google Scholar] [CrossRef]
- Chen, L.; Wu, F.; Tong, M.; Chen, D.M.; Long, R.B.; Shang, Z.Q.; Liu, H.; Sun, W.S.; Yang, K.; Wang, L.B.; et al. Advanced nanocrystalline Zr-based AB2 hydrogen storage electrode materials for NiMH EV batteries. J. Alloys Compd. 1999, 293–295, 508–520. [Google Scholar] [CrossRef]
- Li, Z.P.; Higuchi, E.; Liu, B.H.; Suda, S. Electrochemical properties and characteristics of a fluorinated AB2-alloy. J. Alloys Compd. 1999, 293–295, 593–600. [Google Scholar] [CrossRef]
- Young, K.; Ouchi, T.; Yang, J.; Fetcenko, M.A. Studies of off-stoichiometric AB2 metal hydride alloy: Part 1. Structural characteristics. Int. J. Hydrog. Energy 2011, 36, 11137–11145. [Google Scholar] [CrossRef]
- Lee, S.M.; Lee, H.; Yu, J.S.; Fateev, G.A.; Lee, J.Y. The activation characteristics of a Zr-based hydrogen storage alloy electrode surface-modified by ball-milling process. J. Alloys Compd. 1999, 292, 258–265. [Google Scholar] [CrossRef]
- Liu, Y.; Young, K. Microstructure investigation on metal hydride alloys by electron backscatter diffraction technique. Batteries 2016. to be submitted for publication. [Google Scholar]
- Boettinger, W.J.; Newbury, D.E.; Wang, K.; Bendersky, L.A.; Chiu, C.; Kattner, U.R.; Young, K.; Chao, B. Examination of multiphase (Zr,Ti)(V,Cr,Mn,Ni)2 Ni-MH electrode alloys: Part I. Dendritic solidification structure. Metal. Mater Trans. A 2010, 41, 2033–2047. [Google Scholar] [CrossRef]
- Young, K. Stoichiometry in Inter-Metallic Compounds for Hydrogen Storage Applications. In Stoichiometry and Materials Science—When Numbers Matter; Innocenti, A., Kamarulzaman, N., Eds.; Intech: Rijeka, Croatia, 2012; pp. 162–164. [Google Scholar]
- Bendersky, L.A.; Wang, K.; Boettinger, W.J.; Newbury, D.E.; Young, K.; Chao, B. Examination of multiphase (Zr,Ti)(V,Cr,Mn,Ni)2 Ni-MH electrode alloys: Part II. Solid-state transformation of the interdendric B2 phase. Metal. Mater Trans. A 2010, 41, 1891–1906. [Google Scholar] [CrossRef]
- Pearson, W.B. A Handbook of Lattice Spacings and Structures of Metals and Alloys: International Series of Monographs on Metal Physics and Physical Metallurgy; Elsevier: Philadelphia, PA, USA, 2013; Volume 4, p. 693. [Google Scholar]
- Shaltiel, D.; Jacob, I.; Davidov, D. Hydrogen absorption and desorption properties of AB2 Laves-phase pseudobinary compounds. J. Less Common Met. 1977, 53, 117–131. [Google Scholar] [CrossRef]
- Jacob, I.; Shaltiel, D. Hydrogen sorption properties of some AB2 Laves phase compounds. J. Less Common Met. 1979, 65, 117–128. [Google Scholar] [CrossRef]
- Qian, S.; Northwood, D.O. Thermodynamic characterization of Zr(FexCr1−x) systems. J. Less Common Met. 1989, 147, 149–159. [Google Scholar] [CrossRef]
- Perevesenzew, A.; Lanzel, E.; Eder, O.J.; Tuscher, E.; Weinzierl, P. Thermodynamics and kinetics of hydrogen absorption in intermetallic compounds Zr(Cr1−xVx)2. J. Less Common Met. 1988, 143, 39–47. [Google Scholar] [CrossRef]
- Park, J.; Lee, J. Thermodynamic properties of the Zr0.8Ti0.2(MnxCr1−x)Fe system. J. Less Common Met. 1991, 167, 245–253. [Google Scholar]
- Drašner, A.; Blažina, Ž. On the structural and hydrogen desorption properties of the Zr(Cr1−xCux)2 alloys. J. Less Common Met. 1991, 175, 103–108. [Google Scholar] [CrossRef]
- Schlapbach, L.; Züttel, A. Hydrogen-storage materials for mobile applications. Nature 2001, 414, 353–358. [Google Scholar] [CrossRef] [PubMed]
- Züttel, A. Materials for hydrogen storage. Mater. Today 2003, 6, 24–33. [Google Scholar] [CrossRef]
- Sastri, M.V.C. Introduction to Metal Hydrides: Basic Chemistry and Thermodynamics of Their Formation. In Metal Hydride; Sastri, M.V.C., Viswanathan, B., Murthy, S.S., Eds.; Springer-Verlag: Berlin, Germany, 1998; p. 5. [Google Scholar]
- Scholtus, N.A.; Hall, W.K. Hysteresis in the palladium-hydrogen system. J. Chem. Phys. 1963, 39, 868–870. [Google Scholar] [CrossRef]
- Makenas, B.J.; Birnbaum, H.K. Phase changes in the niobium-hydrogen system 1: Accommodation effcts during hydrde precipitation. Acta Metal. Mater. 1980, 28, 979–988. [Google Scholar] [CrossRef]
- Balasubramaniam, R. Accommodation effects during room temperature hydrogen transformations in the niobium-hydrogen system. Acta Metal. Mater. 1993, 41, 3341–3349. [Google Scholar] [CrossRef]
- Young, K.; Ouchi, T.; Fetcenko, M.A. Pressure-composition-temperature hysteresis in C14 Laves phase alloys: Part 1. Simple ternary alloys. J. Alloys Compd. 2009, 480, 428–433. [Google Scholar] [CrossRef]
- Lide, D.R. CRC Handbook of Chemistry and Physics, 74 ed.; CRC Press: Boca Raton, FL, USA, 1993; pp. 6–22. [Google Scholar]
- Kim, S.; Lee, J.; Park, H. A study of the activation behaviour of ZrCrNiLa metal hydride electrodes in alkaline solution. J. Alloys Compd. 1994, 205, 225–229. [Google Scholar] [CrossRef]
- Jung, J.; Lee, K.; Lee, J. The activation mechanism of Zr-based alloy electrodes. J. Alloys Compd. 1995, 226, 166–169. [Google Scholar] [CrossRef]
- Park, H.Y.; Cho, W.I.; Cho, B.W.; Jang, H.; Lee, S.R.; Yun, K.S. Effect of fluorination on the lanthanum-doped AB2-type metal hydride electrodes. J. Power Sources 2001, 92, 149–156. [Google Scholar] [CrossRef]
- Park, H.Y.; Chang, I.; Cho, W.I.; Cho, B.W.; Jang, H.; Lee, S.R.; Yun, K.S. Electrode characteristics of the Cr and La doped AB2-type hydrogen storage alloys. Int. J. Hydrog. Energy 2001, 26, 949–955. [Google Scholar] [CrossRef]
- Wang, L.; Young, K.; Meng, T.; English, N.; Yasuoka, S. Partial substitution of cobalt for nickel in mixed area earth metal based superlattice hydrogen absorbing alloy—Part 2 battery performance and failure analysis. J. Alloys Compd. 2016, 664, 417–427. [Google Scholar] [CrossRef]
- Nei, J.; Young, K.; Regmi, R.; Lawes, G.; Salley, S.O.; Ng, K.Y.S. Gaseous phase hydrogen storage and electrochemical properties of Zr8Ni21, Zr7Ni10, Zr9Ni11, and ZrNi metal hydride alloys. Int. J. Hydrog. Energy 2012, 37, 16042–16055. [Google Scholar] [CrossRef]
- Zlatanova, Z.; Spassov, T.; Eggeler, G.; Spassova, M. Synthesis and hydriding/dehydriding properties of Mg2Ni-AB (AB = TiNi or TiFe) nanocomposites. Int. J. Hydrog. Energy 2011, 36, 7559–7566. [Google Scholar] [CrossRef]
- Balcerzak, M. Electrochemical and structural studies on Ti-Zr-Ni and Ti-Zr-Ni-Pd alloys and composites. J. Alloys Compd. 2016, 658, 576–587. [Google Scholar] [CrossRef]


| Alloy | Source | Zr | Ti | V | Cr | Mn | Co | Ni | Mg | Sn | Al | e/a | B/A |
|---|---|---|---|---|---|---|---|---|---|---|---|---|---|
| Mg0 | Design | 21.5 | 12.0 | 10.0 | 7.5 | 8.1 | 8.0 | 32.2 | 0.0 | 0.3 | 0.4 | 6.82 | 1.99 |
| ICP | 21.5 | 12.0 | 10.0 | 7.5 | 8.1 | 8.0 | 32.2 | 0.0 | 0.4 | 0.3 | 6.82 | 1.99 | |
| Mg1 | Design | 21.5 | 11.4 | 10.0 | 7.5 | 8.1 | 8.0 | 31.8 | 1.0 | 0.3 | 0.4 | 6.78 | 1.95 |
| ICP | 21.0 | 11.3 | 10.0 | 7.5 | 8.3 | 8.1 | 32.2 | 0.6 | 0.3 | 0.7 | 6.82 | 2.04 | |
| Mg2 | Design | 21.5 | 10.8 | 10.0 | 7.5 | 8.1 | 8.0 | 31.4 | 2.0 | 0.3 | 0.4 | 6.73 | 1.92 |
| ICP | 22.5 | 10.9 | 9.9 | 7.2 | 8.2 | 8.0 | 31.8 | 0.8 | 0.3 | 0.4 | 6.78 | 1.92 | |
| Mg3 | Design | 21.5 | 10.2 | 10.0 | 7.5 | 8.1 | 8.0 | 31.0 | 3.0 | 0.3 | 0.4 | 6.69 | 1.88 |
| ICP | 21.5 | 10.5 | 10.3 | 7.3 | 8.4 | 8.4 | 32.0 | 0.7 | 0.3 | 0.6 | 6.82 | 2.06 | |
| Mg4 | Design | 21.5 | 9.6 | 10.0 | 7.5 | 8.1 | 8.0 | 30.6 | 4.0 | 0.3 | 0.4 | 6.65 | 1.85 |
| ICP | 21.0 | 9.6 | 9.8 | 6.9 | 8.3 | 8.2 | 34.7 | 0.6 | 0.3 | 0.6 | 6.96 | 2.21 | |
| Mg5 | Design | 21.5 | 9.0 | 10.0 | 7.5 | 8.1 | 8.0 | 30.2 | 5.0 | 0.3 | 0.4 | 6.60 | 1.82 |
| ICP | 20.5 | 8.6 | 9.6 | 7.0 | 8.0 | 7.9 | 36.7 | 0.8 | 0.3 | 0.6 | 7.05 | 2.34 |
| Alloy | Mg0 | Mg1 | Mg2 | Mg3 | Mg4 | Mg5 |
| C14 a (Å) | 4.9545 | 4.9566 | 4.9727 | 4.9593 | 4.9555 | 4.9473 |
| C14 c (Å) | 8.0733 | 8.0781 | 8.1082 | 8.0846 | 8.0738 | 8.0586 |
| C14 a/c | 0.6137 | 0.6136 | 0.6133 | 0.6134 | 0.6138 | 0.6139 |
| C14 unit cell volume (Å3) | 171.63 | 171.87 | 173.64 | 172.20 | 171.71 | 170.82 |
| C14 crystallite size (Å) | 685 | 518 | 400 | 385 | 398 | 373 |
| C15 a (Å) | 6.9932 | 6.9894 | 7.0098 | 6.9926 | 6.9770 | 6.9628 |
| TiNi a (Å) | 3.0667 | 3.0674 | 3.0914 | 3.0687 | 3.0590 | ND |
| Mg-related cubic a (Å) | ND | 4.6553 | 4.6655 | 4.6670 | 4.6567 | 4.6711 |
| Alloy | C14 Abundance (%) | C15 Abundance (%) | TiNi Abundance (%) | Cubic Abundance (%) |
|---|---|---|---|---|
| Mg0 | 93.7 | 5.2 | 1.2 | ND |
| Mg1 | 81.8 | 15.9 | 2.0 | 0.3 |
| Mg2 | 88.3 | 7.9 | 3.5 | 0.3 |
| Mg3 | 72.0 | 25.1 | 2.4 | 0.5 |
| Mg4 | 56.5 | 42.2 | 1.0 | 0.4 |
| Mg5 | 36.9 | 62.6 | ND | 0.5 |
| Area | Zr | Ti | V | Cr | Mn | Co | Ni | Mg | Sn | Al | e/a | B/A | Phase |
|---|---|---|---|---|---|---|---|---|---|---|---|---|---|
| Mg1-1 | 20.4 | 10.5 | 11.1 | 8.6 | 8.8 | 8.7 | 31.0 | 0.2 | 0.2 | 0.5 | 6.83 | 2.22 | C14 |
| Mg1-2 | 21.0 | 12.2 | 6.9 | 4.2 | 6.2 | 6.1 | 41.9 | 0.1 | 0.8 | 0.6 | 7.15 | 2.00 | C15 |
| Mg1-3 | 16.9 | 23.4 | 2.4 | 1.3 | 3.1 | 5.9 | 45.2 | 0.3 | 1.1 | 0.4 | 7.14 | 1.33 | TiNi |
| Mg1-4 | 9.9 | 8.4 | 4.6 | 2.7 | 3.6 | 3.6 | 20.0 | 46.6 | 0.4 | 0.2 | 4.65 | 0.54 | Mg-cubic |
| Mg1-5 | 27.5 | 12.1 | 2.2 | 1.0 | 2.5 | 3.2 | 42.0 | 0.3 | 8.9 | 0.3 | 6.79 | 1.05 | ZrNi |
| Mg2-1 | 21.9 | 9.9 | 11.9 | 8.0 | 9.1 | 8.7 | 29.4 | 0.3 | 0.2 | 0.6 | 6.74 | 2.12 | C14 |
| Mg2-2 | 22.8 | 11.6 | 6.7 | 3.7 | 6.4 | 6.2 | 40.9 | 0.4 | 0.8 | 0.5 | 7.08 | 1.87 | C15 |
| Mg2-3 | 20.7 | 21.4 | 1.4 | 0.5 | 2.3 | 6.0 | 45.5 | 1.2 | 0.5 | 0.5 | 7.09 | 1.24 | TiNi |
| Mg2-4 | 12.9 | 5.7 | 2.0 | 1.0 | 2.0 | 2.3 | 16.1 | 57.2 | 0.7 | 0.0 | 4.03 | 0.32 | Mg-cubic |
| Mg2-5 | 29.0 | 11.7 | 1.8 | 0.9 | 2.5 | 3.4 | 41.5 | 0.9 | 7.7 | 0.5 | 6.74 | 1.03 | ZrNi |
| Mg3-1 | 20.6 | 9.8 | 11.9 | 7.4 | 9.3 | 9.1 | 31.0 | 0.3 | 0.2 | 0.4 | 6.85 | 2.26 | C14 |
| Mg3-2 | 20.4 | 12.2 | 7.2 | 3.2 | 6.5 | 6.3 | 42.5 | 0.5 | 0.7 | 0.5 | 7.18 | 2.02 | C15 |
| Mg3-3 | 15.6 | 25.7 | 1.7 | 0.4 | 2.6 | 5.8 | 45.6 | 1.3 | 0.8 | 0.6 | 7.10 | 1.26 | TiNi |
| Mg3-4 | 9.2 | 2.7 | 0.4 | 0.2 | 0.5 | 0.6 | 4.2 | 82.1 | 0.1 | 0.0 | 2.66 | 0.06 | Mg-cubic |
| Mg3-5 | 30.7 | 9.4 | 1.0 | 0.6 | 1.9 | 2.2 | 41.1 | 1.1 | 11.7 | 0.4 | 6.63 | 0.89 | ZrNi |
| Mg3-6 | 95.2 | 1.8 | 0.3 | 0.2 | 0.4 | 0.3 | 1.7 | 0.1 | 0.0 | 0.0 | 4.13 | 0.03 | Zr |
| Mg3-7 | 78.1 | 5.4 | 2.4 | 1.3 | 1.9 | 2.0 | 8.4 | 0.2 | 0.2 | 0.0 | 4.70 | 0.19 | ZrO2 |
| Mg4-1 | 22.4 | 7.1 | 12.1 | 12.3 | 10.1 | 9.9 | 25.4 | 0.3 | 0.1 | 0.3 | 6.68 | 2.36 | C14 |
| Mg4-2 | 19.3 | 12.6 | 7.9 | 3.9 | 6.7 | 6.6 | 41.7 | 0.3 | 0.5 | 0.5 | 7.18 | 2.11 | C15 |
| Mg4-3 | 13.8 | 26.8 | 2.0 | 0.6 | 3.0 | 5.8 | 45.8 | 0.7 | 1 | 0.5 | 7.14 | 1.31 | TiNi |
| Mg4-4 | 7.1 | 8.9 | 2.0 | 0.9 | 2.1 | 2.6 | 19.6 | 56.0 | 0.6 | 0.1 | 4.28 | 0.39 | Mg-cubic |
| Mg4-5 | 26.6 | 11.5 | 2.7 | 1.1 | 3.1 | 2.8 | 42.8 | 0.6 | 8.4 | 0.4 | 6.83 | 1.12 | ZrNi |
| Mg4-6 | 95.1 | 1.6 | 0.3 | 0.2 | 0.3 | 0.3 | 1.9 | 0.2 | 0.0 | 0.0 | 4.14 | 0.03 | Zr |
| Mg5-1 | 21.8 | 6.3 | 11.1 | 11.9 | 9.4 | 9.8 | 28.8 | 0.3 | 0.1 | 0.4 | 6.84 | 2.52 | C14 |
| Mg5-2 | 17.6 | 11.7 | 8.6 | 4.0 | 7.2 | 6.4 | 42.8 | 0.7 | 0.4 | 0.6 | 7.25 | 2.33 | C15 |
| Mg5-3 | 8.4 | 28.8 | 3.3 | 0.8 | 3.9 | 6.1 | 45.4 | 1.0 | 1.2 | 1.0 | 7.16 | 1.41 | TiNi |
| Mg5-4 | 12.9 | 8.0 | 3.0 | 1.0 | 2.4 | 2.2 | 24.4 | 45.4 | 0.6 | 0.2 | 4.79 | 0.51 | Mg-cubic |
| Mg5-5 | 25.4 | 13.0 | 1.8 | 0.7 | 2.1 | 2.1 | 44.5 | 0.3 | 9.9 | 0.3 | 6.87 | 1.06 | ZrNi |
| Mg5-6 | 83.6 | 4.8 | 1.0 | 0.7 | 0.8 | 0.7 | 7.8 | 0.2 | 0.5 | 0.0 | 4.55 | 0.13 | Zr |
| Alloy | Mg0 | Mg1 | Mg2 | Mg3 | Mg4 | Mg5 |
| Maximum capacity @ 30 °C (wt%) | 1.45 | 1.42 | 1.54 | 1.41 | 1.25 | 0.89 |
| Reversible capacity @ 30 °C (wt%) | 1.32 | 1.32 | 1.33 | 1.30 | 1.16 | 0.87 |
| Desorption pressure @ 0.75 wt%, 30 °C (MPa) | 0.078 | 0.096 | 0.026 | 0.102 | 0.246 | 1.203 |
| SF @ 30 °C | 0.60 | 0.54 | 0.55 | 0.51 | 0.38 | 0.18 |
| PCT hysteresis @ 0.75 wt%, 30 °C | 0.04 | 0.05 | 0.10 | 0.01 | 0.06 | 0.02 |
| −ΔHh (kJ·mol−1) | 32.0 | 32.2 | 36.2 | 35.2 | 31.2 | - |
| −ΔSh (J·mol−1·K−1) | 104 | 106 | 108 | 116 | 110 | - |
| Alloy | Mg0 | Mg1 | Mg2 | Mg3 | Mg4 | Mg5 |
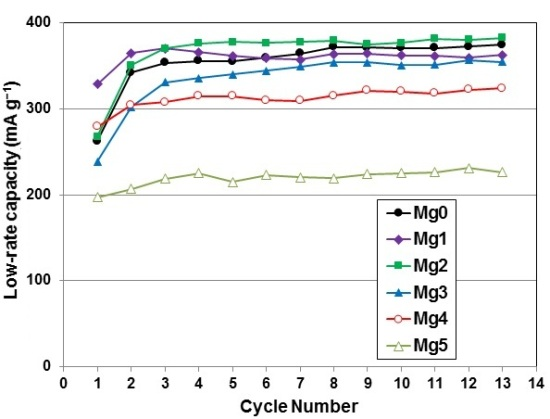
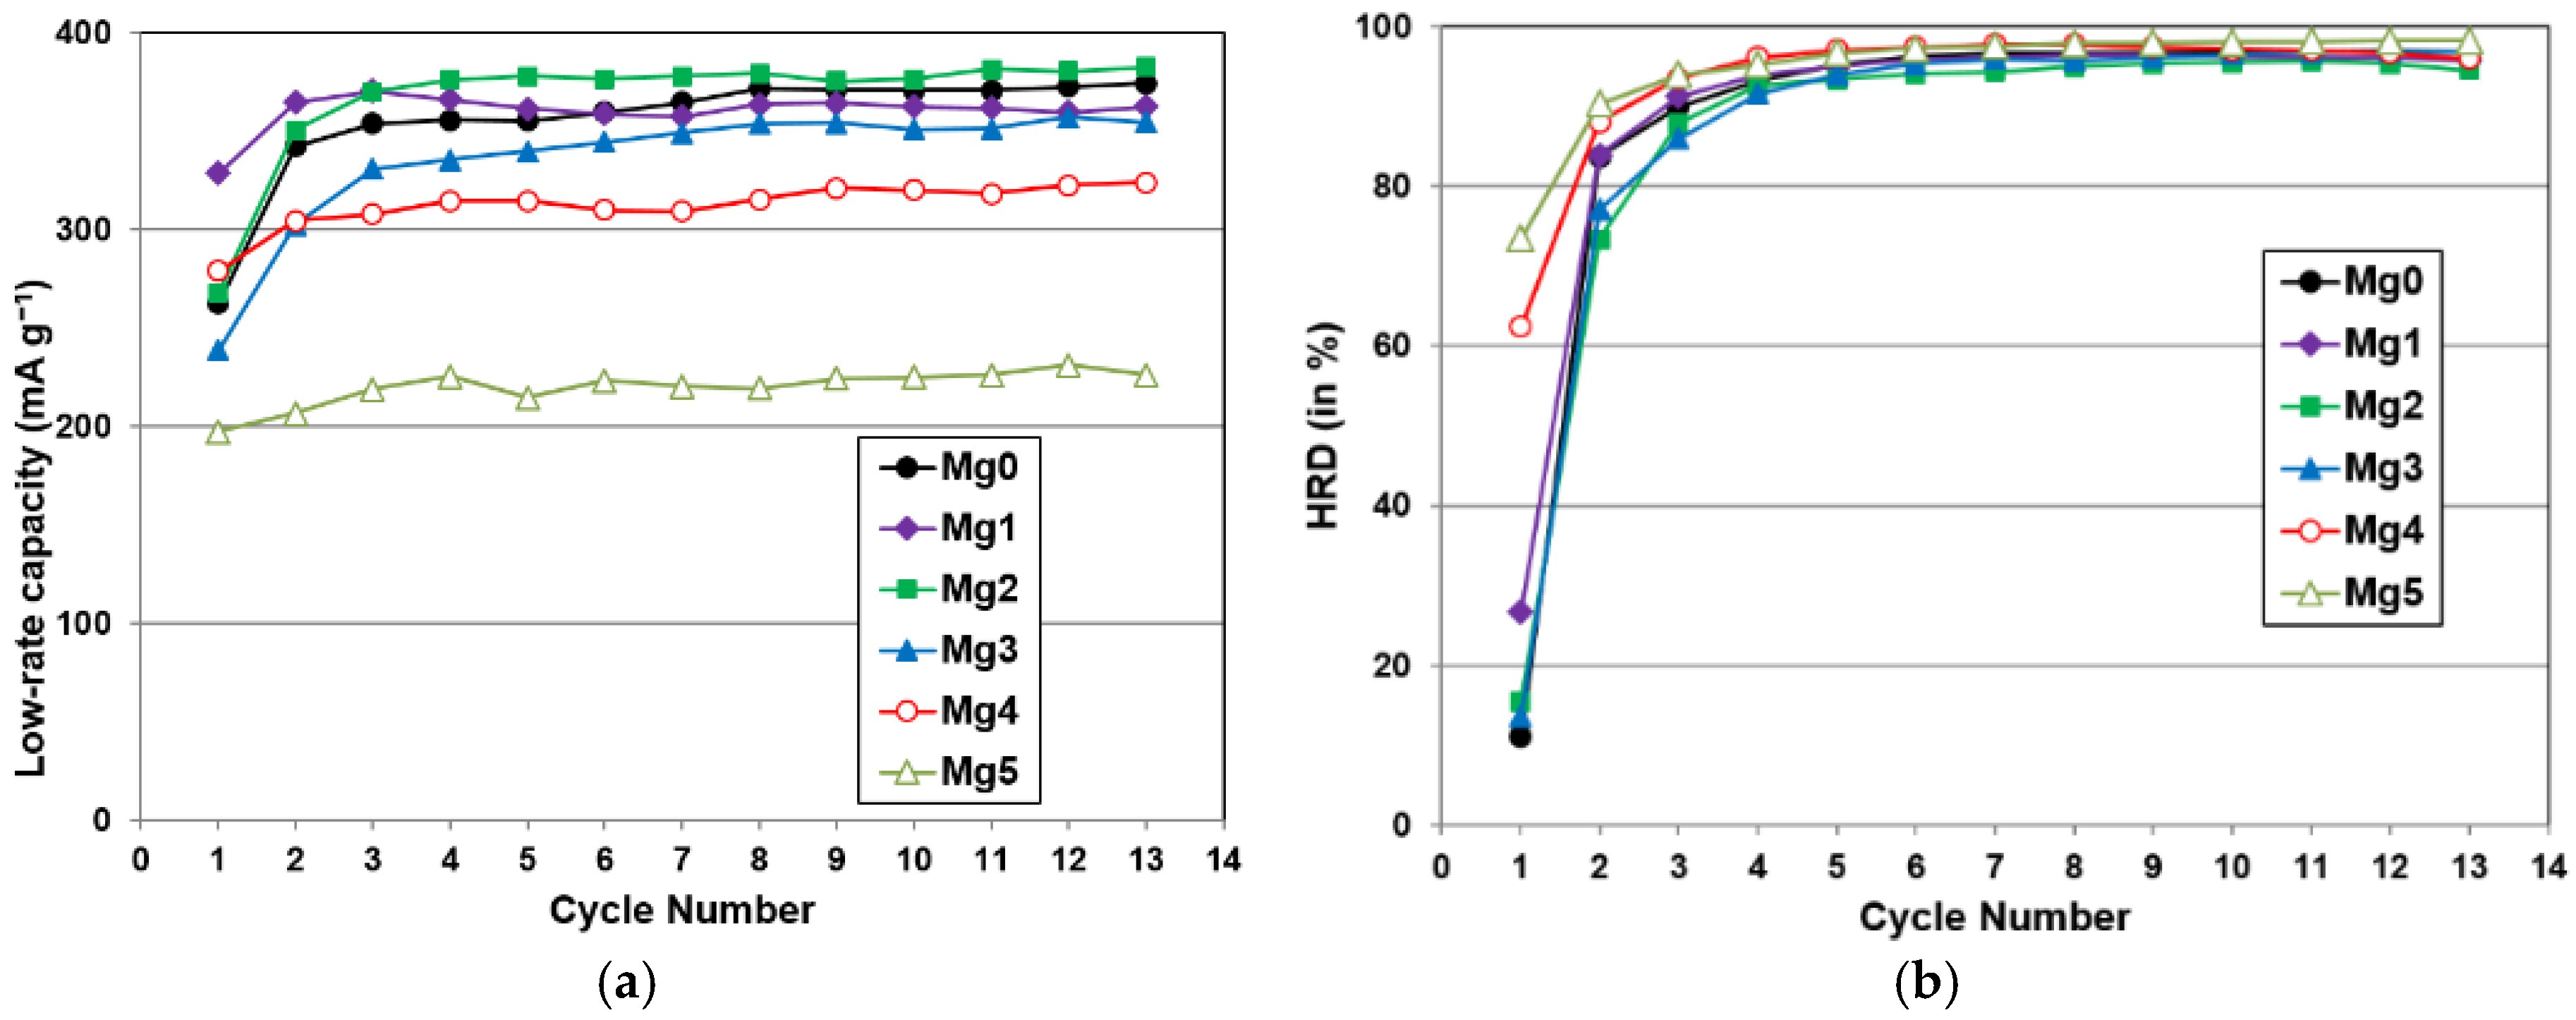
| 10th cycle capacity @ 50 mA·g−1 (mAh·g−1) | 346 | 327 | 360 | 339 | 311 | 221 |
| 10th cycle capacity @ 4 mA·g−1 (mAh·g−1) | 366 | 362 | 377 | 351 | 320 | 225 |
| HRD @ 10th cycle | 0.94 | 0.96 | 0.96 | 0.97 | 0.97 | 0.98 |
| Number of activation cycles to reach 90% HRD | 8 | 3 | 4 | 4 | 3 | 2 |
| Diffusion coefficient D (10−10 cm2·s−1) | 2.5 | 1.3 | 1.2 | 1.8 | 2.8 | 2.9 |
| Exchange current Io (mA·g−1) | 22.5 | 31.6 | 35.8 | 34.7 | 27.4 | 25.9 |
| Ms (emu·g−1) | 0.0372 | 0.0388 | 0.0148 | 0.0598 | 0.0730 | 0.0563 |
| H1/2 (kOe) | 0.111 | 0.261 | 0.260 | 0.290 | 0.140 | 0.118 |
| Alloy | R @ −40 °C (Ω·g) | C @ −40 °C (Farad·g−1) | R @ RT (Ω·g) | C @ RT (Farad·g−1) |
|---|---|---|---|---|
| Mg0 | 29 | 0.24 | 0.32 | 0.34 |
| Mg1 | 38 | 0.23 | 0.52 | 0.45 |
| Mg2 | 130 | 0.22 | 0.56 | 0.39 |
| Mg3 | 118 | 0.21 | 0.70 | 0.38 |
| Mg4 | 90 | 0.21 | 0.92 | 0.30 |
| Mg5 | 148 | 0.15 | 1.44 | 0.23 |
| Property | Ni Content | Ti Content | C14 Abundance | TiNi Abundance | B/A | e/a |
| B/A | 0.92 | 0.79 | 0.94 | 0.72 | 1.00 | 0.96 |
| C14 unit cell volume | 0.51 | 0.19 | 0.40 | 0.91 | 0.63 | 0.57 |
| C14 crystallite size | 0.17 | 0.61 | 0.42 | 0.00 | 0.20 | 0.16 |
| C14 abundance | 0.88 | 0.95 | 1.00 | 0.49 | 0.94 | 0.90 |
| Maximum capacity | 0.94 | 0.76 | 0.88 | 0.71 | 0.93 | 0.94 |
| Reversible capacity | 0.95 | 0.80 | 0.87 | 0.62 | 0.87 | 0.92 |
| Plateau pressure | 0.84 | 0.68 | 0.75 | 0.57 | 0.76 | 0.80 |
| Low rate capacity | 0.93 | 0.79 | 0.88 | 0.64 | 0.90 | 0.91 |
| HRD | 0.45 | 0.85 | 0.76 | 0.08 | 0.55 | 0.46 |
| D | 0.61 | 0.31 | 0.43 | 0.80 | 0.59 | 0.66 |
| Io | 0.25 | 0.01 | 0.05 | 0.70 | 0.19 | 0.26 |
| R @ −40 °C | 0.21 | 0.57 | 0.37 | 0.00 | 0.16 | 0.18 |
| C @ −40 °C | 0.76 | 0.86 | 0.84 | 0.33 | 0.72 | 0.72 |
| Ms | 0.34 | 0.36 | 0.49 | 0.41 | 0.56 | 0.43 |
| H1/2 | 0.44 | 0.09 | 0.15 | 0.69 | 0.30 | 0.43 |
© 2016 by the authors; licensee MDPI, Basel, Switzerland. This article is an open access article distributed under the terms and conditions of the Creative Commons by Attribution (CC-BY) license (http://creativecommons.org/licenses/by/4.0/).
Share and Cite
Chang, S.; Young, K.-h.; Ouchi, T.; Meng, T.; Nei, J.; Wu, X. Studies on Incorporation of Mg in Zr-Based AB2 Metal Hydride Alloys. Batteries 2016, 2, 11. https://doi.org/10.3390/batteries2020011
Chang S, Young K-h, Ouchi T, Meng T, Nei J, Wu X. Studies on Incorporation of Mg in Zr-Based AB2 Metal Hydride Alloys. Batteries. 2016; 2(2):11. https://doi.org/10.3390/batteries2020011
Chicago/Turabian StyleChang, Shiuan, Kwo-hsiung Young, Taiehi Ouchi, Tiejun Meng, Jean Nei, and Xin Wu. 2016. "Studies on Incorporation of Mg in Zr-Based AB2 Metal Hydride Alloys" Batteries 2, no. 2: 11. https://doi.org/10.3390/batteries2020011