Article

User-Demand-Oriented Healthy Charging Control Strategy for EVs Based on Football Team Training Algorithm

by
Haoyi Liu
1,
Lianghui Huang
2,*,
Quan Ouyang
1,3,*,
Yujia Li
1 and
Yong Wan
1
1
College of Automation Engineering, Nanjing University of Aeronautics and Astronautics, Nanjing 211100, China
2
School of Automation and Electrical Engineering, Zhejiang University of Science and Technology, Hangzhou 310023, China
3
Provincial Engineering Research Center for New Energy Vehicle Intelligent Control and Simulation Test Technology of Sichuan, Chengdu 610039, China
*
Authors to whom correspondence should be addressed.
Batteries 2025, 11(9), 344; https://doi.org/10.3390/batteries11090344
Submission received: 15 August 2025 / Revised: 9 September 2025 / Accepted: 18 September 2025 / Published: 19 September 2025

Abstract

With the rapid development of the electric vehicle (EV) market, effective charging control is essential for enhancing user experience and preserving battery health. Across various scenarios, this work proposes a user-demand-oriented healthy charging control strategy that balances charging efficiency and battery lifespan using the football team training algorithm (FTTA). Firstly, an enhanced hybrid stacking–boosting ensemble (EHSBE) model is designed to predict user charging duration through different feature selections and a hybrid framework. Secondly, a healthy charging control strategy based on the FTTA is developed. This strategy addresses a multi-objective optimization problem, considering two charging objectives: completing the charging task and reducing energy loss, as well as three safety-related constraints. The algorithm achieves a healthy strategy through interaction and iterative refinement among potential solutions. Simulation and experimental results show that the proposed strategy significantly reduces energy loss, generating only 5.8% and 24% of the energy loss generated by the fast charging approach under two different durations. With user expectations and maintenance of battery health, the charging process is optimized so that battery life is extended by 25.7% and user demand is satisfied.

1. Introduction

The lithium-ion battery (LiB) plays a crucial role in the evolution of electric vehicles (EVs), directly impacting the vehicles’ range, lifespan, and economical practicability [1]. Given these factors, an effective charging control strategy is essential, as it can optimize charging processes and ensure that the battery operates within safe and efficient parameters [2].
A large number of battery charging strategies have been proposed [3,4]. The fundamental charging methods for LiBs encompass constant-current (CC) [5], constant-voltage (CV) [6], constant-current–constant-voltage (CCCV) [7], and pulse charging [8]. These fundamental methods are adopted due to their simplicity and high reliability, but they have limitations, such as low charging efficiency. Compared with fundamental methods, fast charging is a technology that can replenish a large amount of energy for batteries in a short time, significantly reducing charging duration through staged, higher charging currents or voltages [9,10]. Given that users generally prefer to minimize charging wait times and manufacturers benefit from enhanced product competitiveness, fast charging strategies are now widely implemented [11]. However, Yang et al. and Jiang et al. found that high voltage and current charging can lead to a rapid and significant increase in battery temperature [5,12]; this, in turn, can damage the battery structure and shorten its lifespan [13].
In contrast to fast charging strategies, healthy charging control strategies dynamically adjust charging currents based on real-time battery states and charging objectives leveraging advanced algorithms. These strategies address multiple objectives, enhancing the charging process by reducing energy losses, boosting efficiency, and mitigating battery aging. Aiming to enhance charging speed while ensuring safety, ref. [14] proposed a multi-objective optimization scheme for a five-stage charging strategy which significantly improved charging efficiency and extended battery life. To minimize temperature rise, the Lagrange multiplier method was used in [15] to combine constraint conditions with the objective function. This approach reduced temperature rise and energy loss during charging while ensuring safety. A charging control based on mean field game (MFG) theory was applied in [16]. By introducing the mean field term, the optimal charging strategy reduced battery degradation. Building on this foundation, Han et al. [17] utilized the dandelion optimization (DO) algorithm to explore the solution space, demonstrating that multi-stage charging based on the DO algorithm can shorten charging duration and lower heat loss. Further advancing the user-centric approach, a smart charging management strategy for EV batteries was proposed in [18]. Linear quadratic control (LQC) theory was employed to develop two methods that allowed users to dynamically set and achieve specific charging goals while minimizing the negative impact of charging on battery health. Ref. [19] employed a multi-objective biogeography-based optimization (M-BBO) approach to explore solution space through migration and variation between populations, identifying the optimal charging pattern that balanced charging duration, energy loss, and temperature increase.
Despite these advancements, there is still room for improvement in battery health. Existing methods often require users to set the charging duration each time and fail to recognize charging demands intelligently. Moreover, existing methods often struggle to effectively balance multiple charging objectives, which may result in reduced battery lifespan or incomplete charging tasks. The difficulty in demand prediction is due to the randomness of users’ charging habits, which makes the accuracy of predicting the charging duration insufficient [20,21,22]. In order to improve prediction accuracy, an enhanced hybrid stacking–boosting ensemble (EHSBE) model is designed. For the multi-objectives of battery health and charging demand, the football team training algorithm (FTTA) enhances global search capabilities by simulating football training stages, thereby balancing exploration and exploitation. The FTTA, though new to charging control, has been applied in power system and traffic flow optimization [23], making it a promising solution for multi-objective optimization of charging. According to the above, a healthy charging control strategy for EVs is proposed. The strategy integrates user demand predicted by the EHSBE model and utilizes the FTTA to accomplish the charging task and maintain battery health while ensuring charging safety. The contributions of this article are as follows:
  • An EHSBE model is proposed to accurately predict the user’s charging duration. This hybrid framework not only enhances the accuracy of individual models through a boosting module but also maximizes model diversity by integrating a stacking module. As a result, it delivers highly reliable and robust predictions, effectively handling diverse charging demands.
  • Distinguished from the existing majority of studies, a user-demand-oriented healthy charging control strategy is developed. Considering users’ charging durations, the strategy employs the FTTA to solve for the optimal charging current through multi-objective equations with constraints. The FTTA intelligently adjusts the charging current based on user demand to complete the charging task. Moreover, this strategy prevents overcharging, reduces heat generation, extends battery life, and avoids low user satisfaction.
  • The experiments on the hardware platform confirm the feasibility and effectiveness of the proposed strategy. Simulation and experimental results across various charging durations demonstrate that the proposed healthy charging strategy outperforms fast charging.
The remainder of this paper is organized as follows. The framework of healthy charging control strategy is provided in Section 2. The prediction of charging duration based on the EHSBE model is developed in Section 3. The battery model, charging objectives, safety-related constraints, establishment of optimization problems, and design of charging control strategies are illustrated in Section 4. Extensive simulation and experimental results are shown in Section 5.

2. Research Framework

There are two major challenges in healthy charging strategies. First, users’ charging habits vary significantly, making charging duration hard to predict. Long-term charging typically lasts several hours to meet substantial energy needs. During these charging processes, the current required is typically lower and more stable, ensuring a steady and efficient energy transfer. In contrast, short-term charging involves brief charging sessions. In this case, the charging demand is usually within 1 h, requiring just a small amount of electricity to sustain limited driving activities [24]. The second issue is the frequent occurrence of overcharging and overdischarging during battery use, making health management difficult. Overcharging triggers excessive internal reactions, increasing pressure and reducing lifespan, while overdischarging depletes active materials, degrading capacity. Improper charging currents further exacerbate these issues: high currents generate excessive heat, accelerating aging, while low currents prolong charging duration and compromise user experience.
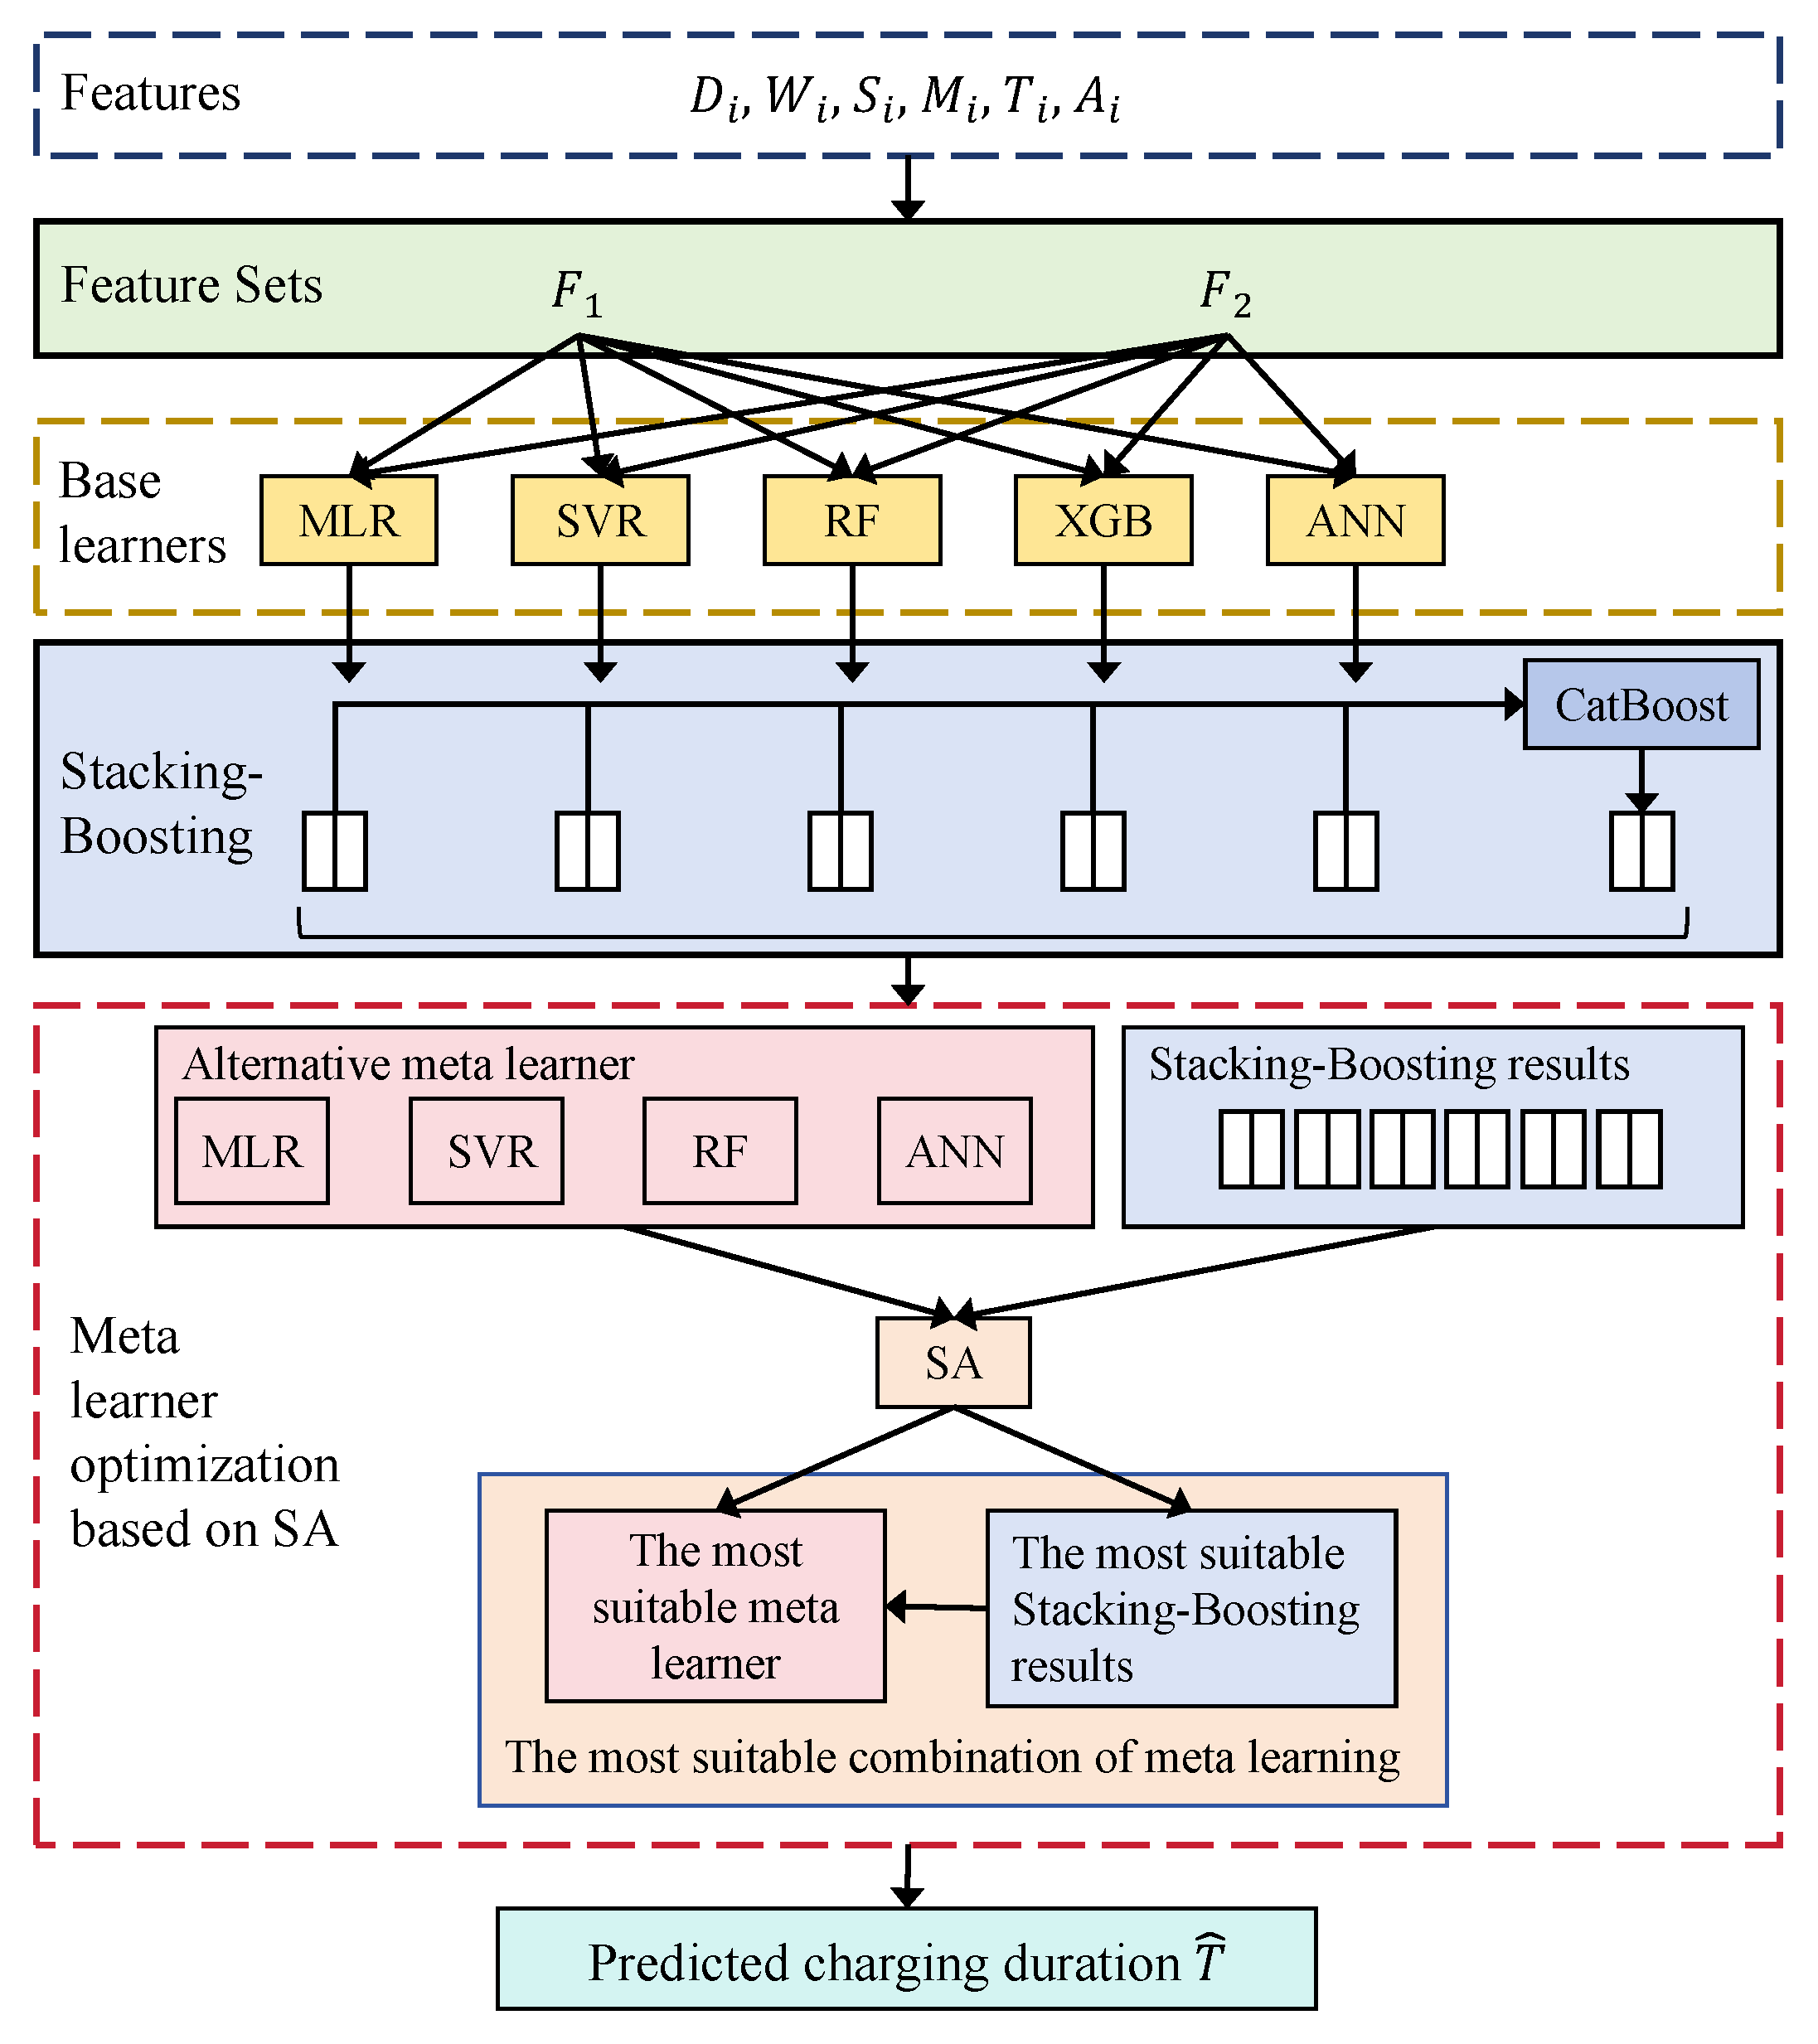
To address the challenges, a user-demand-oriented healthy charging control strategy is developed, as shown in Figure 1. An EHSBE model is used to resolve the first challenge. This model extracts features from three dimensions and employs a comprehensive feature selection method to identify two suitable feature subsets. The prediction model combines a hybrid stacking–boosting approach, utilizing five types of base learners and a boosting learner. A simulated annealing (SA) algorithm is applied to optimize the feature combinations for both base and meta-learners. This process ensures the selection of the most effective predictive configuration, significantly enhancing the accuracy of EV charging duration prediction for subsequent user-involved charging control.
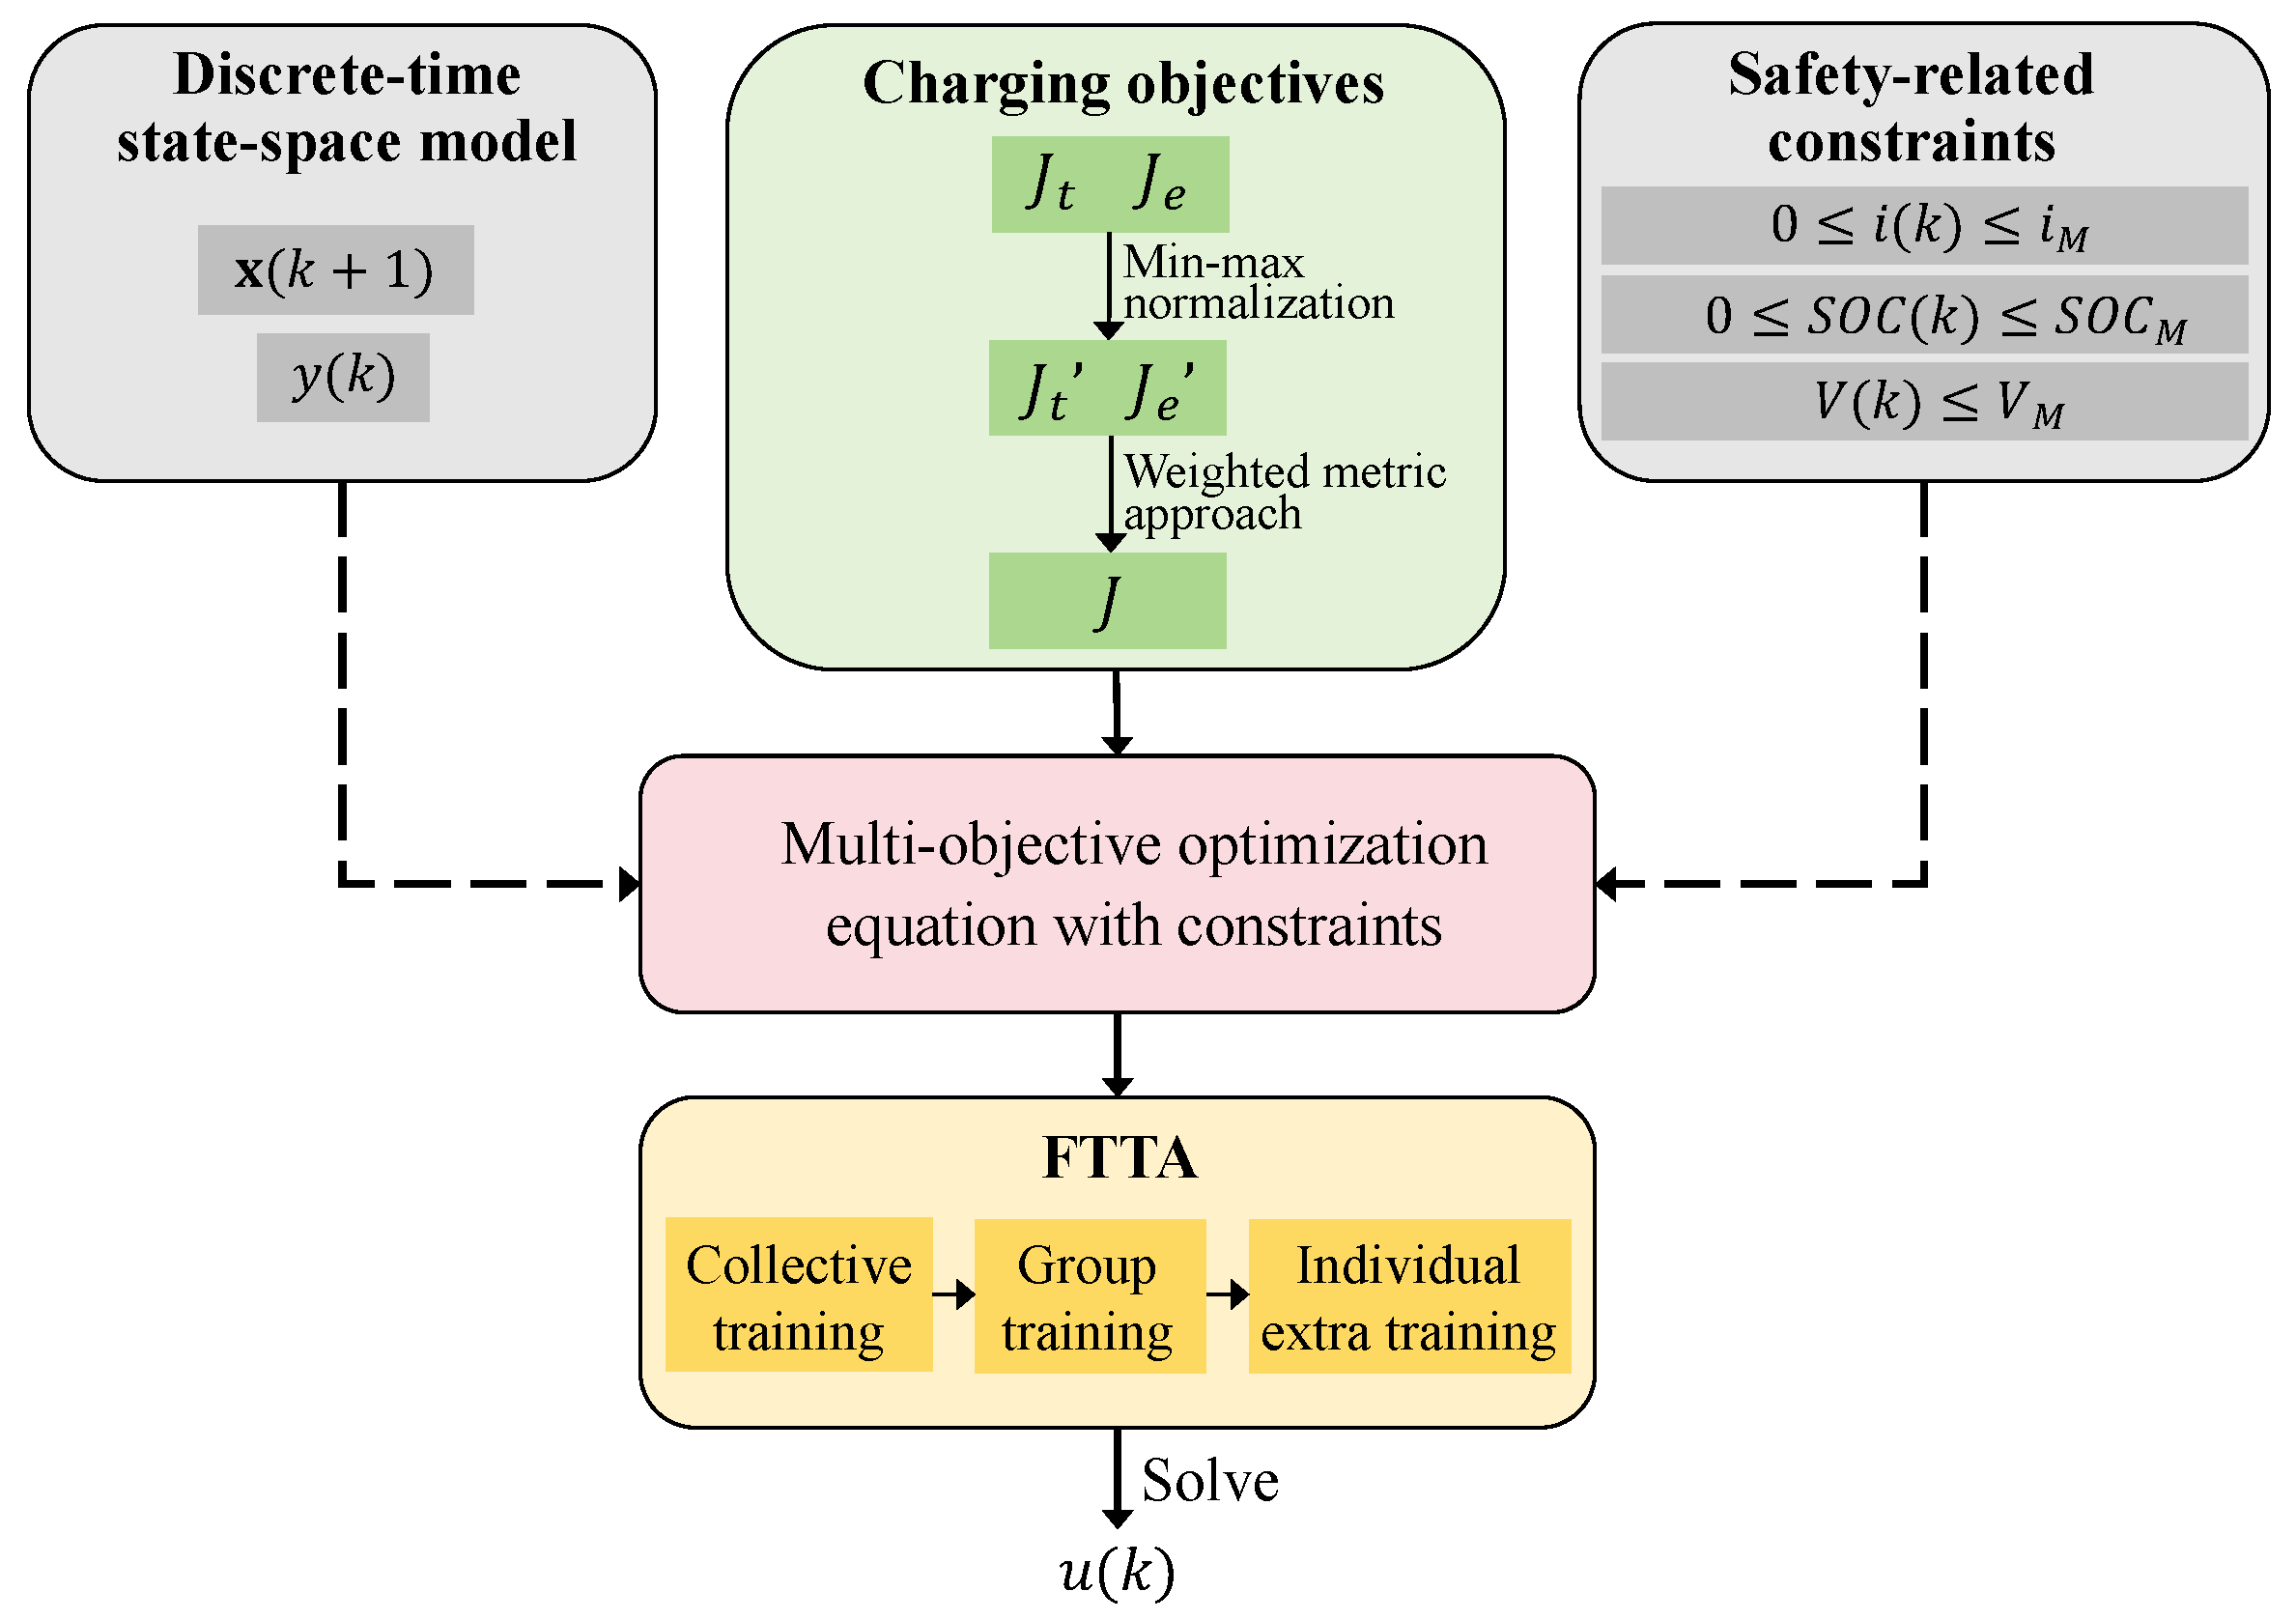
Leveraging the predicted charging durations of users, a healthy charging control strategy based on the FTTA is proposed to maintain battery health. This strategy employs a first-order resistor–capacitor (RC) model to accurately characterize the dynamic behavior of the battery. It also incorporates safety-related constraints and multi-objective optimization equations related to charging tasks and reduction in heat generation. In this way, a gentler charging curve is used for predicted long charging durations to avoid overcharging and frequent cycles, thus extending battery life. For predicted short durations, the strategy aims to complete the charging task within safety limits while minimizing battery impact [25]. By considering user charging habits, the strategy smartly adjusts the current to match user preferences and battery traits, enhancing charger intelligence and reducing battery capacity loss.
To verify the effectiveness of the proposed healthy charging control strategy, a LiB charging experimental platform is established. The platform is then utilized to experimentally validate the proposed strategy.
The state of health ( S O H ) quantifies battery performance degradation, expressed as a percentage of current capacity relative to its initial value. To demonstrate the healthiness of the strategy, a semi-empirical model of the S O H [26] is introduced below.
Q S E I = 0 t k S E I exp ( E S E I R e T e ) 2 ( 1 + λ θ ) t d t Q A M = 0 t k A M exp ( E A M R e T e ) · S O C · | I | d t Q l o s s = Q S E I + Q A M S O H = C n Q l o s s C n × 100 %
where C n is the rated charge capacity of the battery (i.e., the nominal capacity), Q S E I is the capacity loss caused by solid electrolyte interface growth, Q A M is the capacity loss caused by the active material loss, Q l o s s is the total capacity loss, S O C is the state of charge, R e is the ideal gas constant, and T e is the absolute temperature. k S E I , E S E I , k A M , E A M , λ , and θ are model parameters set as control variables according to [27].

3. Prediction of User Charging Duration

To develop user-aligned charging objective for battery health, precise prediction of user charging demand is essential. For this purpose, an EHSBE model is proposed to obtain charging duration, as illustrated in Figure 2.

3.1. Extraction and Selection of Charging Features

The features are extracted from three dimensions: time index, EV information, and historical statistics. Specifically, time index features include D i and W i (i represents the charging session), where D i is the time index on one day and W i is the day index in one week. And EV information features are composed of S i and M i , which represent the start S O C and mileage increment, respectively. T i and A i belong to historical statistical features, where T i denotes the historical average charging time at the current time point and A i indicates the historical average charging time per week at the current time point. Subsequently, an integrated feature selection method combining correlation and random forest (RF) is applied to the extracted features to construct a diverse and comprehensive feature set. The correlation-based feature selection algorithm calculates the correlation between features and the target variable to perform feature selection, while the RF-based feature selection algorithm evaluates feature importance. So, two feature sets, F 1 and F 2 , containing different features are obtained, with different users receiving different F 1 and F 2 .

3.2. Establishment of Charging Duration Prediction Model

3.2.1. Selection of Base Learners

Five machine learning models are introduced as base learners on the two feature subsets, resulting in a total of ten models. These include multiple linear regression (MLR) [28], support vector regression (SVR) [29], an artificial neural network (ANN) [30], XGBoost [31], and RF [32]. Each model has unique strengths: MLR captures linear relationships, SVR identifies nonlinear patterns via kernel functions, RF handles feature interactions, and so on.

3.2.2. Boosting Module

The EHSBE model includes a boosting module [33] to selectively optimize the poor prediction results. It uses the 3 σ rule to identify poorly predicted samples from base learners (deviations exceeding ± 3 times the standard deviation) and retrains them using the CatBoost algorithm [34]. CatBoost is built on the principles of gradient boosting, where it constructs an ensemble of weak decision trees in a stage-wise fashion. The ensemble form of the module makes the retraining results reliable by learning from base learner errors.

3.2.3. Hybrid Stacking Module

Hybrid stacking technology [35] integrates the predictions of multiple base learners and a boosting module. This approach leverages the strengths of each model while mitigating their weaknesses. The stacked results serve as inputs for a meta-learner, which processes the outputs of the base learners as a secondary learning layer.

3.2.4. Meta-Learner Optimization Based on SA

SA [36] is employed to optimize the combination of features and a meta-learner through heuristic optimization. By simulating the thermal motion of atoms in the annealing process of solid materials and probabilistically accepting inferior solutions to escape local optima, the algorithm seeks to find the global optimum. It eliminates poorly performing models and determines the optimal meta-learner from among MLR, SVR, RF, and the ANN. Subsequently, the outcomes from the chosen stacking–boosting approach serve as feature inputs to this optimal meta-learner. The ultimate forecasted charging duration is represented as T ^ .

4. Charging Problem Description and Charging Control Strategy Design

In light of EV charging duration predictions from the EHSBE model, a first-order RC model, safety-related constraints and multiple cost functions are defined. A healthy charging control strategy is proposed to balance charging speed and battery health, as illustrated in Figure 3.

4.1. Battery Model

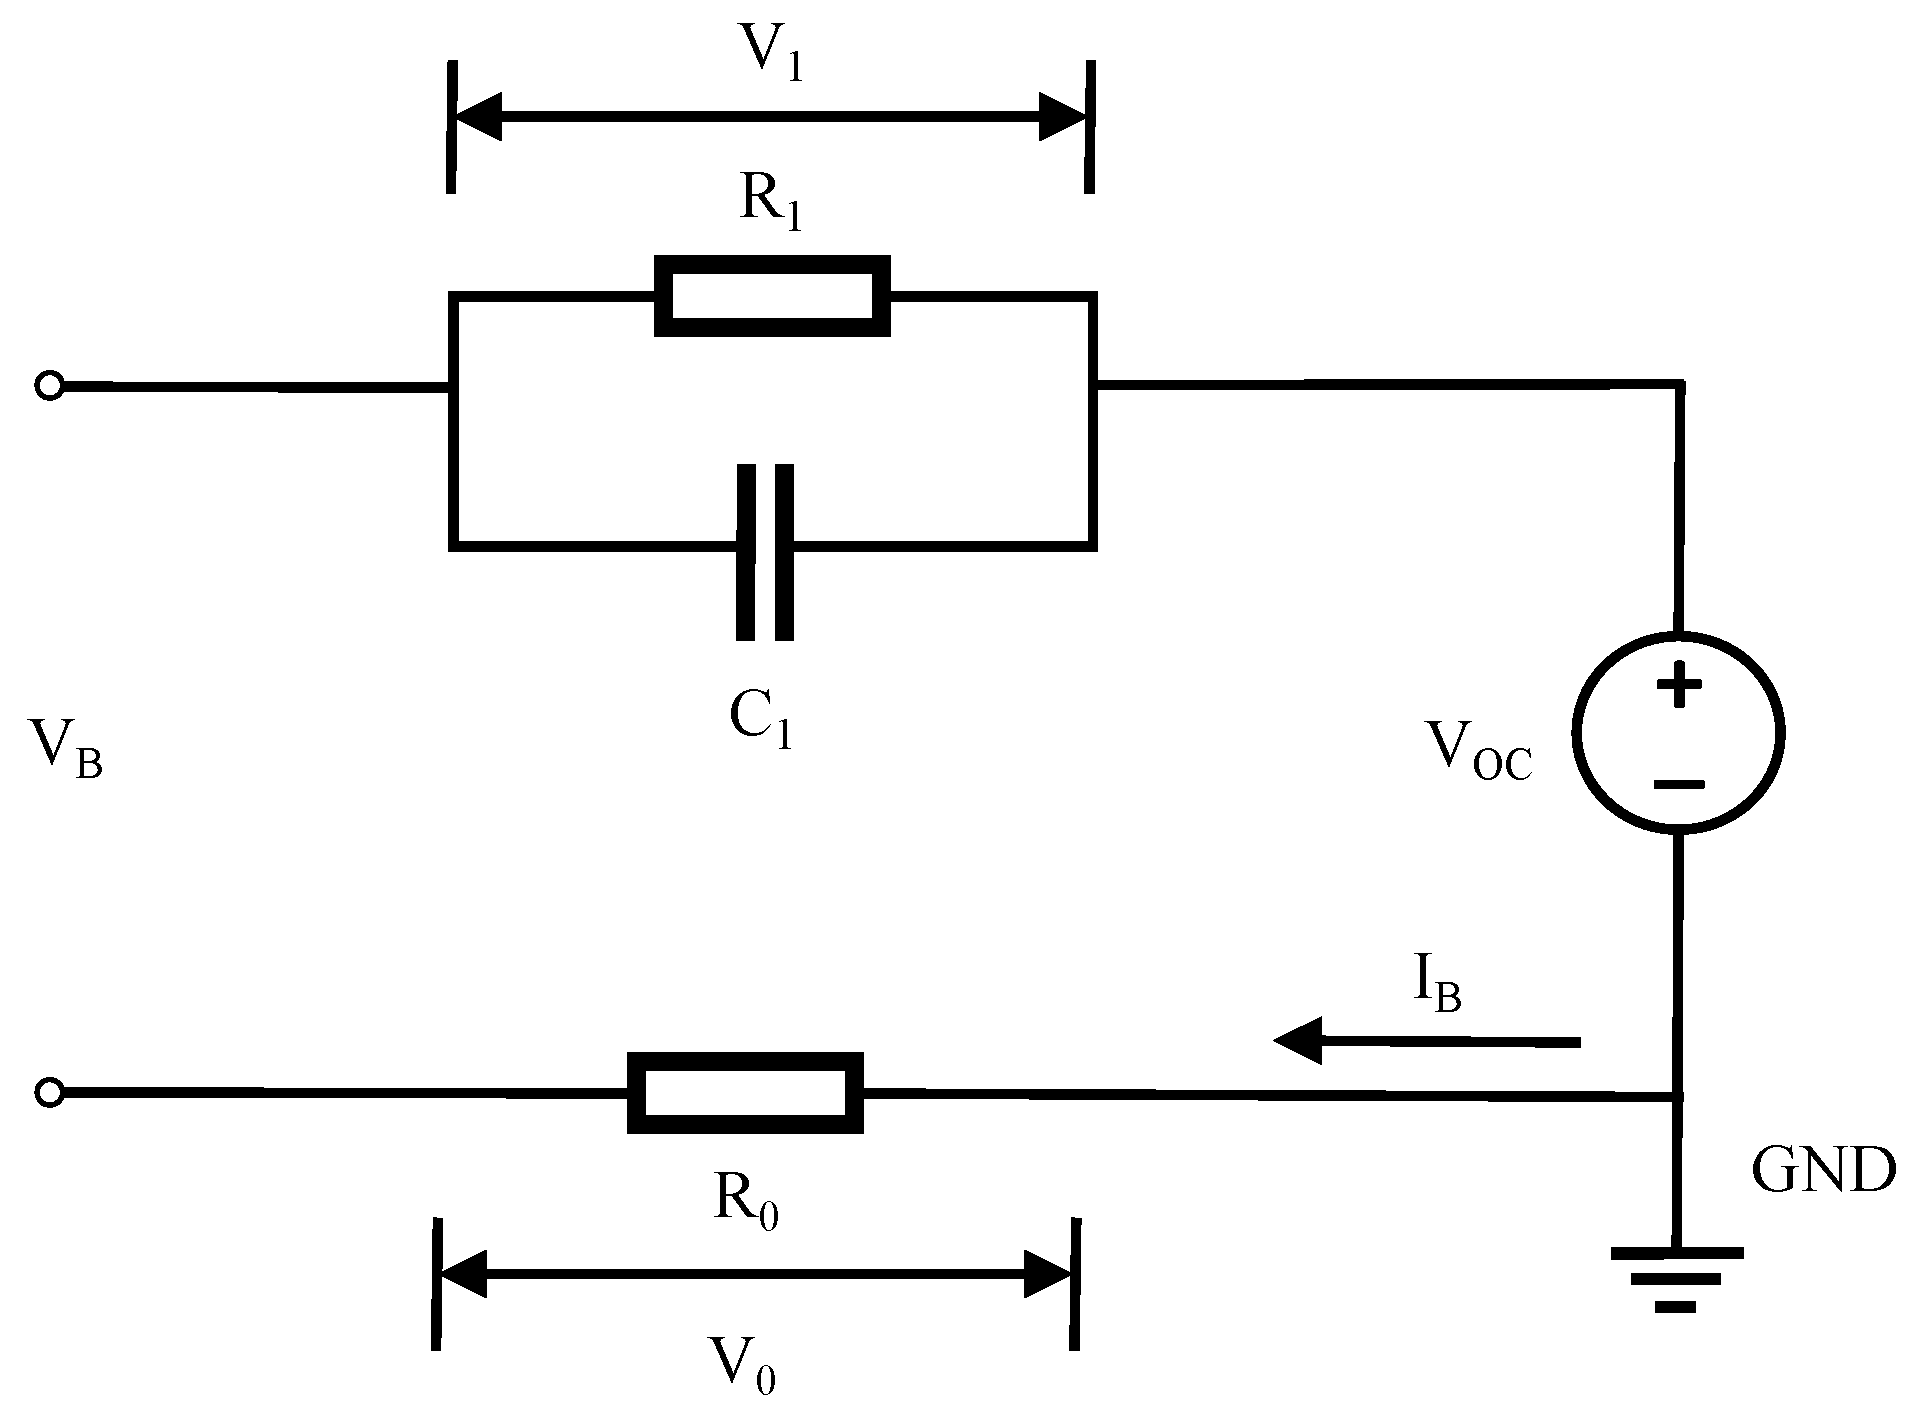
A first-order RC equivalent circuit model is adopted to describe the dynamics of LiBs, as shown in Figure 4. The model parameters reflect various electrochemical processes of the battery. The series resistance R 0 represents the battery’s ohmic resistance, used to simulate energy loss. The resistor R 1 and capacitor C 1 represent polarization dynamics, with V 1 as the capacitor voltage. V O C denotes the open-circuit voltage, reflecting energy storage, while V B is the terminal voltage.
According to the charging current I B and the Kirchhoff’s laws of current and voltage, the dynamic characteristics of the battery in the first-order RC model can be expressed as
S O C ˙ = 1 3600 C n I B V 1 ˙ = 1 R 1 C 1 V 1 + 1 C 1 I B V B = V O C + V 1 + R 0 I B
where V O C is a nonlinear function related to the S O C , expressed as V O C = g ( S O C ) . Discretizing (2), the S O C and V 1 are jointly integrated into state vectors, x ( k ) [ S O C ( k ) , V 1 ( k ) ] T , with the output variable y ( k ) V B ( k ) and input variable u ( k ) I B ( k ) :
x ( k + 1 ) = Gx ( k ) + H u ( k ) y ( k ) = Cx ( k ) + D u ( k ) + ψ ( x ( k ) )
where:
G = 1 0 0 1 T R 1 C 1 , H = T 3600 C n T C 1 C = 0 1 , D = R 0 , ψ ( x ( k ) ) =   g ( x ( k ) )
with T the sampling interval.

4.2. Charging Objectives and Safety-Related Constraints

Due to diverse user charging durations, a segmented charging strategy is adopted to manage computational load and decision-making time efficiently:
N T u = T ^
where N represents the number of segmented currents, and T u represents the cycle of segmented currents.

4.2.1. User-Involved Electricity Objective

The electricity objective refers to the battery power level at the end of the charging task, typically full charge or a specific S O C . The quadratic formula is employed in the target function to ensure that it is a convex function, achieving a local minimum at the target S O C [24]. The electricity target function is
J t = ( S O C ( N ) S O C t ) 2
where S O C ( N ) is the S O C in the N-th time period and S O C t is the target S O C .

4.2.2. Energy Loss Reduction Objective

To extend battery life and improve efficiency, charging strategies should dynamically adjust power to control heat generation [24]:
J e = k = 0 N 1 u ( k ) ( V 1 ( k ) + R 0 ( k ) u ( k ) ) T

4.2.3. Multi-Objective Equation

To account for users’ electricity requirements and heat generation reduction during charging, min-max normalization is used to eliminate differences in scales and ranges [37]. The min-max normalization algorithm normalizes them to the range [ 0 ,   1 ] , as shown below:
J i = J i J i m J i M J i m
where J i is the normalized single-objective function (i represents e or t), and J i m and J i M indicate the minimum and maximum values of the single-objective function, respectively.
In addition, balancing multiple goals is crucial within the multi-objective equation. Given varying user preferences for charging speed and battery health, a weighted metric approach is employed. By adjusting weights, personalized charging strategies can be provided. The charging control problem is formulated as minimizing the following cost function:
J = γ 1 J t + γ 2 J e
where γ 1 and γ 2 are the weight coefficients that represent the relative importance of the corresponding individual targets.
In order to ensure charging safety and avoid material stress [38], the relevant restrictions are defined as follows:
0 i ( k ) i M 0 S O C ( k ) S O C M V ( k ) V M
where i ( k ) represents the charging current at time k with i M as the maximum allowable charging current, S O C ( k ) denotes the S O C at time k with S O C M as the maximum allowable S O C , and V ( k ) represents the charging voltage at time k with V M as the maximum allowable terminal voltage.

4.3. Optimization Problem Establishment

According to the above discrete-time state space model (3), objective Equation (8), and constraint condition (9), a multi-objective optimization of the healthy charging control problem is established as below:
min J s . t . x ( k + 1 ) = Gx ( k ) + H u ( k ) , x ( 0 ) y ( k ) = Cx ( k ) + D u ( k ) + ψ ( x ( k ) ) 0 i ( k ) i M 0 S O C ( k ) S O C M V ( k ) V M
where x ( 0 ) indicates the initial state vector of the LiB during charging.

4.4. Design of Charging Control Strategy

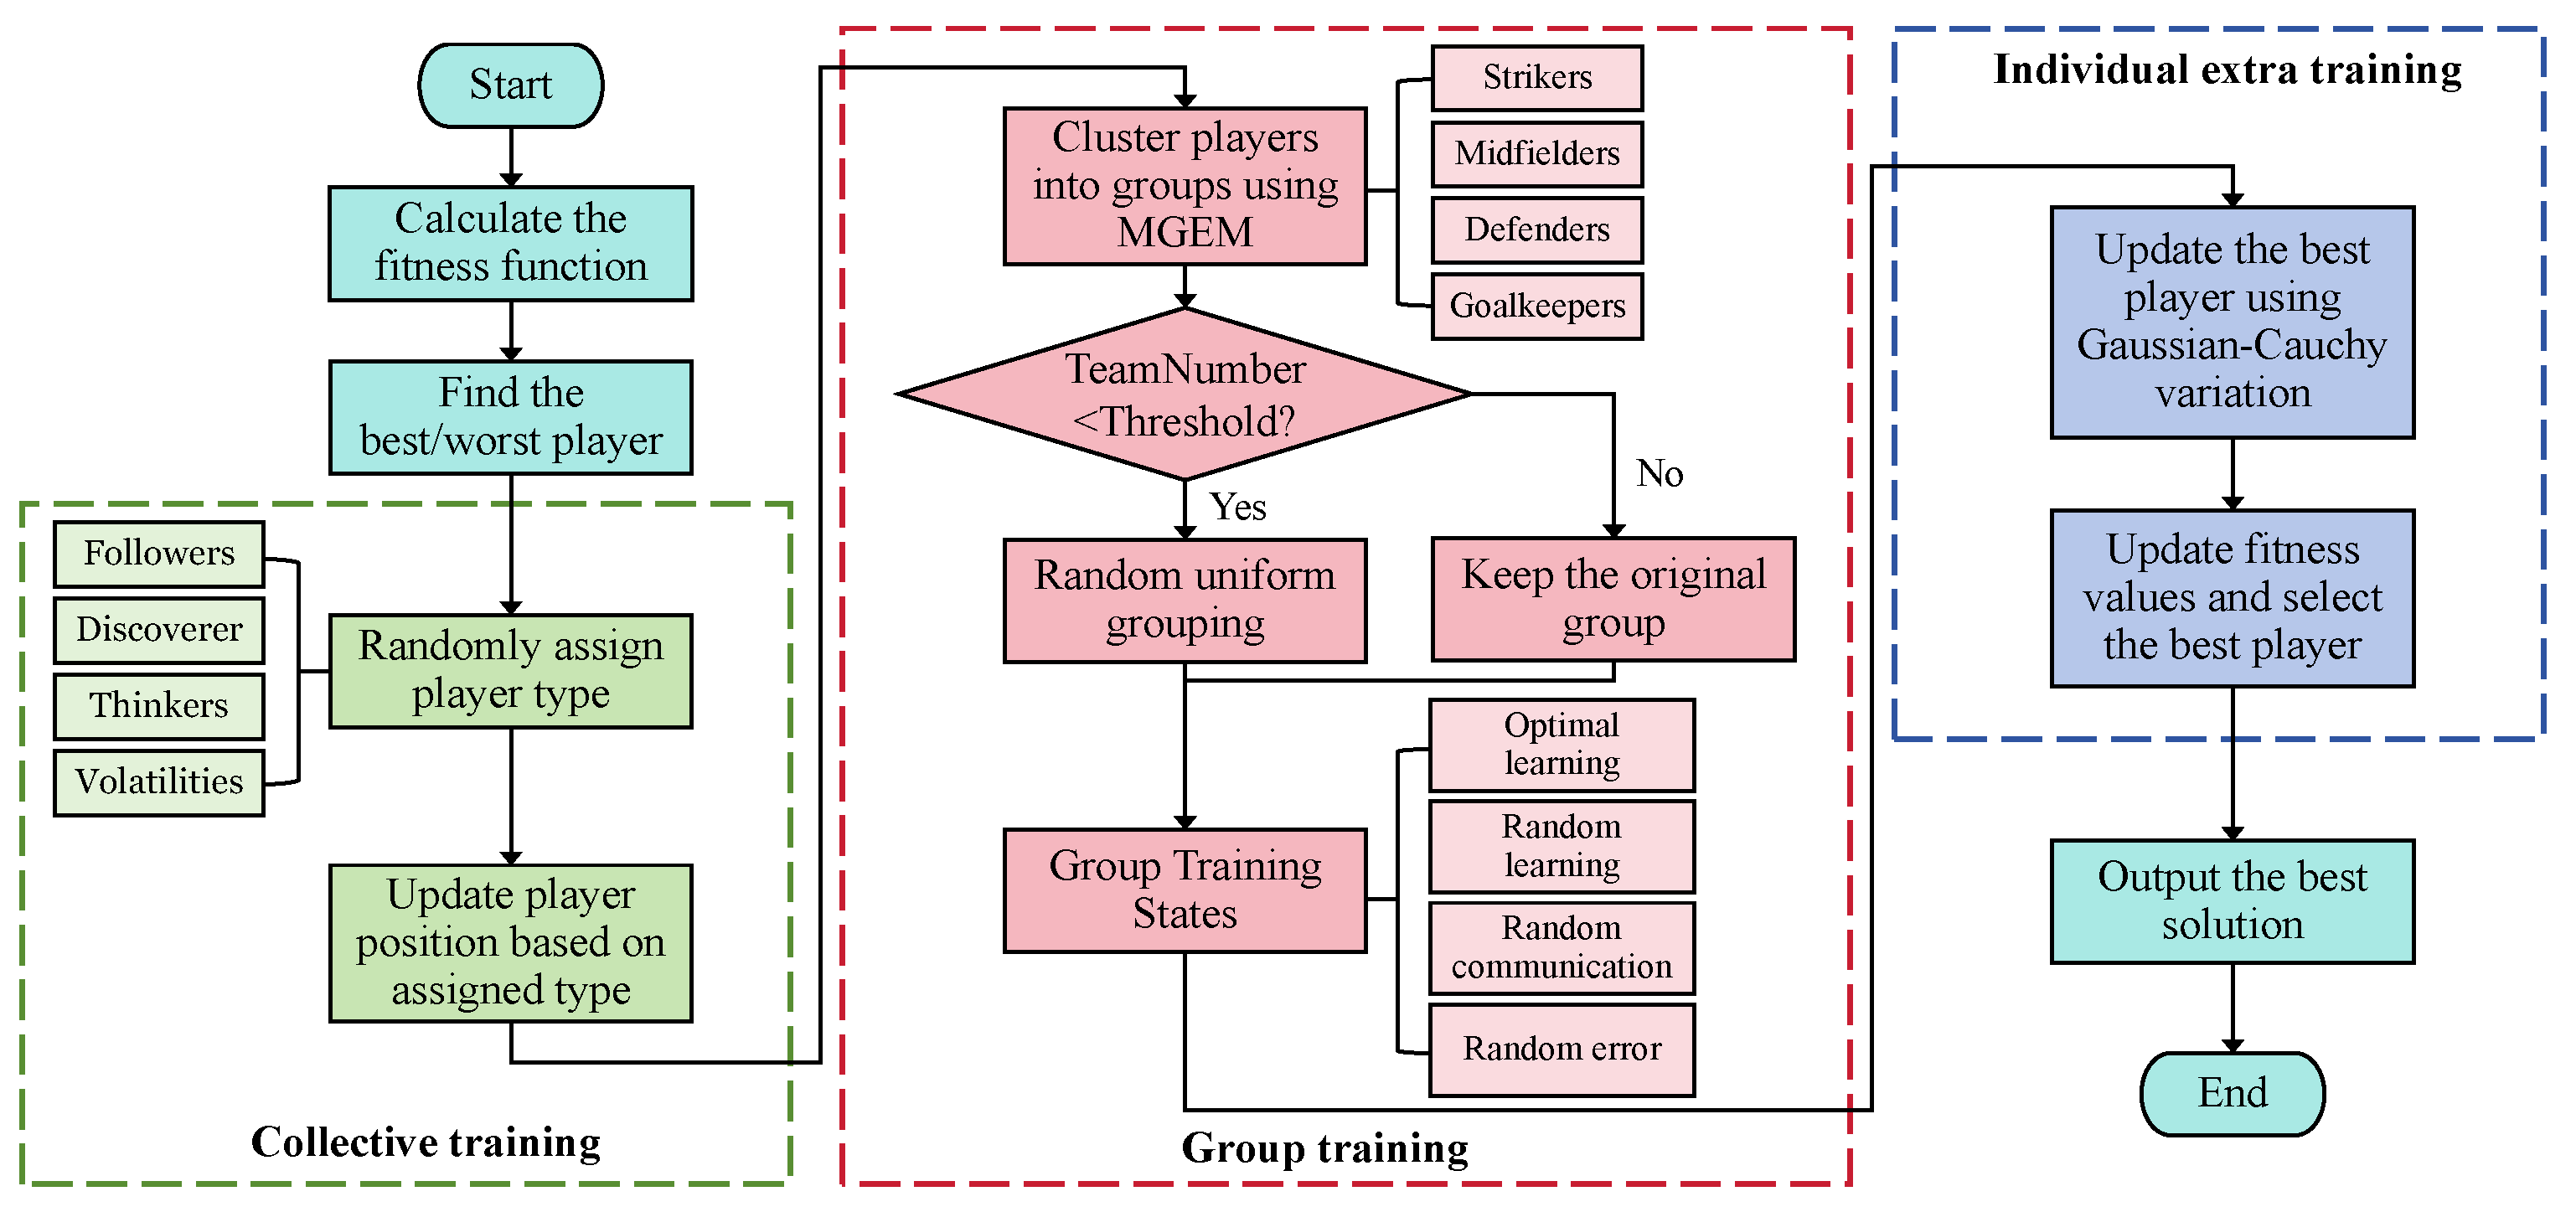
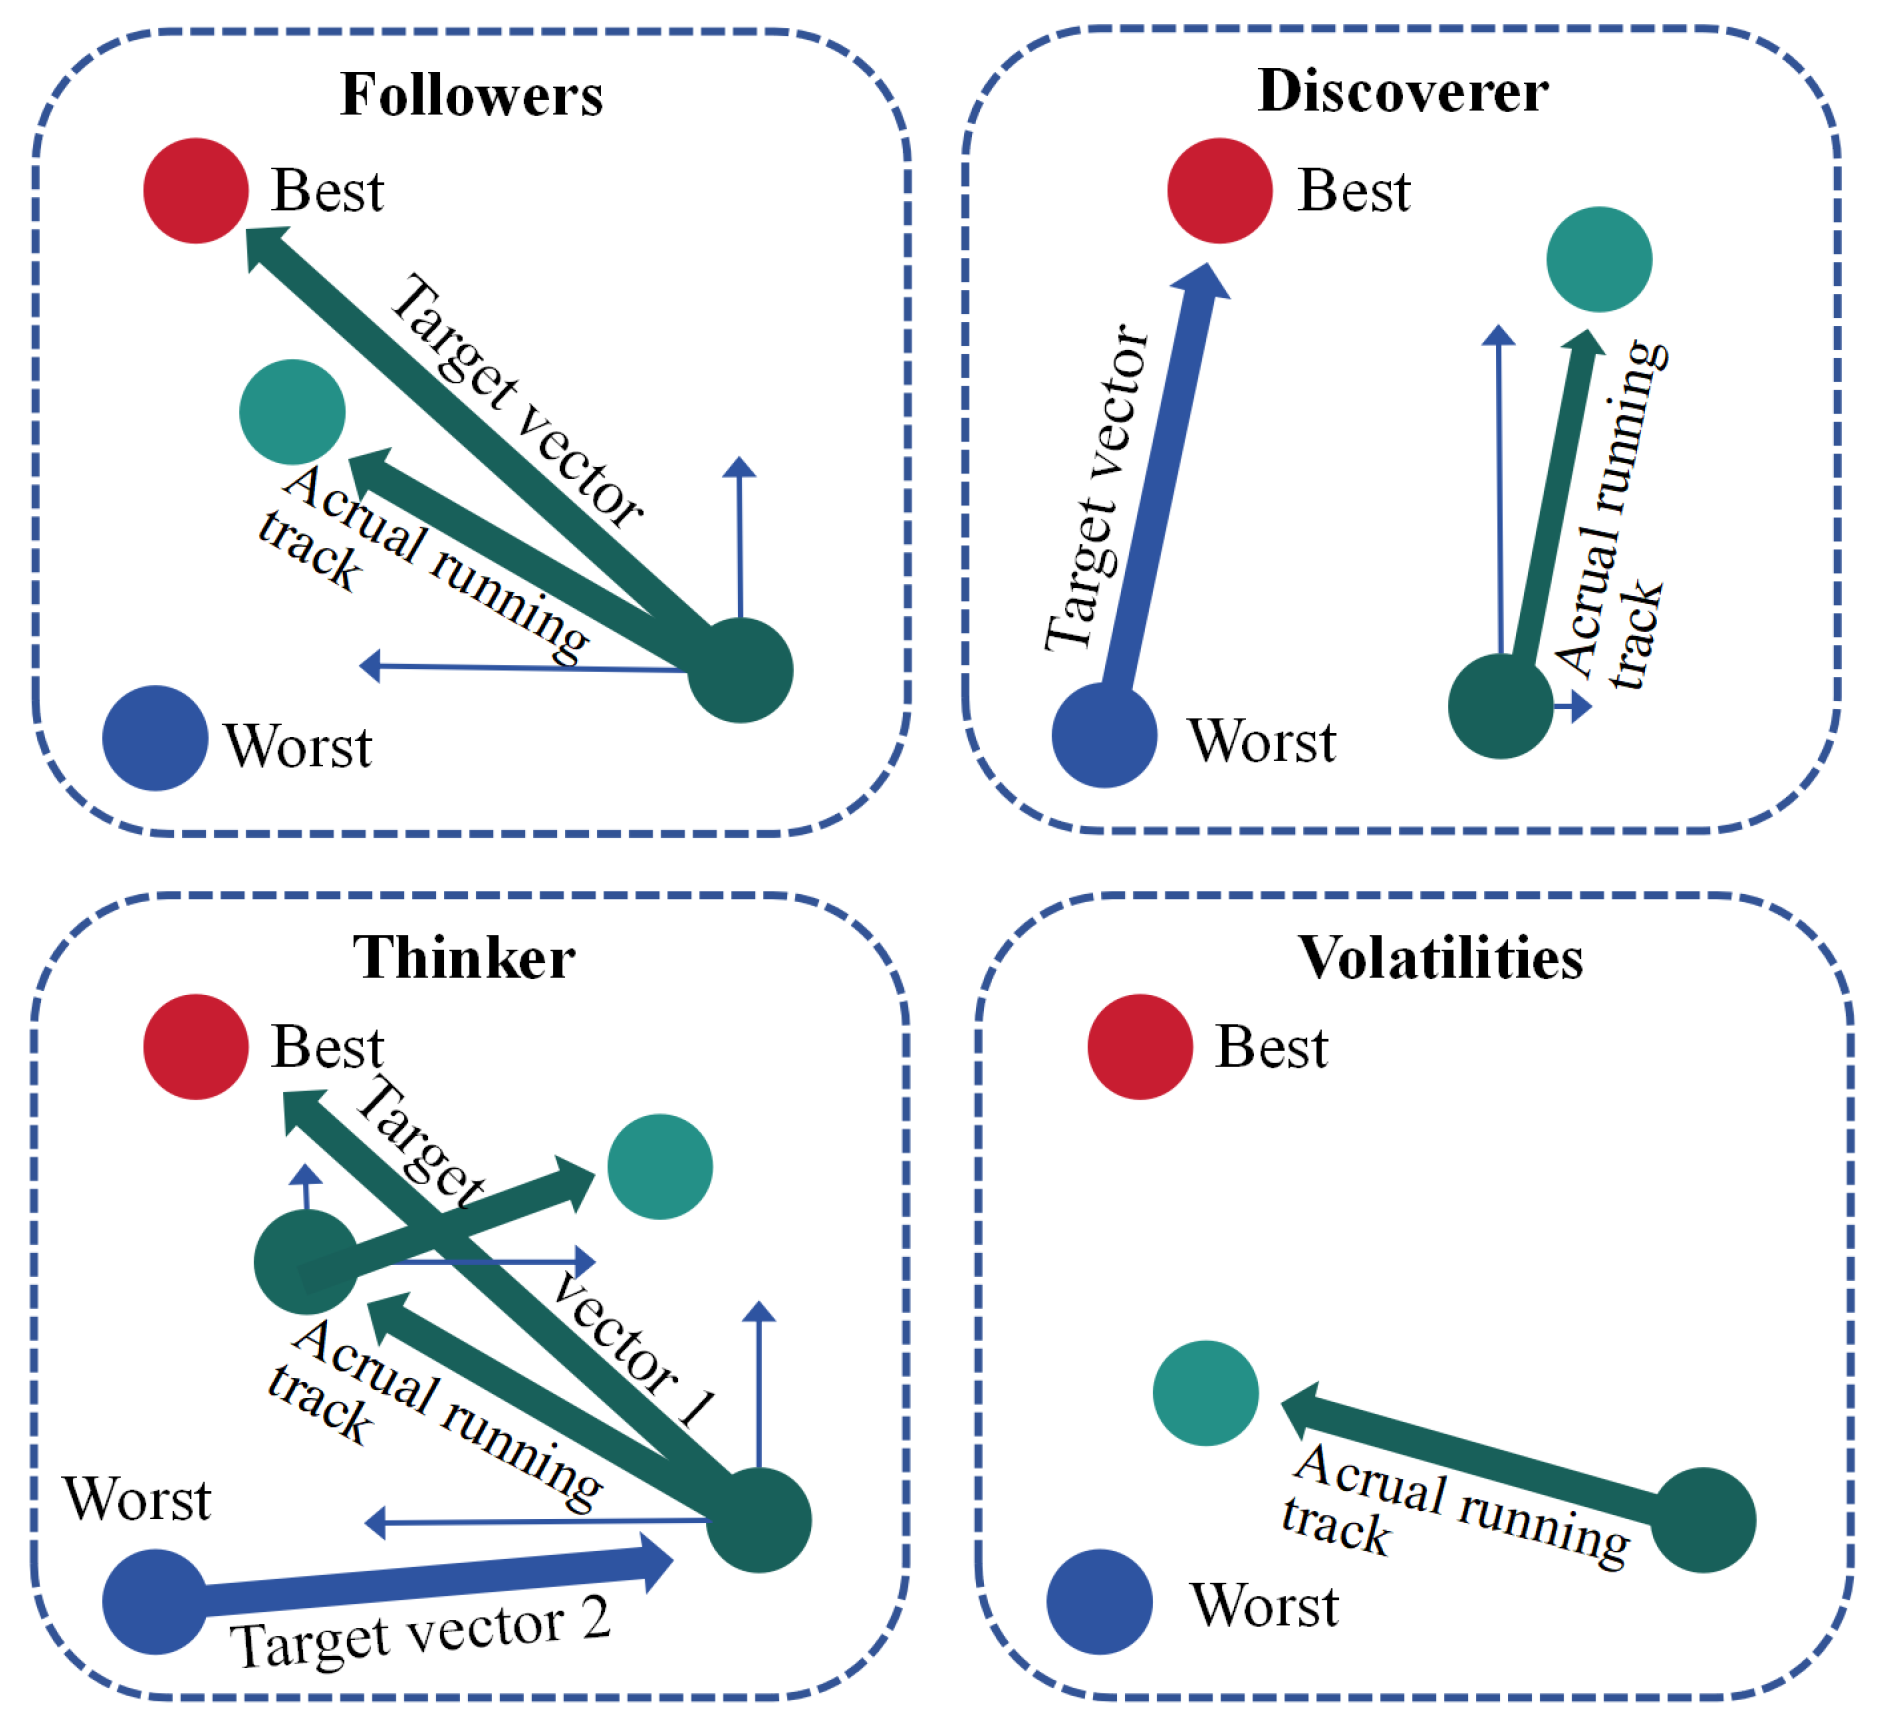
For the multi-objective optimization problem defined in (10), the FTTA [39] is employed to balance the different objectives. As shown in Figure 5, this algorithm simulates the collective training, group training, and individual extra training phases in football team training to optimize complex problems.
During the initial phase of training, players engage in collective training sessions led by their coach. The coach assesses each player’s capabilities through a series of tests and subsequently devises a tailored training regimen accordingly. Here, “players” are the candidate solutions while “coach” refers to the rules given in Equations (3) and (9). And the test is conducted based on the Equation (8). The “tailored training regimen” involves dividing the players into four groups and randomly switching their types in each iteration, as illustrated in Figure 6. The arrows in the figure illustrate how different types of players approach the best solution. The dark green circles represent the initial solutions, light green circles represent the intermediate solutions during the optimization process, and thin blue arrows represent the two optimization paths calculated during the optimization process.
Once the collective training wraps up, the football squad moves on to the group training segment. Here, the MixGaussEM (MGEM) technique is employed for adaptive clustering, sorting the players into four distinct categories according to their traits. After the groups are set, players start interacting and learning from one another within their respective groups. The training is defined by three states: optimal learning, random learning, and random communication. In the optimal learning state, players have a certain probability of directly learning the ability value of the best player in the group in each dimension, defined by the following formula:
F i , j k , t e a m l n e w = F B e s t , j k , t e a m l if rand p s t u d y F i , j k , t e a m l o l d if rand > p s t u d y
where k, i, and j represent the number of iterations, players, and dimensions, respectively. The t e a m l denotes group l. F B e s t k , t e a m l is the best player in group l in the k-th iteration where F B e s t , j k , t e a m l is its value in dimension j. F i , j k , t e a m l n e w indicates the status of the player in dimension j after training. And in random learning, equations can be defined as
F i , j k , t e a m l n e w = F R a n d o m , j k , t e a m l if rand p s t u d y F i , j k , t e a m l o l d if rand > p s t u d y
where F R a n d o m k , t e a m l is a random player in group l in the k-th iteration. In random communication’s each dimension, players can communicate with any other player in the group with a certain probability:
F i , j k , t e a m l n e w = F R a n d o m , j k , t e a m l o l d × ( 1 + randn ) if rand p c o m m F i , j k , t e a m l o l d if rand > p c o m m
F R a n d o m , j k , t e a m l n e w = F i , j k , t e a m l o l d × ( 1 + randn ) if rand p c o m m F R a n d o m , j k , t e a m l o l d if rand > p c o m m
where randn is a random number with nomal distribution. During collective training, there exists a probability of errors occurring, where players might inadvertently acquire information from other players across different dimensions. The error probability is defined as p e r r o r and the formula is as follows:
F i , j k , t e a m l n e w = F R a n d o m 1 , R a n d o m 2 k , t e a m l if rand p e r r o r F i , j k , t e a m l o l d if rand > p e r r o r
Subsequently, it becomes essential to re-evaluate the fitness levels, substituting inferior values with superior ones to refresh the players’ standing. Following this, the coach identifies the top-performing player for focused training, aiming to boost their skills and set a benchmark for others to follow. The formula is as follows:
F B e s t k n e w = F B e s t k o l d × ( 1 + ( 1 1 k ) × Gauss + 1 k × Cauchy )
During the initial phase of individual extra training, when players’ skill levels are relatively low, the best player has a greater likelihood of making substantial progress. In this context, the Cauchy distribution facilitates a global search by offering a wide range of potential improvements. As training advances and the number of iterations grows, enhancing skills becomes more challenging. In this stage, the Gaussian distribution takes precedence, concentrating on local optimization with a more limited scope for improvement.

5. Results and Discussion

The dataset provided by the China National New Energy Vehicle Big Data Alliance, based on the national standard GB/T32960-2016, was used for predicting EV charging durations. It includes charging data from 13 vehicles of different users, sampled every 10 s from 1 January 2022 to 31 December 2022. The parameter settings in the prediction model are shown in Table 1.
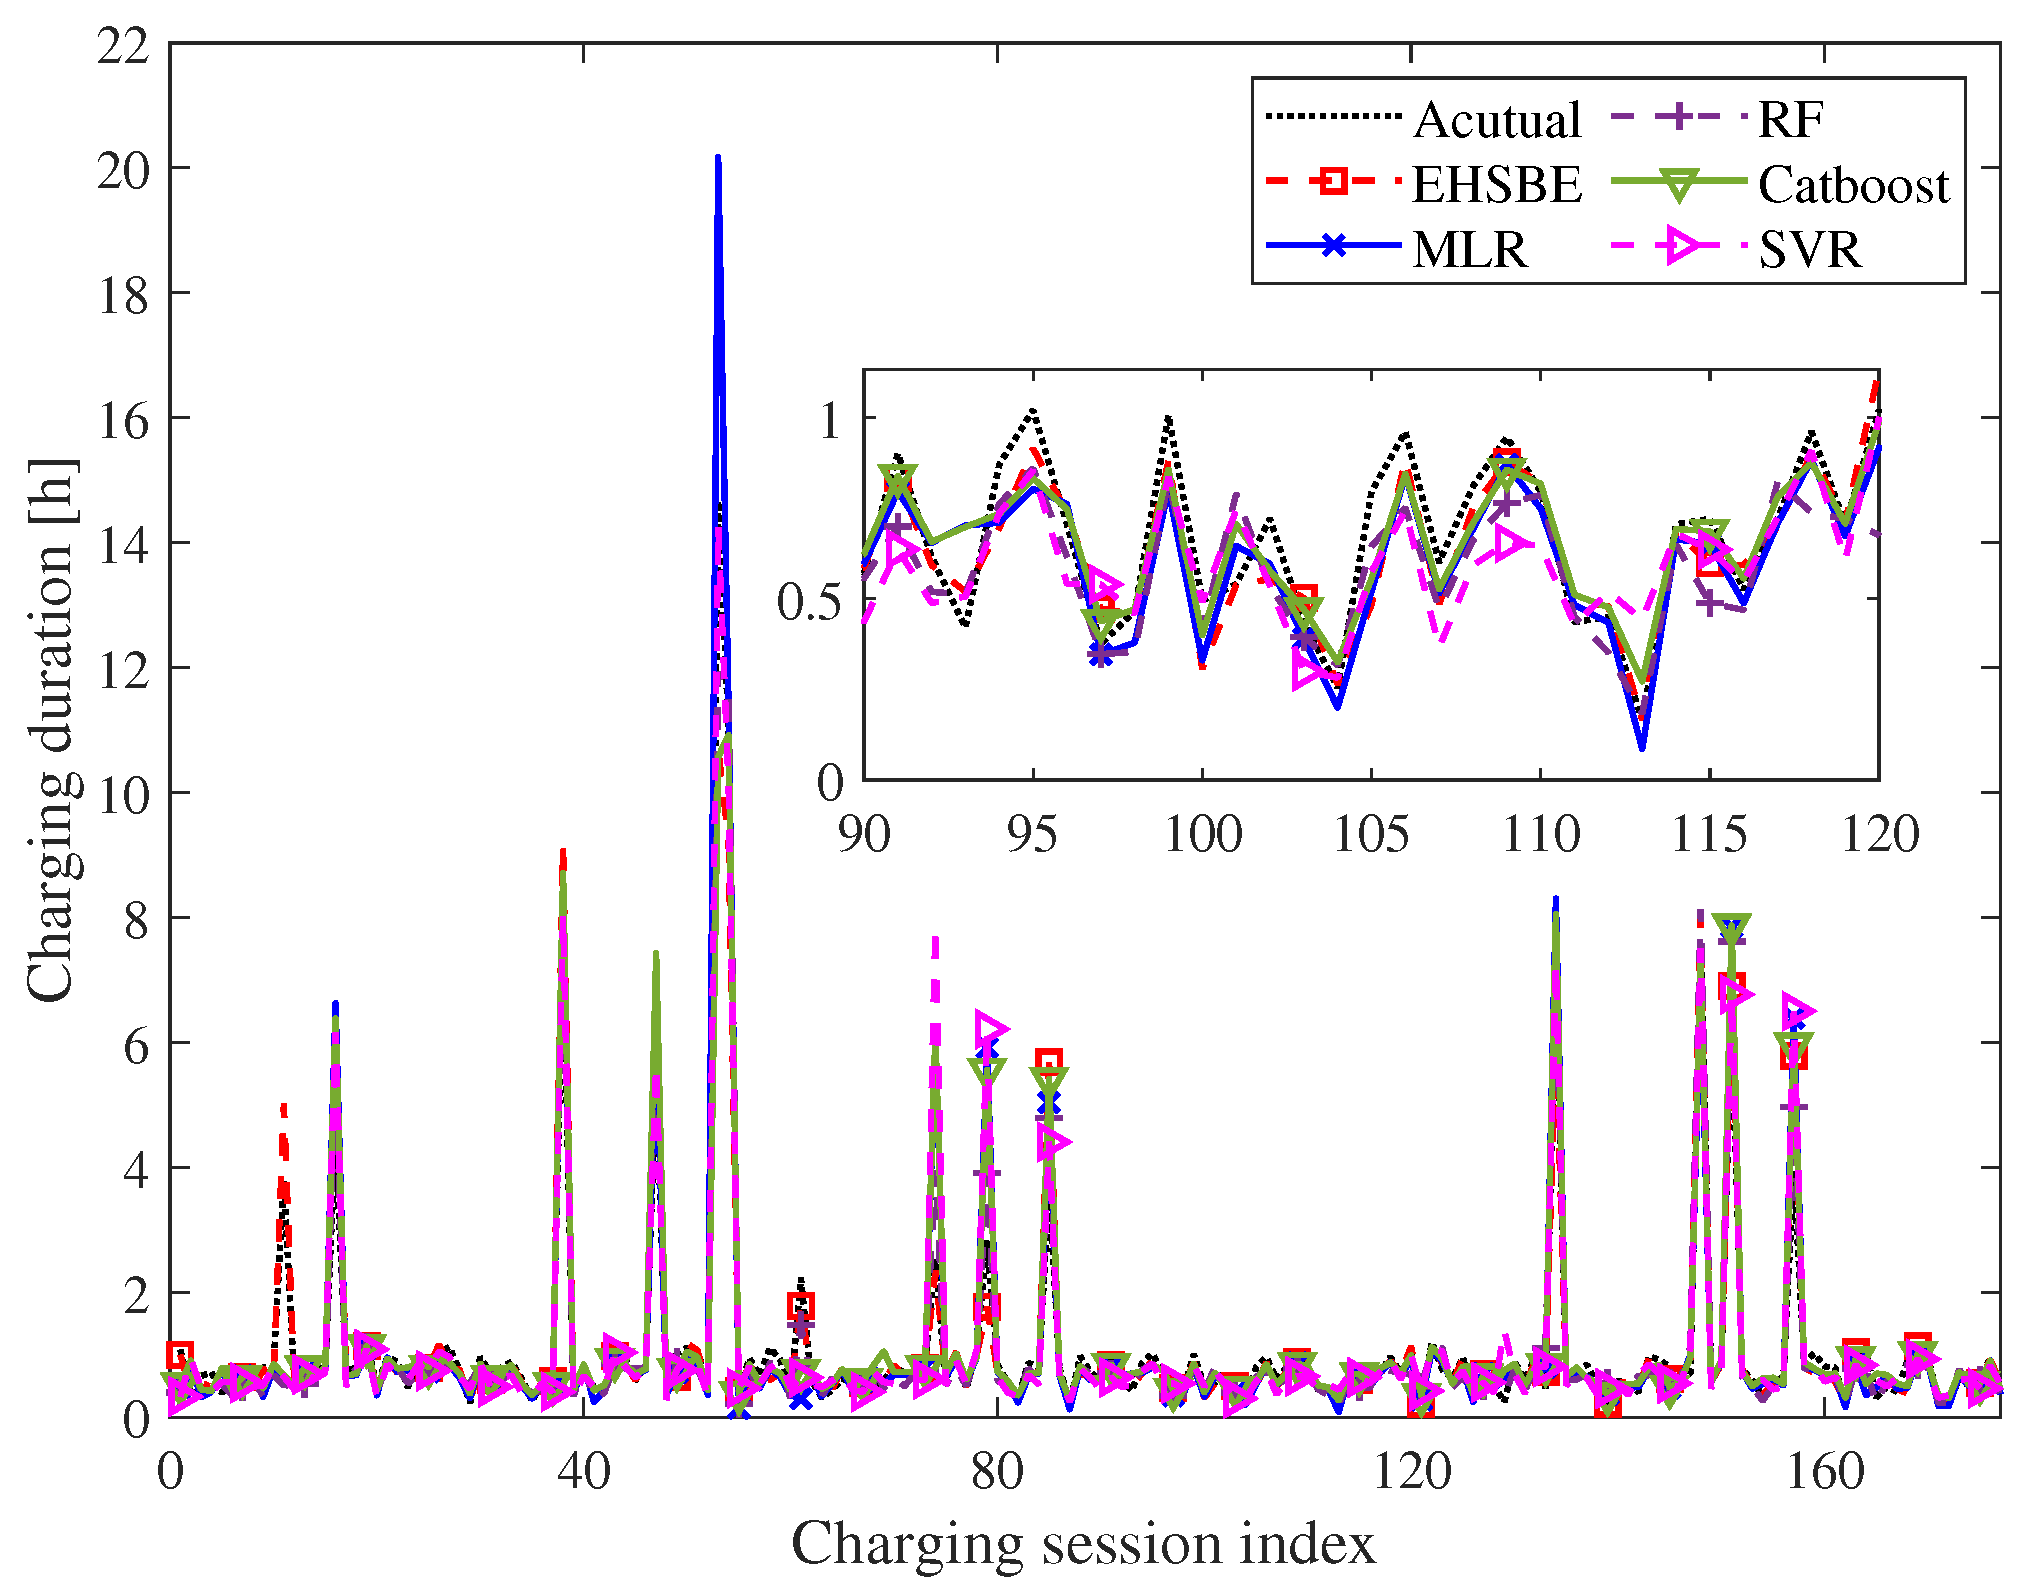
The EHSBE model employs five-fold cross-validation to segment the training of charging duration. To evaluate the prediction performance, multiple assessment metrics are selected in this study, including root mean square error (RMSE), mean absolute error (MAE), mean absolute percentage error (MAPE), and symmetric mean absolute percentage error (SMAPE). Additionally, to ensure a comprehensive evaluation, a certain EHSBE model with fixed random seed was systematically compared with several common prediction algorithms, such as RF, CatBoost, MLR, etc., as detailed in Table 2 and Figure 7. To validate the EHSBE method, we compared our results with those of other published methods. In [21], which used charging data from the Japan Automobile Research Institute, the method achieved an MAE of 12.38 min and an RMSE of 31.3 min for normal private charging scenarios. In contrast, our method achieved an MAE of 11.4 min and an RMSE of 23.1 min. In [20], which used data from the Adaptive Charging Network, the method had an MAE of 66.5 min. Given the differences in data volume and source, the method’s MAE was 66.5 min, whereas ours was reduced by 82.9%.
Experiments were conducted on Panasonic NCR18650GA LiFePO4 batteries (3.35 Ah, 3.7 V nominal voltage) to validate the proposed healthy charging strategy. The strategy was implemented on a computer equipped with a 3.6 GHz Intel i5-1035G1CPU, using MATLAB 2022b/Simulink to build a first-order RC model of the LiB. The manufacturer of the CPU is Intel Corporation. The company is headquartered in Santa Clara, California, United States. The framework of the hardware experimental platform is depicted in Figure 8a, and the construction of the charging experimental testing platform is shown in Figure 8b. The charging controller used was BQ24610, and the control module was STM32F103C8T6.

5.1. Comparison with Fast Charging Strategy

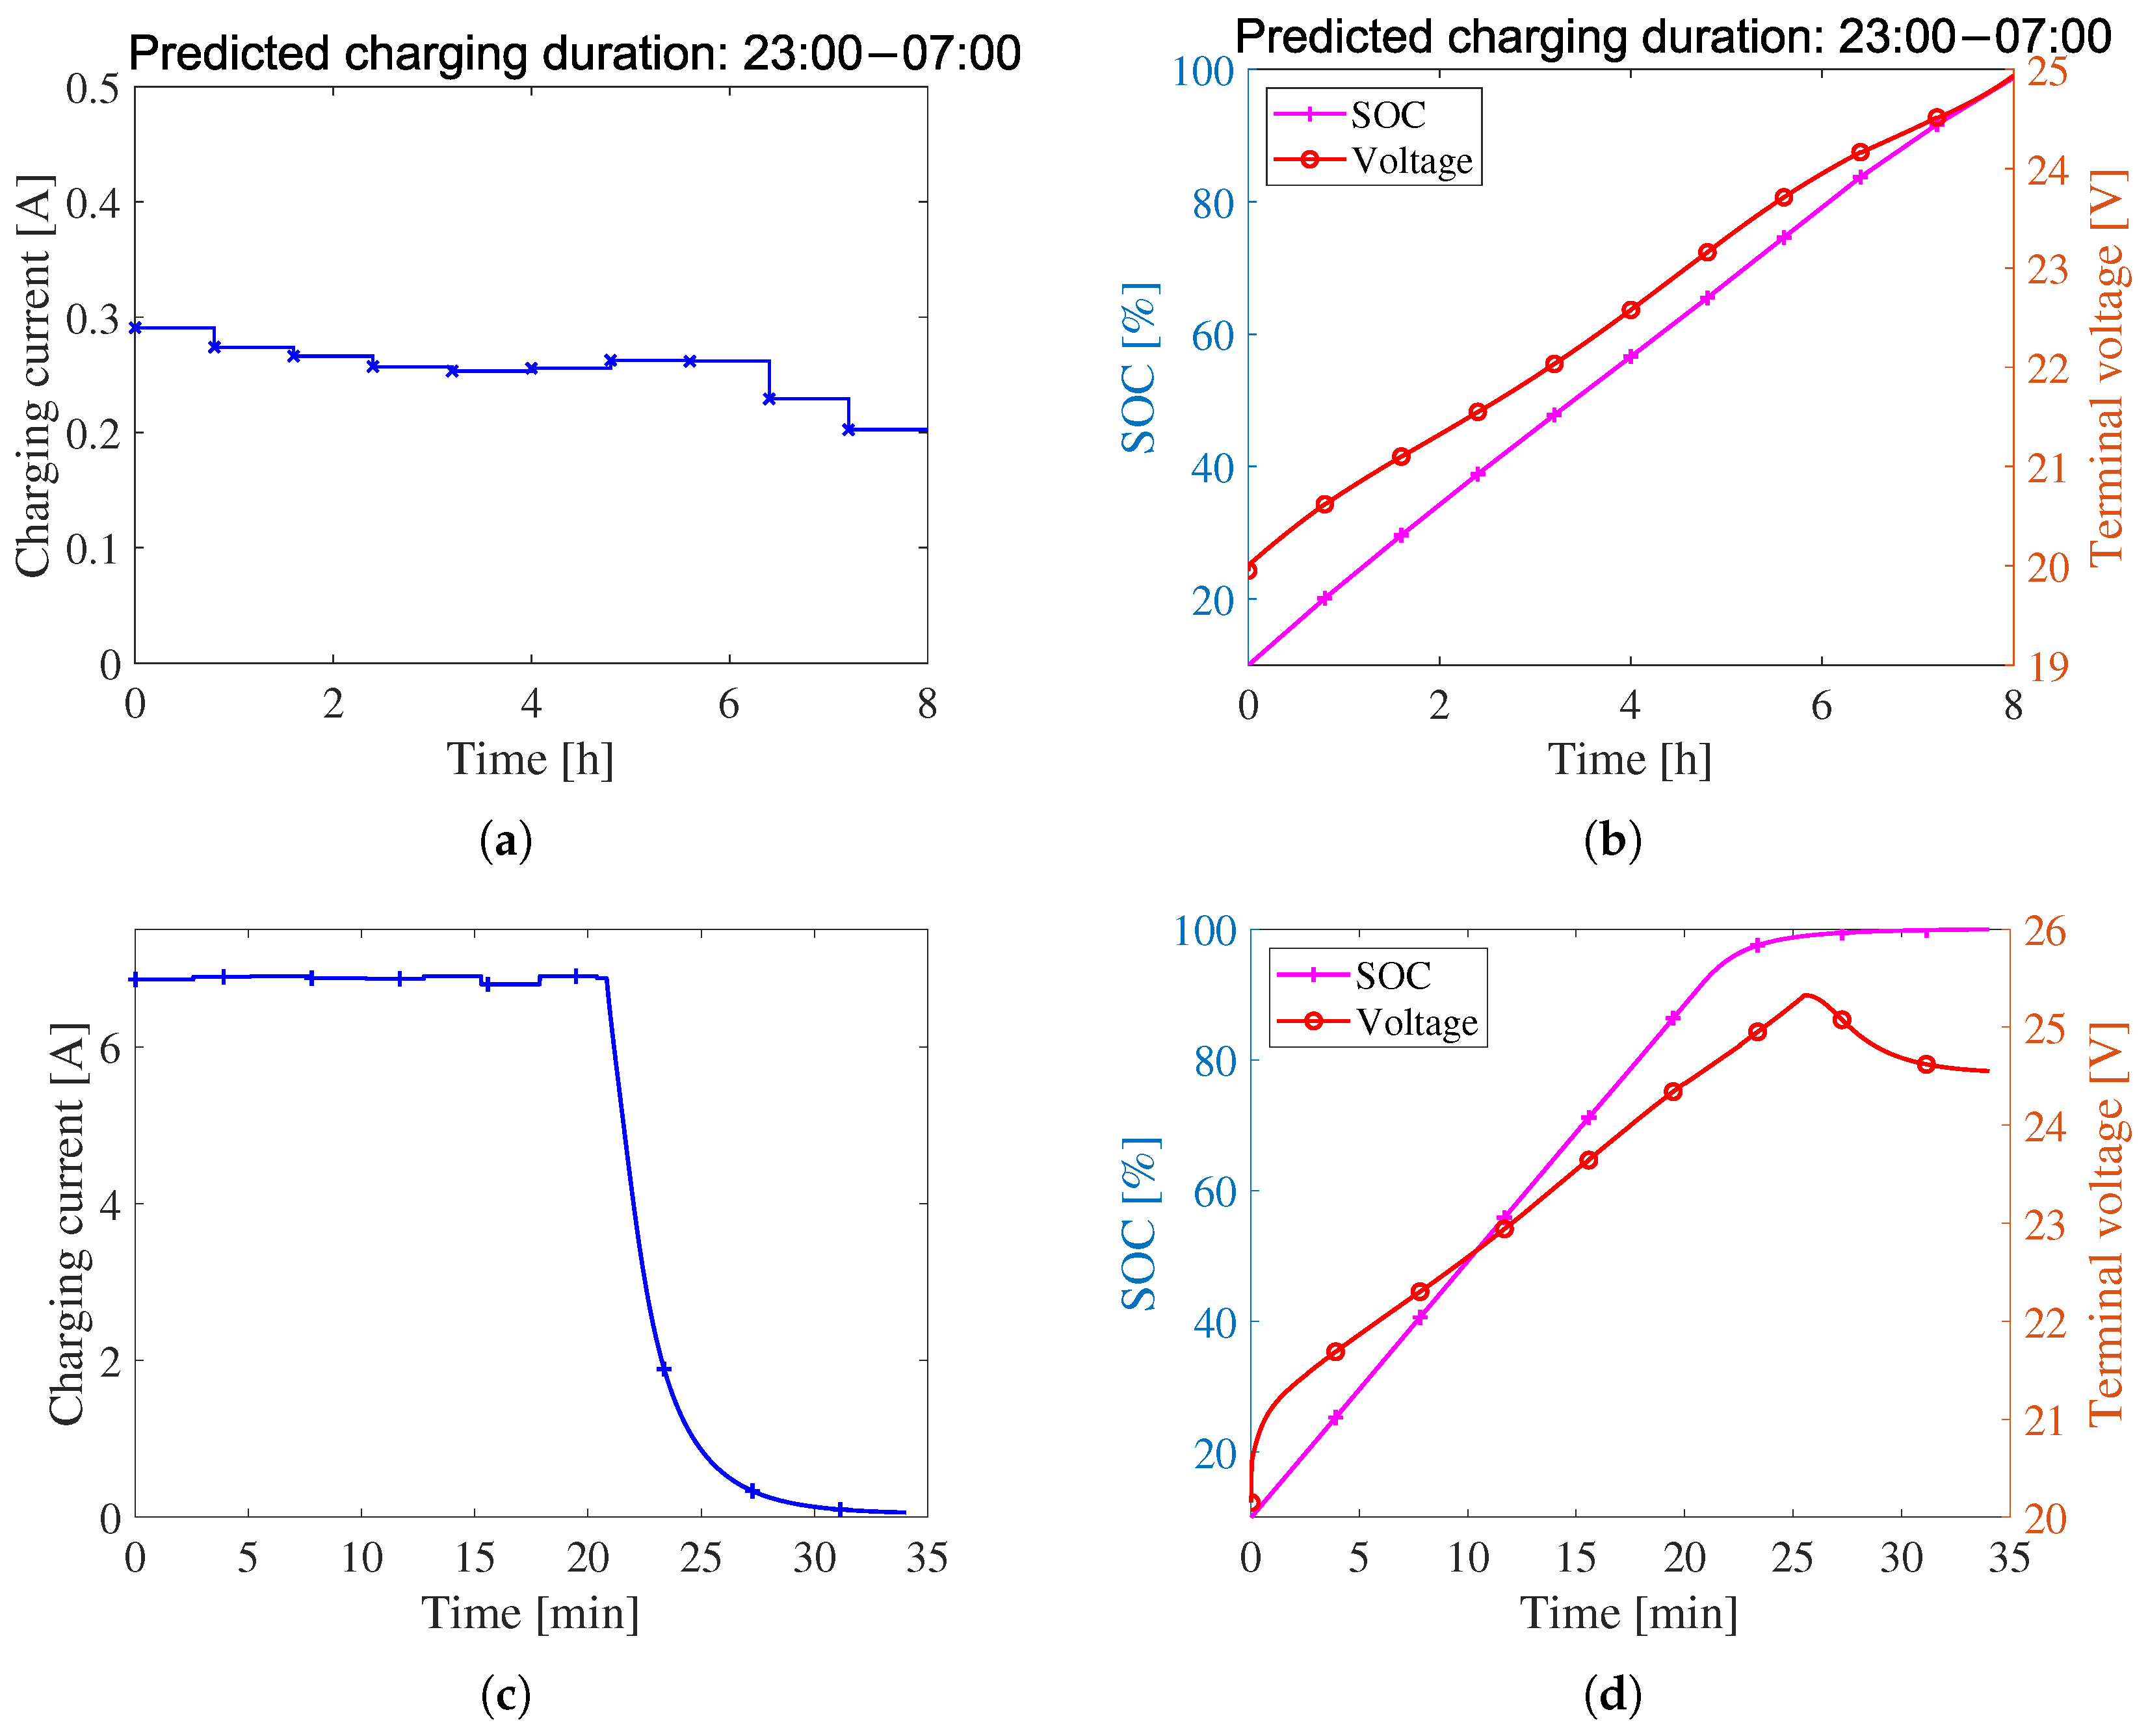
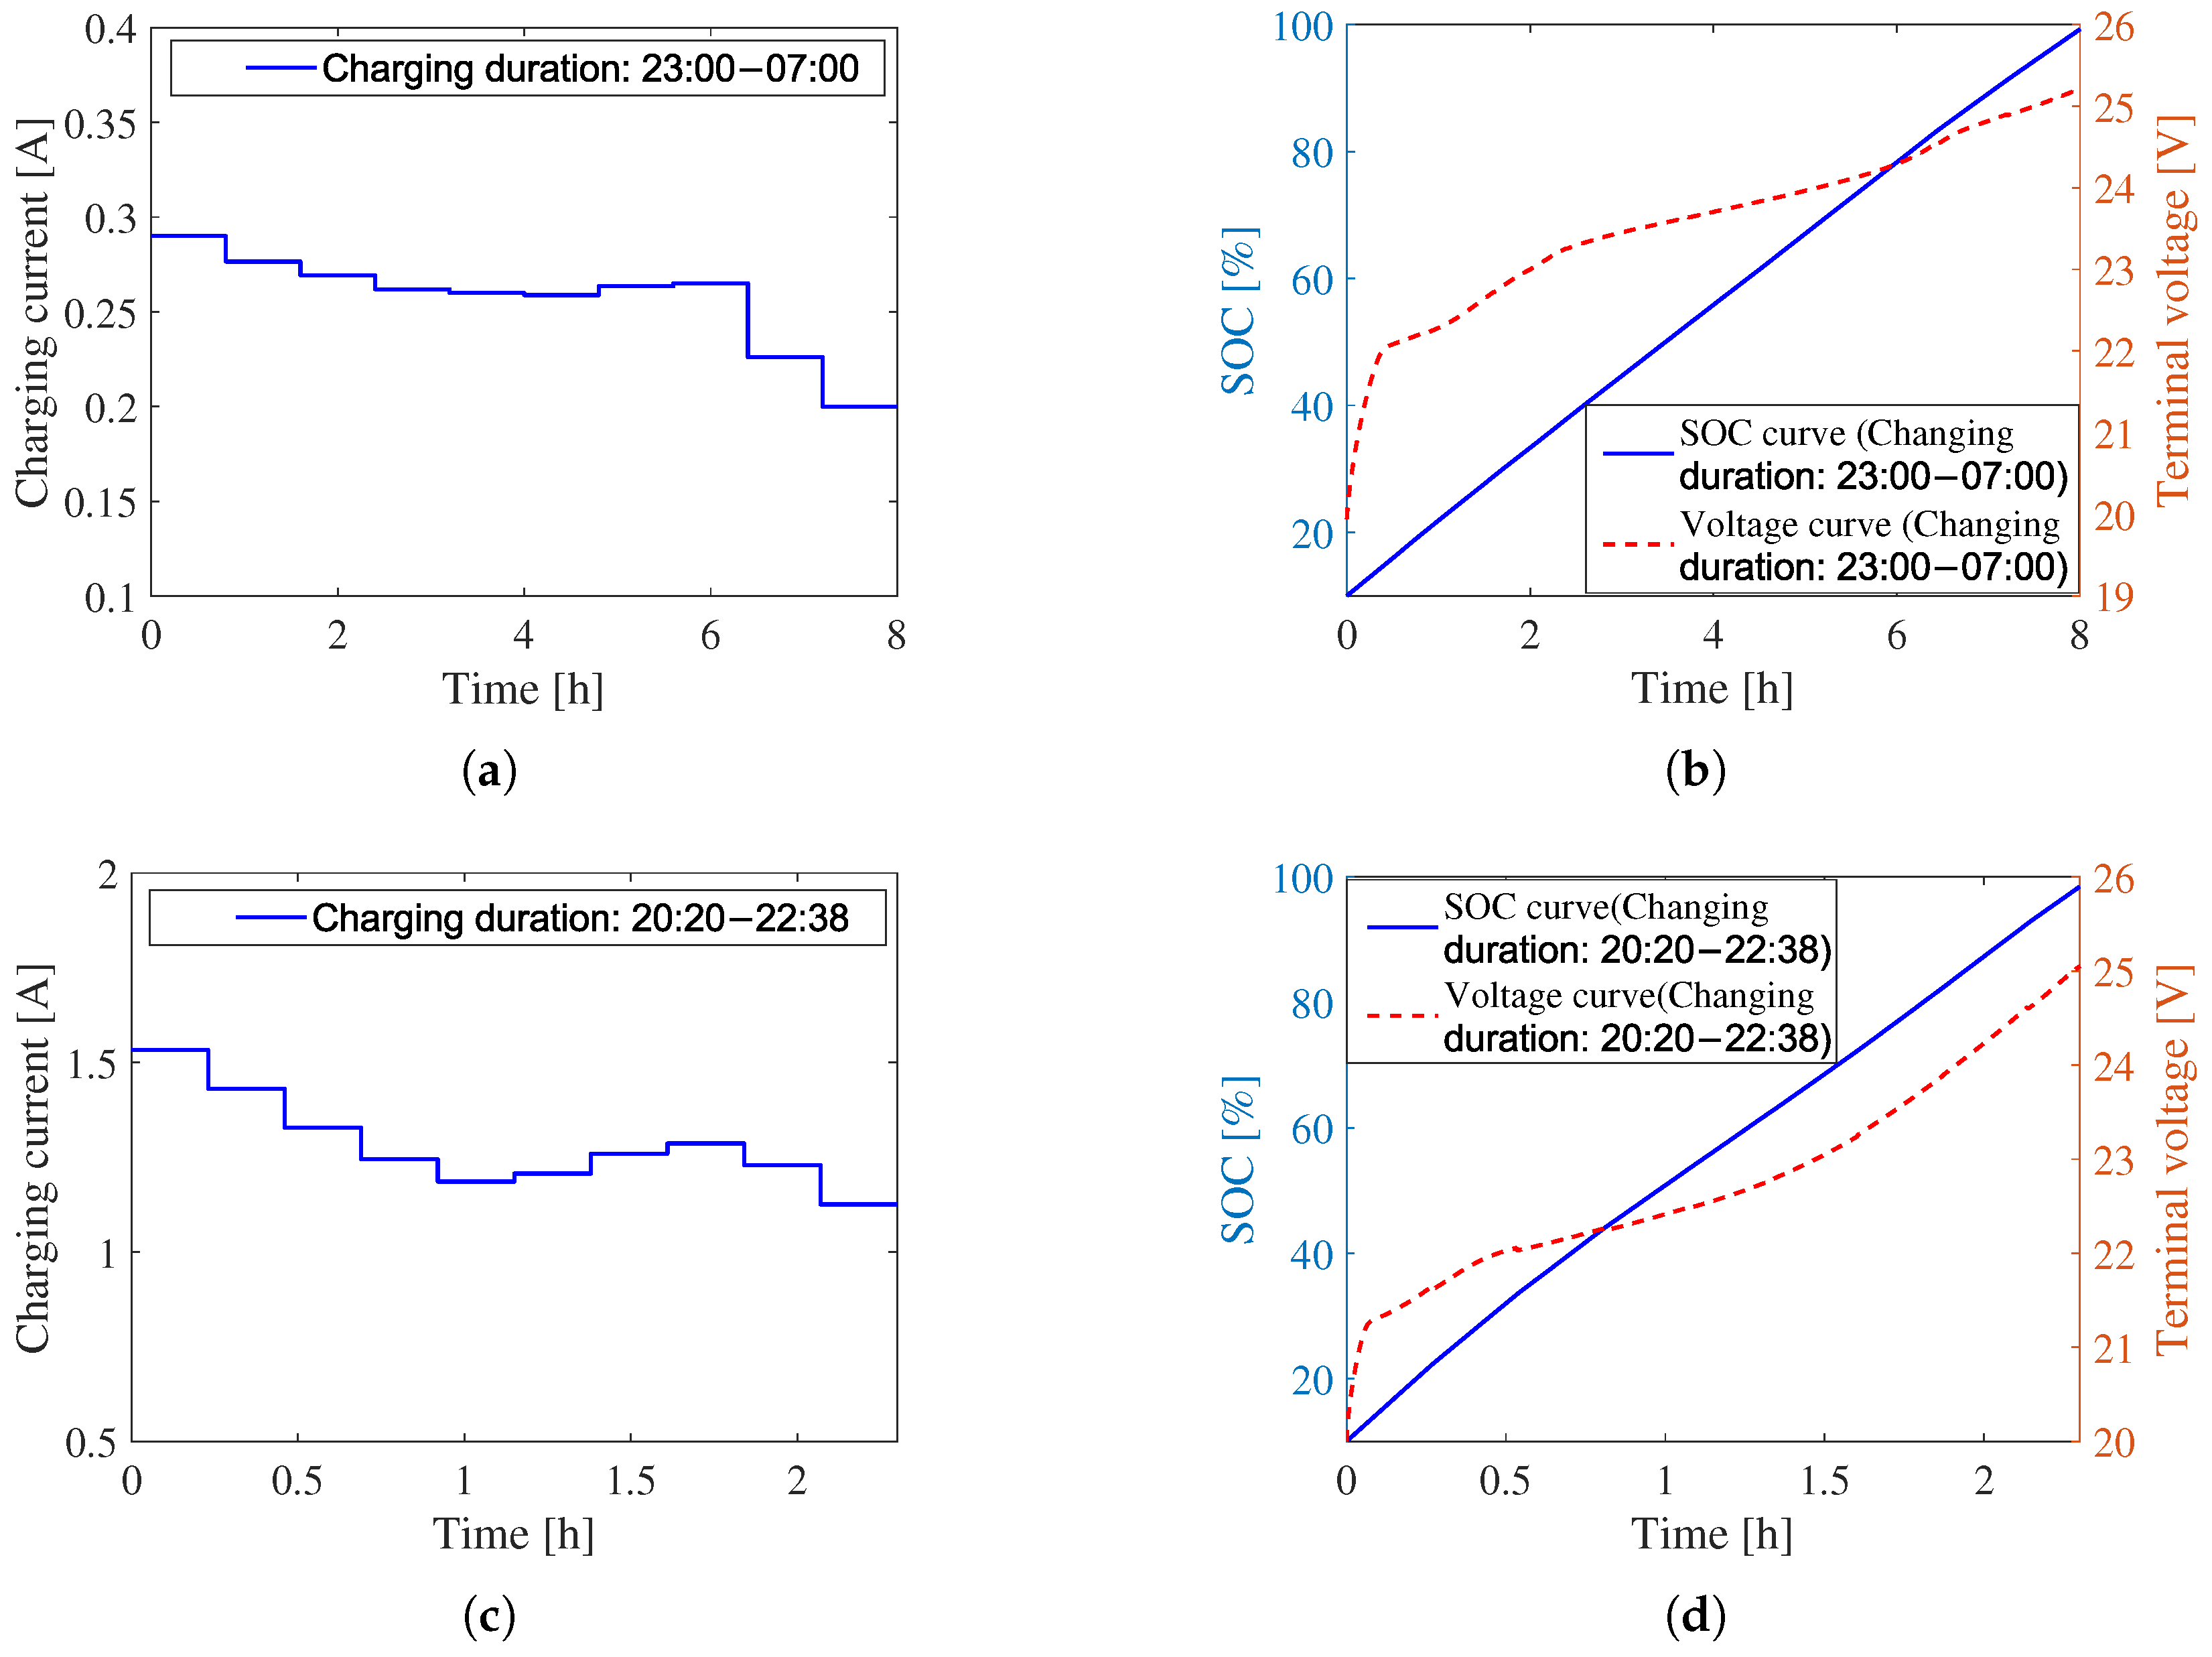
According to the charging prediction results in Figure 7, a charging case with a predicted charging duration of 23:00–07:00 was introduced. Compared with the fast charging method, the simulation results depicted in Figure 9 indicate that the healthy charging control strategy could raise the S O C to approximately 100% within the predicted duration of 8 h, meeting user demand while avoiding high charging current and voltage and ensuring that the terminal voltage met safety-related constraints. In contrast, fast charging strategy reached nearly 100% S O C in just 35 min but used high charging current and voltage.
This led to a 69.05% decrease in S O C deviation and a 10,378.0 J reduction in heat generation compared to fast charging, as shown in Table 3. The strategy effectively extends battery life by precisely predicting charging duration, decreasing the frequency of high-current usage, and staging current and voltage adjustments.

5.2. Comparison with Different Optimization Algorithms

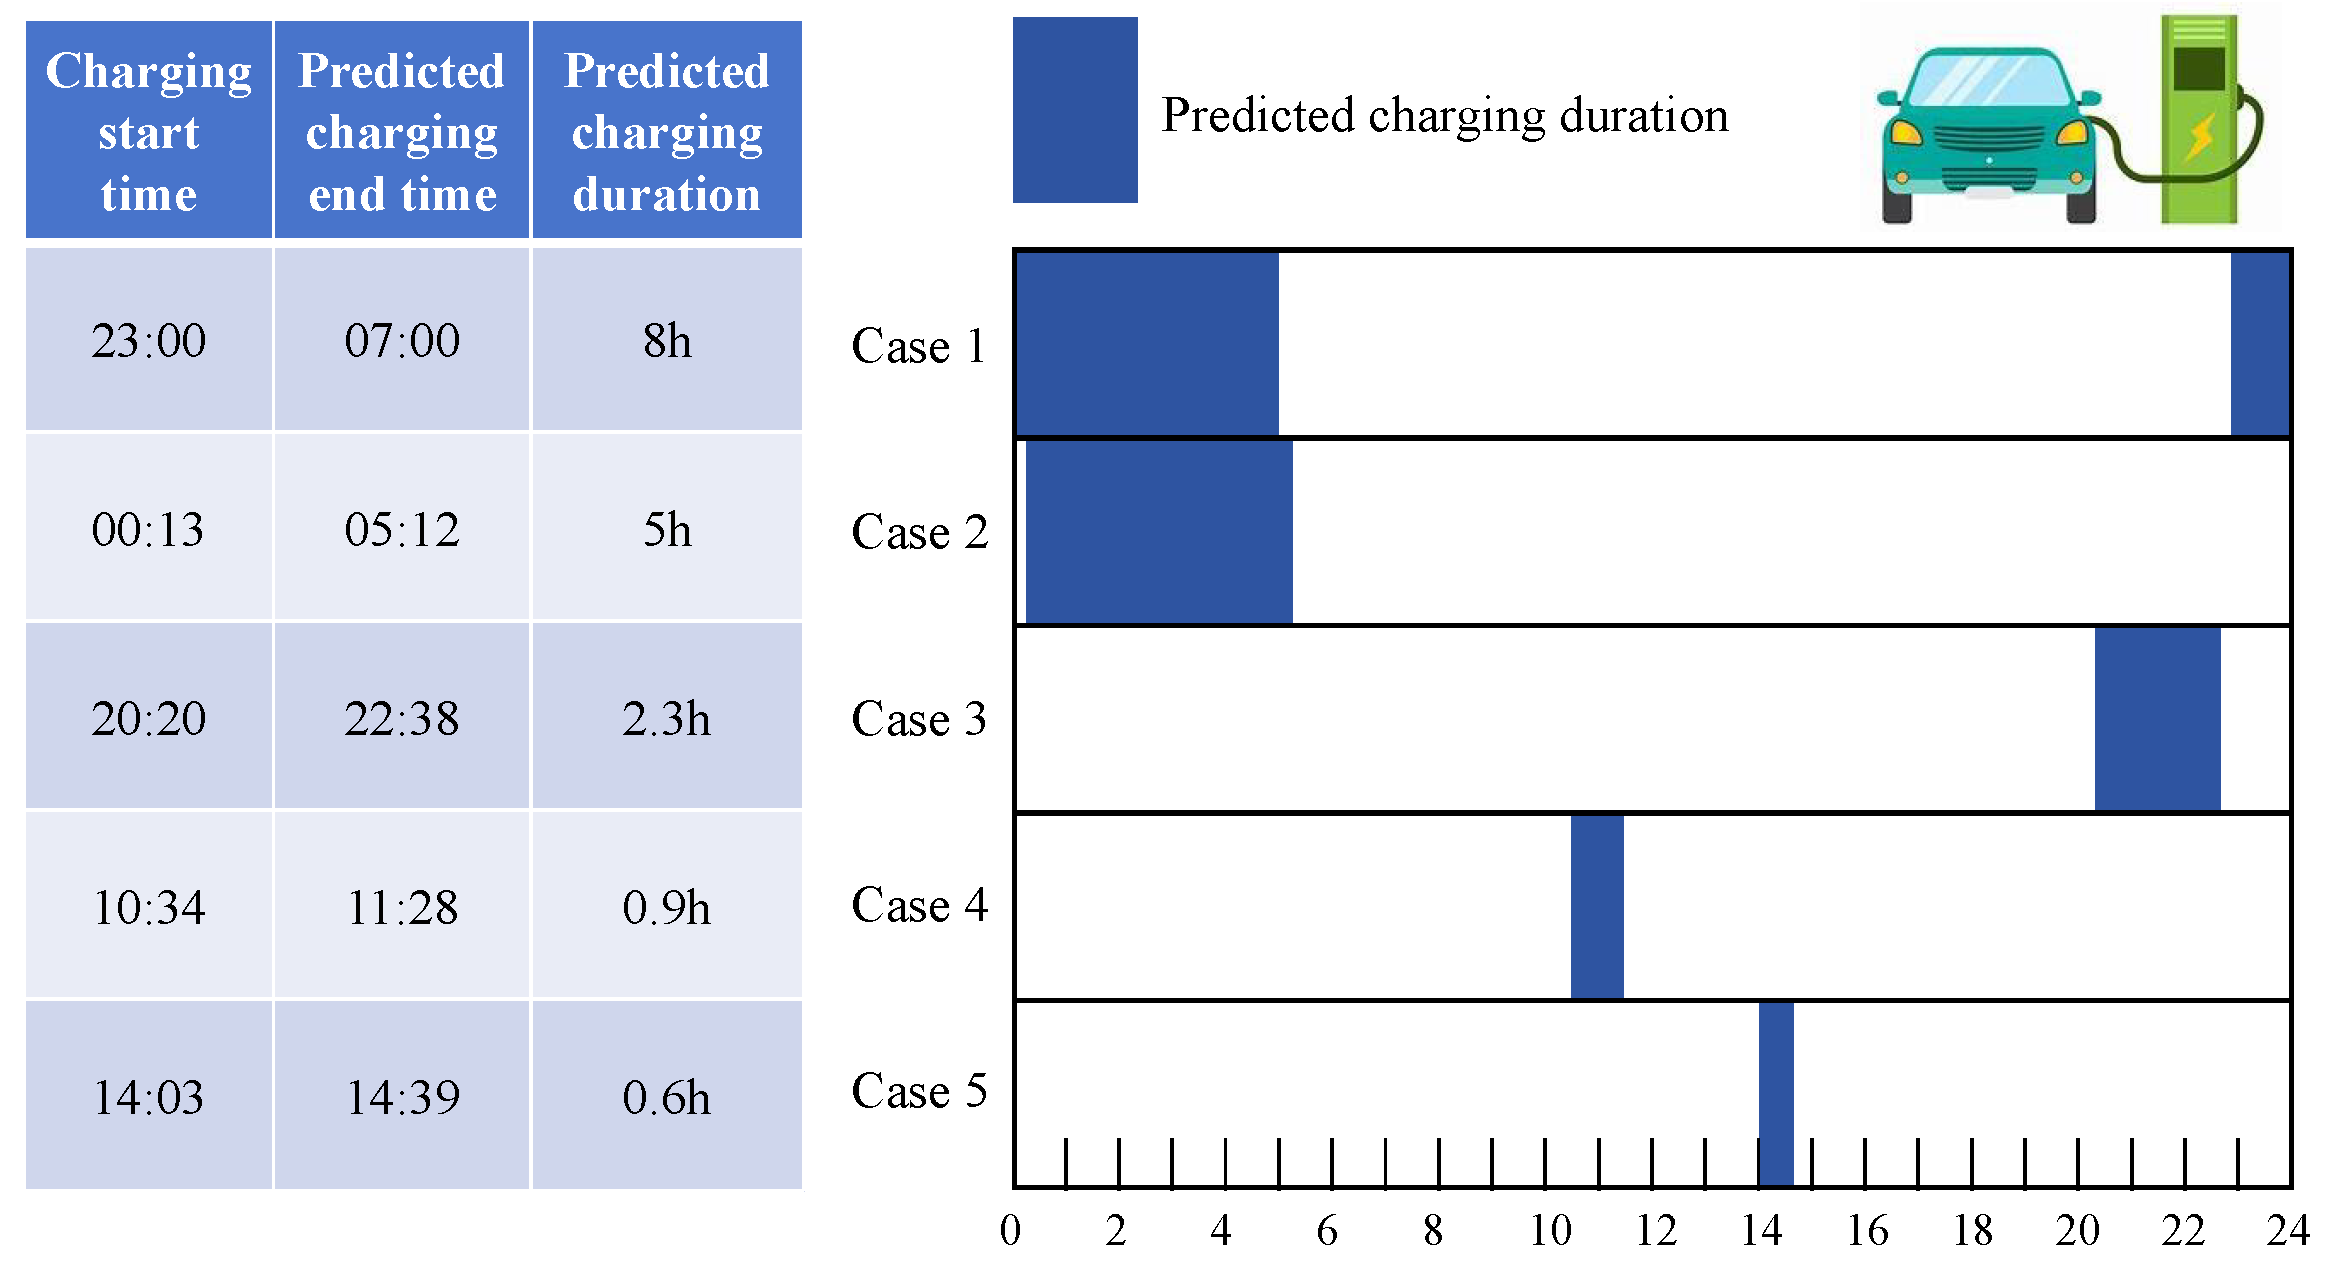
The FTTA was compared with particle swarm optimization (PSO) and a genetic algorithm (GA) for charging optimization in a case where the predicted charging duration was 5 h (from 00:13 to 05:12). In the set target weights, the electricity target took priority over heat reduction. As illustrated in Figure 10, under consistent conditions, the charging control based on the FTTA significantly outperformed other comparative algorithms in terms of performance metrics. It provided smoother charging currents with minimal fluctuations, reducing battery damage. Regarding energy loss in Figure 10d, the heat variation curve of the FTTA is lower and less fluctuating compared to those of PSO and the GA, indicating better suppression of thermal effects throughout the charging process.
As shown in Table 4, the FTTA, along with PSO and the GA, satisfied the user’s electricity demand. However, FTTA reduced energy loss by 5.98% and 9.59% compared to PSO and the GA, respectively. This means that the FTTA could reach S O C final values while generating less heat, better preserving battery health.

5.3. Comparison with Different Charging Demand

The S O H was used to measure the health status of batteries, defined as (1). Analyzing five demand cases from Figure 11, charging results with different charging durations are depicted in Figure 12a–e. With longer charging duration, the healthy charging control strategy caused less S O H degradation. And two charging strategies’ impacts on S O H loss are shown in Figure 12f. For the same initial conditions and S O C increase, fast charging led to a 0.0337% S O H decrease due to higher internal resistance and electrochemical stress. The average S O H drop caused by the healthy charging control strategy was merely 0.0275%, representing a 18.40% reduction compared to the fast charging strategy. This highlights the proposed strategy’s effectiveness in prolonging battery life.
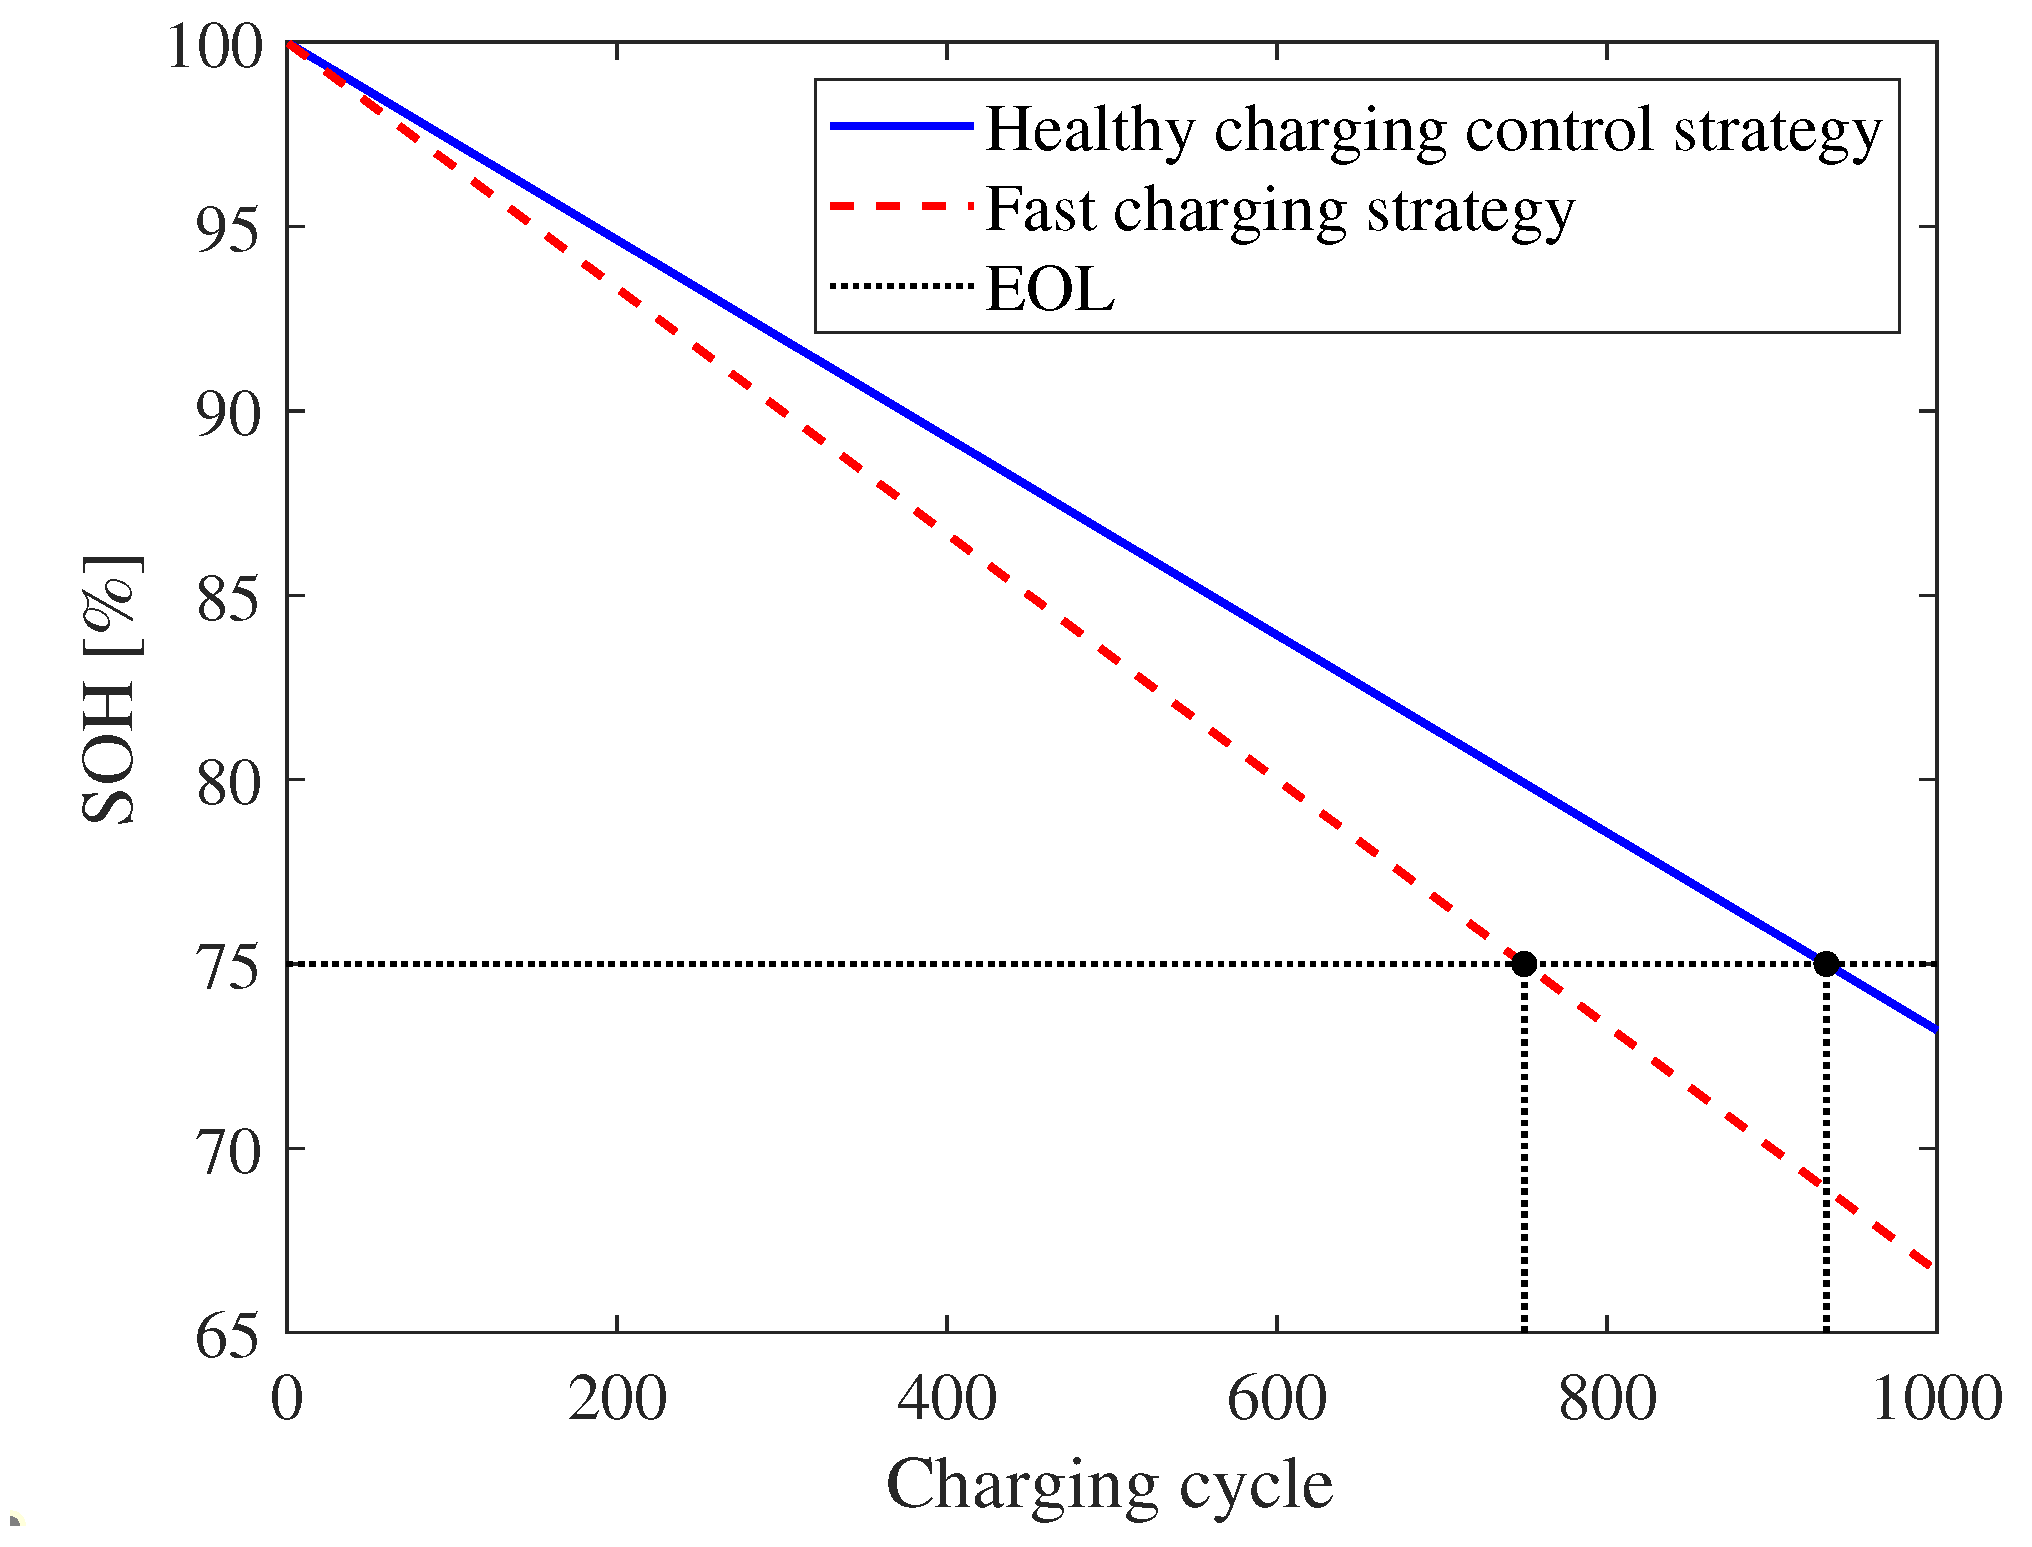
Furthermore, five batteries were charged in a fixed cycle to simulate long-term S O H trends, and the healthy charging control strategy was compared with the fast charging strategy, as shown in Figure 13. Each battery’s end of life (EOL) was defined as capacity dropping to 75% of the initial rated capacity [40]. Over 1000 cycles, the healthy charging control strategy reached EOL after 930 cycles, while the fast charging strategy reaches EOL after 740 cycles, a 25.7% increase in service life. This shows that the healthy charging control strategy significantly slows battery degradation and extends life in long-term use.

5.4. Charging Experimental Results

Based on the predicted charging duration, case 1 and case 3 were selected for the experiment. The target weights were set to γ 1 = 1 and γ 2 = 0.01 (the weights are derived from [24] and have been experimentally validated to ensure their rationality [41]), with an initial S O C of 10%. Six batteries were charged in series with a maximum charging current of 6.9 A.
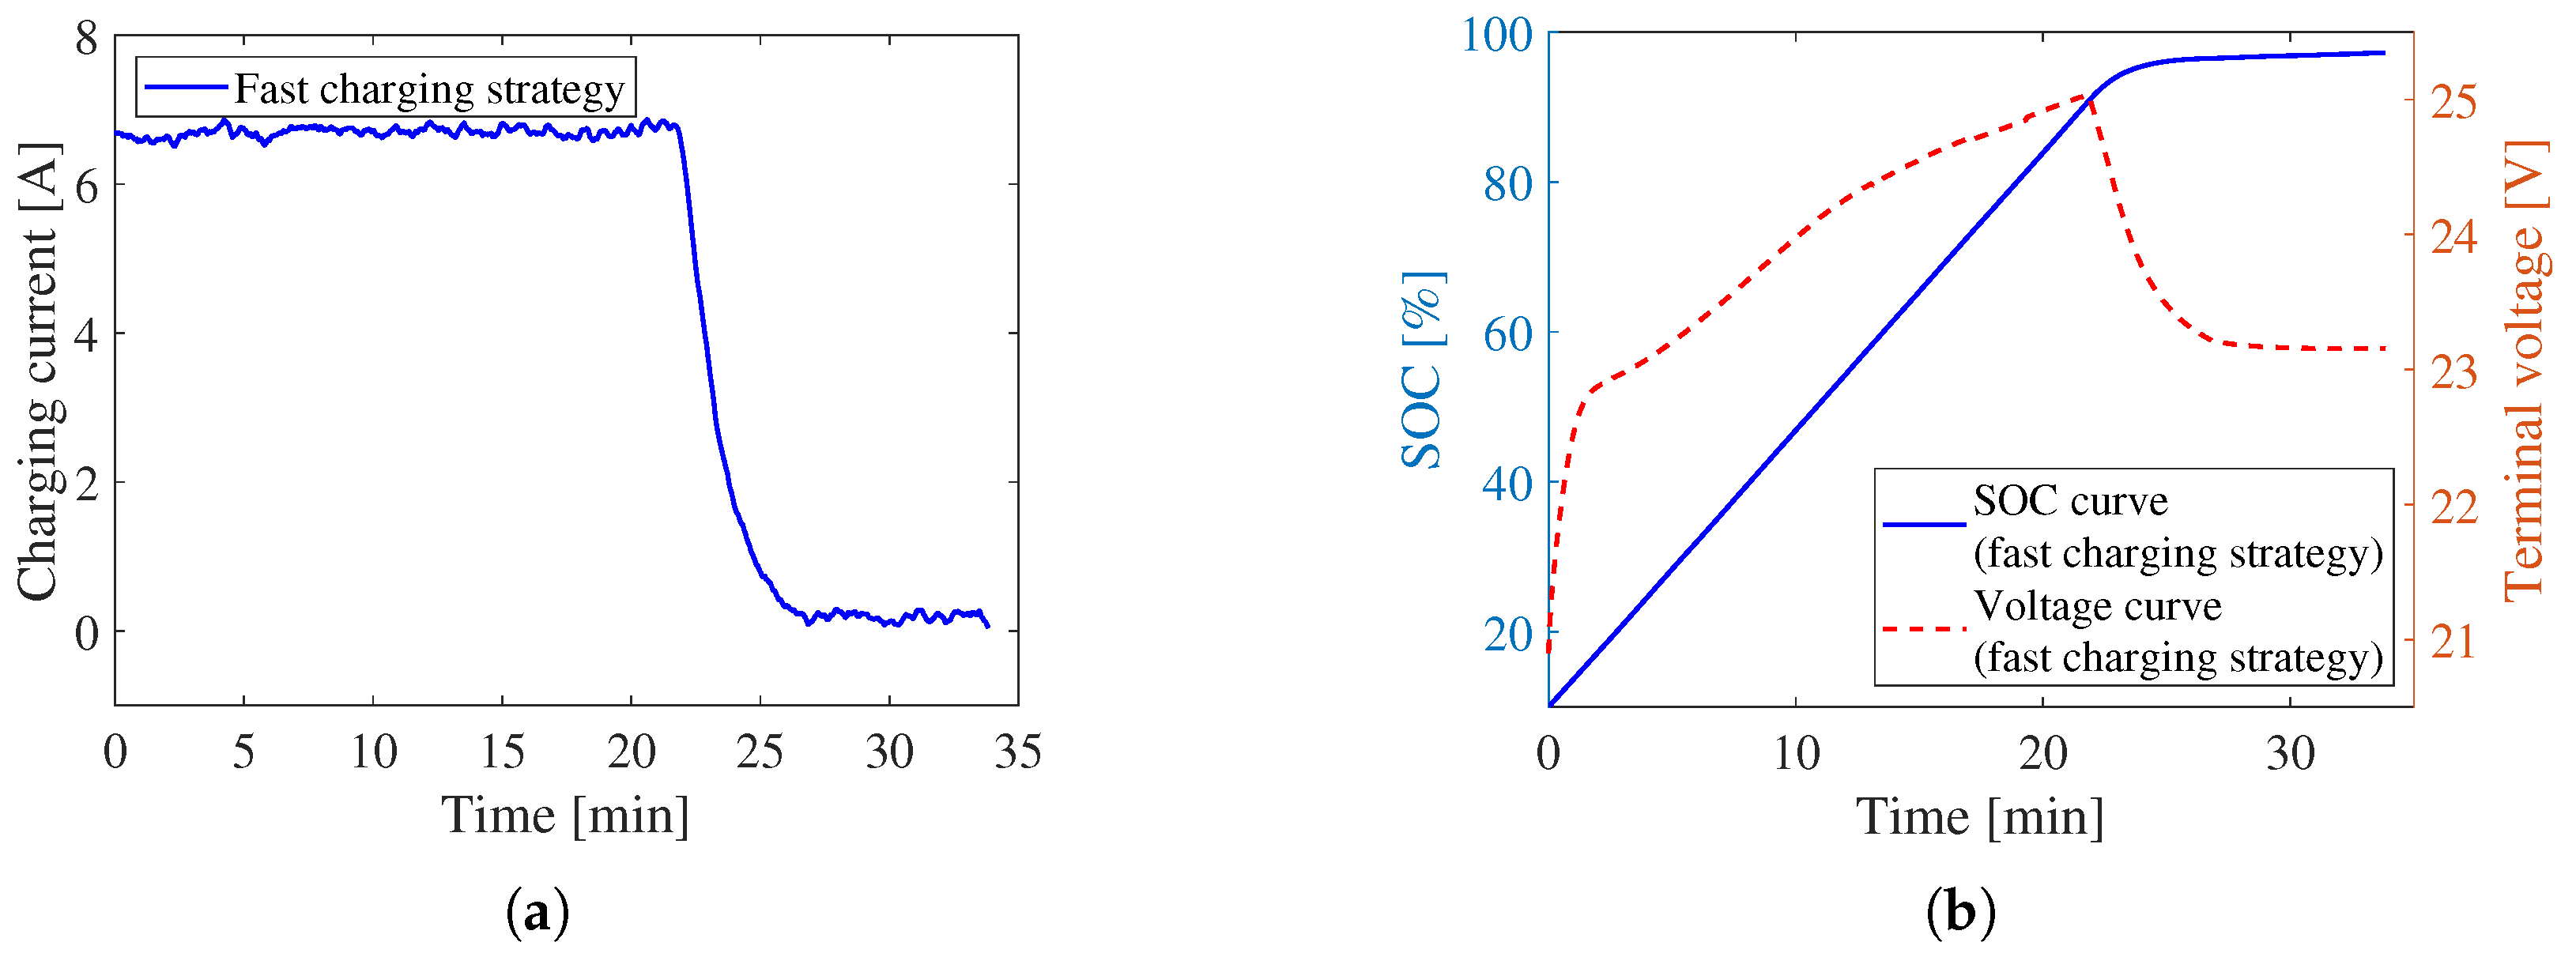
Figure 14 describes that the healthy charging control strategy adjusted the charging current flexibly based on predicted durations. It maintained a stable, low current, ensuring a smooth charging process and minimizing impact on the battery’s internal structure. Conversely, the fast charging strategy shown in Figure 15 used a high current for most of the time, which sped up charging but caused more internal side reactions and reduced cycle life. The S O C curves in Figure 14b,d reveal that the healthy charging control strategy produced smooth S O C curves, with experimental results matching simulations and avoiding S O C jumps or anomalies. While the fast charging strategy accelerated S O C rise, it risked S O C estimation errors and overcharging, as shown in Figure 15b.
Further analysis of Table 5 demonstrates that all charging cases achieved a final S O C value above 97%. When the charging termination criterion was set to 95% of the target value, the fast charging control strategy generated a total heat of 10,549.8 J, while the healthy charging cases generated only 5.8% and 24% of that amount, respectively. This indicates that the healthy charging strategy significantly reduces heat accumulation, lowers battery temperature rise, optimizes thermal management, and enhances charging safety and battery life.

6. Conclusions

This work proposes a user-demand-oriented healthy charging control strategy based on the FTTA that addresses the limitations of current methods in providing intelligent healthy charging across diverse scenarios. To tackle the randomness in user charging habits, the EHSBE model is developed in preparation for setting subsequent charging targets. It achieves an RMSE of 0.385 and an MAPE of 16.512%, demonstrating superior predictive performance compared to traditional models such as MLR, RF, CatBoost, and SVR. Based on the user demand predicted by the EHSBE, the healthy charging strategy with the FTTA can intelligently adjust charging current and significantly extends battery life without compromising charging effect. Simulation and experimental results demonstrate that the proposed strategy made the S O C approach 100% within the predicted duration. Compared to the fast charging approach, the proposed strategy only generated 5.8% and 24% of its energy loss under two different durations and extended the battery life by 25.7%. Compared to other optimization algorithms, the FTTA achieved a reduction in energy loss by 5.98% relative to that of PSO and by 9.59% relative to that of the GA. In all five case studies, charging was successfully completed within the predicted durations. In summary, the proposed strategy effectively balances charging efficiency and battery health, offering a robust solution for healthy charging in diverse scenarios.
In future research, EV charging strategies can be further optimized by interacting with the power grid and considering real-time charging station conditions, achieving smarter, more efficient, and environmentally friendly solutions, contributing to sustainable transportation and energy systems.

Author Contributions

Conceptualization, H.L.; methodology, H.L.; software, L.H. and Y.L.; investigation, H.L.; resources, H.L.; data curation, Y.W.; writing—original draft preparation, Y.L.; writing—review and editing, H.L. and L.H.; visualization, Q.O.; supervision, H.L.; funding acquisition, Q.O. and L.H. All authors have read and agreed to the published version of the manuscript.

Funding

This research was funded by the Fundamental Research Funds for the Central Universities, grant number NS2024019, and the Natural Science Foundation of Zhejiang Province, grant number LQ22F030010.

Data Availability Statement

The original contributions presented in the study are included in the article, further inquiries can be directed to the corresponding authors.

Conflicts of Interest

The authors declare no conflicts of interest.

Correction Statement

This article has been republished with a minor correction to the Data Availability Statement. This change does not affect the scientific content of the article.

References

  1. Chen, Y.; Kang, Y.; Zhao, Y.; Wang, L.; Liu, J.; Li, Y.; Liang, Z.; He, X.; Li, X.; Tavajohi, N.; et al. A review of lithium-ion battery safety concerns: The issues, strategies, and testing standards. J. Energy Chem. 2021, 59, 83–99. [Google Scholar] [CrossRef]
  2. Ronanki, D.; Karneddi, H. Electric vehicle charging infrastructure: Review, cyber security considerations, potential impacts, countermeasures, and future trends. IEEE J. Emerg. Sel. Top. Power Electron. 2023, 12, 242–256. [Google Scholar] [CrossRef]
  3. Rangarajan, S.; Sunddararaj, S.P.; Sudhakar, A.; Shiva, C.K.; Subramaniam, U.; Collins, E.R.; Senjyu, T. Lithium-ion batteries—The crux of electric vehicles with opportunities and challenges. Clean Technol. 2022, 4, 908–930. [Google Scholar] [CrossRef]
  4. Arun, V.; Kannan, R.; Ramesh, S.; Vijayakumar, M.; Raghavendran, P.; Siva Ramkumar, M.; Anbarasu, P.; Sundramurthy, V.P. Review on li-ion battery vs nickel metal hydride battery in EV. Adv. Mater. Sci. Eng. 2022, 2022, 7910072. [Google Scholar] [CrossRef]
  5. Yang, J.; Cai, Y.; Mi, C. Lithium-ion battery capacity estimation based on battery surface temperature change under constant-current charge scenario. Energy 2022, 241, 122879. [Google Scholar] [CrossRef]
  6. Notten, P.H.; het Veld, J.O.; Van Beek, J. Boostcharging Li-ion batteries: A challenging new charging concept. J. Power Sources 2005, 145, 89–94. [Google Scholar] [CrossRef]
  7. Pavković, D.; Kasać, J.; Krznar, M.; Cipek, M. Adaptive Constant-Current/Constant-Voltage Charging of a Battery Cell Based on Cell Open-Circuit Voltage Estimation. World Electr. Vehic. J. 2023, 14, 155. [Google Scholar] [CrossRef]
  8. Lin, Q.; Wang, J.; Xiong, R.; Shen, W.; He, H. Towards a smarter battery management system: A critical review on optimal charging methods of lithium ion batteries. Energy 2019, 183, 220–234. [Google Scholar] [CrossRef]
  9. Tu, H.; Feng, H.; Srdic, S.; Lukic, S. Extreme fast charging of electric vehicles: A technology overview. IEEE Trans. Transp. Electrif. 2019, 5, 861–878. [Google Scholar] [CrossRef]
  10. Peng, C.; Yang, L.; Zhang, Q.; Liu, Z.; Guo, W.; Hu, B.; Li, Q.; Li, C.; Li, J. Optimization of fast-charging strategies for lithium-ion batteries with Kriging-Assisted evolution. Int. J. Energy Res. 2022, 46, 24381–24394. [Google Scholar] [CrossRef]
  11. Zentani, A.; Almaktoof, A.; Kahn, M.T. A Comprehensive Review of Developments in Electric Vehicles Fast Charging Technology. Appl. Sci. 2024, 14, 4728. [Google Scholar] [CrossRef]
  12. Qu, J.; Jiang, Z.; Zhang, J. Investigation on lithium-ion battery degradation induced by combined effect of current rate and operating temperature during fast charging. J. Energy Storage 2022, 52, 104811. [Google Scholar] [CrossRef]
  13. Ji, G.; He, L.; Wu, T.; Cui, G. The design of fast charging strategy for lithium-ion batteries and intelligent application: A comprehensive review. Appl. Energy 2025, 377, 124538. [Google Scholar] [CrossRef]
  14. Tahir, M.U.; Sangwongwanich, A.; Stroe, D.I.; Blaabjerg, F. Multi-objective optimization for multi-stage constant current charging for Li-ion batteries. J. Energy Storage 2024, 86, 111313. [Google Scholar] [CrossRef]
  15. Chen, Z.; Shu, X.; Xiao, R.; Yan, W.; Liu, Y.; Shen, J. Optimal charging strategy design for lithium-ion batteries considering minimization of temperature rise and energy loss. Int. J. Energy Res. 2019, 43, 4344–4358. [Google Scholar] [CrossRef]
  16. Lin, R.; Chu, H.; Gao, J.; Chen, H. Charging management and pricing strategy of electric vehicle charging station based on mean field game theory. Asian J. Control 2024, 26, 803–813. [Google Scholar] [CrossRef]
  17. Han, S. Optimal Charging Current Protocol with Multi-Stage Constant Current Using Dandelion Optimizer for Time-Domain Modeled Lithium-Ion Batteries. Appl. Sci. 2024, 14, 11320. [Google Scholar] [CrossRef]
  18. Fang, H.; Wang, Y.; Chen, J. Health-Aware and User-Involved Battery Charging Management for Electric Vehicles: Linear Quadratic Strategies. IEEE Trans. Control Syst. Technol. 2017, 25, 911–923. [Google Scholar] [CrossRef]
  19. Liu, K.; Li, K.; Ma, H.; Zhang, J.; Peng, Q. Multi-objective optimization of charging patterns for lithium-ion battery management. Energy Convers. Manage. 2018, 159, 151–162. [Google Scholar] [CrossRef]
  20. Shahriar, S.; Al-Ali, A.R.; Osman, A.H.; Dhou, S.; Nijim, M. Prediction of EV Charging Behavior Using Machine Learning. IEEE Access 2021, 9, 111576–111586. [Google Scholar] [CrossRef]
  21. Ullah, I.; Liu, K.; Yamamoto, T.; Zahid, M.; Jamal, A. Prediction of electric vehicle charging duration time using ensemble machine learning algorithm and Shapley additive explanations. Int. J. Energy Res. 2022, 46, 15211–15230. [Google Scholar] [CrossRef]
  22. Yapıcı, A.T.; Abut, N.; Erfidan, T. Comparing the Effectiveness of Deep Learning Approaches for Charging Time Prediction in Electric Vehicles: Kocaeli Example. Energies 2025, 18, 1961. [Google Scholar] [CrossRef]
  23. Hou, J.; Cui, Y.; Rong, M.; Jin, B. An Improved Football Team Training Algorithm for Global Optimization. Biomimetics 2024, 9, 419. [Google Scholar] [CrossRef]
  24. Ouyang, Q.; Fang, R.; Xu, G.; Liu, Y. User-involved charging control for lithium-ion batteries with economic cost optimization. Appl. Energy 2022, 314, 118878. [Google Scholar] [CrossRef]
  25. Botsford, C.; Szczepanek, A. Fast charging vs. slow charging: Pros and cons for the new age of electric vehicles. In Proceedings of the International Battery Hybrid Fuel Cell Electric Vehicle Symposium, Stavanger, Norway, 13–16 May 2009; Citeseer: Princeton, NJ, USA, 2009; pp. 1–9. [Google Scholar]
  26. Miller, C.; Goutham, M.; Chen, X.; Hanumalagutti, P.D.; Blaser, R.; Stockar, S. A Semi-Empirical Approach to a Physically Based Aging Model for Home Energy Management Systems. In Proceedings of the 2022 IEEE Conference on Control Technology and Applications (CCTA), Trieste, Italy, 23–25 August 2022; IEEE: Piscataway, NJ, USA, 2022; pp. 165–170. [Google Scholar]
  27. Jin, X.; Vora, A.; Hoshing, V.; Saha, T.; Shaver, G.; García, R.E.; Wasynczuk, O.; Varigonda, S. Physically-based reduced-order capacity loss model for graphite anodes in Li-ion battery cells. J. Power Sources 2017, 342, 750–761. [Google Scholar] [CrossRef]
  28. Tranmer, M.; Elliot, M. Multiple linear regression. Cathie Marsh Cent. Census Surv. Res. (CCSR) 2008, 5, 1–5. [Google Scholar]
  29. Awad, M.; Khanna, R.; Awad, M.; Khanna, R. Support vector regression. In Efficient Learning Machines: Theories, Concepts, and Applications for Engineers and System Designers; Apress: Berkeley, CA, USA, 2015; pp. 67–80. [Google Scholar]
  30. Zou, J.; Han, Y.; So, S.S. Overview of artificial neural networks. In Artificial Neural Networks: Methods and Applications; Humana: Totowa, NJ, USA, 2009; pp. 14–22. [Google Scholar]
  31. Chen, T.; Guestrin, C. Xgboost: A scalable tree boosting system. In Proceedings of the 22nd ACM SIGKDD International Conference on Knowledge Discovery and Data Mining, San Francisco, CA, USA, 13–17 August 2016; pp. 785–794. [Google Scholar]
  32. Rigatti, S.J. Random forest. J. Insur. Med. 2017, 47, 31–39. [Google Scholar] [CrossRef]
  33. Tyralis, H.; Papacharalampous, G. Boosting algorithms in energy research: A systematic review. Neural Comput. Appl. 2021, 33, 14101–14117. [Google Scholar] [CrossRef]
  34. Prokhorenkova, L.; Gusev, G.; Vorobev, A.; Dorogush, A.V.; Gulin, A. CatBoost: Unbiased boosting with categorical features. In Advances in Neural Information Processing Systems; MIT Press: Cambridge, MA, USA, 2018; Volume 31. [Google Scholar]
  35. Pavlyshenko, B. Using stacking approaches for machine learning models. In Proceedings of the 2018 IEEE Second International Conference on Data Stream Mining & Processing (DSMP), Lviv, Ukraine, 21–25 August 2018; IEEE: Piscataway, NJ, USA, 2018; pp. 255–258. [Google Scholar]
  36. Bertsimas, D.; Tsitsiklis, J. Simulated annealing. Stat. Sci. 1993, 8, 10–15. [Google Scholar] [CrossRef]
  37. Jain, Y.K.; Bhandare, S.K. Min max normalization based data perturbation method for privacy protection. Int. J. Comput. Commun. Technol. 2011, 2, 45–50. [Google Scholar] [CrossRef]
  38. Vermeer, W.; Mouli, G.R.C.; Bauer, P. A comprehensive review on the characteristics and modeling of lithium-ion battery aging. IEEE Trans. Transp. Electrif. 2021, 8, 2205–2232. [Google Scholar] [CrossRef]
  39. Tian, Z.; Gai, M. Football team training algorithm: A novel sport-inspired meta-heuristic optimization algorithm for global optimization. Expert Syst. Appl. 2024, 245, 123088. [Google Scholar] [CrossRef]
  40. Canals Casals, L.; Etxandi-Santolaya, M.; Bibiloni-Mulet, P.A.; Corchero, C.; Trilla, L. Electric vehicle battery health expected at end of life in the upcoming years based on UK data. Batteries 2022, 8, 164. [Google Scholar] [CrossRef]
  41. Zoltowska, I. Risk Preferences of EV Fleet Aggregators in Day-Ahead Market Bidding: Mean-CVaR Linear Programming Model. Energies 2024, 18, 93. [Google Scholar] [CrossRef]
Figure 1. The framework of the user-demand-oriented healthy charging control strategy.
Batteries 11 00344 g001
Figure 2. The framework of EHSBE model.
Batteries 11 00344 g002
Figure 3. The design of the user-demand-oriented healthy charging control strategy.
Batteries 11 00344 g003
Figure 4. The first-order RC equivalent circuit model of LiBs.
Batteries 11 00344 g004
Figure 5. The steps of the FTTA.
Batteries 11 00344 g005
Figure 6. A diagram of collective training.
Batteries 11 00344 g006
Figure 7. Comparison of charging duration prediction results for different methods.
Batteries 11 00344 g007
Figure 8. (a) Overall framework diagram and (b) physical image of experimental platform.
Batteries 11 00344 g008
Figure 9. Simulation results of batteries: (a) charging current, (b) S O C , and terminal voltage based on healthy charging control strategy; (c) charging current, (d) S O C , and terminal voltage based on fast charging strategy.
Batteries 11 00344 g009
Figure 10. Simulation results of batteries: (a) charging current, (b) S O C , (c) terminal voltage, and (d) heat generation under different optimization algorithms.
Batteries 11 00344 g010
Figure 11. Distribution of different user requirements.
Batteries 11 00344 g011
Figure 12. Charging current and terminal voltage curves for (a) case 1, (b) case 2, (c) case 3, (d) case 4, (e) and case 5 and (f) the S O H change of one charging circle completed under different charging cases and strategies.
Batteries 11 00344 g012
Figure 13. Long-term S O H changes under different charging strategies.
Batteries 11 00344 g013
Figure 14. Experimental results based on healthy charging control strategy for batteries: (a) current, (b) S O C , and voltage for case 1 and (c) current, (d) S O C , and voltage for case 3.
Batteries 11 00344 g014
Figure 15. Experimental results based on fast charging strategy for batteries: (a) current, (b) S O C , and voltage.
Batteries 11 00344 g015
Table 1. Configuration details in EHSBE model.
ModelConfiguration
MLR- The number of CPU cores used for computation: all available cores
SVR- Tolerance: 0.1
RF- The minimum number of leaves: 5
XGBoost- The number of basic estimators: 70
- The number of leaf nodes in a single tree model: 5
ANN- Activation function: tanh
- Learning rate: 0.01
CatBoost- Learning rate: 0.3
Table 2. Statistical results of different charging duration prediction methods.
User 1RMSEMAEMAPESMAPE
EHSBE0.3850.19016.512%16.161%
MLR0.6260.23420.458%18.267%
RF0.3910.19120.647%18.324%
CatBoost0.5400.22422.278%19.432%
SVR0.5980.28428.640%28.028%
Table 3. Performance comparison using different charging strategies.
Charging Strategy SOC Final Value SOC DeviationEnergy Loss
Healthy charging0.99870.0013620.0 J
Fast charging0.99580.004210,998.0 J
Table 4. Performance comparison using different optimization algorithms.
Algorithms SOC Final Value SOC DeviationEnergy Loss
FTTA0.99880.00121029.0 J
PSO0.99750.00251094.4 J
GA0.99800.00201138.2 J
Table 5. Evaluation of the experimental performance.
Charging Strategy SOC Final Value SOC DeviationEnergy Loss
Healthy charging case 10.99270.0073614.4 J
Healthy charging case 30.97610.02392569.8 J
Fast charging0.97240.027610,549.8 J
Disclaimer/Publisher’s Note: The statements, opinions and data contained in all publications are solely those of the individual author(s) and contributor(s) and not of MDPI and/or the editor(s). MDPI and/or the editor(s) disclaim responsibility for any injury to people or property resulting from any ideas, methods, instructions or products referred to in the content.