Rapid and Non-Invasive SoH Estimation of Lithium-Ion Cells via Automated EIS and EEC Models
Abstract
1. Introduction
- Requirement for cycler equipment: The testing equipment must be capable of handling increasing charge–discharge power levels proportional to the capacity of the module under evaluation. As module capacity scales up, so does the need for more robust and higher-power cyclers.
- Time consumption: Standard testing protocols typically require charge and discharge rates between 1 C and 0.2 C, which corresponds to a duration of approximately 1 to 5 h per cycle. This results in significant time investment for each complete test.
- Energy consumption and efficiency: During the charging phase, energy is drawn from the grid to charge the cell. In the discharge phase, unless advanced energy recovery systems are employed, the energy released by the cell is typically dissipated as heat and consequently lost, resulting in low overall energy efficiency.
- Safety considerations: Full cycling of cells and modules involves high current and voltage levels, necessitating rigorous safety measures. These include thermal management, electrical isolation, and overcurrent/overvoltage protections to mitigate risks of fire, short circuits, and thermal runaway.
- Significantly reduced time requirements: EIS measurements can be completed in under five minutes per cell, whereas standard capacity determination through galvanostatic cycling typically requires over two hours per cycle.
- Minimal energy consumption: EIS involves the application of low-amplitude alternating current signals, resulting in energy consumption several orders of magnitude lower than that of full cycling tests. The absence of charge and discharge processes also enhances operational safety.
- Insight into degradation mechanisms: Beyond providing a quantitative SoH percentage, EIS spectra reflect internal electrochemical and physical changes within the cell. These measurements can be used to identify and analyze degradation pathways, such as solid electrolyte interphase (SEI) growth, lithium plating, or loss of active material.
- Predictive failure diagnostics: Variations in EIS indicators often precede catastrophic failures, allowing for early detection of latent defects or emerging failures. This predictive capability can be critical for the safe second-life deployment of used Li-ion cells.
2. Materials and Methods
3. Results and Discussion
3.1. Aging Cycling
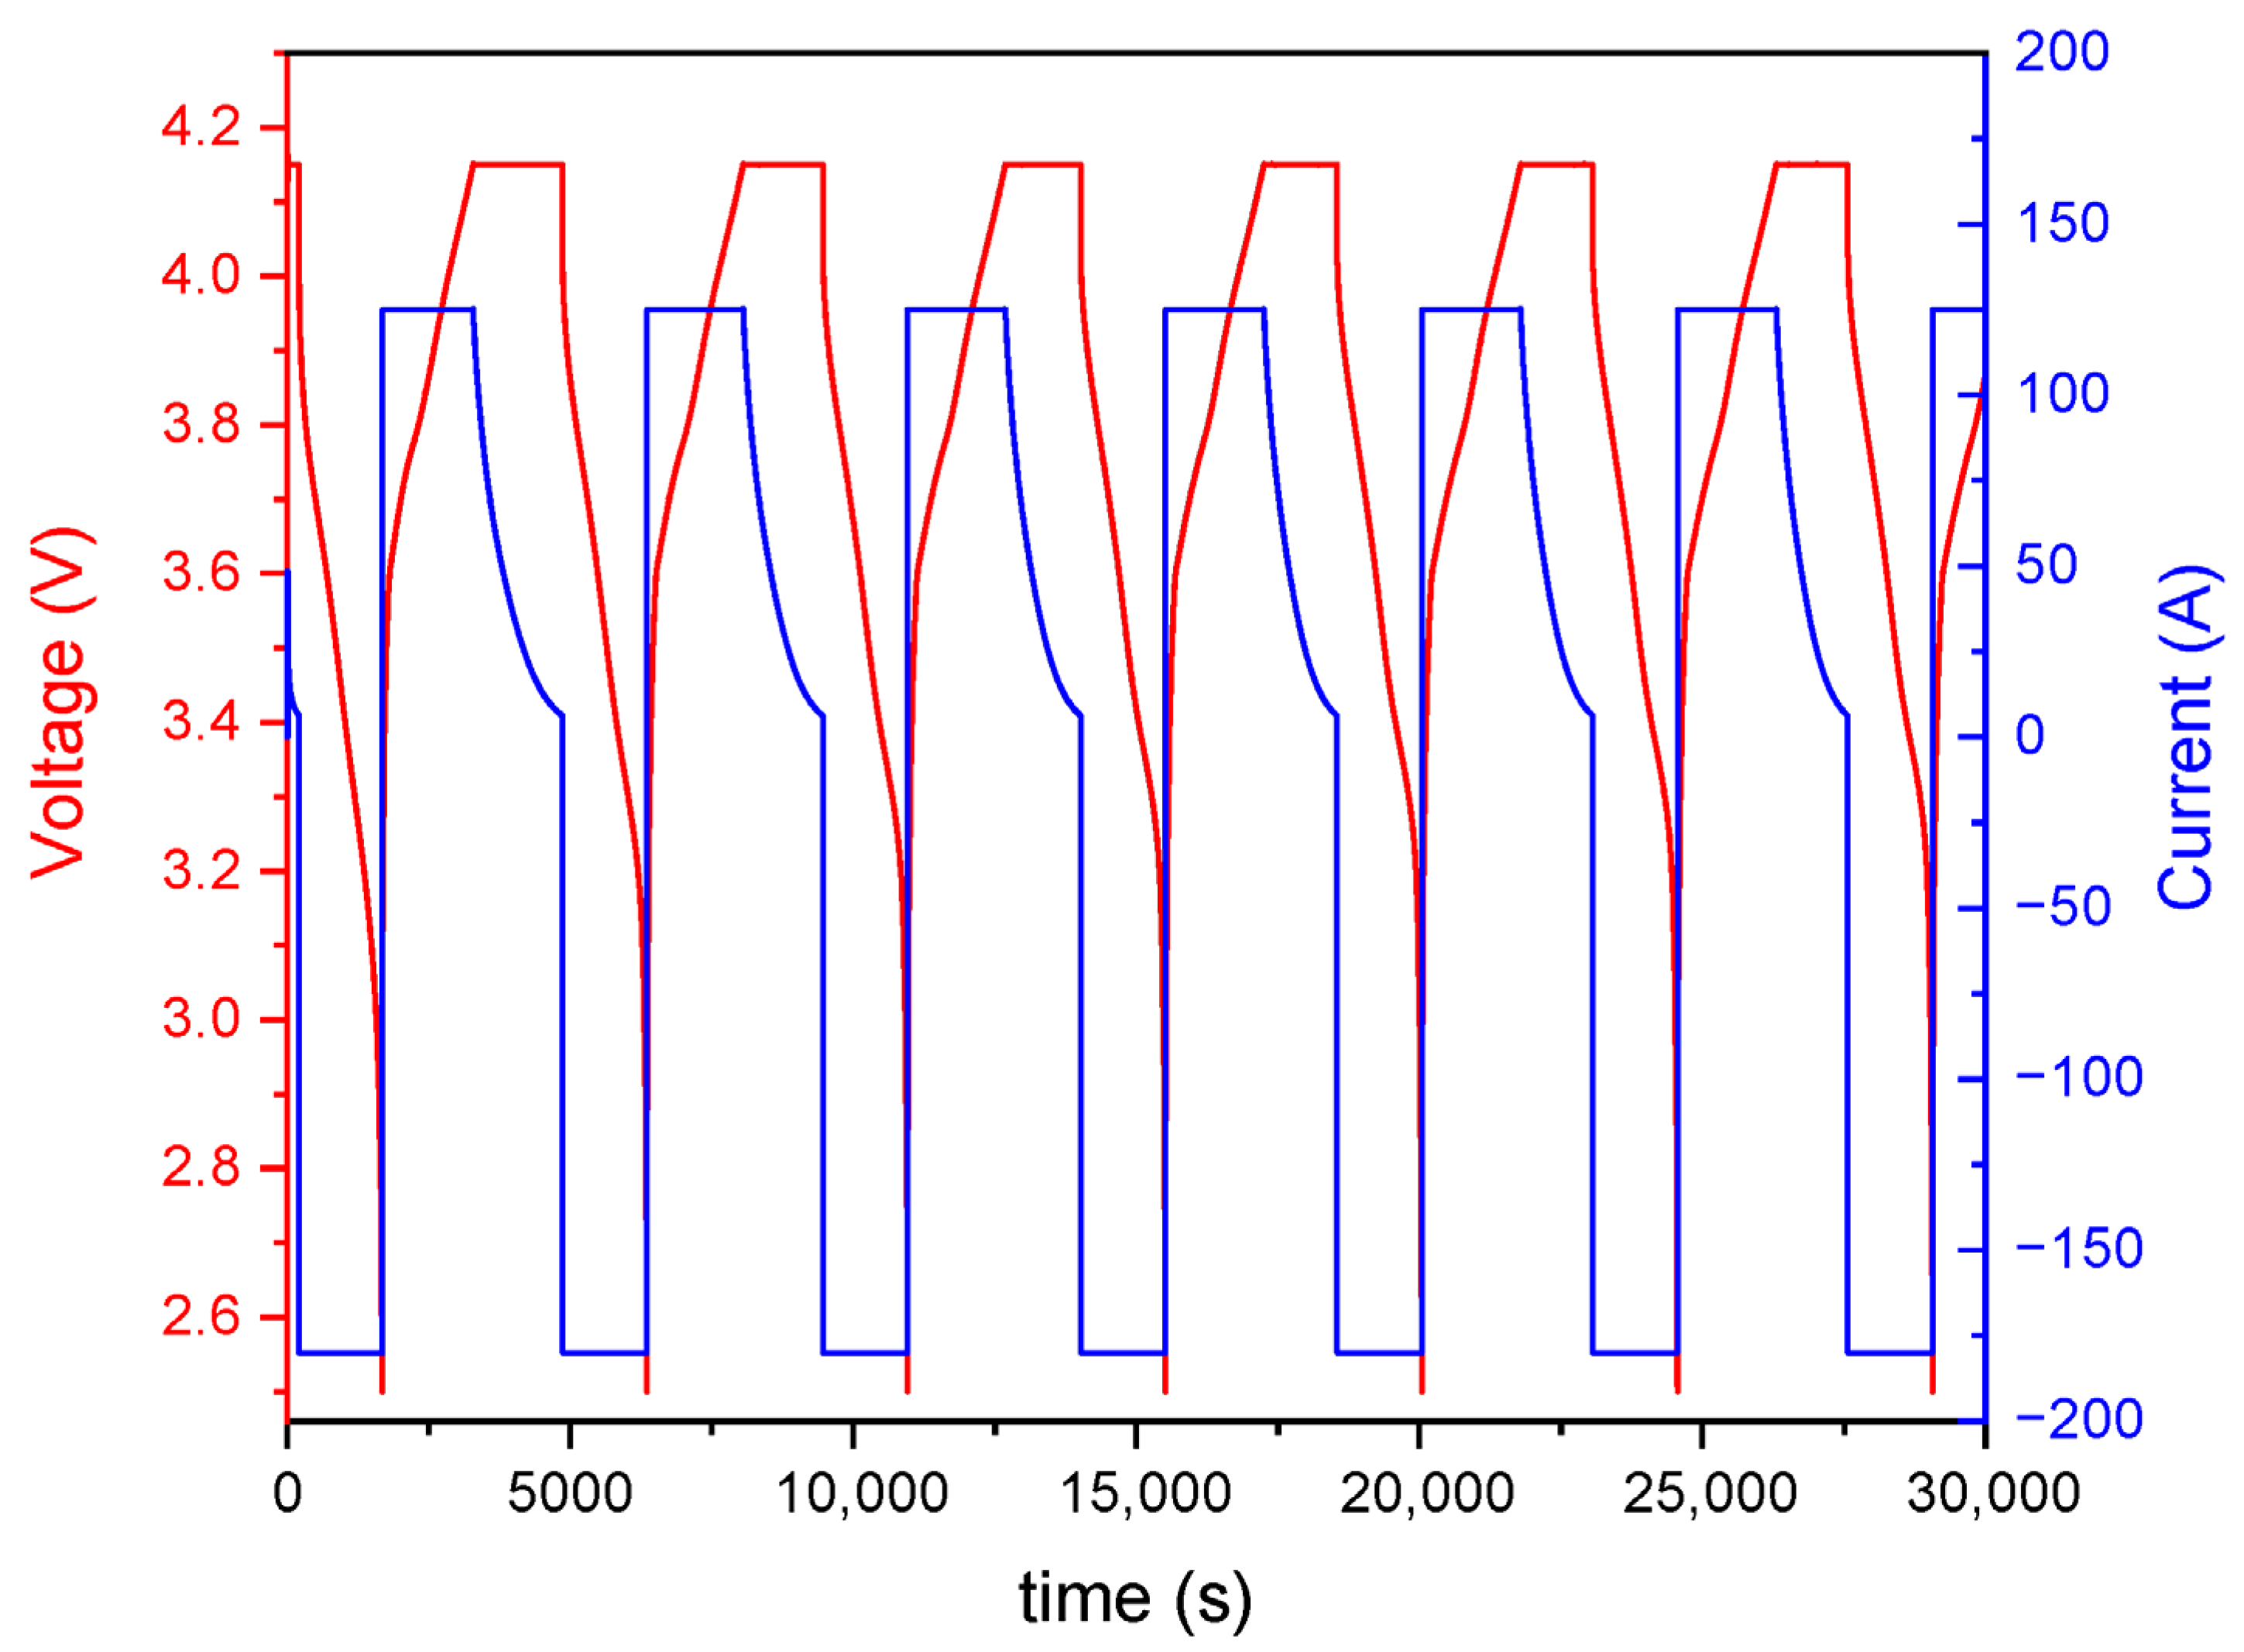
- Charging: Cells were charged using a constant current (CC) of 1.5 C (125 A) until reaching the upper voltage limit of 4.15 V. Upon reaching this voltage, the charging protocol switched to constant voltage (CV) mode, maintaining 4.15 V until the current decayed to 5% of the initial charging current.
- Discharging: Cells were discharged at a constant current. For the standard accelerated cycling profile, the discharge current was set at 2.16 C (−180 A), which corresponds to the maximum output of the test equipment. For Profile B (nominal or moderate cycling), the discharge current was limited to 0.2 C (−16.68 A). Discharge was cut off upon reaching the lower voltage limit of 2.5 V.
3.2. Data Analysis by Electrical Equivalent Circuit Fitting
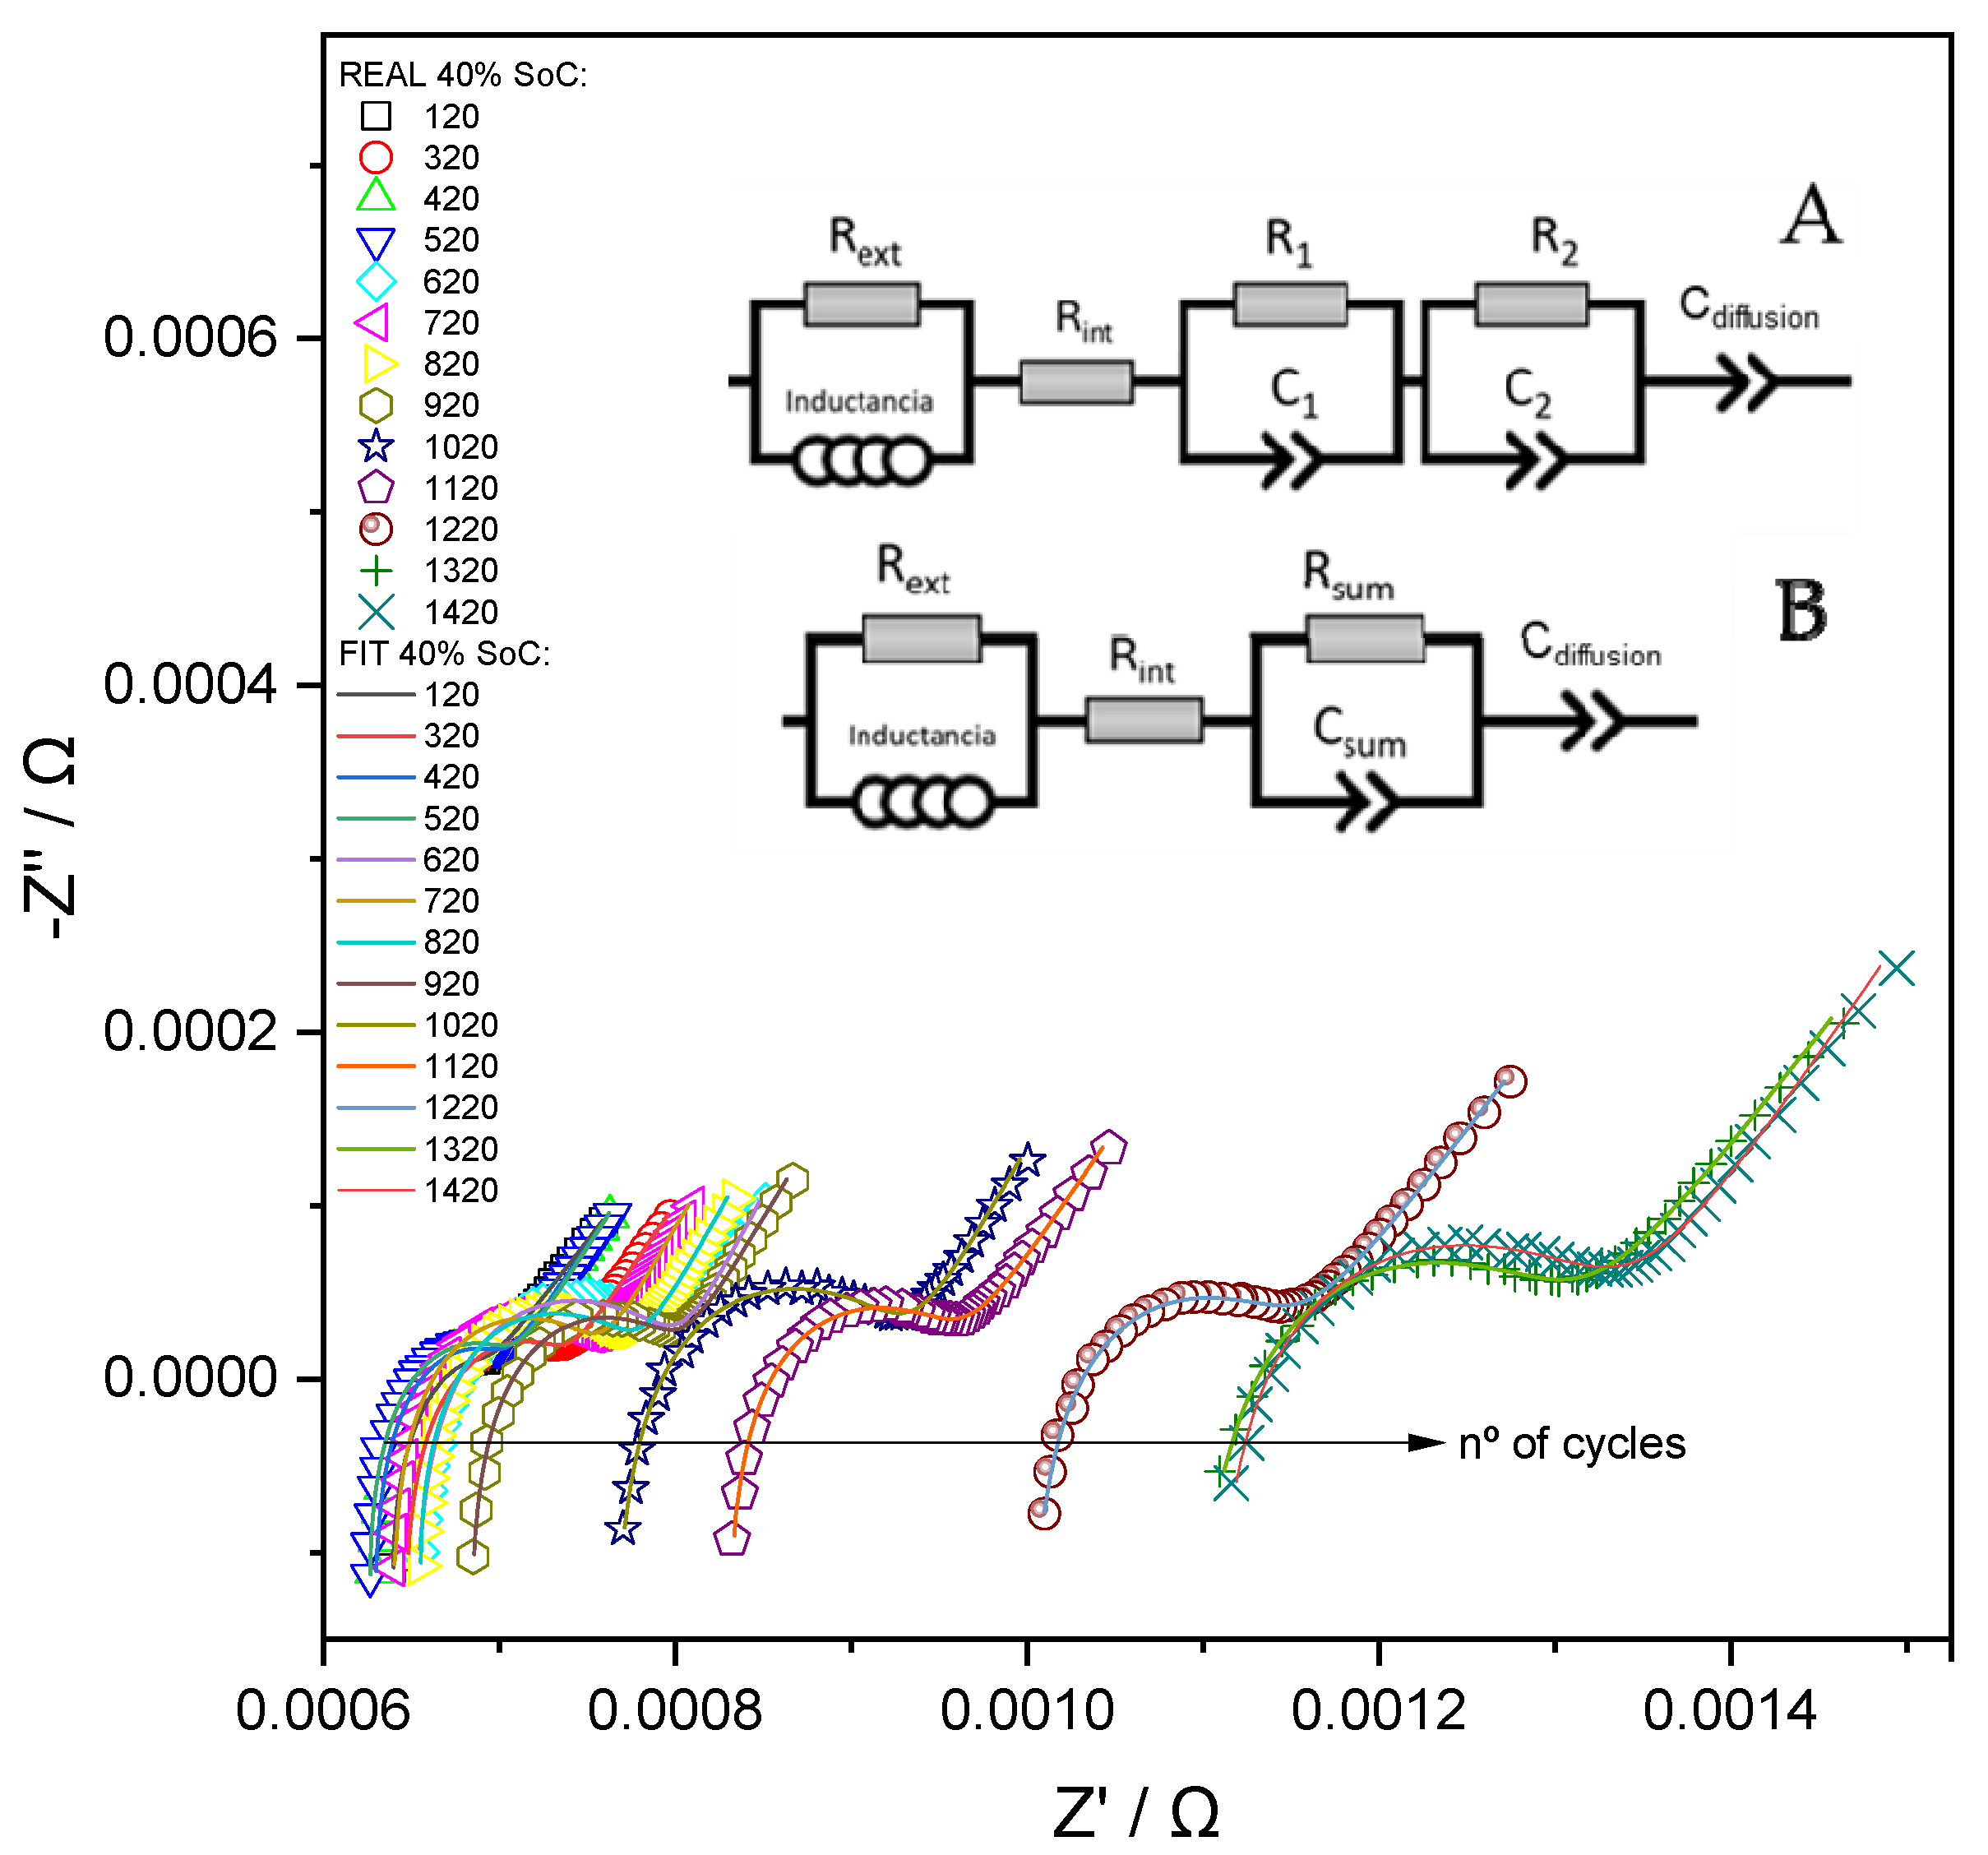
- Ultra-high frequency region (10 kHz–100 Hz): The impedance response is primarily influenced by the inductive and resistive characteristics of the external components of the system. To account for these effects, the equivalent circuit includes an inductance element (L) and a parallel resistance (Rext), which represent the parasitic inductance of the current collectors and connecting cables, as well as the ohmic contributions from the external electrical circuit. Although these elements do not provide information directly related to the internal electrochemical state of the cell and are not utilized for diagnostic or monitoring purposes, their inclusion is essential for accurate fitting of the impedance spectra. Proper modeling of this region ensures that the contributions from the mid- and low-frequency components—where electrochemical processes dominate—are not distorted during parameter extraction and analysis.
- High-frequency region (100–50 Hz): Impedance in this frequency range is dominated by the cell’s ohmic resistance (Rint), which models the instantaneous voltage drop due to the resistance of the current collectors, contact resistances between the binder and active material particles, and the ionic conductivity of the electrolyte. This region is typically observed as the high-frequency intercept of the Nyquist plot with the real axis and provides a baseline measure of the cell’s internal resistance under operational conditions.
- Medium-frequency region (50–1 Hz): This region reflects the combined effects of two overlapping processes: (i) The resistance of the SEI, in parallel with a constant phase element (CPE), which represents the capacitive behavior of the SEI layer and the lithium-ion intercalation into the anode material. This parallel resistance–capacitance pair will be identified as R1-C1 from now on; and (ii) the charge-transfer resistance in parallel with a double-layer capacitance, associated with lithium-ion insertion into the cathode (e.g., lithium cobalt oxide), denoted as R2-C2.
- Low-frequency region (1–0.01 Hz): At low frequencies, the impedance is governed by the solid-state diffusion of lithium ions within the bulk of the electrode materials. This process is typically modeled using a Warburg diffusion element, which appears as a 45° line in the Nyquist plot. However, due to the frequency limitations of most EIS measurements (typically reaching only 10–50 mHz), the diffusion behavior is not fully captured. Consequently, the Warburg element is replaced by a CPE, denoted as Cdiffusion, which mimics the impedance response of a non-ideal diffusion layer. In the impedance plot, this element manifests as a straight line with a variable slope, approximating the semi-infinite diffusion behavior under limited measurement bandwidth.
3.3. SoH–EIS Correlation Model Development
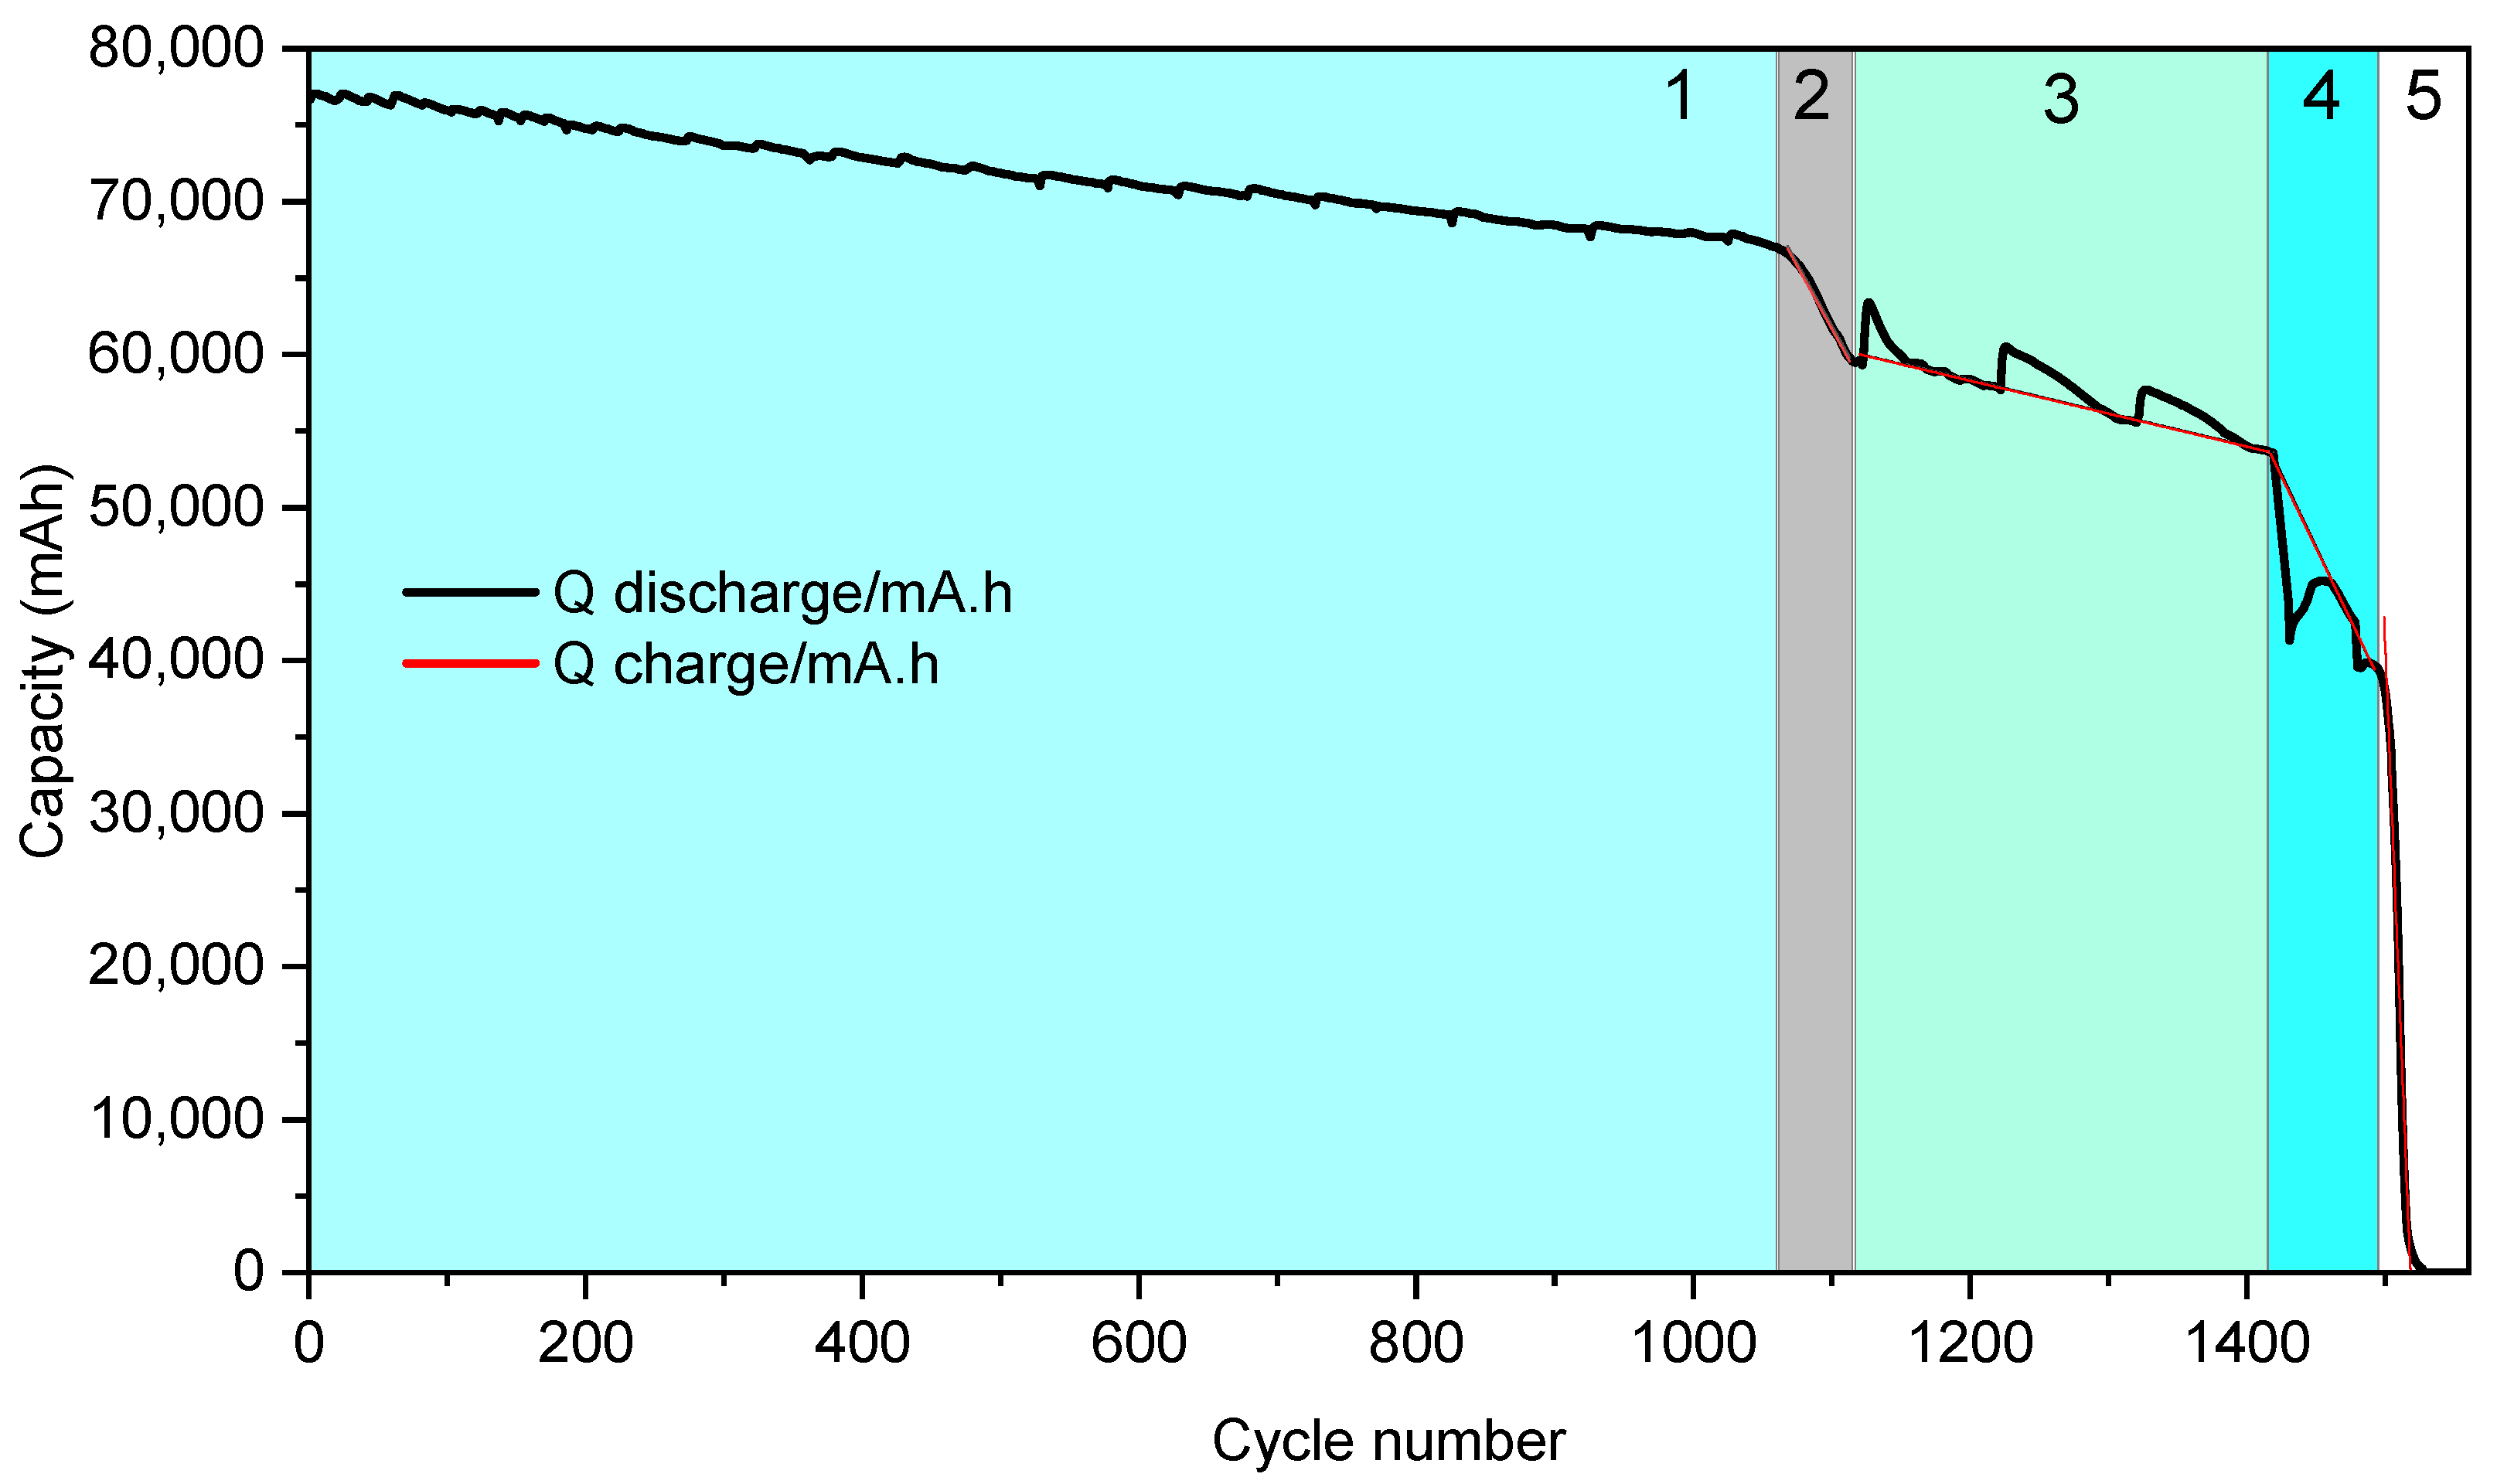
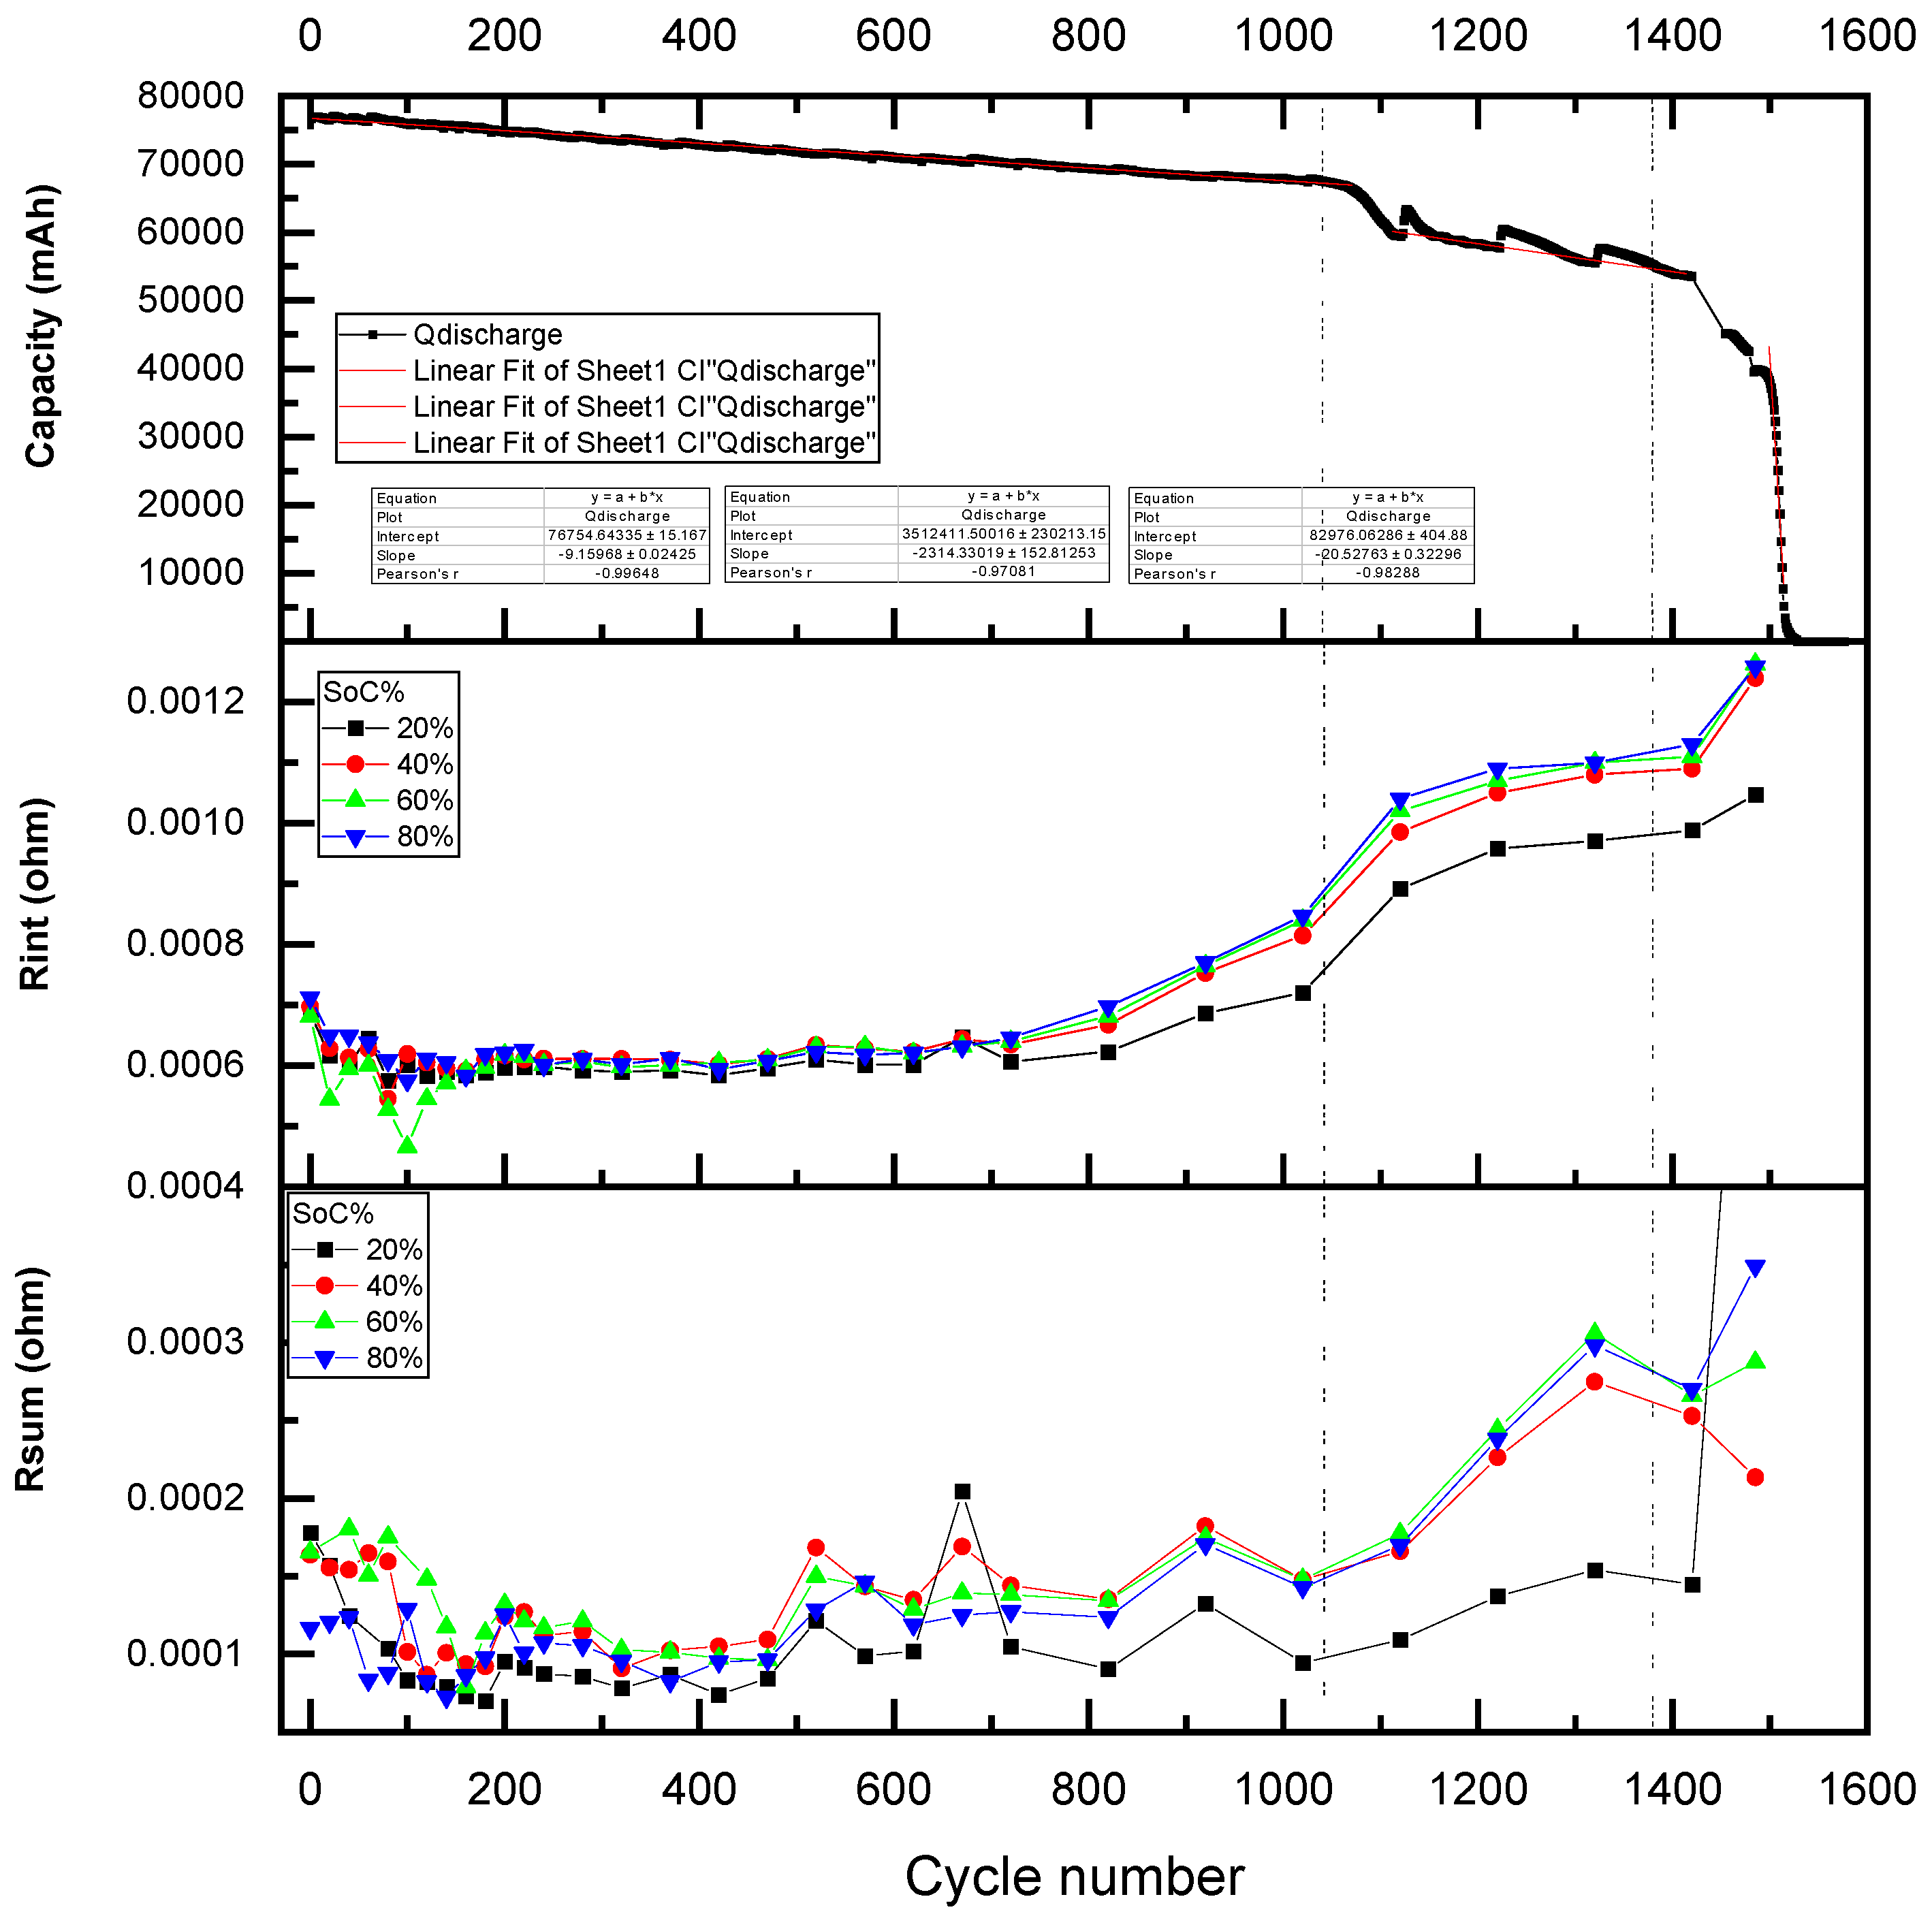
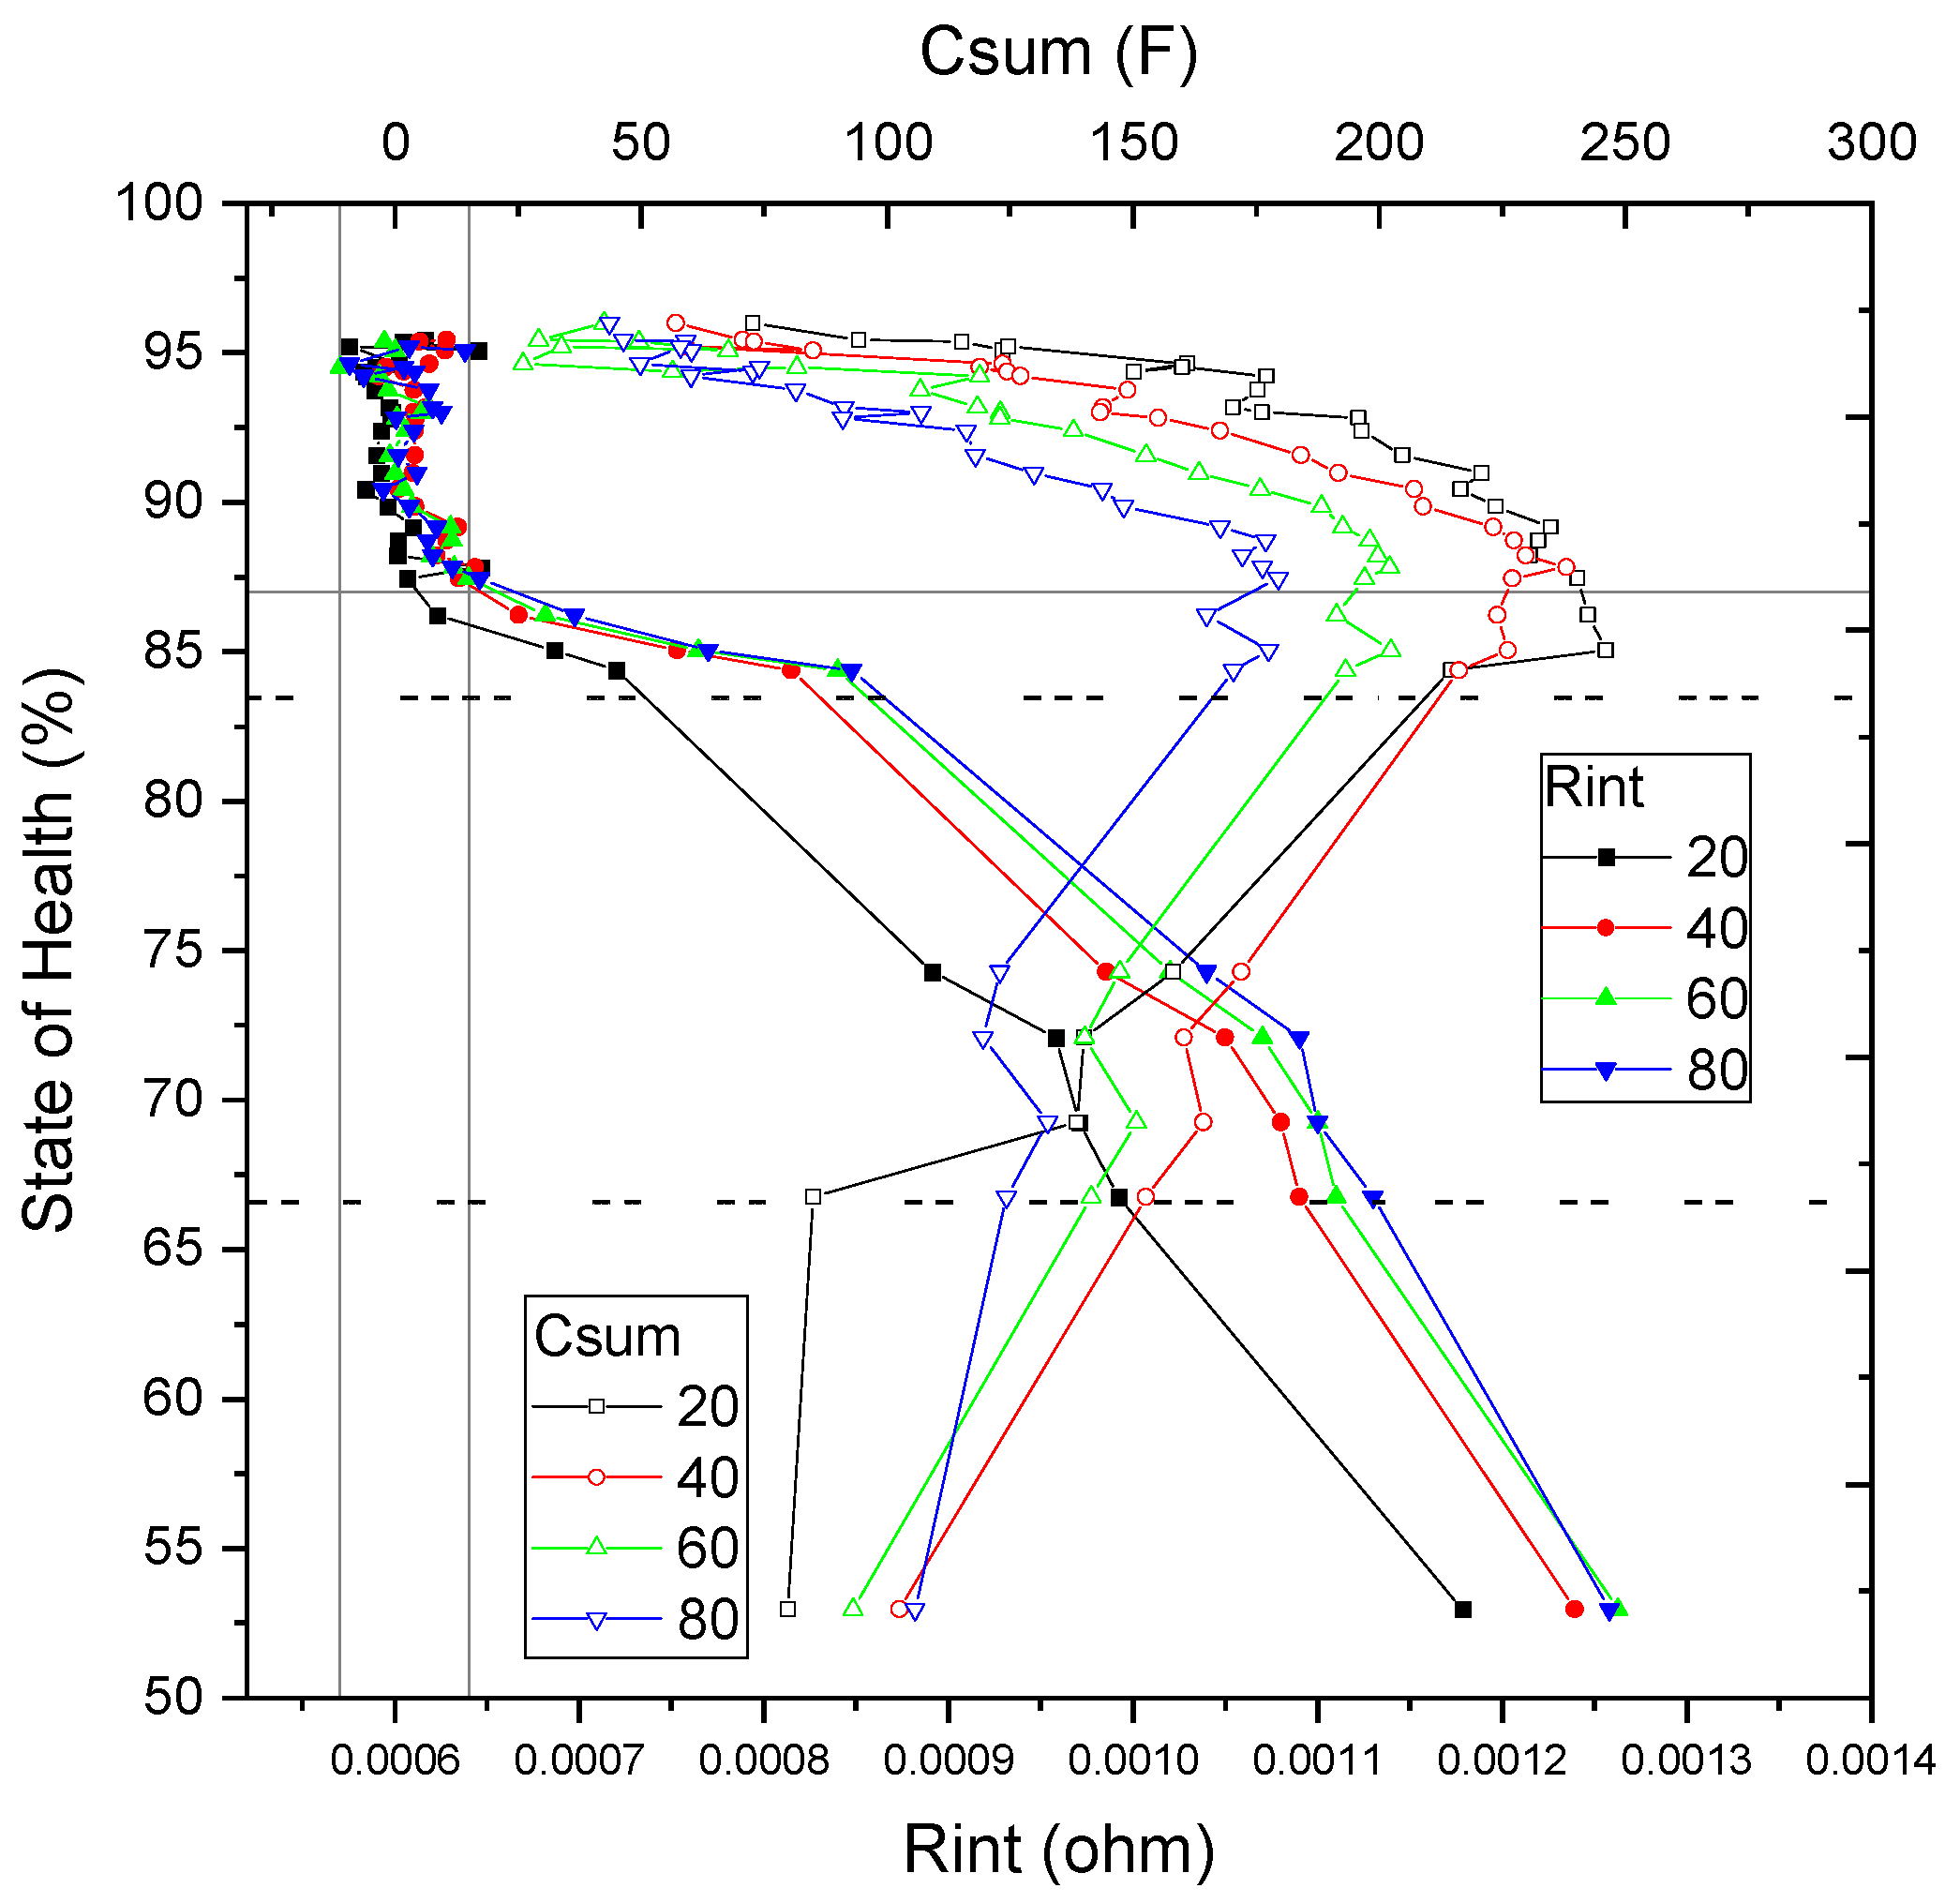
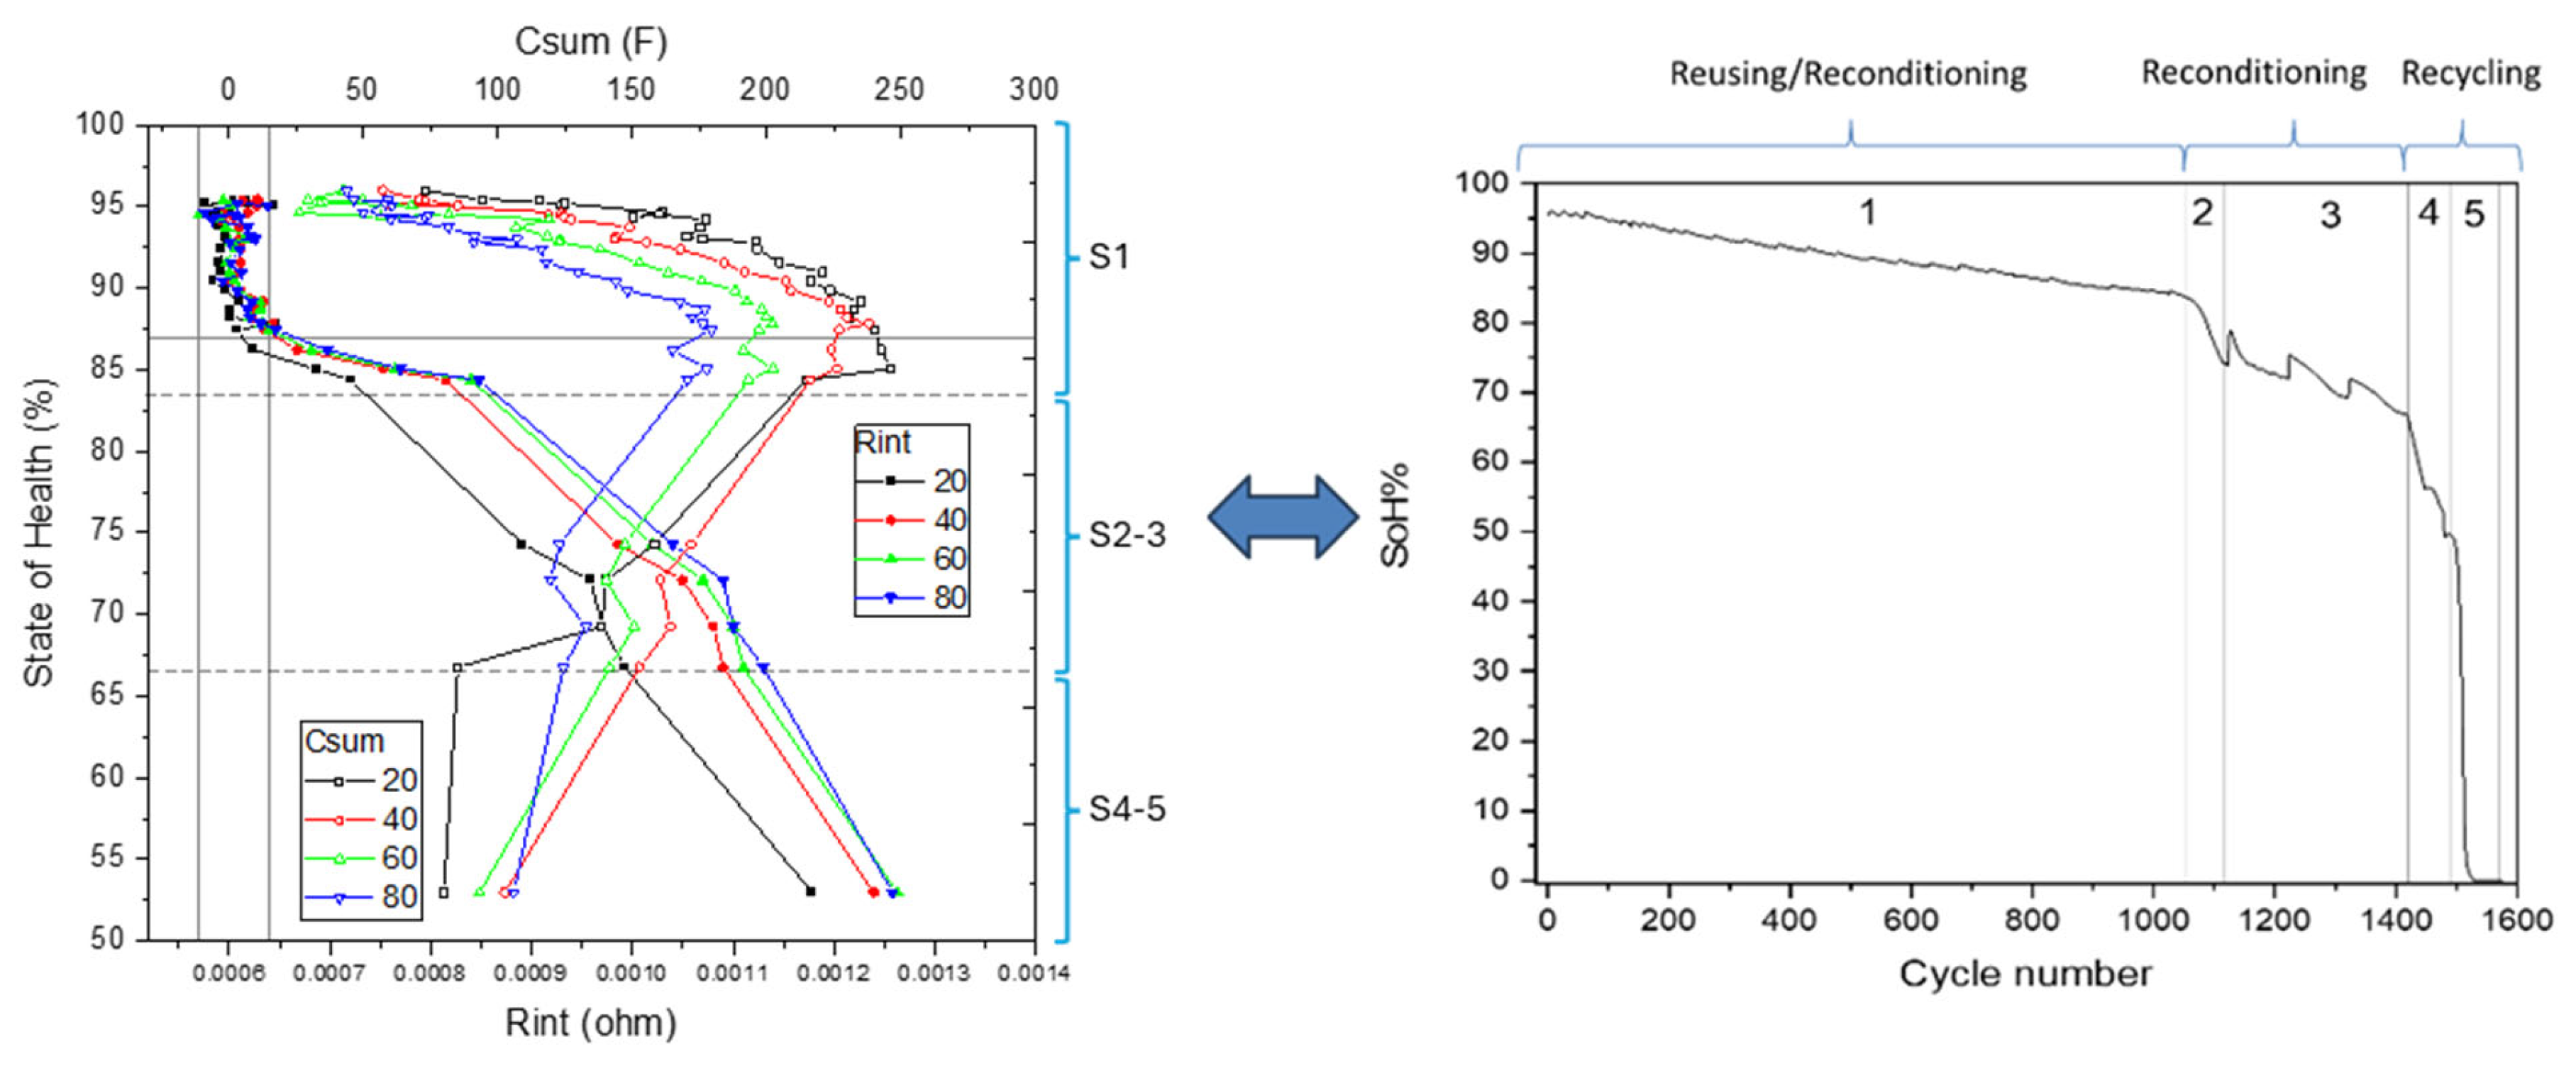
- Stage 1: 100% to 83% SoH, with Rint values ranging from 0.0006 Ω to 0.0008 Ω;
- Stage 2: 83% to 75% SoH, with Rint values between 0.0008 Ω and 0.0010 Ω;
- Stage 3: 75% to 67% SoH, where Rint increases to the range of 0.0010 Ω to 0.0011 Ω;
- Stage 4: 67% to 53% SoH, with Rint spanning from 0.0011 Ω to 0.00125 Ω;
- Stage 5: below 53% SoH, characterized by Rint exceeding 0.00125 Ω.
3.4. SoH Determination Procedure
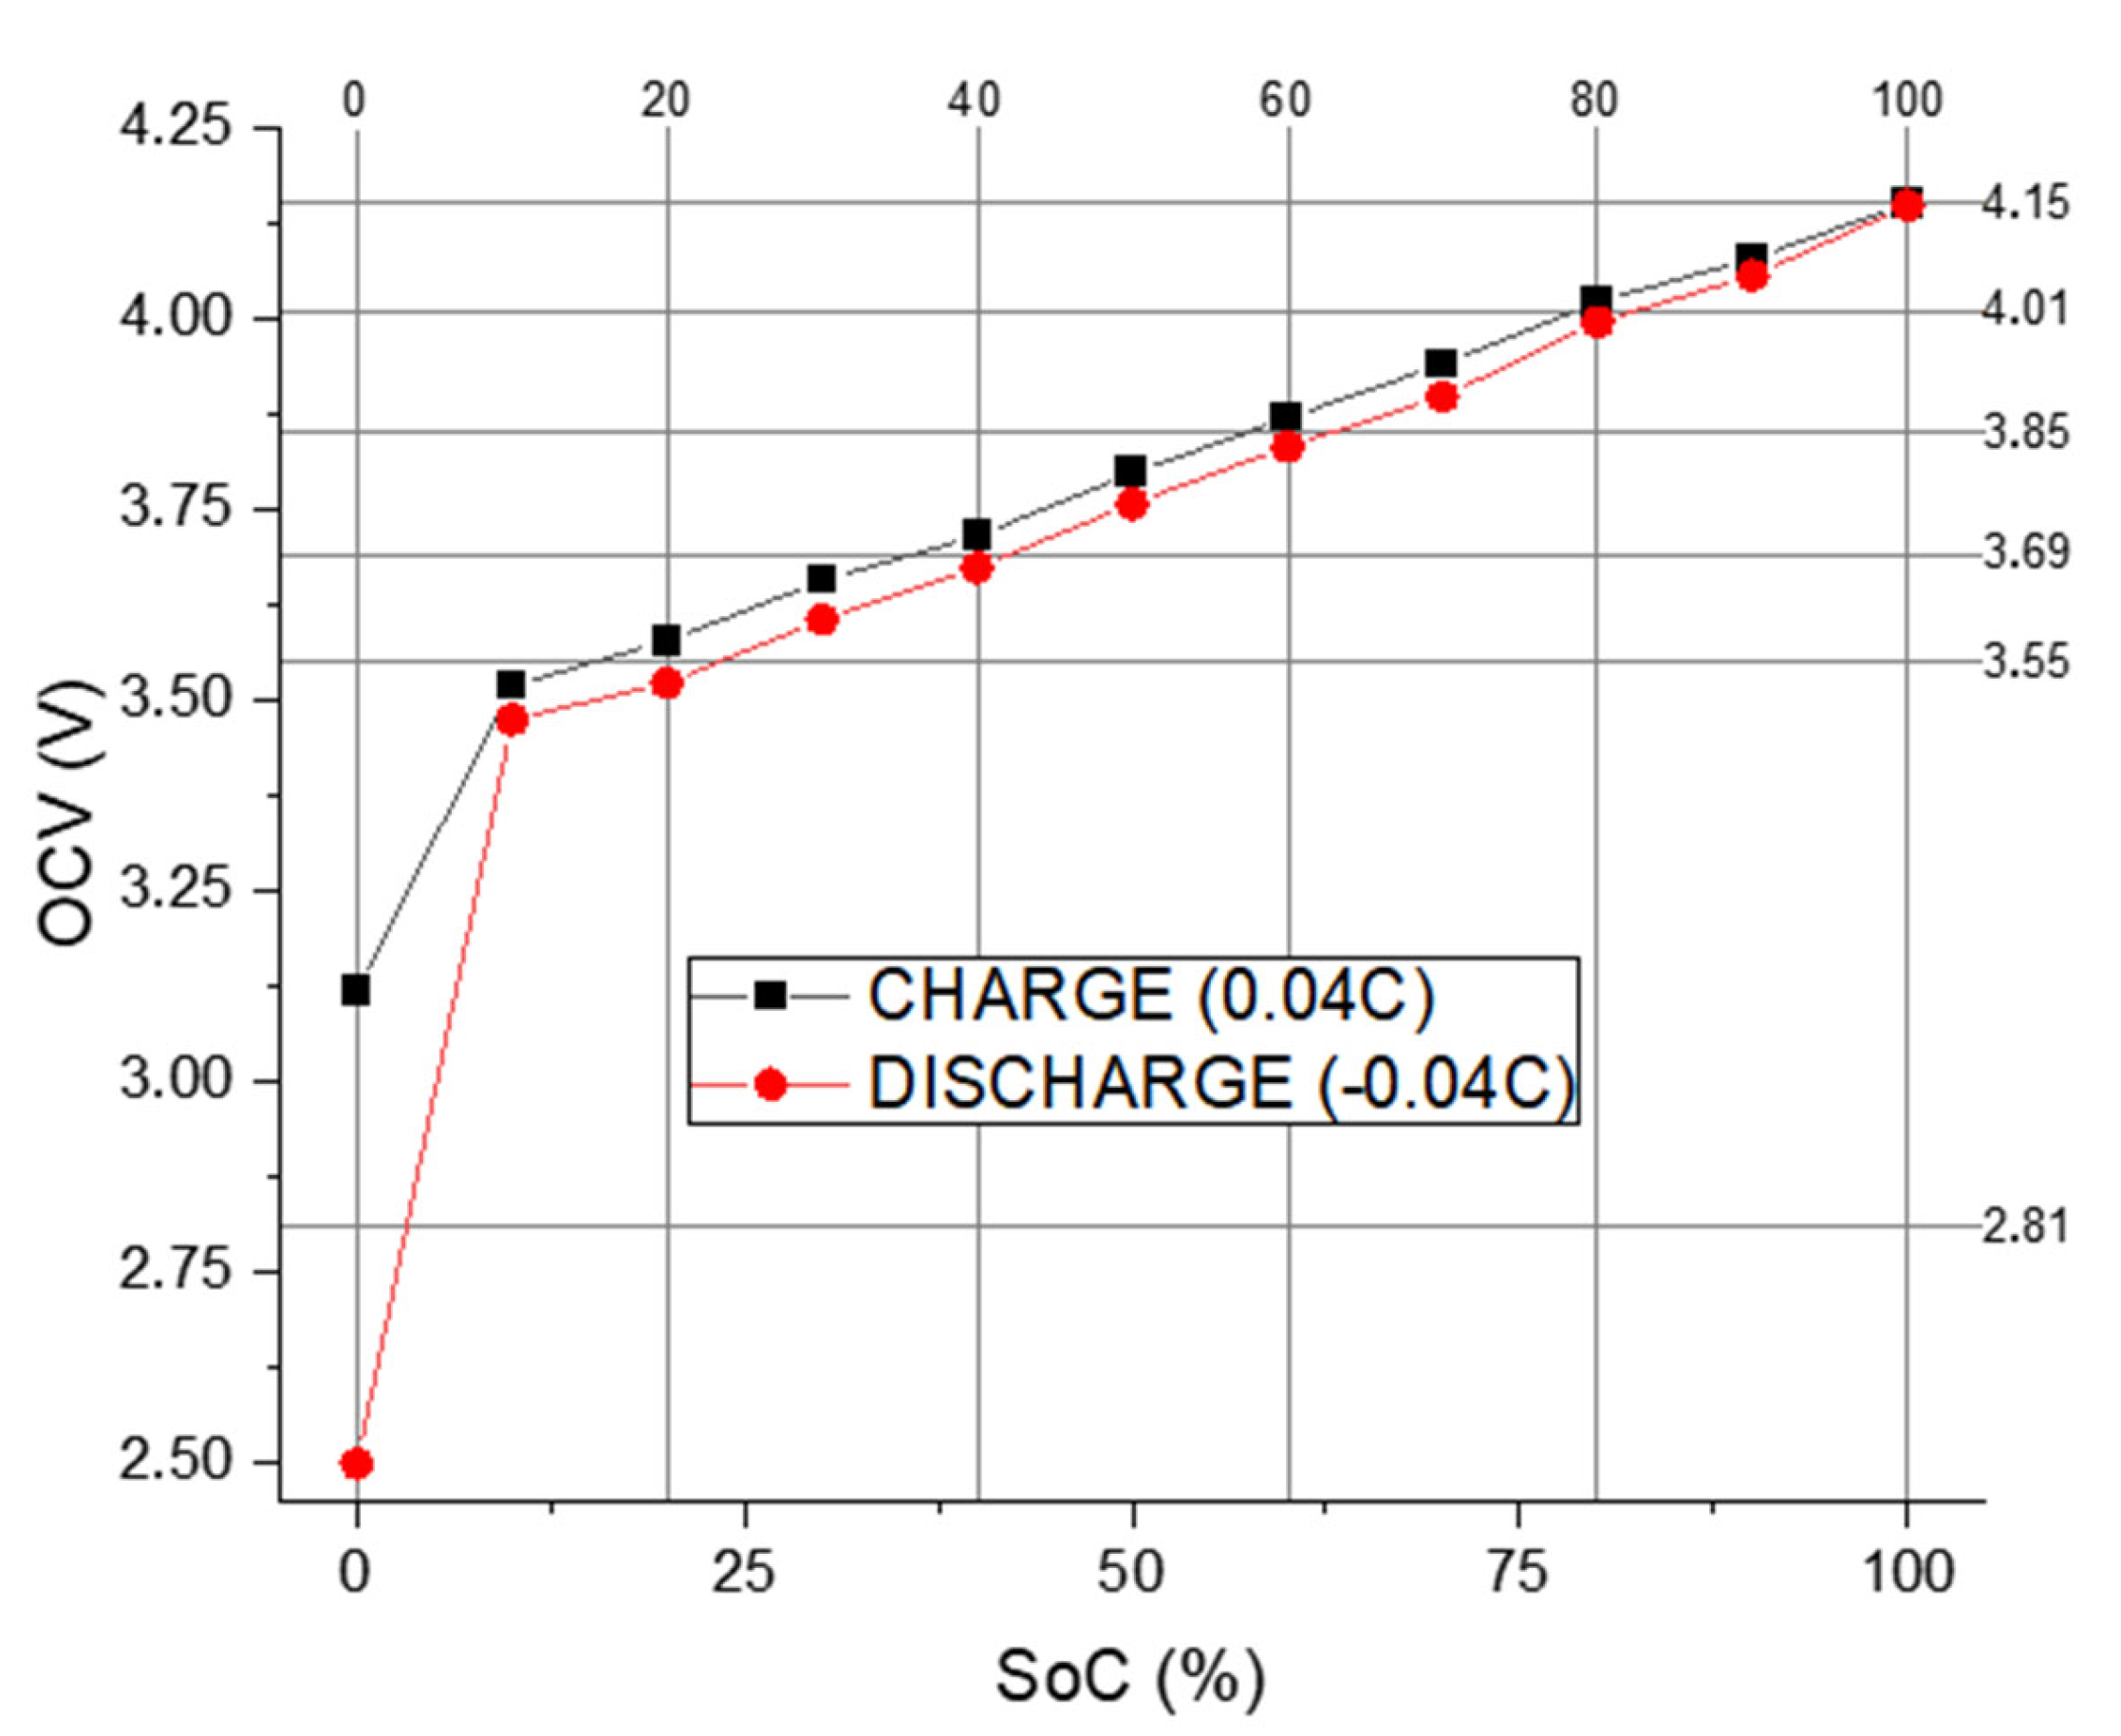
- Initial SoC estimation: The first step involves determining an approximate SoC using the Open-Circuit Potential (OCP) to SoC correlation method as described in the experimental procedure. This estimation guides the subsequent analysis.
- Database subgroup selection: Based on the estimated SoC, the appropriate subgroup from the database—one of six predefined SoC levels—is selected to ensure that the parameter comparison and interpolation occur within the relevant operating conditions.
- Primary parameter evaluation: The internal resistance value (Rint) is analyzed to classify the cell into one of the aging stages defined in Section 2, based on the incremental increase of Rint. This classification enables the identification of the cell’s current degradation stage. For aging Stages 2 through 5, interpolation within the defined resistance ranges allows for a state of health (SoH) estimation with an expected error margin of 5–10%.
- Complementary parameter usage–Csum: For cells classified in Stage 1, where Rint exhibits limited sensitivity and stability over most of the useful life, the total capacitance (Csum) serves as the primary SoH indicator. In this case, the fitted Csum value from the EEC model is interpolated within the Csum database to estimate SoH, achieving an accuracy of approximately 10%.
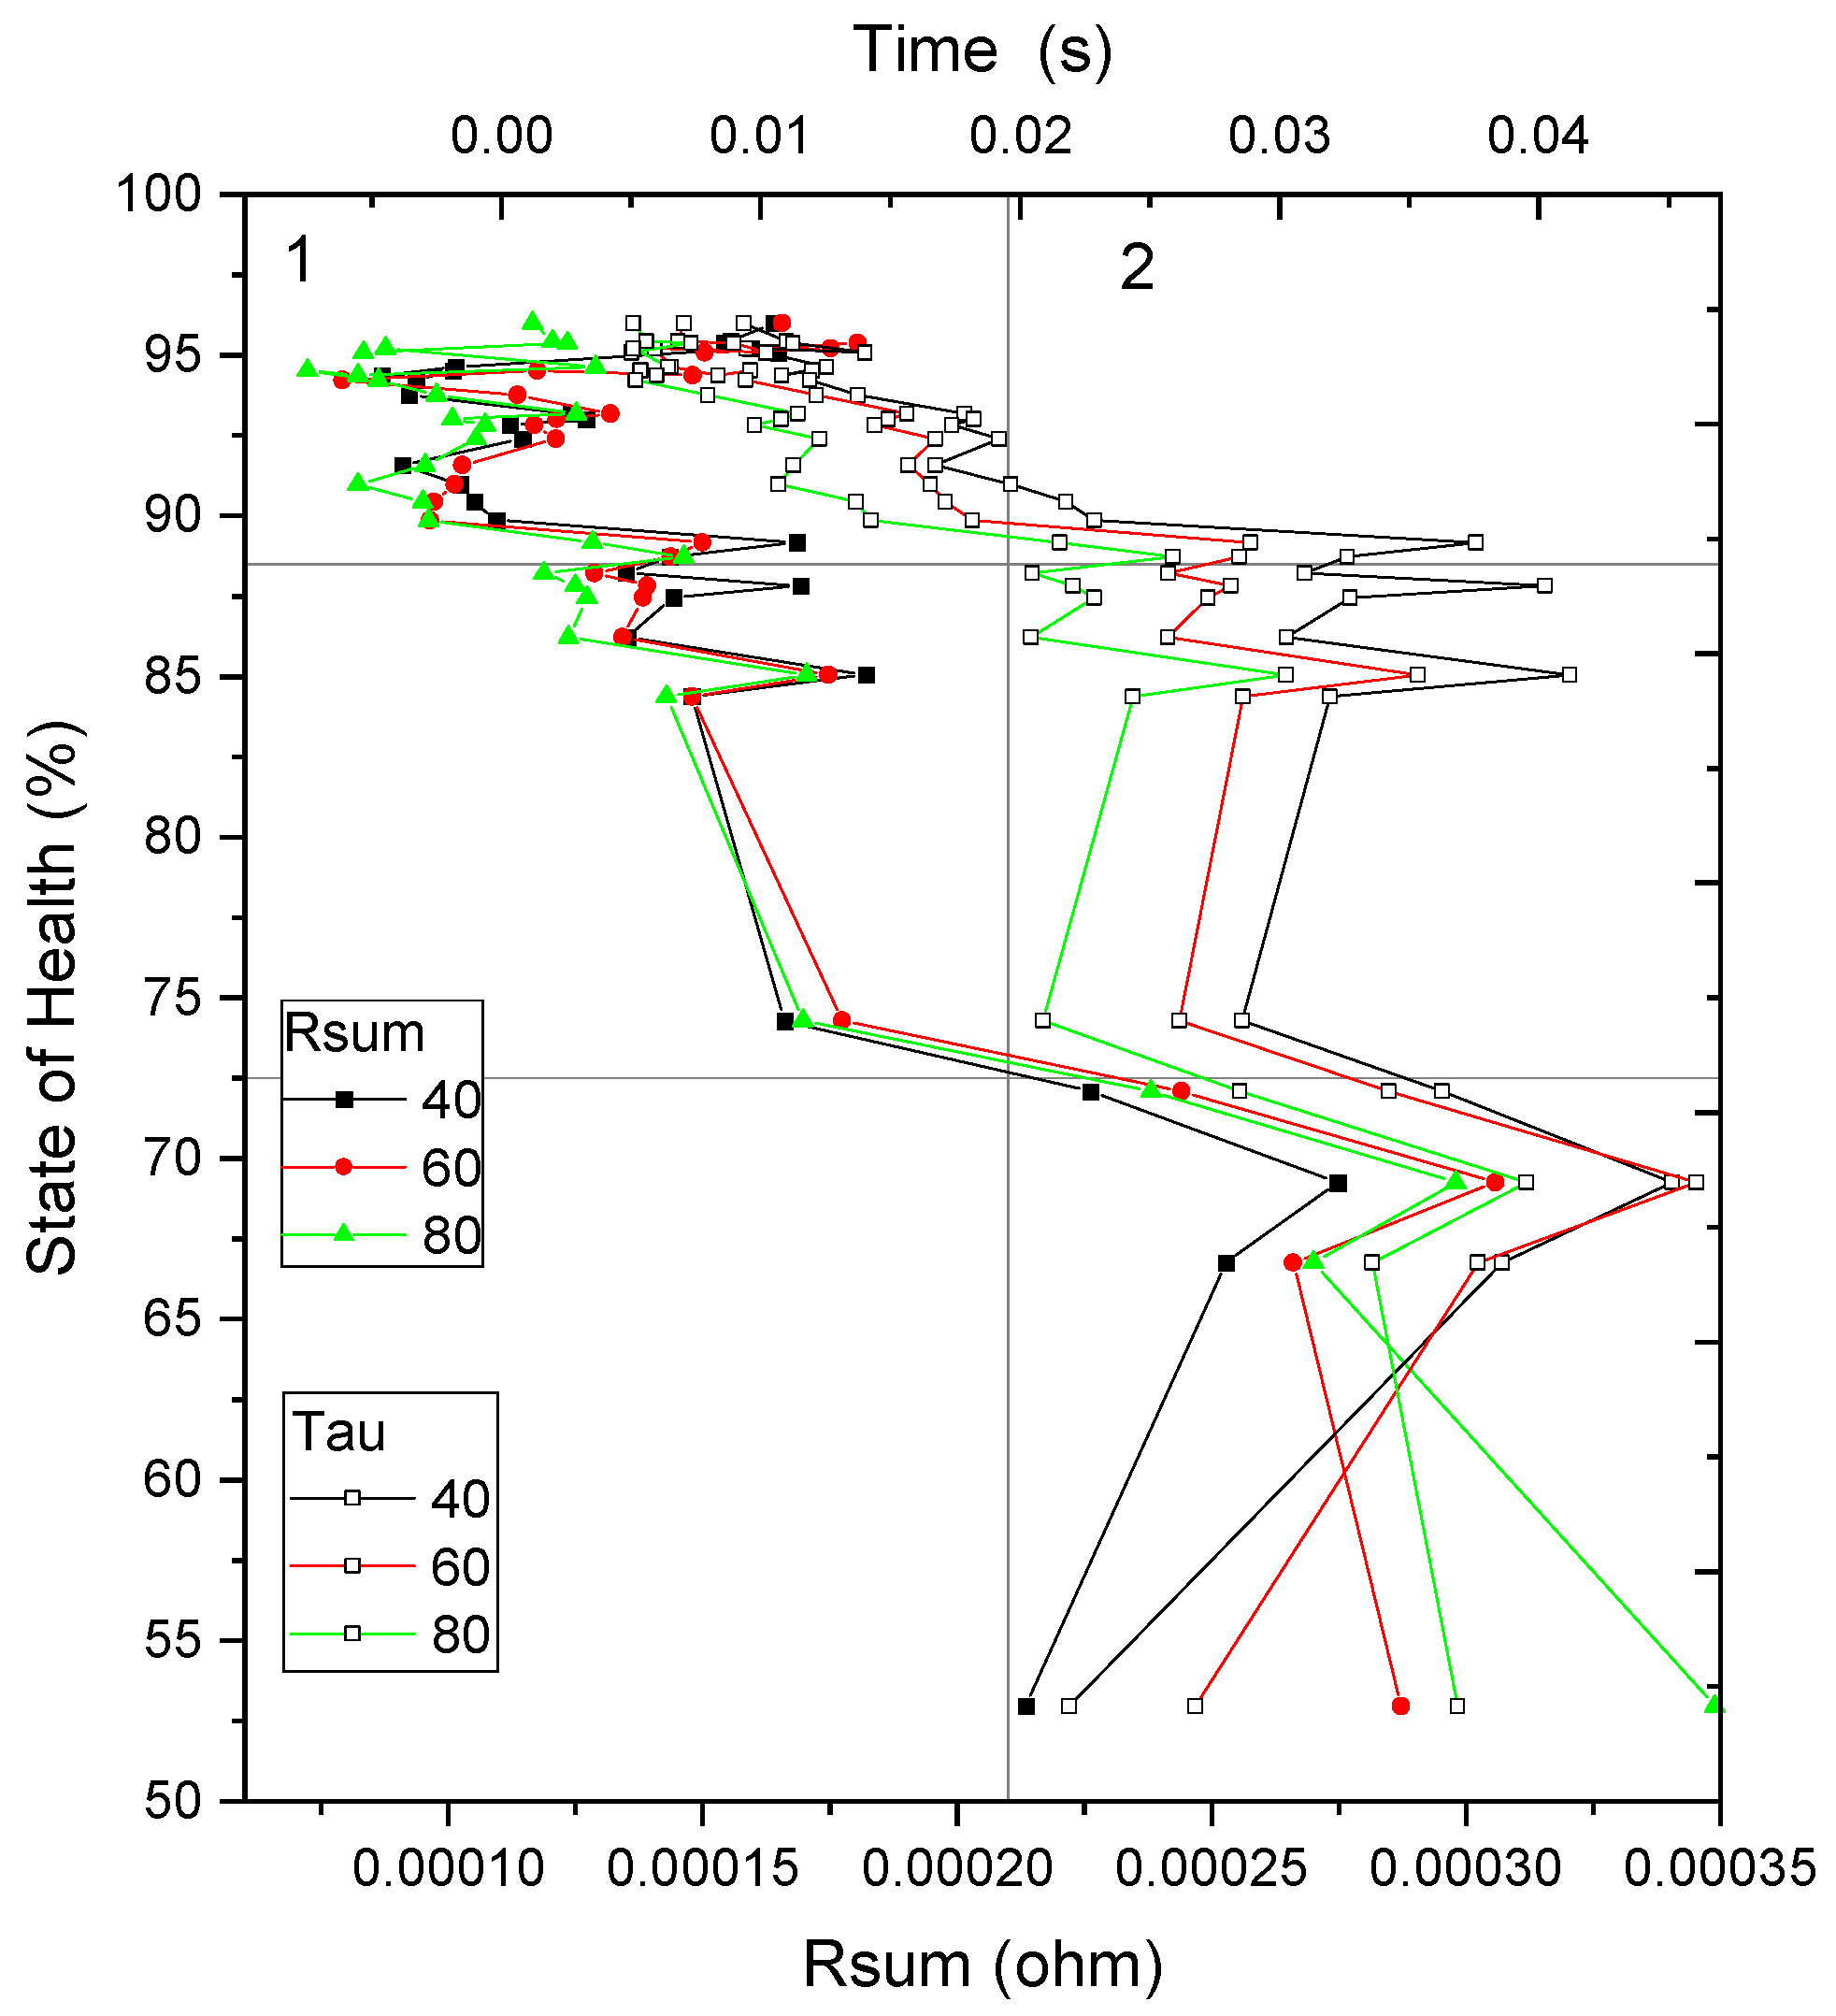
- Alternative indicators-Rsum and τ: When fitted values of Rint and Csum fall outside the established database boundaries—potentially due to severe internal degradation, extreme operating temperatures, or measurement anomalies—alternative parameters such as the sum of resistances (Rsum) and the characteristic time constant (τ) are employed as secondary indicators. Although these parameters provide less precision, they enable broad classification of the cell’s condition into two categories: suitability for reuse (Figure 13, Quadrant 1, SoH between 100% and 72.5%) and designation for recycling (Figure 13, Quadrant 2, SoH below 72.5%).
4. Software Architecture and System Implementation
- Main interface: serves as the central dashboard, providing access to all system functionalities, including language selection for multilingual support (Figure 14).
- Database interface: facilitates the upload and management of reference datasets correlating EIS measurements with SoH. These datasets must be provided in Excel format and are essential for the classification process.
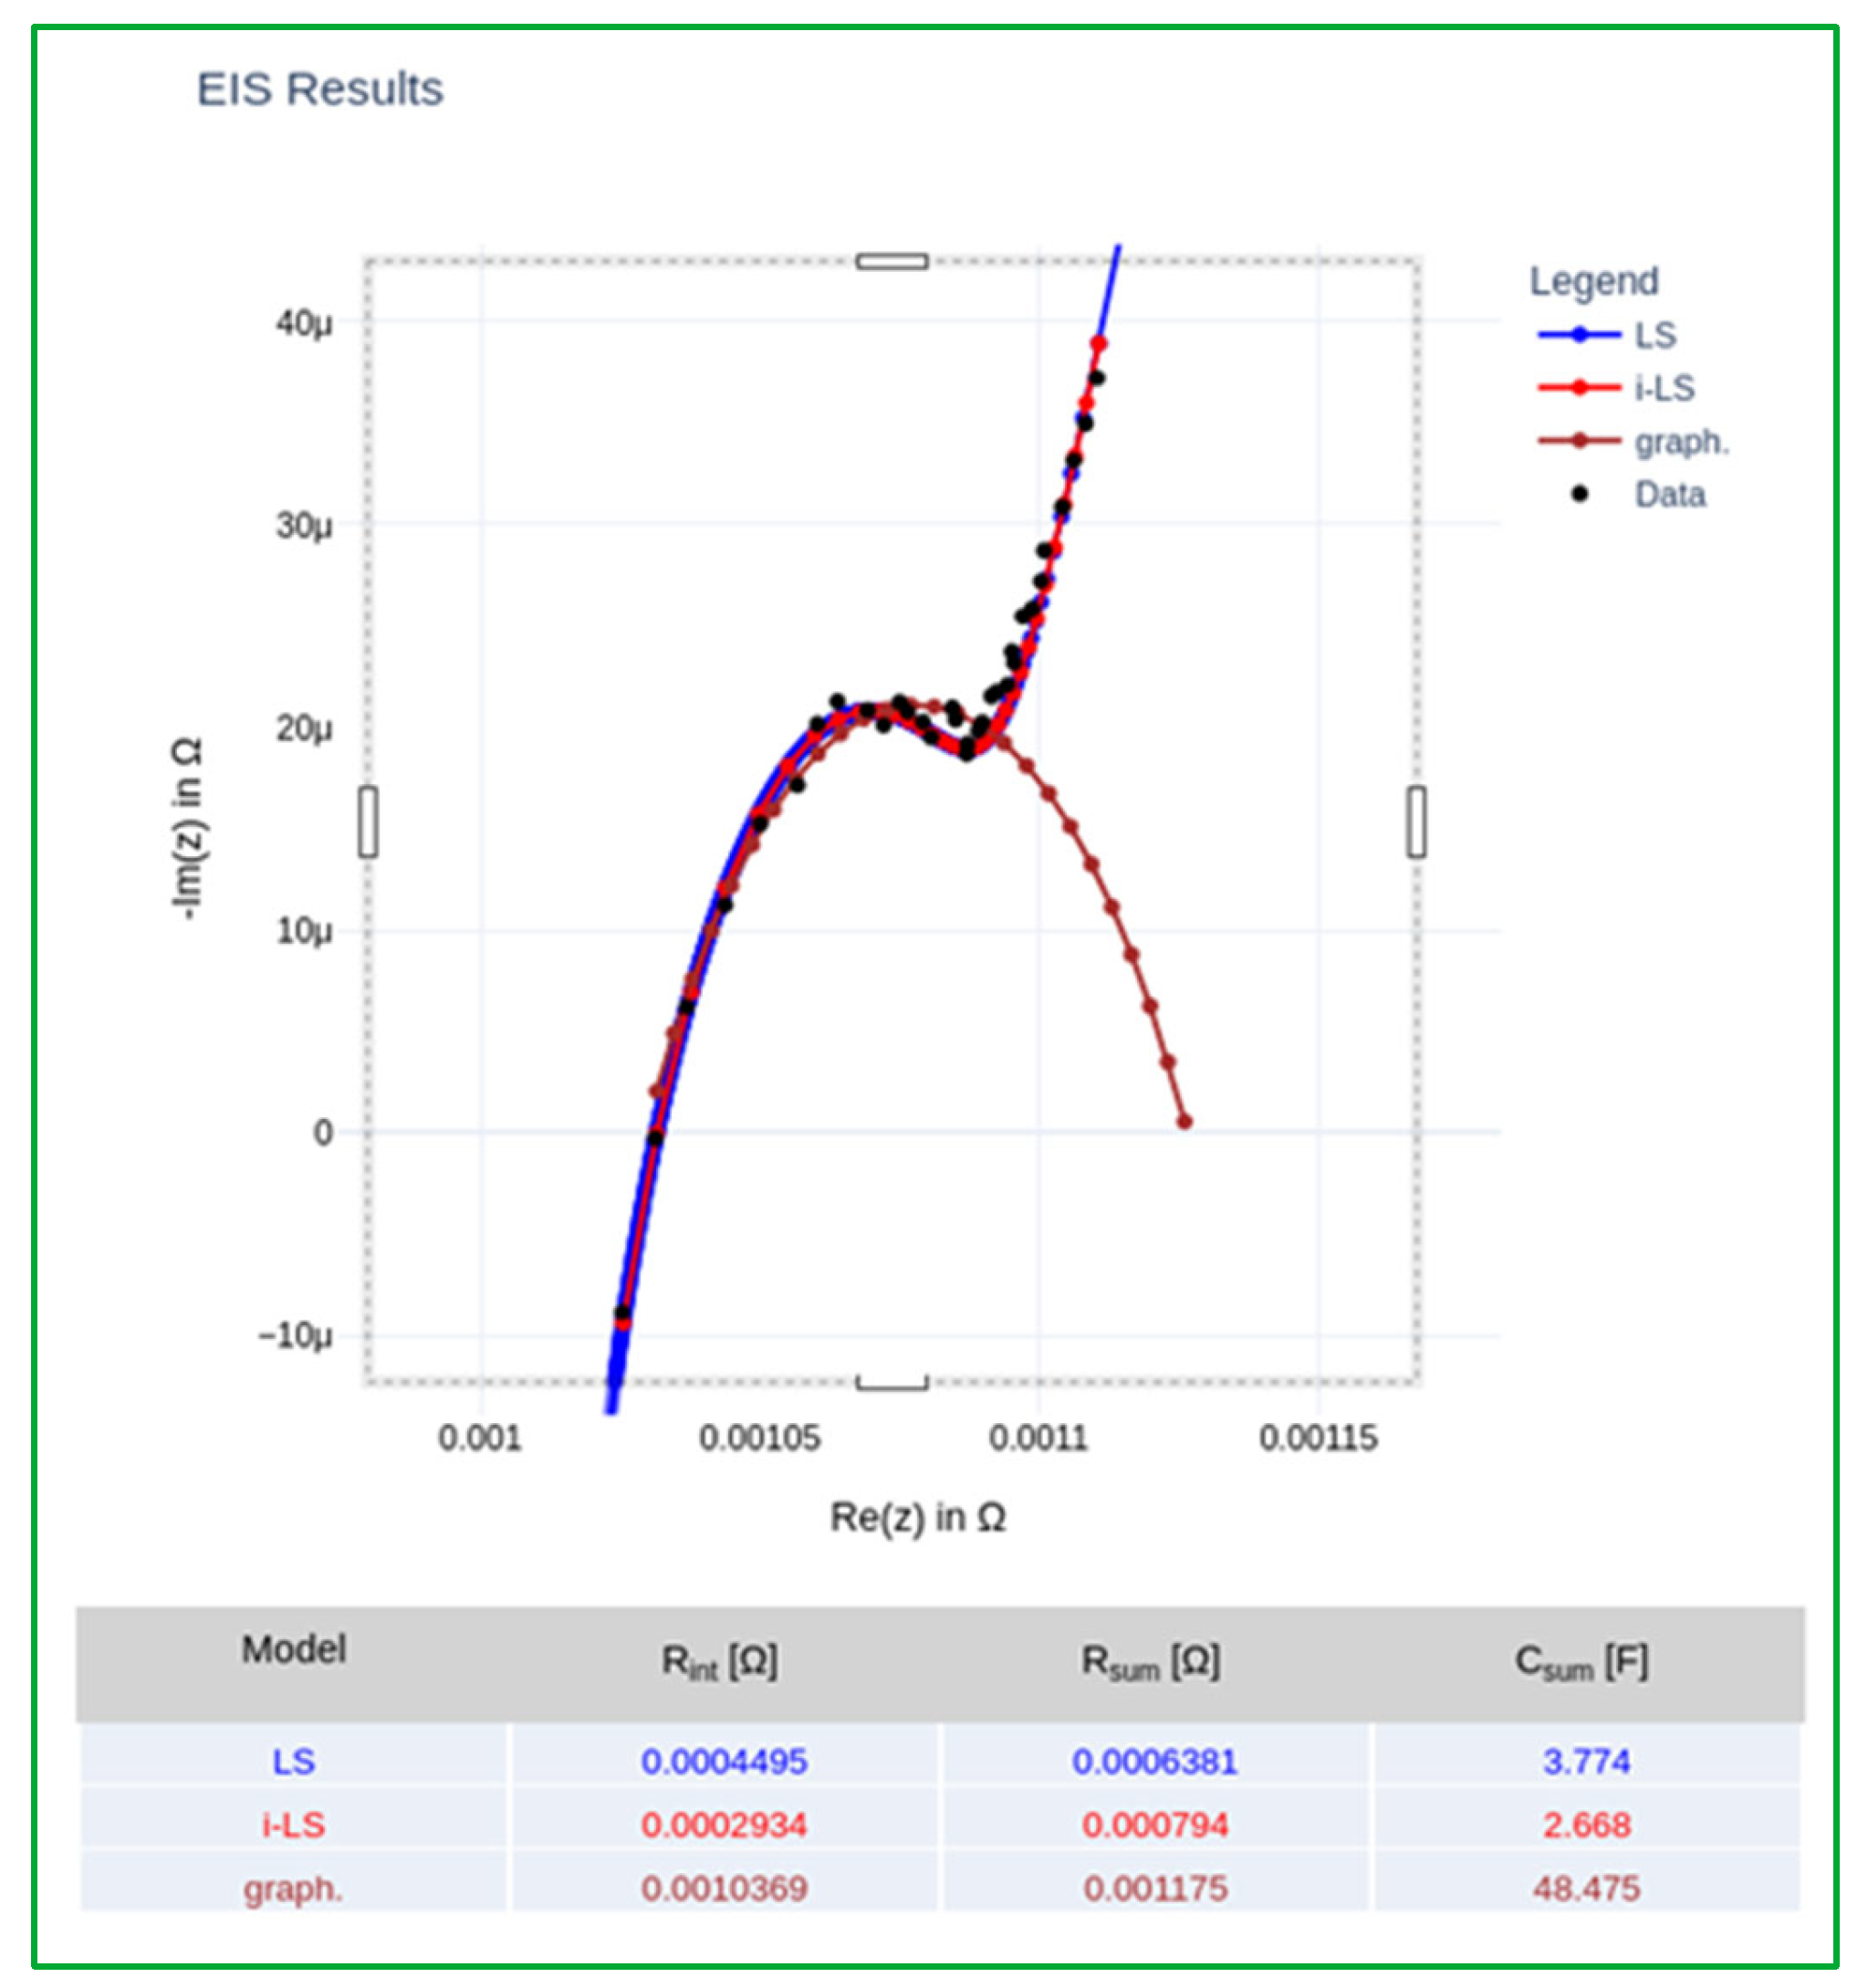
- Results interface: enables the import of new EIS measurements either manually or via an automated scan-and-load feature. Upon upload, data fitting and classification are executed in real time. The interface displays comprehensive visual outputs, including Nyquist plots (both experimental and fitted), the extracted electrochemical parameters, the estimated SoH, the identified degradation stage, and the final classification outcome.
- Reuse (SoH > 83%): cells are deemed suitable for direct deployment in second-life applications without the need for refurbishment.
- Reconditioning (SoH 67–83%): cells are eligible for limited reuse, contingent upon minimal reconditioning procedures.
- Recycle (SoH < 67%): cells are considered at end-of-life and are directed toward materials recovery and recycling processes.
5. Automated Testing Bench
6. Conclusions
7. Future Work
Author Contributions
Funding
Conflicts of Interest
References
- Fetting, C. The European Green Deal; European Commission: Brussels, Belgium, 2020. [Google Scholar]
- Li, Y.; Ding, S.; Wang, L.; Wang, W.; Lin, C.; He, X. On safety of swelled commercial lithium-ion batteries: A study on aging, swelling, and abuse tests. eTransportation 2024, 22, 100368. [Google Scholar] [CrossRef]
- Noura, N.; Boulon, L.; Jemeï, S. A review of battery state of health estimation methods: Hybrid electric vehicle challenges. World Electr. Veh. J. 2020, 11, 66. [Google Scholar] [CrossRef]
- Gao, Z.; Chin, C.S.; Chiew, J.H.K.; Jia, J.; Zhang, C. Design and implementation of a smart lithiumion battery system with real-time fault diagnosis capability for electric vehicles. Energies 2017, 10, 1503. [Google Scholar] [CrossRef]
- Dubarry, M.; Baure, G.; Anseán, D. Perspective on State-of-Health Determination in Lithium-Ion Batteries. J. Electrochem. Energy Convers. Storage 2020, 17, 044701. [Google Scholar] [CrossRef]
- Liu, Y.; Wang, L.; Li, D.; Wang, K. State-of-health estimation of lithium-ion batteries based on electrochemical impedance spectroscopy: A review. Prot. Control. Mod. Power Syst. 2023, 8, 41. [Google Scholar] [CrossRef]
- Wu, J.; Meng, J.; Lin, M.; Wang, W.; Wu, J.; Stroe, D.-I. Lithium-ion battery state of health estimation using a hybrid model with electrochemical impedance spectroscopy. Reliab. Eng. Syst. Saf. 2024, 252, 110450. [Google Scholar] [CrossRef]
- Li, Y.; Maleki, M.; Banitaan, S. State of health estimation of lithium-ion batteries using EIS measurement and transfer learning. J. Energy Storage 2023, 73, 109185. [Google Scholar] [CrossRef]
- Pastor-Fernández, C.; Yu, T.F.; Widanage, W.D.; Marco, J. Critical review of non-invasive diagnosis techniques for quantification of degradation modes in lithium-ion batteries. Renew. Sustain. Energy Rev. 2019, 109, 138–159. [Google Scholar] [CrossRef]
- Teliz, E.; Zinola, C.F.; Díaz, V. Identification and quantification of ageing mechanisms in Li-ion batteries by Electrochemical impedance spectroscopy. Electrochimica Acta 2022, 426, 140801. [Google Scholar] [CrossRef]
- Galeotti, M.; Cinà, L.; Giammanco, C.; Cordiner, S.; Di Carlo, A. Performance analysis and SOH (state of health) evaluation of lithium polymer batteries through electrochemical impedance spectroscopy. Energy 2015, 89, 678–686. [Google Scholar] [CrossRef]
- Keysight Technologies. Advanced Electrochemical Impedance Spectroscopy (EIS) for Battery Testing. n.d. Available online: www.keysight.com (accessed on 1 June 2025).
- Iurilli, P.; Brivio, C.; Wood, V. On the use of electrochemical impedance spectroscopy to characterize and model the aging phenomena of lithium-ion batteries: a critical review. J. Power Sources 2021, 505, 229860. [Google Scholar] [CrossRef]
- Ezpeleta, I.; Freire, L.; Mateo-Mateo, C.; Nóvoa, X.R.; Pintos, A.; Valverde-Pérez, S. Characterisation of Commercial Li-Ion Batteries Using Electrochemical Impedance Spectroscopy. ChemistrySelect 2022, 7, e202104464. [Google Scholar] [CrossRef]
- Andre, D.; Meiler, M.; Steiner, K.; Walz, H.; Soczka-Guth, T.; Sauer, D.U. Characterization of high-power lithium-ion batteries by electrochemical impedance spectroscopy. II: Modelling. J. Power Sources 2011, 196, 5349–5356. [Google Scholar] [CrossRef]
- Micari, S.; Foti, S.; Testa, A.; De Caro, S.; Sergi, F.; Andaloro, L.; Aloisio, D.; Leonardi, S.G.; Napoli, G. Effect of WLTP CLASS 3B Driving Cycle on Lithium-Ion Battery for Electric Vehicles. Energies 2022, 15, 6703. [Google Scholar] [CrossRef]
- Birkl, C.R.; Roberts, M.R.; McTurk, E.; Bruce, P.G.; Howey, D.A. Degradation diagnostics for lithium ion cells. J. Power Sources 2017, 341, 373–386. [Google Scholar] [CrossRef]
- Osaka, T.; Nakade, S.; Rajamäki, M.; Momma, T. Influence of capacity fading on commercial lithium-ion battery impedance. J. Power Sources 2003, 119–121, 929–933. [Google Scholar] [CrossRef]
- Diao, W.; Saxena, S.; Han, B.; Pecht, M. Algorithm to determine the knee point on capacity fade curves of lithium-ion cells. Energies 2019, 12, 2910. [Google Scholar] [CrossRef]
- Edge, J.S.; O’Kane, S.; Prosser, R.; Kirkaldy, N.D.; Patel, A.N.; Hales, A.; Ghosh, A.; Ai, W.; Chen, J.; Yang, J.; et al. Lithium ion battery degradation: What you need to know. Phys. Chem. Chem. Phys. 2021, 23, 8200–8221. [Google Scholar] [CrossRef] [PubMed]
- Zhang, S.; Hosen, M.S.; Kalogiannis, T.; Van Mierlo, J.; Berecibar, M. State of health estimation of lithium-ion batteries based on electrochemical impedance spectroscopy and backpropagation neural network. World Electr. Veh. J. 2021, 12, 156. [Google Scholar] [CrossRef]
- Sabet, P.S.; Warnecke, A.J.; Meier, F.; Witzenhausen, H.; Martinez-Laserna, E.; Sauer, D.U. Non-invasive yet separate investigation of anode/cathode degradation of lithiumion batteries (nickel–cobalt–manganese vs. graphite) due to accelerated aging. J. Power Sources 2020, 449, 227369. [Google Scholar] [CrossRef]
- Börner, M.F.; Frieges, M.H.; Späth, B.; Spütz, K.; Heimes, H.H.; Sauer, D.U.; Li, W. Challenges of second-life concepts for retired electric vehicle batteries. Cell Rep. Phys. Sci. 2022, 3, 101095. [Google Scholar] [CrossRef]
- Prenner, S.; Part, F.; Jung-Waclik, S.; Bordes, A.; Leonhardt, R.; Jandric, A.; Schmidt, A.; Huber-Humer, M. Barriers and framework conditions for the market entry of second-life lithium-ion batteries from electric vehicles. Heliyon 2024, 10, e37423. [Google Scholar] [CrossRef] [PubMed]
- Wett, C.; Lampe, J.; Haß, J.; Seeger, T.; Turan, B. On the State of Usability for Lithium–Ion Batteries. Batteries 2024, 10, 57. [Google Scholar] [CrossRef]







| Parameter | 2s2p Module Performance | 2s Cell Performance |
|---|---|---|
| Nominal capacity | 83.4 Ah | 83.4 Ah |
| Nominal voltage | 7.5 V | 3.75 V |
| Maximum charge voltage | 8.3 V | 4.15 V |
| Typical Watt hour | 625 Wh | 312.5 Wh |
| End of discharge voltage | 5.0 V | 2.5 V |
| Maximum continuous charge current | 125 A | 125 A |
| Maximum continuous discharge current | 250 A | 250 A |
| Operation temperature range | −25–60 °C −40–60 °C | |
| Storage temperature range | ||
| Mass | 8.4 kg | |
| Stage | SoH | Cycle Number | Capacity (mAh) | Slope (mAh/Cycle) | Grade | SoH Indicator |
|---|---|---|---|---|---|---|
| 1 | 83 | 0–1061 | 66,972.6 | −9.16 | Reuse/reconditioning | Csum |
| 2 | 75 | 1061–1114 | 59,678.1 | −163 | Reconditioning | Rint |
| 3 | 67 | 114–1415 | 53,696.7 | −21.7 | ||
| 4 | 53 | 1415–1495 | 39,422.17 | −190 | Recycling | |
| 5 | 0 | 1495–1580 | 0 | −2258 |
Disclaimer/Publisher’s Note: The statements, opinions and data contained in all publications are solely those of the individual author(s) and contributor(s) and not of MDPI and/or the editor(s). MDPI and/or the editor(s) disclaim responsibility for any injury to people or property resulting from any ideas, methods, instructions or products referred to in the content. |
© 2025 by the authors. Licensee MDPI, Basel, Switzerland. This article is an open access article distributed under the terms and conditions of the Creative Commons Attribution (CC BY) license (https://creativecommons.org/licenses/by/4.0/).
Share and Cite
Ezpeleta, I.; Fernández, J.; Giráldez, D.; Freire, L. Rapid and Non-Invasive SoH Estimation of Lithium-Ion Cells via Automated EIS and EEC Models. Batteries 2025, 11, 325. https://doi.org/10.3390/batteries11090325
Ezpeleta I, Fernández J, Giráldez D, Freire L. Rapid and Non-Invasive SoH Estimation of Lithium-Ion Cells via Automated EIS and EEC Models. Batteries. 2025; 11(9):325. https://doi.org/10.3390/batteries11090325
Chicago/Turabian StyleEzpeleta, Ignacio, Javier Fernández, David Giráldez, and Lorena Freire. 2025. "Rapid and Non-Invasive SoH Estimation of Lithium-Ion Cells via Automated EIS and EEC Models" Batteries 11, no. 9: 325. https://doi.org/10.3390/batteries11090325
APA StyleEzpeleta, I., Fernández, J., Giráldez, D., & Freire, L. (2025). Rapid and Non-Invasive SoH Estimation of Lithium-Ion Cells via Automated EIS and EEC Models. Batteries, 11(9), 325. https://doi.org/10.3390/batteries11090325


