Article

Systematic Characterization of Lithium-Ion Cells for Electric Mobility and Grid Storage: A Case Study on Samsung INR21700-50G

1
Department of Automotive Engineering, Clemson University, Greenville, SC 29607, USA
2
Holcombe Department of Electrical and Computer Engineering, Clemson University, Clemson, SC 29634, USA
*
Authors to whom correspondence should be addressed.
Batteries 2025, 11(8), 313; https://doi.org/10.3390/batteries11080313
Submission received: 14 June 2025 / Revised: 1 July 2025 / Accepted: 13 August 2025 / Published: 16 August 2025

Abstract

Accurate parametric modeling of lithium-ion batteries is essential for battery management system (BMS) design in electric vehicles and broader energy storage applications, enabling reliable state estimation and effective thermal control under diverse operating conditions. This study presents a detailed characterization of lithium-ion cells to support advanced BMS in electric vehicles and stationary storage. A second-order equivalent circuit model is developed to capture instantaneous and dynamic voltage behavior, with parameters extracted through Hybrid Pulse Power Characterization over a broad range of temperatures (−10 °C to 45 °C) and state-of-charge levels. The method includes multi-duration pulse testing and separates ohmic and transient responses using two resistor–capacitor branches, with parameters tied to physical processes like charge transfer and diffusion. A weakly coupled electro-thermal model is presented to support real-time BMS applications, enabling accurate voltage, temperature, and heat generation prediction. This study also evaluates open-circuit voltage and direct current internal resistance across pulse durations, leading to power capability maps (“fish charts”) that capture discharge and regenerative performance across SOC and temperature. The analysis highlights performance asymmetries between charging and discharging and confirms model accuracy through curve fitting across test conditions. These contributions enhance model realism, thermal control, and power estimation for real-world lithium-ion battery applications.

1. Introduction

Lithium-ion batteries (LIBs) have been the preferred choice for energy storage in consumer electronics for several decades. More recently, their adoption has expanded significantly into electric mobility applications, including hybrid electric vehicles (HEVs) and battery electric vehicles (BEVs), due to their superior characteristics to traditional battery chemistries. Specifically, LIBs exhibit higher energy density, allowing longer driving ranges or usage times [1]. In addition to high energy density, they demonstrate enhanced power density, enabling rapid charging and discharging, which is critical for vehicle acceleration and regenerative braking [2]. LIBs also show relatively low self-discharge rates, which makes them suitable for applications requiring long idle periods without significant capacity loss [3]. Furthermore, these batteries possess favorable thermal stability and maintain performance over a wide range of temperatures, making them safer and more reliable for automotive applications [4] and mobile energy storage [5]. Ensuring safe, efficient, and long-lasting operation of LIBs in such demanding environments requires sophisticated battery management systems (BMSs). The BMS monitors and controls battery charging and discharging processes to prevent unsafe conditions like overcharging, overheating, or deep discharging, which can degrade battery life or lead to failure. At the core of a robust BMS lies accurate battery modeling that can predict battery behavior under diverse operating conditions, including variations in load, temperature, and state-of-charge (SOC) [6]. Accurate models enable precise estimation of battery state parameters and facilitate optimal control strategies, improving overall system efficiency and reliability. In particular, integrating physics-based electrochemical and thermal models significantly enhances BMS functionality during high-power drive cycles. Electrochemical models capture internal lithium-ion dynamics and voltage behavior, enabling accurate SOC, SOH, and SOP estimation under dynamic load conditions [7]. Thermal models provide predictive insight into core temperature evolution, supporting proactive thermal management and safe power delivery [8]. The coupled electro-thermal modeling approach also enables degradation-aware control at high C-rates [9], and supports model predictive control frameworks for optimizing performance and safety in real time [10,11]. In this study, we develop and validate a detailed electro-thermal model of a sample lithium-ion cell to enable accurate state estimation, thermal control, and power prediction for advanced battery management systems in electric vehicles and energy storage applications.
High-fidelity electrochemical models, such as the pseudo two-dimensional (P2D) model, provide a detailed representation of the internal battery processes. These models capture phenomena such as lithium-ion transport within electrodes, solid-phase diffusion, electrochemical reaction kinetics, and thermal effects [12]. While these models are highly accurate and helpful for fundamental research and design optimization, their practical implementation in real-time BMS applications is challenging. This is primarily due to the need for detailed internal parameters—including electrode geometry, particle size distribution, and material properties—often proprietary or unavailable to end users. Moreover, the computational complexity of solving coupled partial differential equations in electrochemical models makes them unsuitable for embedded systems with limited processing power, such as EVs and autonomous vehicles [13,14].
To circumvent these challenges, equivalent circuit models (ECMs) are widely adopted in practical BMS implementations. ECMs abstract the battery’s complex electrochemical behavior into a network of electrical components—resistors, capacitors, and voltage sources—that can be identified using externally measurable signals like terminal voltage, current, and temperature [13]. This simplification offers significant computational advantages and allows real-time state estimation and control. The simplest ECM consists of a single ohmic resistance, representing the instantaneous voltage drop due to internal resistance. However, this model does not capture the transient response of the battery voltage to changing loads, which is influenced by diffusion and charge transfer processes [15].
More sophisticated ECMs, such as the Thevenin model, include one or more resistor–capacitor (RC) pairs in series with the ohmic resistance to improve accuracy. These RC pairs simulate the slower dynamic processes and allow the model to reproduce the voltage relaxation and polarization effects observed during charging and discharging [16]. Figure 1 illustrates a commonly employed second-order RC ECM, which includes two RC pairs capturing different time constants of the battery’s dynamic response. Parameter identification for these ECMs is typically performed using Hybrid Pulse Power Characterization (HPPC) tests, which apply controlled current pulses at various state-of-charge (SOC) levels and temperatures to extract the relevant electrical parameters [17]. These parameters, including the ohmic resistance and the resistance-capacitance values of each RC pair, depend strongly on operating conditions. For example, elevated temperatures generally enhance lithium-ion mobility and reduce resistive losses, resulting in lower ohmic and charge transfer resistances. Conversely, increased internal resistance limits the battery’s performance and efficiency at low temperatures. The SOC also affects the battery’s internal dynamics, influencing the open-circuit voltage (OCV) and reaction kinetics [18].
Extensive research has been conducted to refine the parameter estimation methods for second-order ECMs. Nejad et al. applied a dual extended Kalman filter (EKF) technique to estimate nonlinear model parameters in real-time robustly, accommodating changes in temperature and SOC [17]. Similarly, in [18], the authors employed genetic algorithms to optimize ECM parameters, concluding that while increasing the number of RC pairs can improve model accuracy, a second-order ECM often provides the best balance between complexity and performance. Other methods, such as recursive least squares and adaptive observers, have also been explored for online parameter adaptation. Still, their implementation is limited by the computational resources available in typical BMS electronic control units (ECUs) [13].
Due to these constraints, many commercial BMSs rely on pre-calculated lookup tables derived from offline parameter identification across various SOC and temperature points. These tables enable quick estimation of battery capabilities such as maximum charge/discharge power and state estimations without heavy real-time computation [6,13].
In our previous study [19], the Samsung INR21700-50G cells were studied with a focus on comparison between the cell level and module level in terms of thermal behavior and performance against various drive cycles. A performance comparison with Panasonic 18,650 cells was also presented. The 50G offers superior gravimetric and volumetric energy density relative to 18,650 and other 21,700 formats, enabling reduced cell count and simplified pack architecture. While not optimized for high current discharge, its balanced performance between energy and power suits hybrid/battery electric vehicles and stationary storage systems. Its mature NCA-based chemistry and wide availability support its relevance for research and commercial integration. This work presents a detailed characterization of the Samsung INR21700-50G lithium-ion cell for electric mobility and grid storage applications. A second-order ECM is developed, with model parameters extracted systematically using HPPC data across a wide temperature and SOC range. A key strength of the study is its physical interpretation of model parameters, linking them to electrochemical processes like charge transfer and diffusion. The paper discusses the weak interaction between electrical and thermal dynamics, whereby the thermal behavior evolves much more slowly than electrical dynamics, allowing them to be solved sequentially and enabling real-time application in BMSs. It also provides detailed performance maps, including charge and discharge power capabilities visualized through “fish charts”, and distinctly analyzes regenerative and discharge behaviors. The data and models presented can be a reference for BMS developers and system designers seeking to optimize control strategies for enhanced performance, safety, and cycle life in automotive and grid-scale battery systems.
The remainder of the paper is organized as follows. Section 2 provides an overview of the second-order ECM model. Section 3 presents the static capacity and HPPC testing methodologies. Section 4 presents detailed experimental results, model validation, and analysis relevant to automotive applications, highlighting practical insights on how the results can be used, which is followed by a conclusion.

2. Equivalent Circuit Model and Thermal Dynamics

In this section, a second-order equivalent circuit model (ECM) is used to represent the lithium-ion cell dynamics and is shown in Figure 1. As discussed in the introduction and demonstrated in [20], a second-order ECM offers a good balance between accuracy and reliability for parameter identification across various temperatures and SOC. The second-order ECM can be described by the following continuous-time equations:
d S O C ( t ) d t = i ( t ) Q
d V 1 ( t ) d t = 1 R 1 C 1 V 1 ( t ) + 1 C 1 i ( t )
d V 2 ( t ) d t = 1 R 2 C 2 V 2 ( t ) + 1 C 2 i ( t )
V t ( t ) = V o c v ( S O C ( t ) ) V 1 ( t ) V 2 ( t ) + i ( t ) R 0
where
  • S O C is the state of charge of the cell;
  • Q is the cell capacity in ampere-hours;
  • V 1 and V 2 represent the voltages across the two RC pairs;
  • i ( t ) is the applied current, with discharge current defined as negative;
  • R 0 is the ohmic internal resistance of the cell;
  • V o c v ( S O C ) is the open-circuit voltage as a function of SOC.
The ohmic resistance R 0 predominantly reflects ionic resistance in the electrolyte and interfacial contact resistance. The two RC pairs capture the cell’s dynamic behavior: the first RC pair models the faster dynamics due to concentration polarization (voltage drop caused by lithium-ion diffusion) [21]. In contrast, the second RC pair accounts for slower electrochemical polarization effects (voltage drop due to reaction kinetics at the electrode surface) [22].
The discrete-time state-space representation with sampling time T s is given by
S O C k + 1 V 1 , k + 1 V 2 , k + 1 = 1 0 0 0 e T s τ 1 0 0 0 e T s τ 2 S O C k V 1 , k V 2 , k + T s Q R 1 1 e T s τ 1 R 2 1 e T s τ 2 i k ,
V t , k = V o c v ( S O C k ) V 1 , k V 2 , k + i k R 0 ,
where, τ 1 = R 1 C 1 and τ 2 = R 2 C 2 are the time constants of the respective RC pairs.
The thermal dynamics of the cell are modeled using a lumped parameter thermal network [23], as illustrated in Figure 2, and described by the following equations:
Q ˙ ( t ) = V o c v ( S O C ( t ) ) V t ( t ) i ( t )
C c T ˙ c ( t ) = Q ˙ ( t ) + T s ( t ) T c ( t ) R c
C s T ˙ s ( t ) = T a i r ( t ) T s ( t ) R u T s ( t ) T c ( t ) R c
where
  • T c , T s , and  T a i r denote the core, surface, and ambient air temperatures, respectively.
  • R c and R u are the lumped thermal conduction resistances between core-surface and surface-air, respectively.
  • C c and C s are the lumped thermal capacitance of the core and surface layers, respectively.
  • Q ˙ is the instantaneous heat generation rate inside the cell.
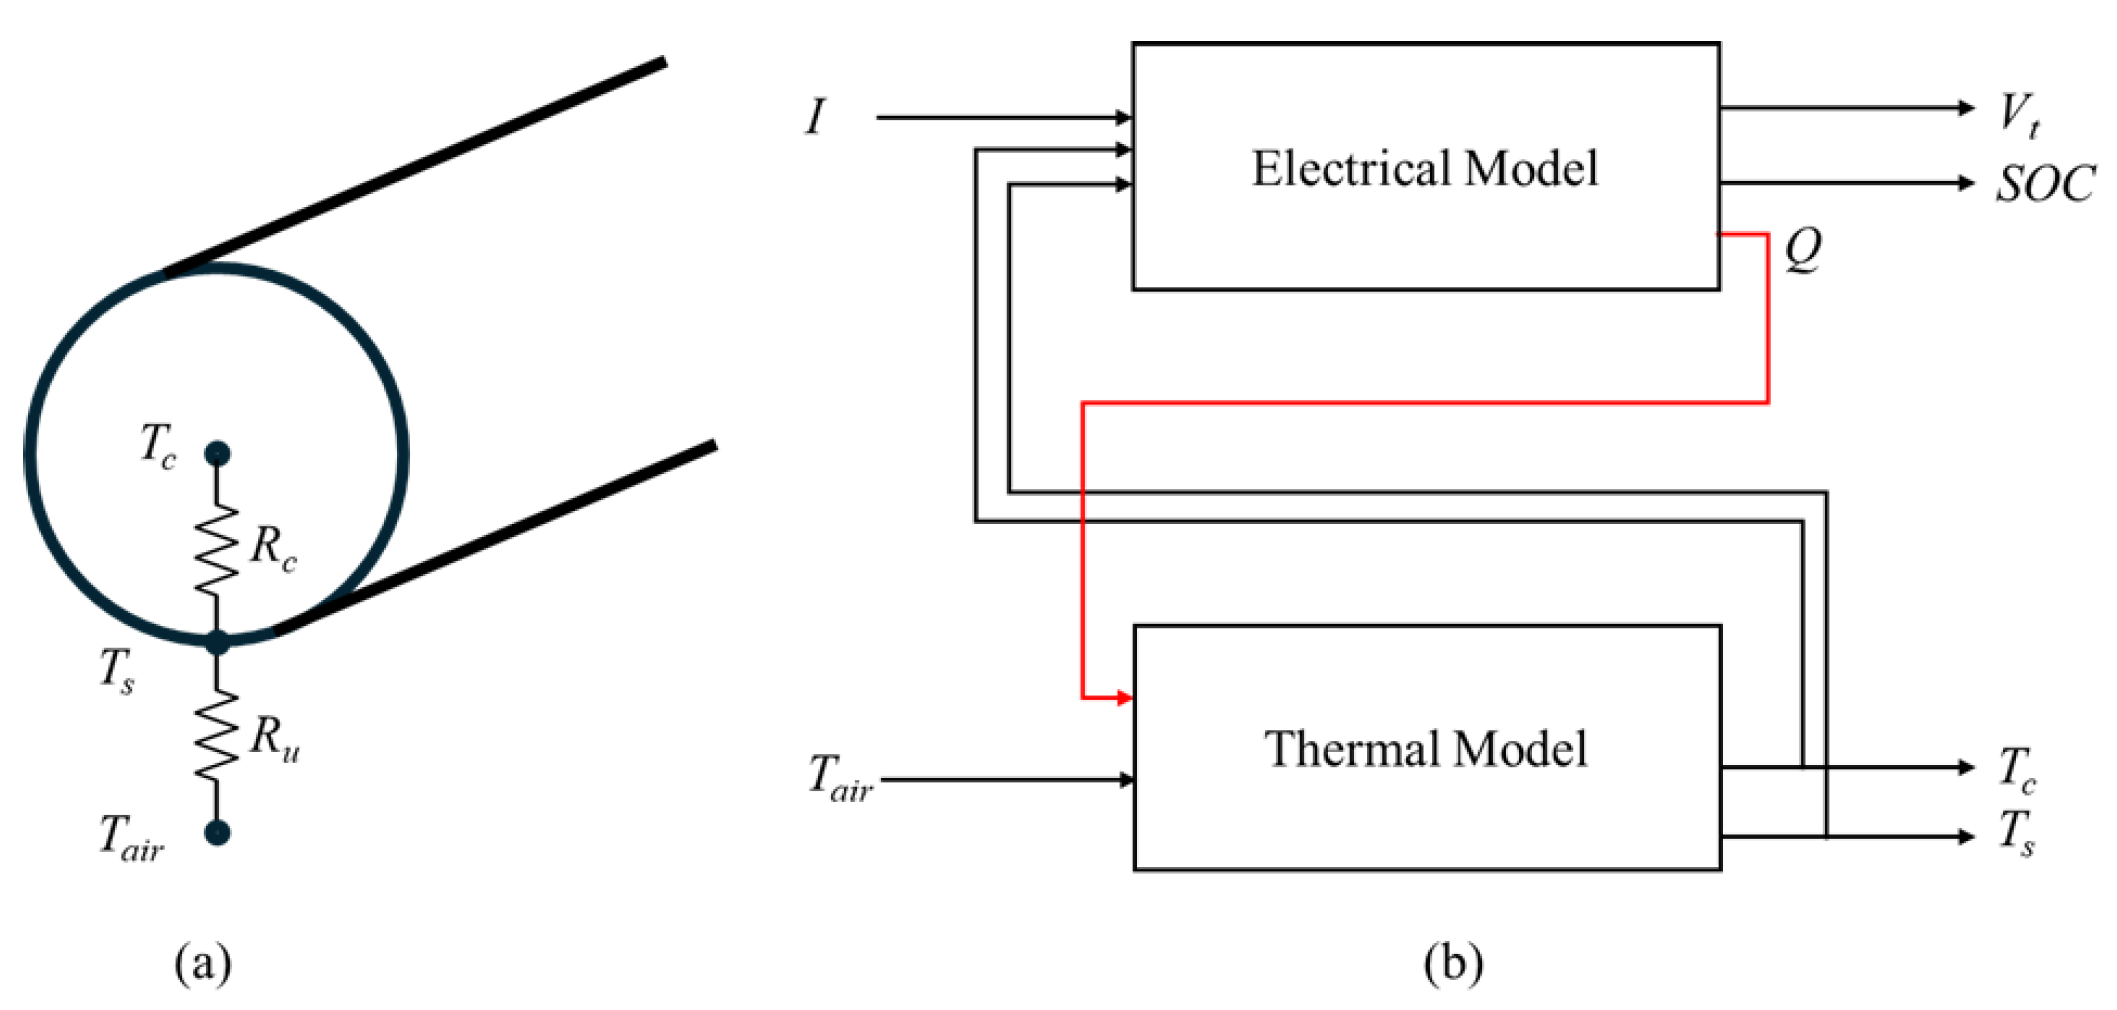
Figure 2. (a) Thermal model. (b) Coupling between electrical and thermal model.
Batteries 11 00313 g002
The lumped capacitance model used in this work represents the cell with two thermal nodes-core and surface, each associated with a distinct temperature. This approach captures the dominant heat transfer dynamics while neglecting finer internal temperature gradients that may develop during a high charge/discharge scenario. Although this simplification may lead to some inaccuracy in representing detailed thermal behavior and localized degradation effects, it significantly reduces computational complexity and is therefore well suited for real-time implementation in BMSs [7].
A weak coupling exists between the thermal and electrical dynamics. Thermal dynamics in LIBs evolve significantly slower than the electrical dynamics, enabling a decoupled modeling approach to solve for the parameters separately [24]. The electrical dynamics are solved first, followed by the thermal dynamics. Heat generation is computed based on the electrical solution and then used as input to the thermal model to evaluate the resulting temperature change. The updated temperature is subsequently incorporated into the next iteration of the electrical dynamics, enabling a sequentially coupled simulation approach. However, in a real-time BMS application, a 3D lookup table, parameterized by T m = T c + T s 2 and SOC, dynamically updates the parameters of the electrical model. The parameter table is constructed with a resolution of 1% SOC and 1 ° C. Trilinear interpolation is applied to estimate intermediate values between parameter data points obtained experimentally.

3. Test Procedures

This section describes the test procedures employed to identify the parameters of the second-order ECM for the lithium-ion cell. The procedures include cell preparation for testing (charging and discharging), static capacity testing, and the HPPC test protocol. All tests are conducted using a Samsung INR-21700-50G cell (Samsung SDI Co., Ltd, Cheonan, Republic of Korea). The physical and electrical specifications of the cell are summarized in Table 1.

3.1. Test Setup

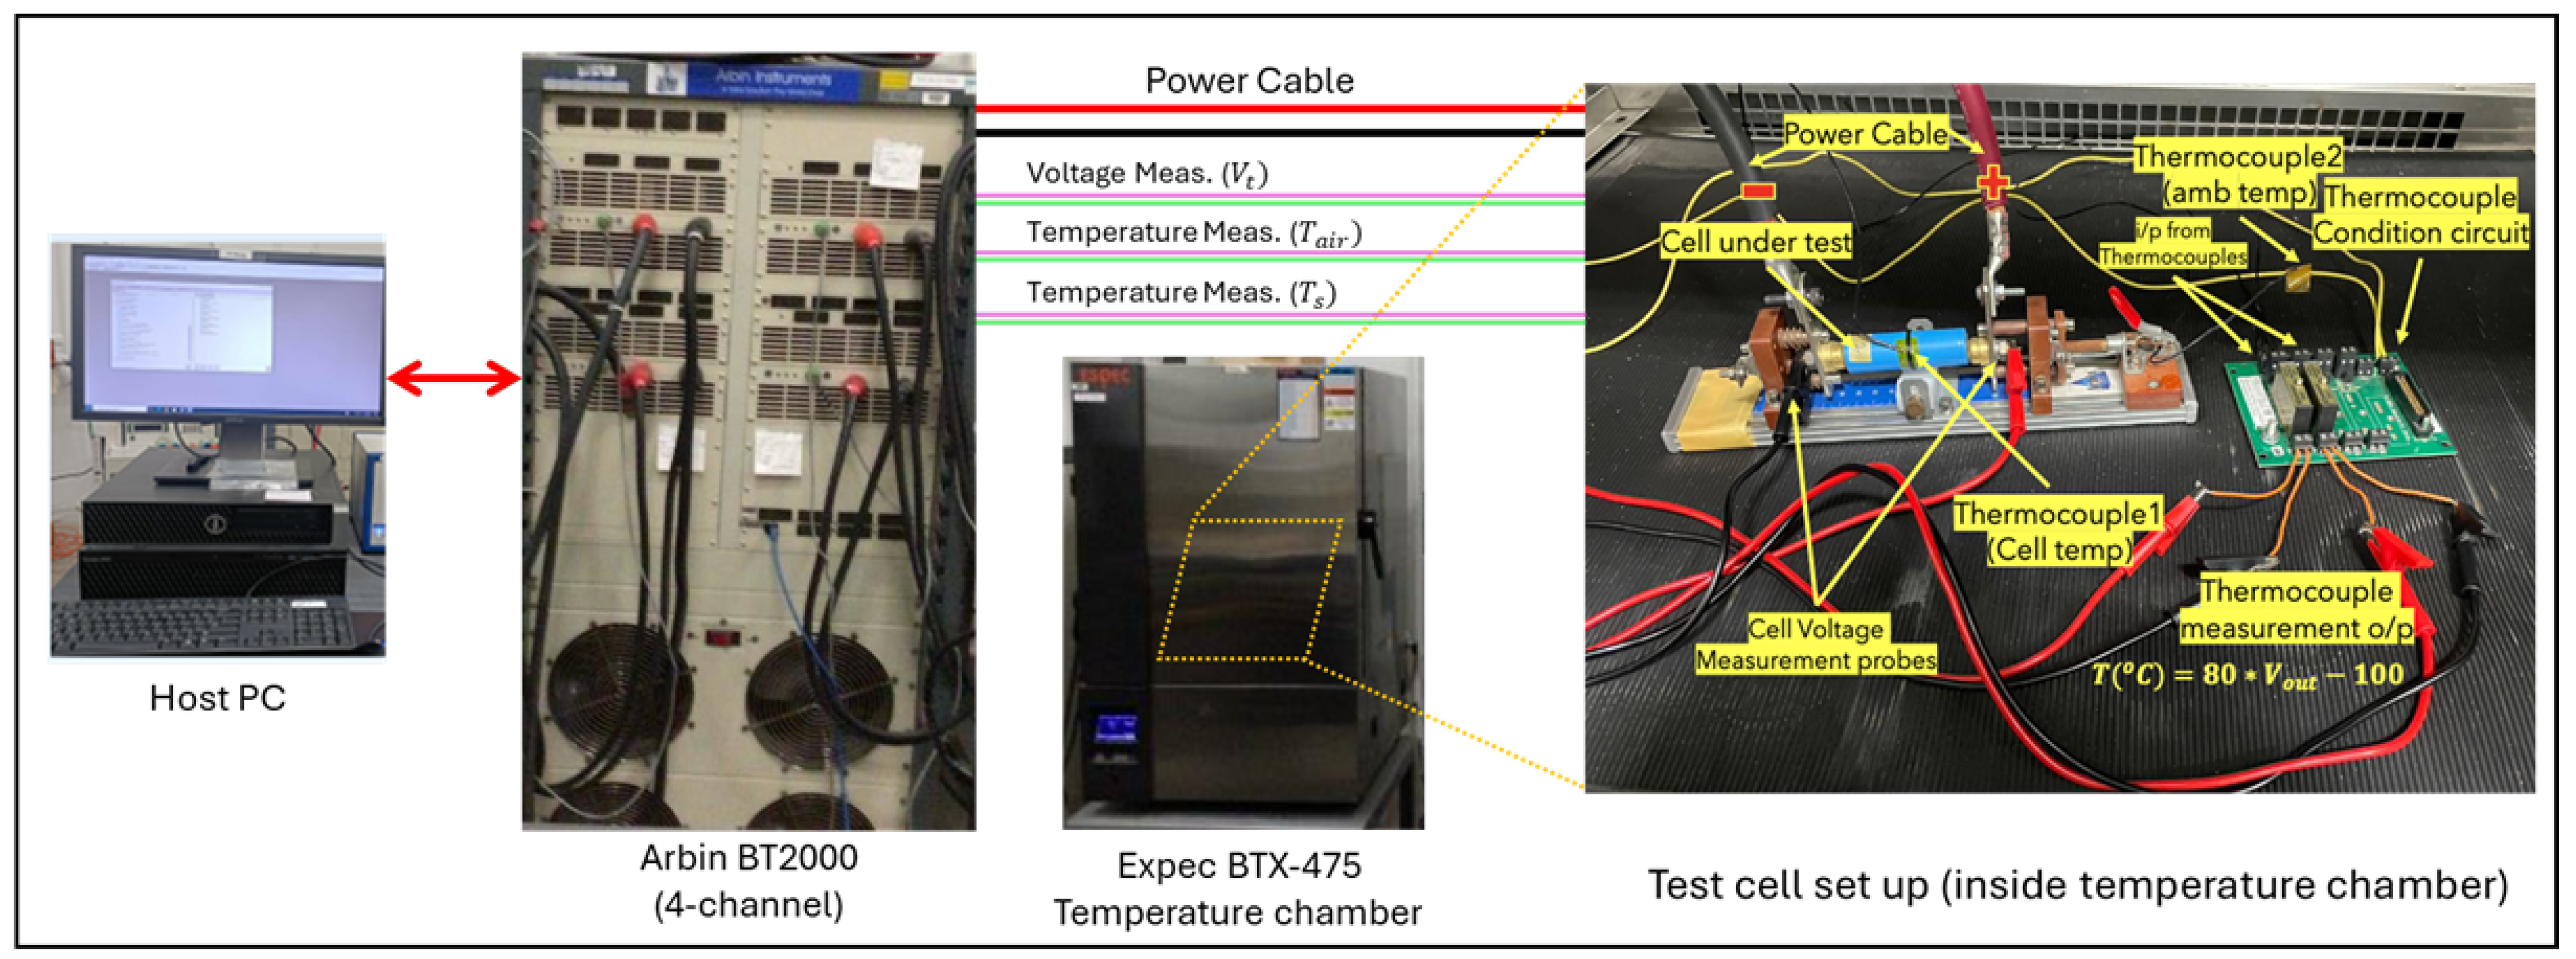
Figure 3 illustrates the experimental setup used to perform the static capacity and HPPC tests. A host PC programs current and voltage profiles that are executed by the Arbin BT2000 battery cycler (Arbin Instruments, College Station, TX, USA). The power cables from Channel 3 connect directly to the cell terminals, while a voltage measurement probe monitors the cell terminal voltage. Two thermocouples are used for temperature measurements. Thermocouple 1 is attached near the center of the cell surface to measure the cell temperature, and Thermocouple 2 is placed in the ambient air. The cell and temperature measurement assembly are housed inside an ESPEC BTX-475 temperature-controlled chamber (ESPEC North America, Hudsonville, MI, USA) to maintain a stable test temperature throughout the experiments. To minimize the influence of parasitic heat during testing, several precautions were taken: (a) thick, short power cables were used to reduce resistive heating; (b) voltage probes and measurement equipment were carefully calibrated; and (c) a low-power signal conditioning circuit was employed and positioned away from the cell under test. These measures ensured that the impact of parasitic heat on the thermal response of the cell was negligible.

3.2. Test Preparation

Before testing, cells are conditioned by soaking at 30 ° C for at least two hours to stabilize temperature. The cell surface temperature is monitored using a thermocouple affixed approximately  35 m m from the top (or bottom) of the cylindrical cell. All subsequent test procedures are conducted after thermal stabilization. The cell is charged with a constant current (CC) at a rate of C/2 until the terminal voltage  V t reaches  4.2   V , followed by a constant voltage (CV) hold at  4.2   V until the current drops to  50 m A . Figure 4a shows the complete CC-CV charging profile. After charging, the cell rests under open-circuit conditions at the test temperature for at least one hour to reach electrochemical and thermal equilibrium before testing begins.

3.3. Static Capacity Test

Static capacity tests evaluate the total extractable ampere-hour capacity of the cell under a constant discharge current at a given ambient temperature. The discharge current is typically specified as a C-rate of the cell. A fully charged and rested cell is discharged until it reaches the manufacturer’s specified cutoff voltage. Performing tests across various discharge rates and temperatures provides insight into the dependency of capacity on these factors.

3.4. Hybrid Pulse Power Characterization (HPPC) Test

The HPPC test characterizes the battery’s power performance across its usable voltage and SOC range by applying discharge and regenerative pulses. For each SOC step (usually at 5% intervals), the test measures the minimum voltage at the end of a discharge pulse and the maximum voltage at the end of a charge (regenerative) pulse. Figure 4b shows a typical HPPC current profile for a 1 C pulse with varying pulse durations.
In this test, negative current pulses represent discharging, and positive current pulses correspond to charging. The sequence begins with a discharge pulse (Pulse 1), followed by an SOC reset pulse (Pulse 2) to return the battery to the initial SOC, then a rest period. This sequence repeats with a charge pulse (Pulse 3), another SOC reset pulse (Pulse 4), and rest. Each pulse duration starts at 2 s, with subsequent sequences using 10, 30, and 180 s pulses. After completing a set of pulse sequences, the SOC is lowered by 5%, followed by a rest period of 1–2 h before the next cycle begins. The process continues until the cell reaches the manufacturer’s minimum operating voltage. At high SOC levels (above 90%), the charge pulse can push the terminal voltage beyond the cell’s maximum voltage limit. To avoid this, HPPC tests can be started at a lower SOC (e.g., 85%), or charge pulses can be omitted or limited.
The maximum and minimum voltages recorded after the discharge and charge pulses are used to estimate the cell’s direct current internal resistance (DCIR) (also called pulse resistance) as a function of SOC and pulse duration. Figure 4c illustrates the Δ V curve used for DCIR measurements for a discharge pulse. The following equations are used to calculate their values.
Discharge Resistance , R dsch = Δ V dsch Δ I dsch
Charge / Regen Resistance , R ch = Δ V ch Δ I ch
In these equations, Δ V dsch represents the maximum voltage drop during the discharge pulse for the change in current applied Δ I dsch as shown in Figure 4c. For a charge pulse (not shown in the figure), Δ V ch represents the maximum increase in voltage during the pulse for the change in current applied Δ I ch . These resistance values are computed for all pulse durations under different temperature and SOC conditions. It is important to emphasize that the DCIR resistance values are conceptually and quantitatively different from R 0 , R 1 , and  R 2 in the ECM discussed in the previous section. The DCIR captures the total effective resistance over a specific pulse duration, whereas the ECM parameters provide a more granular, time-resolved description of the dynamic response. The discharge and charge resistance values are then used to evaluate the cell’s discharging and charging (regenerative) power capabilities using the following equations.
P dsch = V min pulse V o c v V min pulse R dsch
P ch = V max pulse V max pulse V o c v R ch
Here, P dsch refers to the discharge pulse power capability and P ch refers to the charging/regen pulse power capability. V o c v refers to the cell’s open-circuit voltage at a given SOC and temperature. The values V min pulse = 2.5 V and V max pulse = 4.2 V are the lower and upper pulse voltage limits, respectively, as specified by the manufacturer. These limits define the safe operating range of the cell during power pulses.
The voltage responses provide key data— Δ V 1 , dsch and Δ V 2 , dsch during discharge, and  Δ V 1 , ch and Δ V 2 , ch during charge—for evaluating internal resistance and polarization behavior as functions of pulse duration and SOC. The voltage measured immediately before each pulse is assumed to represent the OCV, as the cell is sufficiently rested before each pulse.
These measurements are essential for parameter identification in ECMs such as the 1-RC and 2-RC models [25]. While OCV and R 0 can be directly extracted, the remaining parameters require curve fitting of the transient voltage response. Details of the identification procedure for the 2-RC model used in this study are provided in Section 5. The test procedures follow widely accepted standards, including those from the U.S. Department of Energy [26], and have been validated in prior modeling studies [27].

3.5. Test Cases

Both static capacity and HPPC tests are performed at temperatures T { 10 , 0 , 10 , 20 , 30 , 45 } ° C for two C-rates: 0.2 C and 1 C. For HPPC tests, pulses are applied every 5% SOC decrement. Due to the extensive time required for the full HPPC test matrix, only one iteration is performed.

4. Results

This section presents static capacity and HPPC test results, followed by open-circuit voltage characterization and further performance analysis.

4.1. Static Capacity Test Results

Figure 5a shows the discharge voltage profiles at various ambient temperatures and for two C-rates (0.2 C and 1 C). Figure 5b illustrates the corresponding temperature rise above ambient for each case. At 30 ° C, the discharge voltage remains the highest throughout the test duration. The terminal voltage decreases as the temperature deviates from the lower or higher value. This behavior is particularly pronounced at 10 ° C, especially under the higher C-rate (1 C), where internal resistance significantly impacts voltage performance.
The rise in temperature over ambient, defined as the difference between the cell surface temperature and the test chamber (ambient) temperature, remains negligible for the 0.2 C cases. However, for 1 C tests, the temperature rise gradually increases and peaks near the end of the discharge. The effect is more substantial at lower ambient temperatures, indicating a reduced heat dissipation efficiency.
Figure 5c summarizes the total capacity and energy extracted under different test conditions. As expected, capacity and energy decrease with lower ambient temperatures and higher discharge rates. For the extreme case of 10 ° C, only 4434 mAh could be extracted at 0.2 C. This value is approximately 13 % less than the manufacturer-specified capacity at 25 ° C. The reduction in capacity is substantially smaller than the manufacturer-specified 25 % reduction at 10 ° C. For the 1 C case, the reduction was approximately 20 % (manufacturer data unavailable).

4.2. HPPC Test Results

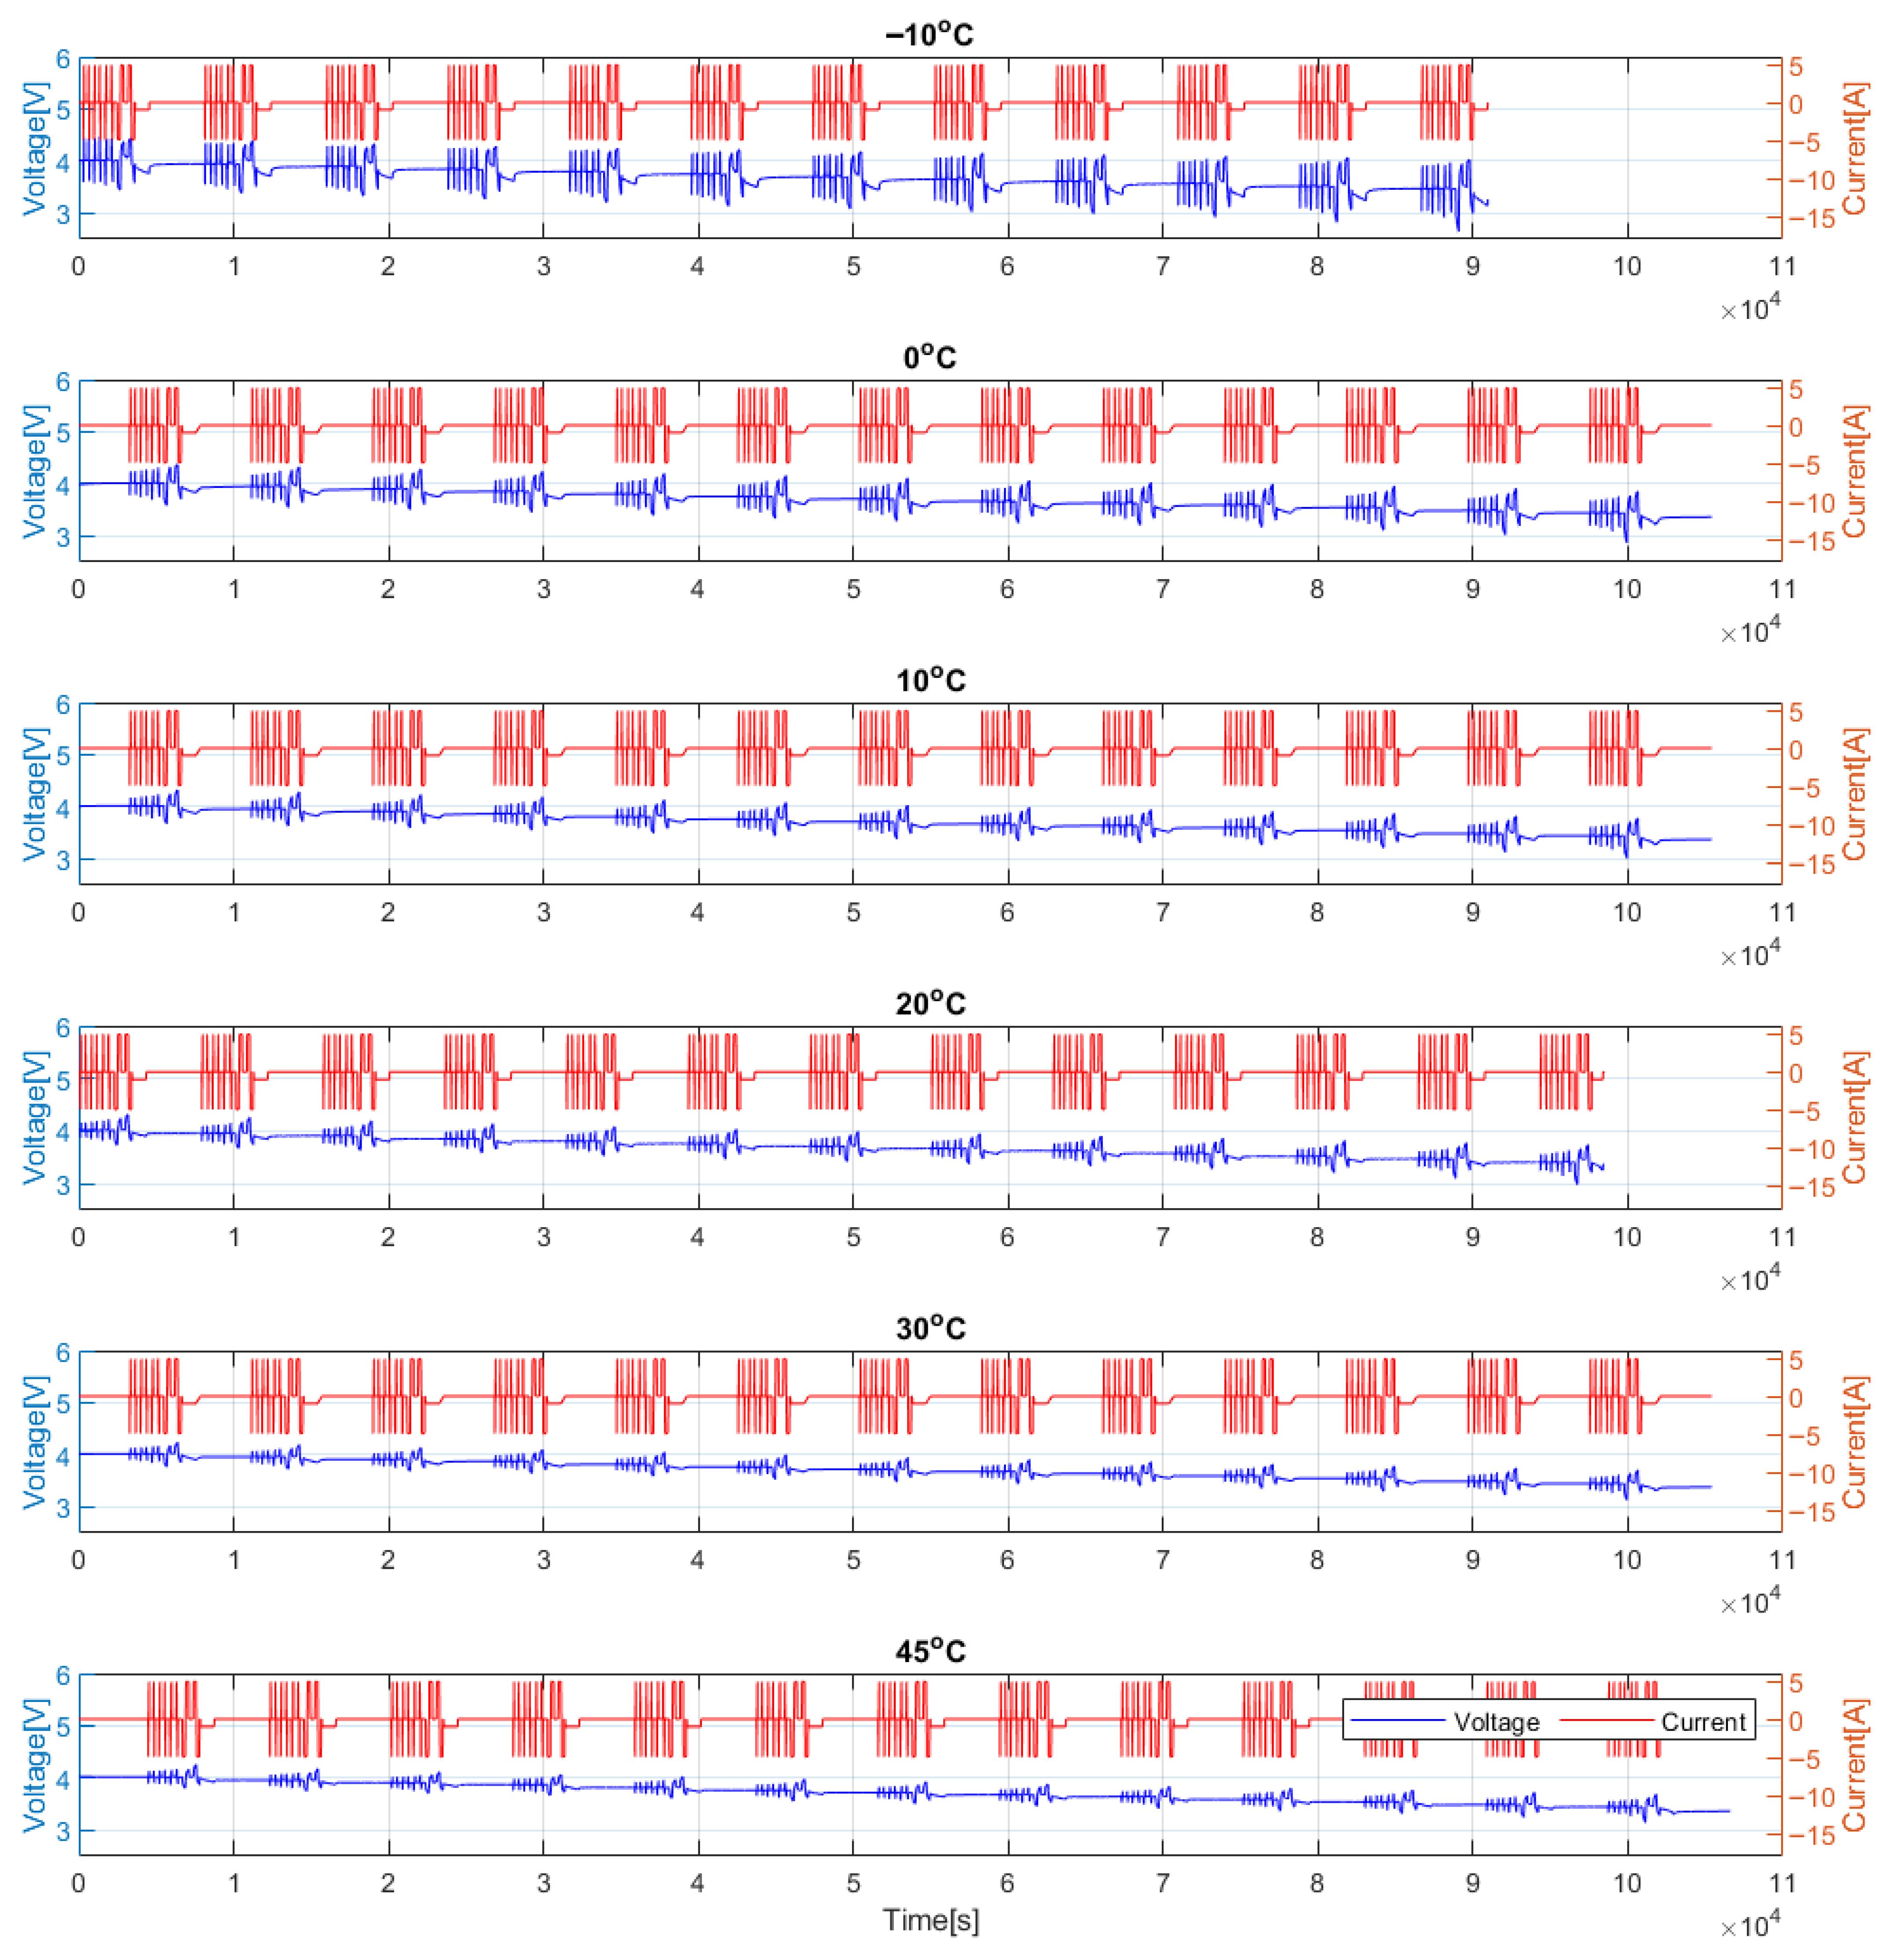
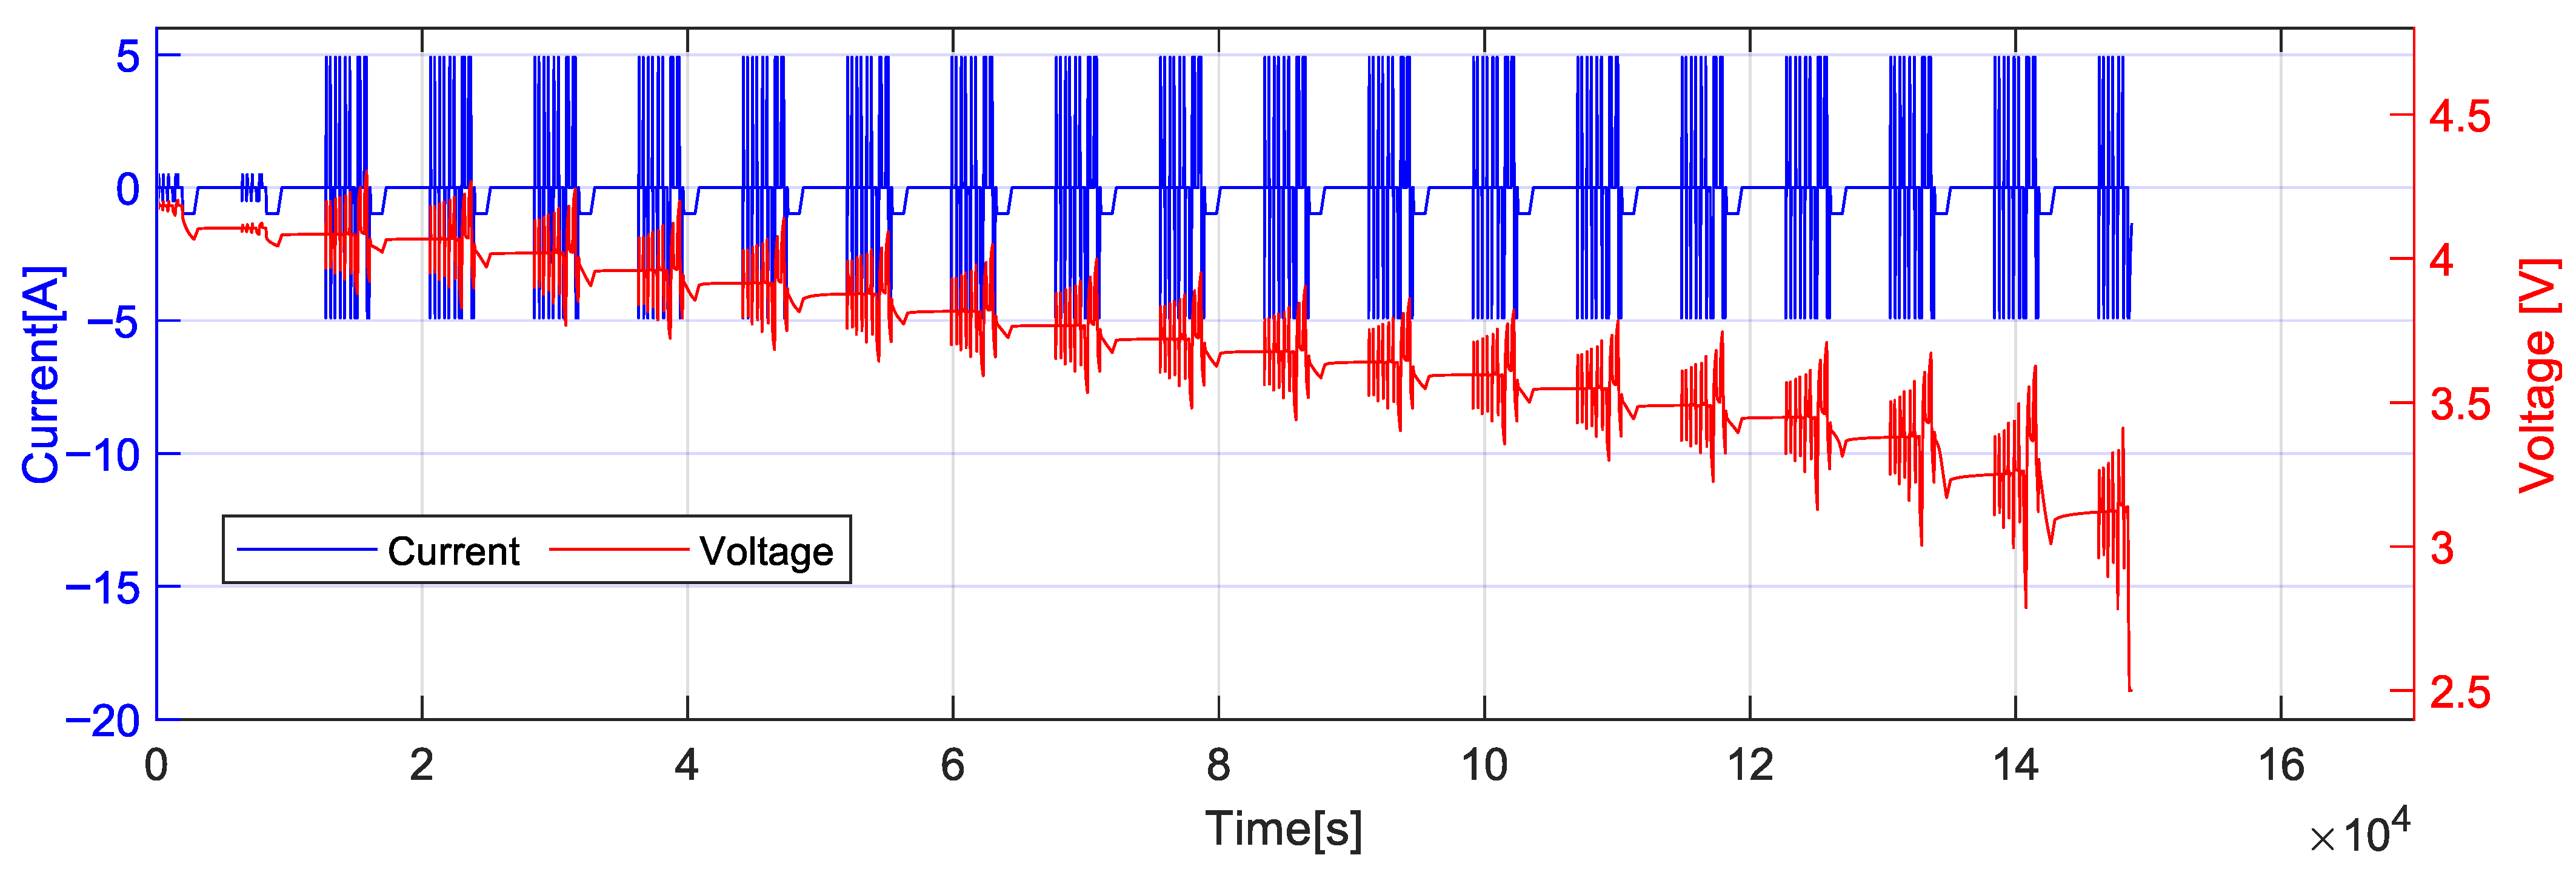
HPPC tests were performed at every 5% SOC interval, beginning at 100% SOC and ending when the terminal voltage fell below the lower limit of 2.5 V. Figure 6 shows the test result at 30 ° C at 1 C. To avoid exceeding the upper voltage limit of 4.2 V during charge pulses at higher SOCs, the pulse current was reduced to C/10 at higher SOCs. The HPPC test results for test cases with 1 C are provided in Figure A1, and 0.2 C are provided in Figure A2 in the Appendix for reference. Figure A1 presents the data for the 1 C tests, while Figure A2 corresponds to the 0.2 C tests. Each plot shows the applied current pulses and the resulting voltage responses in the SOC range of 80% to 20%. At  10 ° C , a premature voltage drop below the cutoff threshold leads to an early termination of the test before reaching 20% SOC. The HPPC test results enable the extraction of various battery parameters, including open-circuit voltage, internal resistance, and power capability for both discharge and regenerative modes at each temperature and SOC condition. As will be evident in the subsequent sections, qualitative comparisons across test conditions revealed consistent trends that align with expected electrochemical and thermal behavior, indicating that the results are both representative and physically meaningful.

4.2.1. Open-Circuit Voltage

The open-circuit voltage (OCV) is extracted from the HPPC test by measuring the terminal voltage at the beginning and after each rest period following a 5% SOC reduction. A one-hour rest period was applied at each step to allow for sufficient OCV recovery. This duration was chosen as a practical balance between total testing time and the need for voltage stabilization. Although full equilibrium may require longer rest times, especially at lower temperatures where ion transport slows, the 1-h rest was deemed adequate to minimize transient effects and yield reliable OCV estimates. The resting duration is also consistent with the testing standard recommended by the U.S. Department of Energy [26]. Figure 7 shows the OCV as a function of SOC for various ambient temperatures. The results indicate minimal temperature dependence in the mid- to high-SOC range (SOC > 30%). For instance, the OCV deviation between 10 ° C and the reference 30 ° C case was within −0.21% to −0.73% for SOC above 30%, while more significant deviations (up to −4.80%) were observed at lower SOCs, reflecting increased polarization and reduced electrochemical activity under cold conditions. These trends are consistent with the expected temperature-dependent behavior of lithium-ion cells. At  10 ° C, however, the test could not be completed for SOC levels below approximately 15% due to the terminal voltage prematurely reaching the lower cutoff limit.

4.2.2. Charge/Discharge Power Capability

In automotive applications, batteries are required to deliver high power during vehicle acceleration (discharge) and to absorb significant amounts of energy during regenerative braking (charge). The ability of a battery cell to meet these demands is highly dependent on several factors, including the SOC, the ambient temperature, and the duration of the applied power pulse. Therefore, a detailed characterization of the cell’s behavior under various pulse durations is essential to understand and quantify its power handling capabilities.
To evaluate the pulse power capability of the cell, it is first necessary to determine the DCIR, also commonly referred to as pulse resistance. This resistance is calculated by measuring the change in terminal voltage across a known current pulse and dividing the voltage drop (or rise) by the magnitude of the applied current. The DCIR is determined separately for discharge and regeneration (charge) phases using the following relationships:
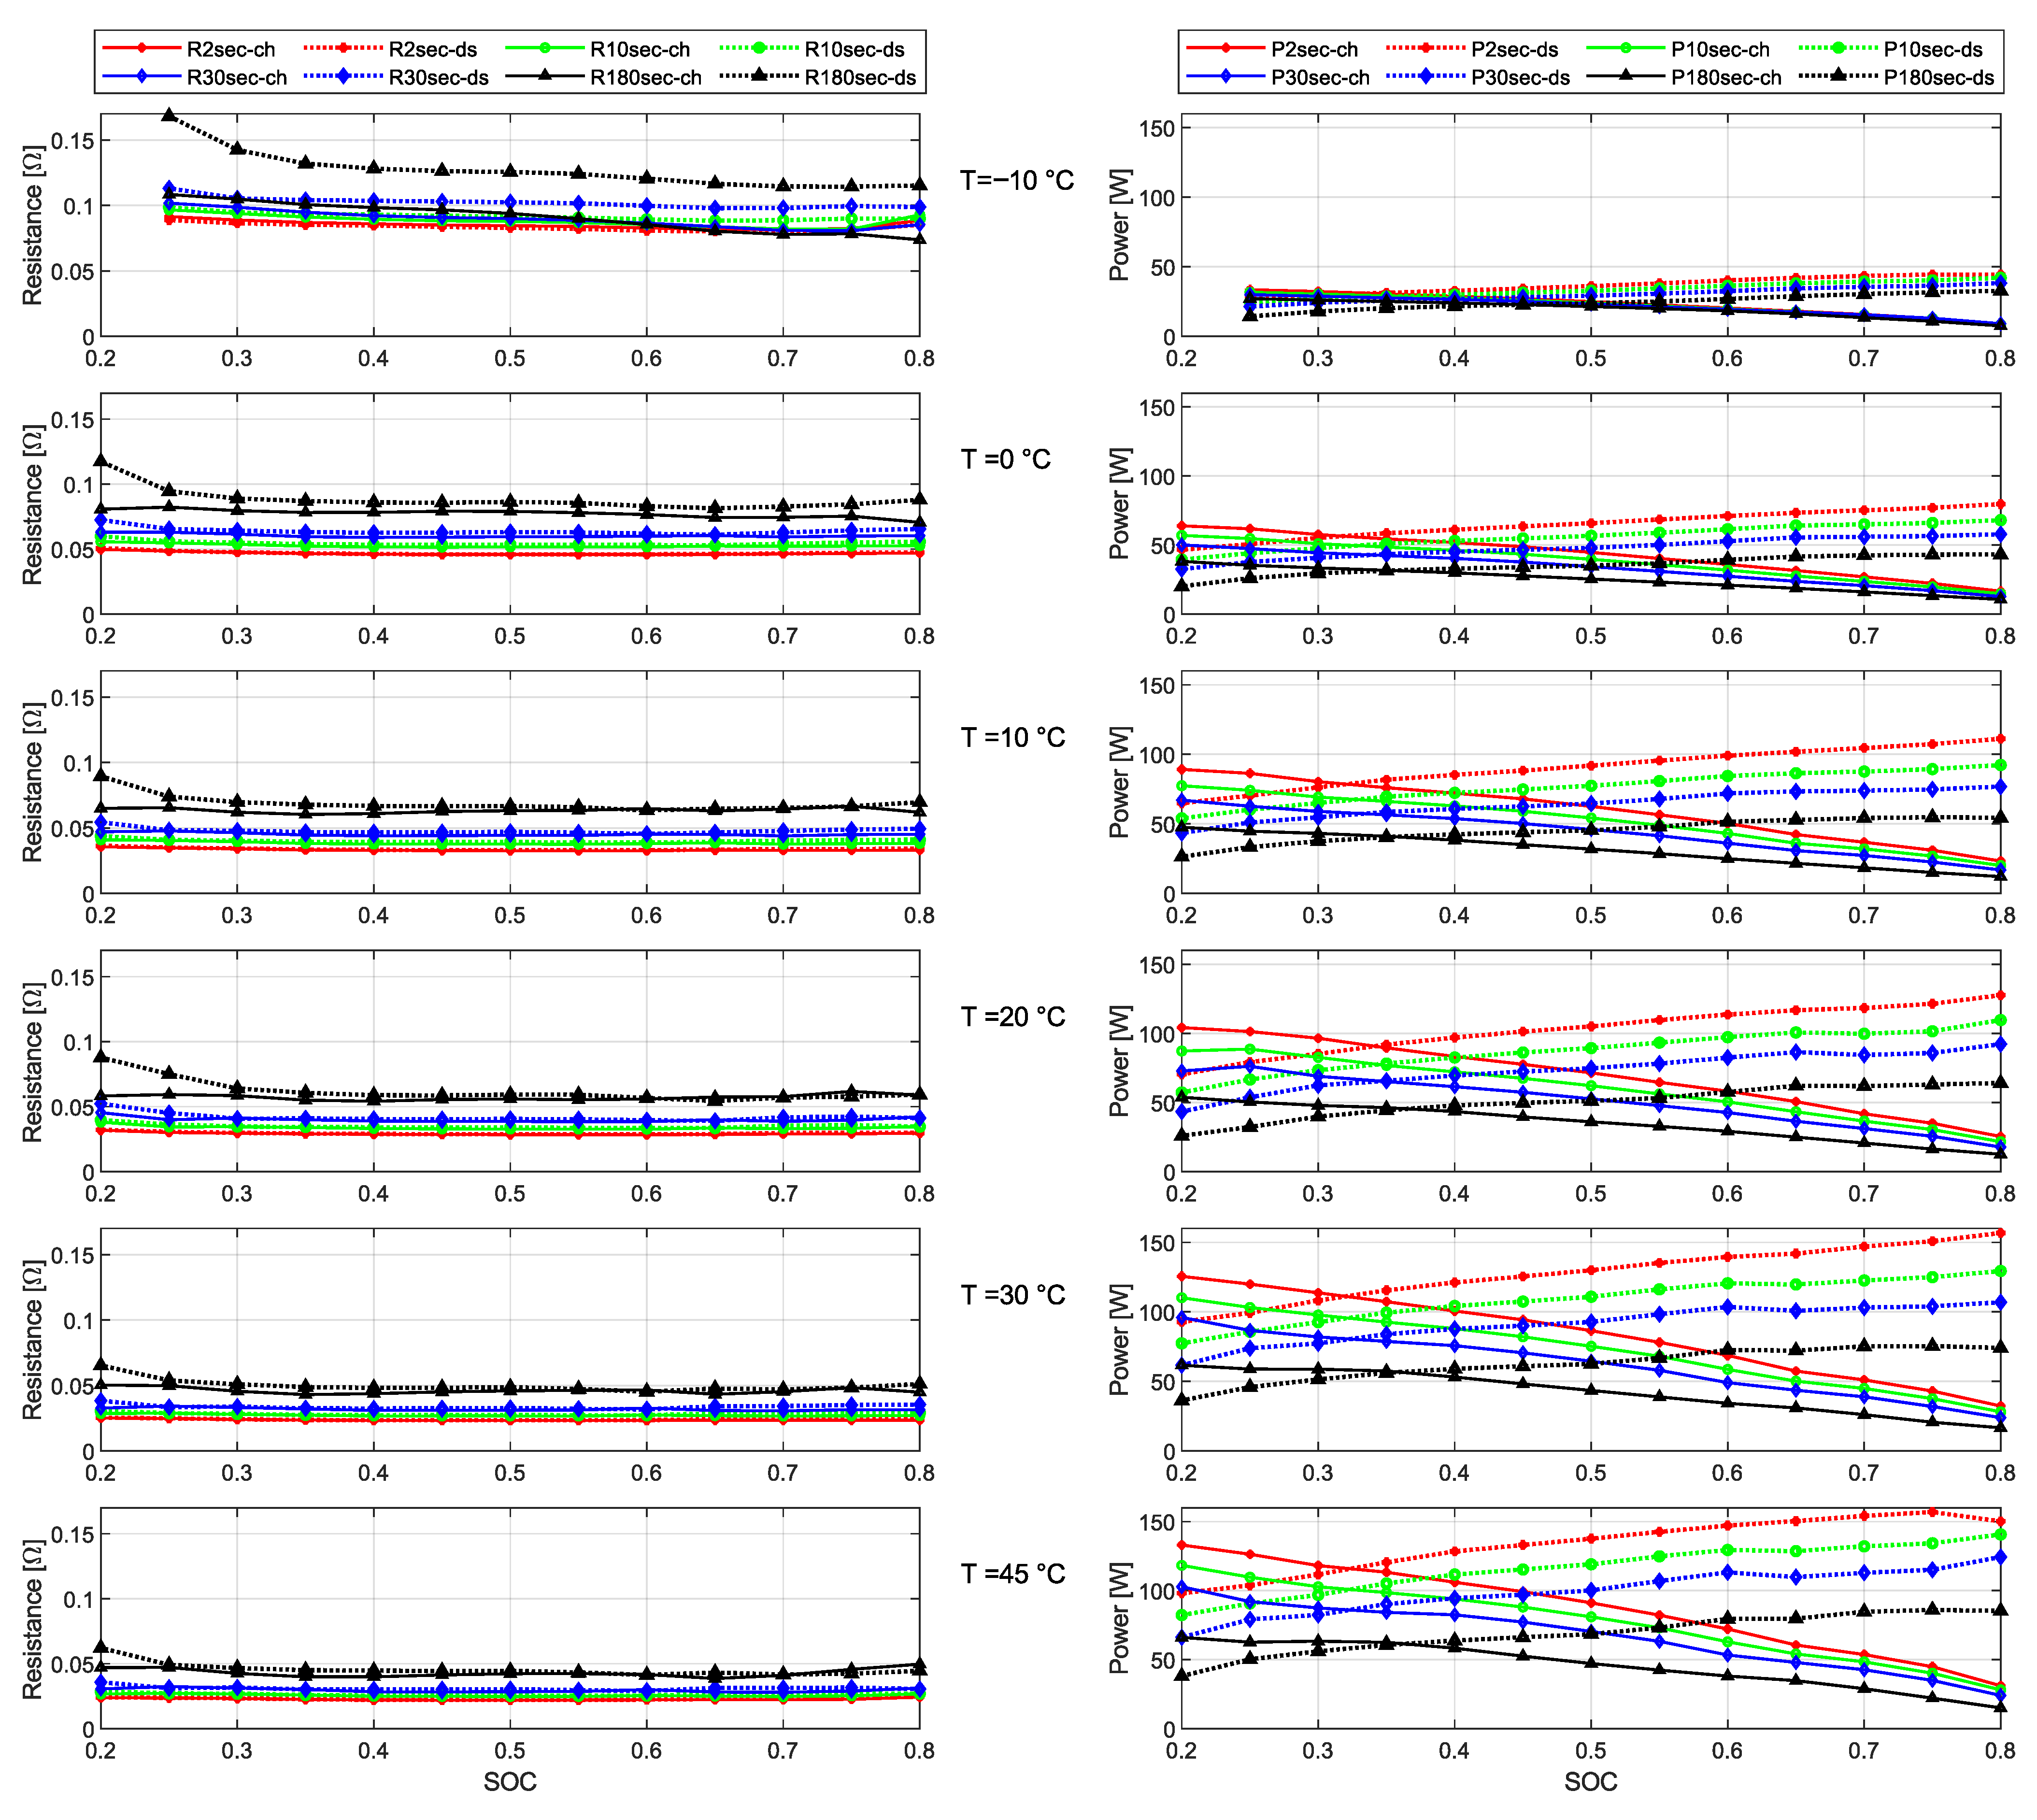
Figure 8 illustrates the DCIR values and the corresponding pulse power capabilities. The left side of the figure presents the internal resistances—both for discharge and charge/regen across different pulse durations (2 s, 10 s, 30 s, and 180 s) and test temperatures. The right side of the figure shows the resulting discharge and charge/regen power capabilities under the same test conditions. Due to premature voltage cutoff, the test at 10 ° C terminates before reaching 20% SOC; therefore, data for lower SOCs at this temperature are unavailable.
Several key trends are evident from the resistance results:
  • The internal resistance increases significantly as SOC drops below 30%, and this effect is even more pronounced at sub-zero temperatures. This can be attributed to reduced lithium-ion mobility within the electrolyte [28], slower electrochemical reaction kinetics [29], and increased resistance at the solid-electrolyte interface.
  • The DCIR increases with pulse duration for both discharge and regeneration phases, following the trend:  R 2 s < R 10 s < R 30 s < R 180 s . The OCV is a nonlinear function of SOC, and longer discharge pulses result in a greater SOC reduction, lowering the OCV baseline. This leads to a larger terminal voltage drop ( Δ V ) , and consequently, higher DCIR values. It is worth noting that although the ohmic resistance ( R 0 ) may decrease slightly during longer pulses due to self-heating, the DCIR is computed from the terminal voltage difference and applied current, and therefore reflects both resistive and dynamic effects.
  • Discharge resistance values are generally higher than regeneration (charge) resistance values. This behavior is attributed to intrinsic asymmetries in electrochemical kinetics and internal polarization. During discharge, lithium deintercalation from the anode is more kinetically constrained, particularly at low temperatures, resulting in greater activation and concentration polarization and, consequently, larger voltage drops under load. In contrast, during regeneration, the lithium intercalation process exhibits lower kinetic limitations, leading to comparatively lower observed resistance [30,31].
  • The difference between charge and discharge resistance is prominent for longer pulses. The increase in resistance observed during the 180 s pulse at 10 ° C is primarily attributed to the cumulative effects of sustained high current under low-temperature conditions. At sub-zero temperatures, both ionic conductivity and charge-transfer kinetics are significantly diminished, leading to the formation of a lithium-ion concentration gradient and elevated overpotential during prolonged discharge, thereby increasing the measured resistance [32].
Primary observations on power capabilities are briefly stated as follows:
  • Discharge power capability consistently decreases with decreasing SOC. At lower SOC levels, the voltage headroom and the effective power output decrease, while the internal resistance increases, resulting in reduced discharge performance.
  • Regeneration (charging) power capability increases as SOC decreases. This is attributed to the greater voltage margin between the cell’s open-circuit voltage and the upper voltage limit, particularly at low SOCs.
  • Pulse duration significantly affects power capabilities. Shorter pulses (e.g., 2 s and 10 s) result in higher power capabilities due to minimized voltage drop and thermal buildup. In contrast, longer pulses (30 s and 180 s) show reduced power handling, especially under extreme SOC or temperature conditions. This stems directly from Equations (12) and (13) as the power capability is inversely related to the pulse resistance. Under low or high SOC and extreme temperatures, the internal resistance of the cell tends to increase, leading to a reduction in power capability under these conditions.
  • Temperature is a dominant influencing factor. Across all pulse durations and SOC levels, both discharge and regeneration capabilities are notably higher at elevated temperatures ( 30 ° C and 45 ° C ). Sub-zero temperatures ( 10 ° C ) lead to severe performance degradation—regeneration power capability, in particular, is significantly reduced due to increased polarization and impedance.
An alternative representation of the power capability results is provided in Figure 9, commonly referred to as a fish chart. These plots illustrate discharge and regeneration power capabilities (charging) across the full state-of-charge (SOC) range and test temperatures. To complete the curves at the boundaries, zero values are assigned at temperatures outside the tested range. In the plot, the upper region with solid lines (positive power values) corresponds to discharge power capability, while the lower region with dashed lines (negative power values) represents regeneration capability. Each curve represents a specific SOC level; higher SOC curves appear higher in the chart, while lower SOC curves appear lower for both the charging and discharging cases. The fish chart illustrates the expected trend of increasing power capability with shorter pulse durations. The reduced power handling capabilities at longer pulse durations (30 s and 180 s) under extreme SOC or temperature conditions are primarily attributed to higher DCIR values associated with longer pulses and extreme temperature conditions. As described in Equations (12) and (13), the power capability is inversely related to internal resistance. Under low or high SOC and sub-zero temperatures, the internal resistance of the cell tends to increase, leading to a reduction in power capability under these conditions. A minor deviation is observed at 2 s and 80% SOC, where the maximum charging power appears at 30 ° C rather than 45 ° C. This is likely due to a measurement artifact rather than a physical limitation and does not affect the overall interpretation of the trend. This fish shape is more pronounced for shorter pulses and higher SOCs, highlighting the nonlinear interaction between temperature, SOC, and internal electrochemical dynamics.

5. Parameter Extraction from HPPC Data

The voltage responses obtained from the HPPC tests conducted at various temperatures serve as the basis for extracting the electrical parameters of a second-order ECM, as illustrated in Figure 1. This model captures the immediate and transient voltage behavior observed during current pulses. To extract model parameters effectively, five key points are identified for each pulse event: (a) The onset of the current pulse. (b) One sample immediately following the onset. (c) The end of the current pulse. (d) One sample immediately after the end.  (e) The onset of the next pulse.
These time points are illustrated in Figure 10, which shows the voltage profile during a 1 C current pulse at 30 ° C . In this figure, different colored markers represent various pulse types: green for discharge pulses, blue for charge pulses, red for SOC sweep pulses (corresponding to 5% capacity removal), and magenta for OCV points.
The ohmic resistance R 0 is calculated as the instantaneous voltage drop between the samples taken immediately before and after the current pulse initiation. This drop primarily reflects the cell’s internal contact resistance and ionic conductivity. The remaining transient voltage behavior during the pulse is modeled as the sum of two exponential decay components, corresponding to the voltage responses of the two RC branches. The modeling assumes that these branches collectively capture fast (interfacial) and slow (diffusive) dynamic responses. To evaluate the remaining parameters ( R 1 , R 2 , C 1 and C 2 ), a fitting function based on the residual of Equation (6) is used. Equation (14) shows the formulation of the optimization problem. MATLAB 2024a’s fminsearch function was used to solve this optimization problem for the parameters.
min R 1 , R 2 , C 1 , C 2 k = 1 N V t , k V o c v ( S O C k ) V 1 , k V 2 , k + i k R 0 2
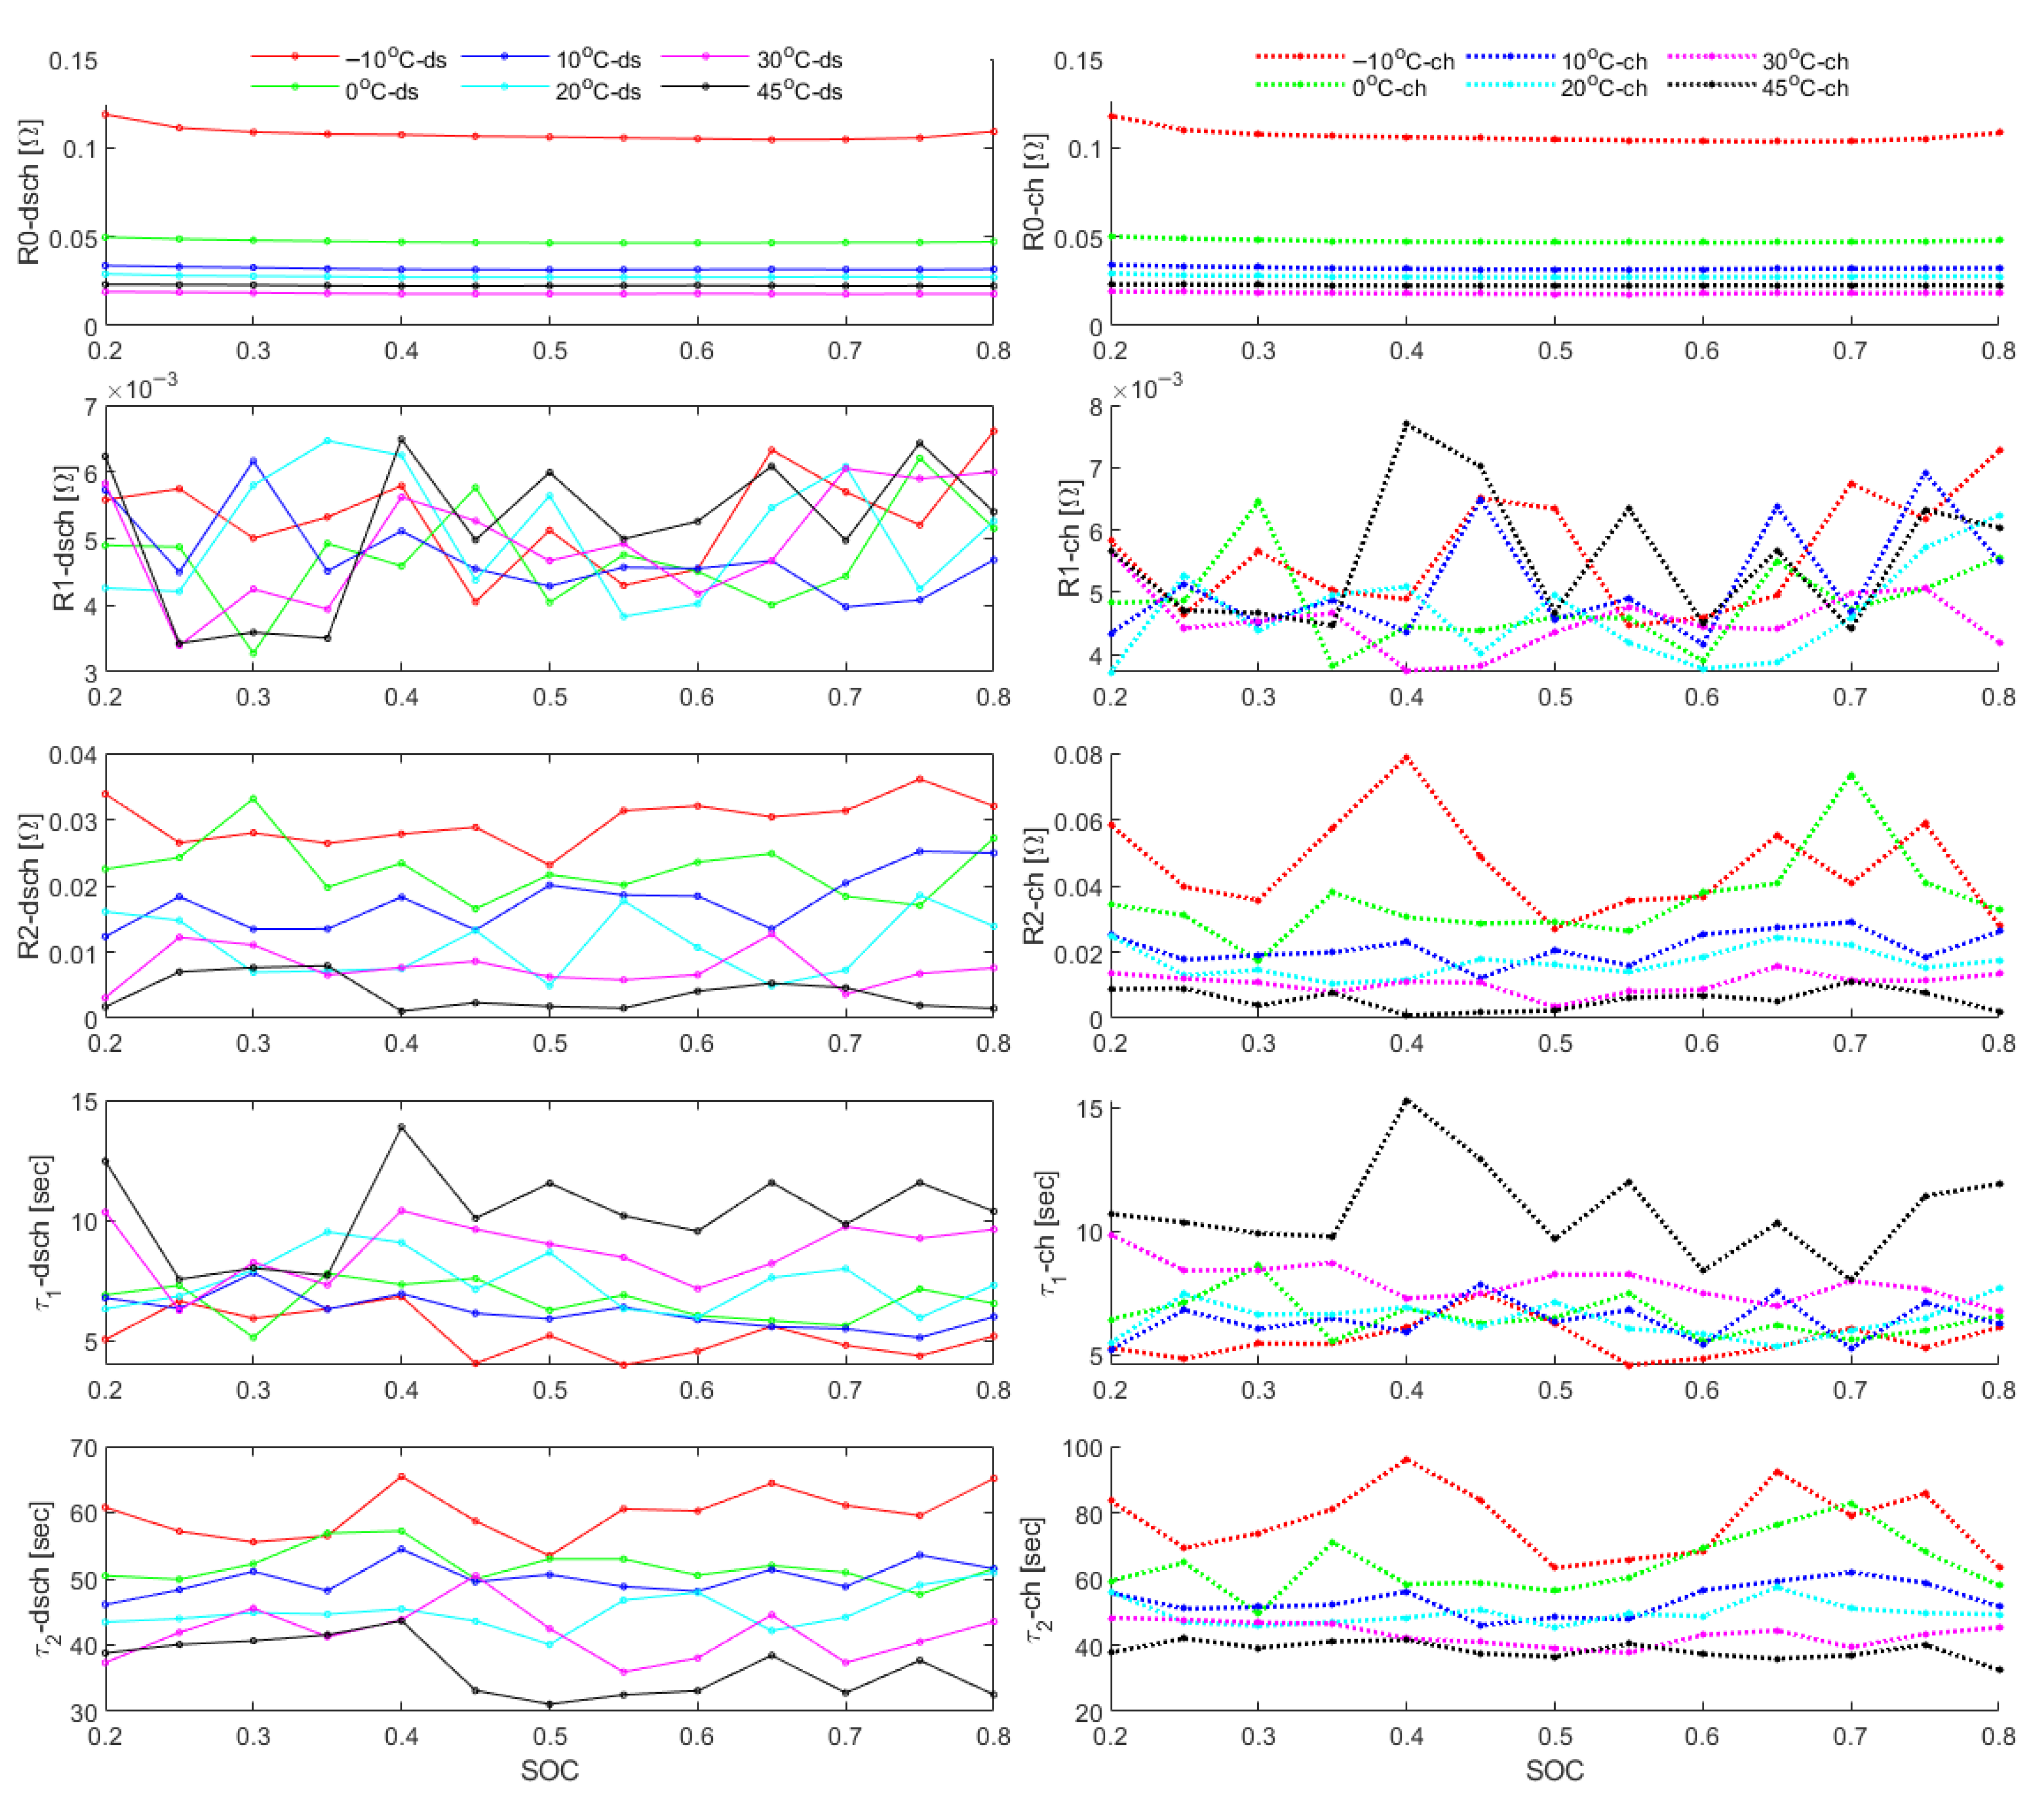
Figure 11 presents the results of curve fitting, where the model output is superimposed on the experimental voltage data. The extracted electrical model parameters are summarized in Figure 12. Each parameter value is averaged over four current pulse durations—2 s, 10 s, 30 s, and 180 s—evaluated at every SOC level and test temperature. The left panel in the figure shows the parameters corresponding to discharge pulses, while the right panel shows those corresponding to charge pulses. Note that the y-axes in Figure 12 are not to scale and are intended to facilitate visual comparison of trends rather than absolute values.
The ohmic resistance, R 0 , remains nearly constant across the mid-SOC range but increases noticeably at both high and low SOC extremes. This increase is attributed to limitations in lithium-ion transport and electrode wetting at those SOC limits. Additionally, R 0 increases significantly at lower temperatures, consistent with the known effects of decreased ionic mobility and increased electrolyte viscosity under cold conditions [29,33].
The behavior of the parameter R 1 , which is associated with charge transfer resistance at the electrode-electrolyte interface, is more complex. Unlike R 0 , R 1 does not show a clear trend with respect to SOC or temperature. This variability can be attributed to the nonlinear and competing effects of electrochemical kinetics, surface film formation, and electrolyte interactions, which are all highly sensitive to temperature and SOC conditions [34,35].
On the other hand, R 2 , which captures slower diffusion-limited processes in the solid phase (e.g., lithium diffusion within electrode particles), displays a strong and consistent dependence on temperature. Specifically, R 2 increases substantially at lower temperatures, reflecting the hindered diffusion of lithium ions in the solid phase and decreased chemical diffusion coefficients [33,36].
The time constants τ 1 = R 1 C 1 and τ 2 = R 2 C 2 derived from each RC branch further highlight distinct temperature dependencies: For the first RC branch, the time constant τ 1 tends to be longer at higher temperatures. This can be explained by the increase in double-layer capacitance and enhanced charge transfer processes, which dominate at elevated temperatures. In contrast, the second time constant, τ 2 , increases markedly as temperature decreases. This trend reflects slower solid-state diffusion dynamics and increased polarization effects under cold conditions [29,35].
The performance of the curve-fitting routine across different temperatures is quantified using three error metrics: Mean Absolute Error (MAE), Root Mean Square Error (RMSE), and Mean Absolute Percentage Error (MAPE). These values are reported in Table 2. As expected, the fitting accuracy improves with increasing temperature, reflecting reduced nonlinear behavior and better signal-to-noise ratios in the voltage responses at higher temperatures.

6. Conclusions

This study provides a comprehensive characterization of lithium-ion battery performance through static capacity and HPPC tests across a wide temperature and SOC range. The static capacity tests revealed an apparent reduction in usable capacity and energy at low temperatures and high discharge rates, with significant voltage drops and increased internal resistance notably impacting performance at 10 ° C. Temperature rise during discharge was minimal at low rates but became pronounced at higher C-rates, especially under cold ambient conditions, highlighting thermal management challenges in real-world applications.
HPPC testing enabled the extraction of critical parameters such as OCV, internal resistances, and pulse power capabilities under both discharge and regeneration modes. Key trends include:
  • Internal resistance increases sharply at low SOC and sub-zero temperatures due to hindered ion transport and electrochemical kinetics.
  • Discharge resistance consistently exceeds regeneration resistance, reflecting the asymmetric nature of charge and discharge processes.
  • Longer pulse durations cause higher resistances due to increased polarization and thermal effects.
  • Discharge power capability decreases with SOC, while regeneration power capability conversely increases, influenced by voltage margin constraints.
  • Elevated temperatures (to a specific limit) significantly enhance power capabilities, whereas cold conditions degrade performance by over two-thirds.
Parameter extraction from HPPC voltage responses allowed for robust fitting of a second-order RC equivalent circuit model, capturing immediate ohmic and transient electrochemical behaviors. The ohmic resistance ( R 0 ) showed strong temperature and SOC dependence, rising sharply at extreme SOC and low temperatures. Charge transfer resistance ( R 1 ) exhibited complex, non-monotonic variations, while diffusion-related resistance ( R 2 ) increased notably with decreasing temperature, reflecting slower lithium diffusion in the electrodes. The corresponding time constants further elucidated temperature-dependent dynamic responses.
These findings underscore the critical influence of temperature and SOC on lithium-ion battery behavior, providing essential insights for designing BMS in electric vehicles and stationary energy storage systems. As a future plan, the derived parametric data and validated equivalent circuit model will be integrated into a real-time BMS framework to enable predictive control of power and thermal performance under dynamic operating profiles. Additionally, further studies will focus on expanding the characterization to aged cells and high-power cycling conditions to refine the model’s applicability for lifetime prediction and second-life applications in stationary storage systems.

Author Contributions

Conceptualization, S.P. and J.Z.; methodology, S.P. and J.Z.; software, S.P.; validation, S.P. and J.Z.; resources, J.Z. and B.A.; writing—original draft preparation, S.P.; writing—review and editing, S.P., J.Z., B.A. and R.S.; visualization, S.P.; supervision, J.Z. and B.A.; funding acquisition, J.Z., R.S. and B.A. All authors have read and agreed to the published version of the manuscript.

Funding

This research received no external funding.

Data Availability Statement

Data used in this article will be made available by the authors on reasonable request.

Conflicts of Interest

The authors declare no conflicts of interest.

Abbreviations

List of symbols and abbreviations:
SymbolDescriptionSymbolDescription
S O C State of charge (dimensionless, 0–1) R dsch Discharge resistance ( Ω )
QCell capacity (Ah) R regen Regeneration resistance ( Ω )
i ( t ) , i k Applied current (A) R 2 s , R 10 s DCIR at respective pulses ( Ω )
V t ( t ) , V t , k Terminal voltage (V) R 30 s , R 180 s DCIR at respective pulses ( Ω )
V o c v , O C V Open-circuit voltage (V) T c ( t ) Core temperature (°C or K)
V 1 ( t ) , V 1 , k Voltage across first RC pair (V) T s ( t ) Surface temperature (°C or K)
V 2 ( t ) , V 2 , k Voltage across second RC pair (V) T a i r ( t ) Ambient air temperature (°C or K)
R 0 Ohmic resistance ( Ω ) T m Average cell temperature (°C or K)
R 1 , R 2 Resistances of RC pairs ( Ω ) C c , C s Thermal capacitances (J/K)
C 1 , C 2 Capacitances of RC pairs (F) R c , R u Thermal resistances (K/W)
τ 1 , τ 2 RC time constants (s) Δ V dsch Voltage drop during discharge pulse (V)
T s Sampling time (s) Δ V ch Voltage rise during charge pulse (V)
Q ˙ ( t ) Heat generation rate (W) Δ I dsch Current during discharge pulse (A)
C-rateNormalized charge/discharge rate Δ I ch Current during charge pulse (A)
V min pulse Minimum voltage in a discharge pulse (V) V max pulse Maximum voltage in a charge pulse (V)
P dsch Discharge pulse power capability (W) P ch Charge pulse power capability (W)
BMSBattery management systemLIBLithium ion batteries
H/BEVHybrid/Battery electric vehicleECMEquivalent circuit model
ECUElectronic control unitEKFExtended Kalman filter
NCANickel Cobalt AluminumHPPCHybrid Power Pulse Characterization
CC-CVConstant current - Constant voltageDCIRDirect current internal resistance

Appendix A

Figure A1. High current HPPC test results (1 C).
Batteries 11 00313 g0a1
Figure A2. Low current HPPC test result (0.2 C).
Batteries 11 00313 g0a2

References

  1. Chen, J. Recent Progress in Advanced Materials for Lithium Ion Batteries. Materials 2013, 6, 156–183. [Google Scholar] [CrossRef]
  2. Mallarapu, A.; Çaldichoury, I.; L’Eplattenier, P.; Sunderlin, N.; Santhanagopalan, S. Coupled Multiphysics Modeling of Lithium-Ion Batteries for Automotive Crashworthiness Applications. J. Electrochem. Energy Convers. Storage 2024, 22, 031003. [Google Scholar] [CrossRef]
  3. Chung, S.H.; Manthiram, A. Lithium–Sulfur Batteries with the Lowest Self-Discharge and the Longest Shelf Life. ACS Energy Lett. 2017, 2, 1056–1061. [Google Scholar] [CrossRef]
  4. Zhang, J.; Zhang, L.; Sun, F.; Wang, Z. An Overview on Thermal Safety Issues of Lithium-ion Batteries for Electric Vehicle Application. IEEE Access 2018, 6, 23848–23863. [Google Scholar] [CrossRef]
  5. Paudel, S.; De Boever, Q.; Zhang, J.; Ayalew, B.; Pisu, P.; Castanier, M. Design optimization of mobile vehicle-borne microgrids. Sustain. Energy Grids Netw. 2024, 39, 101480. [Google Scholar] [CrossRef]
  6. He, H.; Xiong, R.; Fan, J. Evaluation of Lithium-Ion Battery Equivalent Circuit Models for State of Charge Estimation by an Experimental Approach. Energies 2011, 4, 582–598. [Google Scholar] [CrossRef]
  7. Di Domenico, D.; Stefanopoulou, A.; Fiengo, G. Lithium-Ion Battery State of Charge and Critical Surface Charge Estimation Using an Electrochemical Model-Based Extended Kalman Filter. J. Dyn. Syst. Meas. Control 2010, 132, 061302. [Google Scholar] [CrossRef]
  8. Forman, J.C.; Moura, S.J.; Stein, J.L.; Fathy, H.K. Genetic identification and fisher identifiability analysis of the Doyle–Fuller–Newman model from experimental cycling of a LiFePO4 cell. J. Power Sources 2012, 210, 263–275. [Google Scholar] [CrossRef]
  9. He, H.; Xiong, R.; Guo, H. Online estimation of model parameters and state-of-charge of LiFePO4 batteries in electric vehicles. Appl. Energy 2012, 89, 413–420. [Google Scholar] [CrossRef]
  10. Paudel, S.; Zhang, J.; Ayalew, B.; Castanier, M.; Skowronska, A. A Model Predictive Control-Based Operation of Vehicle-Borne Microgrid Considering Battery Degradation. In Proceedings of the Ground Vehicle Systems Engineering and Technology Symposium (GVSETS), NDIA, Novi, MI, USA, 15–17 August 2023. [Google Scholar]
  11. Moura, S.J. Techniques for Battery Health Conscious Power Management via Electrochemical Modeling and Optimal Control. Ph.D. Thesis, University of Michigan, Ann Arbor, MI, USA, 2011. [Google Scholar]
  12. Xu, L.; Lin, X.; Xie, Y.; Hu, X. Enabling high-fidelity electrochemical P2D modeling of lithium-ion batteries via fast and non-destructive parameter identification. Energy Storage Mater. 2022, 45, 952–968. [Google Scholar] [CrossRef]
  13. Biju, N.; Fang, H. On the Design of An Equivalent Circuit Model for Lithium-Ion Batteries Operating Across Broad Current Ranges. IFAC-PapersOnLine 2023, 56, 7127–7133. [Google Scholar] [CrossRef]
  14. Paudel, S.; Zhang, J.; Ayalew, B.; Skowronska, A. Charging Load Estimation for a Fleet of Autonomous Vehicles. In Proceedings of the WCX SAE World Congress Experience, Detroit, MI, USA, 16–18 April 2024. [Google Scholar] [CrossRef]
  15. Zhang, L.; Peng, H.; Ning, Z.; Mu, Z.; Sun, C. Comparative Research on RC Equivalent Circuit Models for Lithium-Ion Batteries of Electric Vehicles. Appl. Sci. 2017, 7, 1002. [Google Scholar] [CrossRef]
  16. Ding, X.; Zhang, D.; Cheng, J.; Wang, B.; Luk, P.C. An improved Thevenin model of lithium-ion battery with high accuracy for electric vehicles. Appl. Energy 2019, 254, 113615. [Google Scholar] [CrossRef]
  17. Nejad, S.; Gladwin, D.T.; Stone, D.A. A systematic review of lumped-parameter equivalent circuit models for real-time estimation of lithium-ion battery states. J. Power Sources 2016, 316, 183–196. [Google Scholar] [CrossRef]
  18. Cheng, Y.S. Identification of parameters for equivalent circuit model of Li-ion battery cell with population based optimization algorithms. Ain Shams Eng. J. 2024, 15, 102481. [Google Scholar] [CrossRef]
  19. Mishra, D.; Paudel, S.; Zhang, J.; Lawler, B.; Castanier, M.P. Experimental Investigation and Performance Analysis of 21700 Lithium-Ion Batteries for Electric Vehicle Applications. IEEE Trans. Consum. Electron. 2025. submitted. [Google Scholar]
  20. Lin, X.; Perez, H.E.; Mohan, S.; Siegel, J.B.; Stefanopoulou, A.G.; Ding, Y.; Castanier, M.P. A lumped-parameter electro-thermal model for cylindrical batteries. J. Power Sources 2014, 257, 1–11. [Google Scholar] [CrossRef]
  21. Smith, K.A.; Rahn, C.D.; Wang, C.Y. Model-Based Electrochemical Estimation and Constraint Management for Pulse Operation of Lithium Ion Batteries. IEEE Trans. Control Syst. Technol. 2010, 18, 654–663. [Google Scholar] [CrossRef]
  22. Plett, G.L. Extended Kalman filtering for battery management systems of LiPB-based HEV battery packs: Part 2. Modeling and identification. J. Power Sources 2004, 134, 262–276. [Google Scholar] [CrossRef]
  23. Dey, S.; Biron, Z.A.; Tatipamula, S.; Das, N.; Mohon, S.; Ayalew, B.; Pisu, P. On-board Thermal Fault Diagnosis of Lithium-ion Batteries For Hybrid Electric Vehicle Application. IFAC-PapersOnLine 2015, 48, 389–394. [Google Scholar] [CrossRef]
  24. Tu, H.; Lin, X.; Wang, Y.; Fang, H. System Identification for Lithium-Ion Batteries with Nonlinear Coupled Electro-Thermal Dynamics via Bayesian Optimization. In Proceedings of the 2024 American Control Conference (ACC), Toronto, ON, Canada, 10–12 July 2024; pp. 1946–1951. [Google Scholar] [CrossRef]
  25. Plett, G.L. A Linear Method to Fit Equivalent Circuit Model Parameter Values to HPPC Relaxation Data From Lithium-Ion Cells. ASME Lett. Dyn. Syst. Control 2025, 5, 011003. [Google Scholar] [CrossRef]
  26. U.S. Department of Energy. Battery Test Manual for Electric Vehicles: Revision 3.1; Technical Report; Idaho National Laboratory: Idaho Falls, ID, USA, 2020.
  27. Białoń, T.; Niestrój, R.; Skarka, W.; Korski, W. HPPC Test Methodology Using LFP Battery Cell Identification Tests as an Example. Energies 2023, 16, 6239. [Google Scholar] [CrossRef]
  28. Xu, K. Nonaqueous Liquid Electrolytes for Lithium-Based Rechargeable Batteries. Chem. Rev. 2004, 104, 4303–4418. [Google Scholar] [CrossRef]
  29. Zhang, S.S. The effect of the charging protocol on the cycle life of a Li-ion battery. J. Power Sources 2006, 163, 1126–1132. [Google Scholar] [CrossRef]
  30. Ernst, S.; Heins, T.P.; Schlüter, N.; Schröder, U. Capturing the Current-Overpotential Nonlinearity of Lithium-Ion Batteries by Nonlinear Electrochemical Impedance Spectroscopy (NLEIS) in Charge and Discharge Direction. Front. Energy Res. 2019, 7, 151. [Google Scholar] [CrossRef]
  31. Mao, Z.; Farkhondeh, M.; Pritzker, M.; Fowler, M.; Chen, Z. Charge/Discharge Asymmetry in Blended Lithium-Ion Electrodes. J. Electrochem. Soc. 2017, 164, A39. [Google Scholar] [CrossRef]
  32. Jossen, A. Fundamentals of battery dynamics. J. Power Sources 2006, 154, 530–538. [Google Scholar] [CrossRef]
  33. Safari, M.; Delacourt, C. Modeling of a Commercial Graphite/LiFePO4 Cell. J. Electrochem. Soc. 2011, 158, A562. [Google Scholar] [CrossRef]
  34. Barai, A.; Uddin, K.; Widanage, W.D.; McGordon, A.; Jennings, P. A study of the influence of measurement timescale on internal resistance characterisation methodologies for lithium-ion cells. Sci. Rep. 2018, 8, 21. [Google Scholar] [CrossRef]
  35. Hu, X.; Li, S.; Peng, H. A comparative study of equivalent circuit models for Li-ion batteries. J. Power Sources 2012, 198, 359–367. [Google Scholar] [CrossRef]
  36. Amini, A.; Özdemir, T.; Ekici, Ö.; Başlamışlı, S.Ç.; Köksal, M. A thermal model for Li-ion batteries operating under dynamic conditions. Appl. Therm. Eng. 2020, 180, 116338. [Google Scholar] [CrossRef]
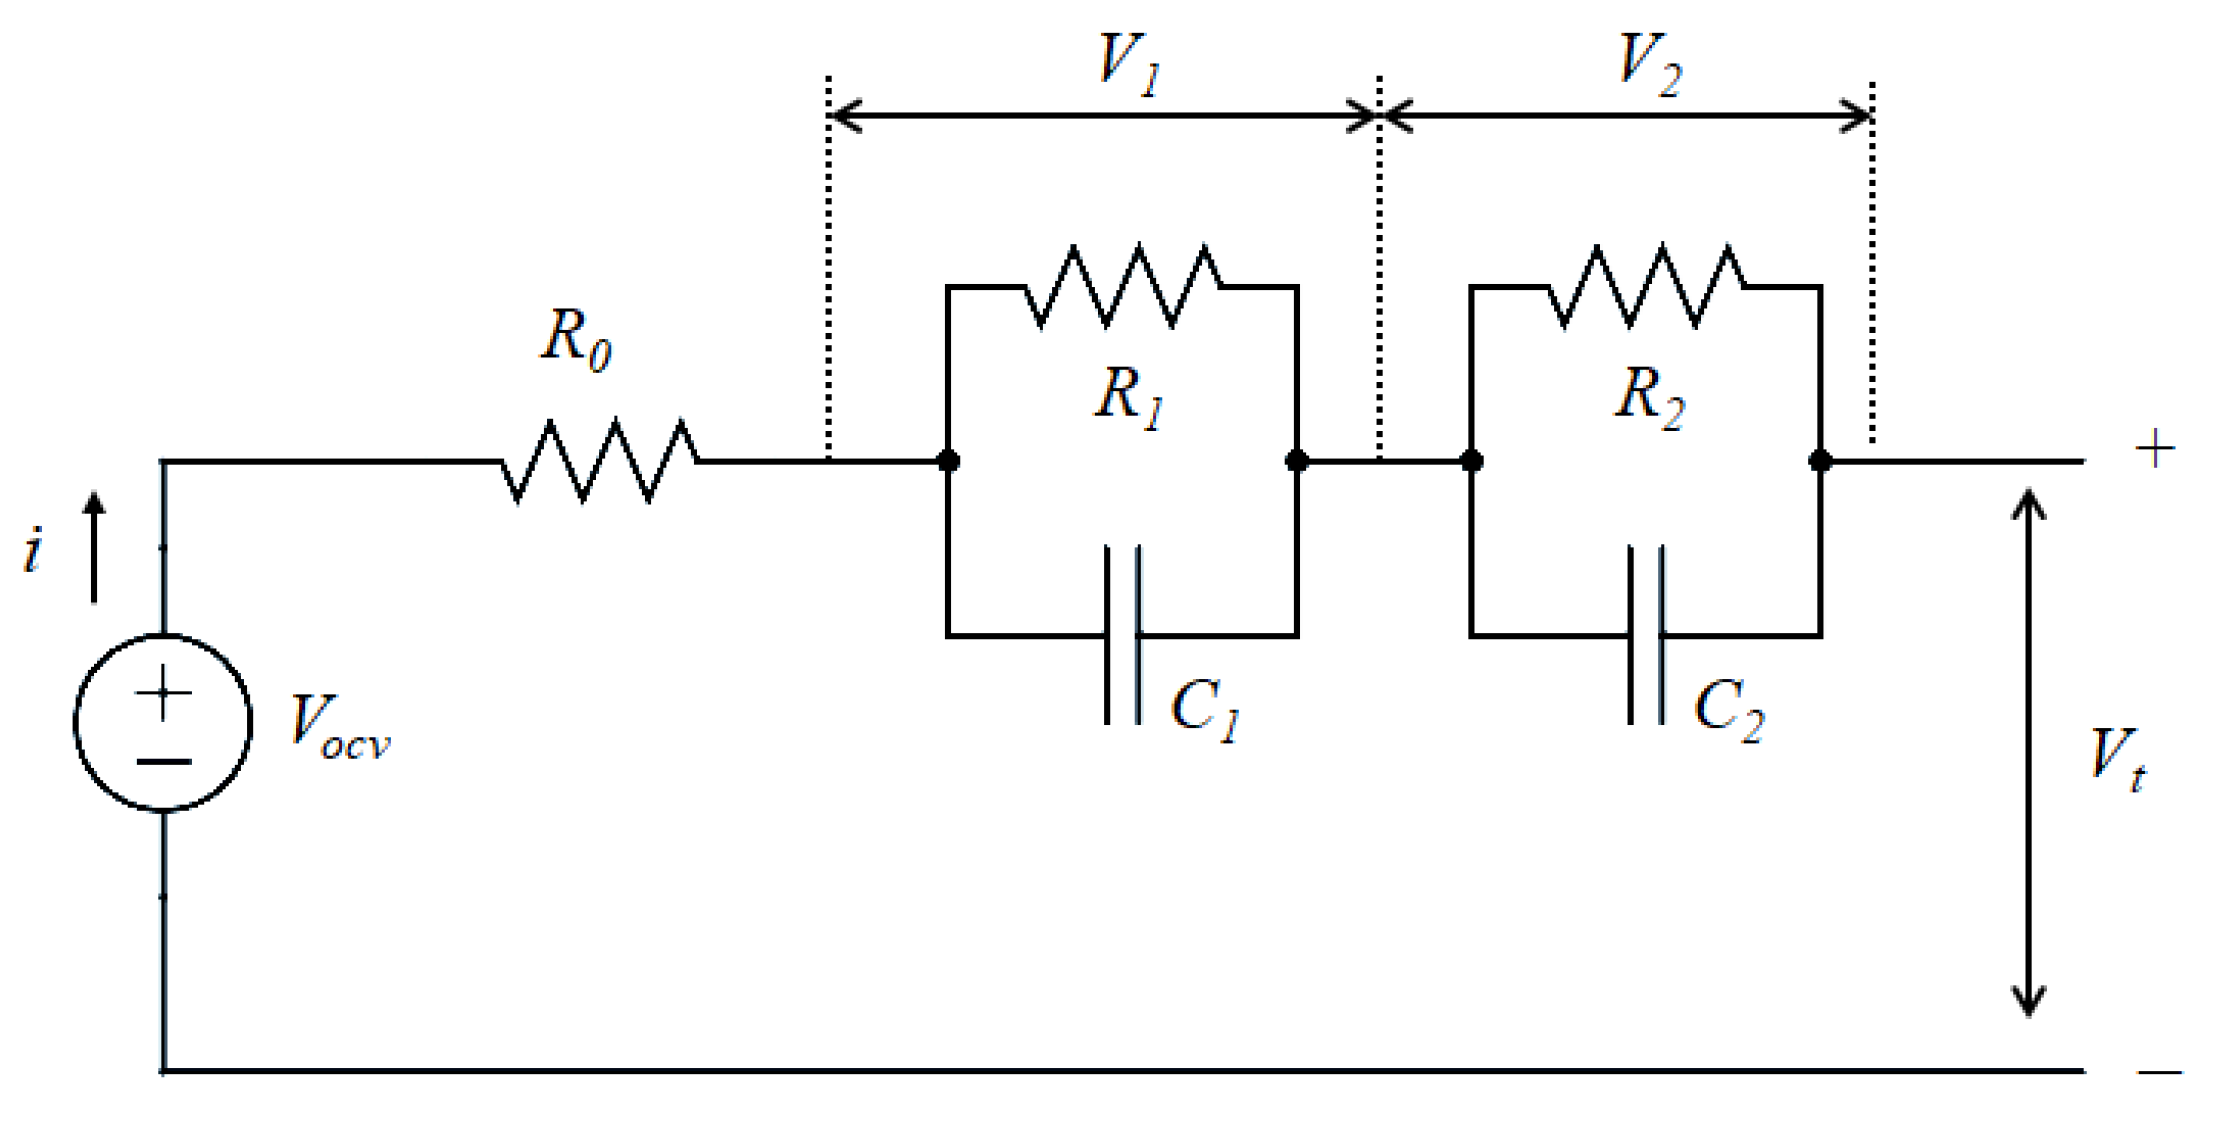
Figure 1. Second-order equivalent circuit model.
Batteries 11 00313 g001
Figure 3. Test setup.
Batteries 11 00313 g003
Figure 4. (a) CC-CV charging profile used for cell preparation for test, (b) HPPC current pulse profile (1C pulses with 2 s, 10 s, 30 s, and 180 s pulse duration (top) and voltage response, and (c) typical Δ V curve used for estimating DCIR for each pulse duration and SOC.
Batteries 11 00313 g004
Figure 5. Results of the static capacity test: (a) voltage vs capacity, (b) temperature rise over ambient, and (c) extracted capacity and energy.
Batteries 11 00313 g005
Figure 6. HPPC profile at 30 ° C and 1 C.
Batteries 11 00313 g006
Figure 7. Open-circuit voltage versus state of charge across test temperatures.
Batteries 11 00313 g007
Figure 8. DCIR resistance (left) and discharge/charge power capability (right) for 2 s, 10 s, 30 s, and 180 s pulse durations at different test temperatures (for 0.2 C).
Batteries 11 00313 g008
Figure 9. Fish chart showing charge and discharge power capability at various SOC levels and pulse durations.
Batteries 11 00313 g009
Figure 10. Key points identified for parameter extraction from HPPC voltage response.
Batteries 11 00313 g010
Figure 11. Curve fitting results (model vs experimental) for 1 C test at 30 ° C .
Batteries 11 00313 g011
Figure 12. Extracted ECM parameters for discharge (left) and charge (right).
Batteries 11 00313 g012
Table 1. Samsung INR-21700-50G Cell Specification.
ParameterValue
Nominal Voltage3.6 V
Maximum Voltage4.2 V
Nominal Capacity4.9 Ah
Discharge Cut-off Voltage2.5 V
Continuous Discharge Rating9.8 A
Cell Weight69 g
Cell DimensionsHeight: Max. 70.80 mm
Diameter: Max. 21.25 mm
Table 2. Curve Fitting Error Metrics Across Test Cases.
Temp. ( ° C)1C0.2C
MAE
(V)
RMSE
(V)
MAPE
(%)
MAE
(V)
RMSE
(V)
MAPE
(%)
10 0.0320.0380.8760.0360.0441.003
00.0150.0180.3980.0200.0240.527
100.0110.0150.3060.0150.0190.412
200.0160.0200.4360.0180.0230.508
300.0080.0100.2150.0110.0130.284
450.0070.0090.1980.0090.0110.242
Disclaimer/Publisher’s Note: The statements, opinions and data contained in all publications are solely those of the individual author(s) and contributor(s) and not of MDPI and/or the editor(s). MDPI and/or the editor(s) disclaim responsibility for any injury to people or property resulting from any ideas, methods, instructions or products referred to in the content.