Article

Comparing the SEI Formation on Copper and Amorphous Carbon: A Study with Combined Operando Methods

by
Michael Stich
1,*,
Christian Leppin
2,3,
Falk Thorsten Krauss
4,
Jesus Eduardo Valdes Landa
1,
Isabel Pantenburg
4,
Bernhard Roling
4 and
Andreas Bund
1
1
Electrochemistry and Electroplating Group, Technische Universität Ilmenau, Gustav-Kirchhoff-Straße 6, 98693 Ilmenau, Germany
2
Junior Research Group Shape-Dependent Electrochemistry, Chair of Analytical Chemistry II, Ruhr University Bochum, Universitätsstraße 150, 44801 Bochum, Germany
3
Department of Chemistry, Paderborn University, Warburger Straße 100, 33098 Paderborn, Germany
4
Department of Chemistry, Philipps-Universität Marburg, Hans-Meerwein-Straße 4, 35032 Marburg, Germany
*
Author to whom correspondence should be addressed.
Batteries 2025, 11(7), 273; https://doi.org/10.3390/batteries11070273
Submission received: 19 June 2025 / Revised: 9 July 2025 / Accepted: 15 July 2025 / Published: 18 July 2025
(This article belongs to the Special Issue Electrocrystallization in Rechargeable Batteries)

Abstract

The solid electrolyte interphase (SEI) on the anode of lithium-ion batteries (LIBs) has been studied thoroughly due to its crucial importance to the battery’s long-term performance. At the same time, most studies of the SEI apply ex situ characterization methods, which may introduce artifacts or misinterpretations as they do not investigate the SEI in its unaltered state immersed in liquid battery electrolyte. Thus, in this work, we focus on using the non-destructive combination of electrochemical quartz crystal microbalance with dissipation monitoring (EQCM-D) and impedance spectroscopy (EIS) in the same electrochemical cell. EQCM-D can not only probe the solidified products of the SEI but also allows for the monitoring of viscoelastic layers and viscosity changes of the electrolyte at the interphase during the SEI formation. EIS complements those results by providing electrochemical properties of the formed interphase. Our results highlight substantial differences in the physical and electrochemical properties between the SEI formed on copper and on amorphous carbon and show how formation parameters and the additive vinylene carbonate (VC) influence their growth. The EQCM-D results show consistently that much thicker SEIs are formed on carbon substrates in comparison to copper substrates.

1. Introduction

During the initial cycling of a lithium-ion battery (LIB), the battery electrolyte, being operated outside its thermodynamic stability window, decomposes on the anode and builds up a layer, which has been termed the solid electrolyte interphase (SEI). Since its first detailed description in 1979 by Peled et al. [1], lots of research and industrial effort have been dedicated to optimizing this interphase, as it is one main contributor to battery ageing because its continued growth during battery operation leads to further consumption of lithium and an increase in cell resistance. Especially at low temperatures, limited lithium-ion diffusion through the SEI can also be one main cause of detrimental lithium plating on the carbon anode [2], while an important reason for the low initial current efficiency of silicon anodes is the lithium-consuming growth of the SEI requiring sophisticated prelithiation methods to counterbalance this initial lithium loss [3].
Despite its obvious importance, the investigation of the SEI is challenging because it is a fragile and thin layer, and its composition is easily influenced by the substrate, the electrolyte composition, formation conditions, additives, impurities, etc. The SEI formation on carbonaceous materials has been one main focus of research efforts and shows that even on the same material—graphite—different surface types (prismatic and basal plane surfaces) lead to vastly different SEI properties [2]. Despite graphite being the dominant anode material in LIBs, amorphous carbon is often employed as a coating for active anode and cathode materials of LIBs [4]. In those coated materials, amorphous carbon and not the underlying material is in direct contact with the electrolyte and determines the initial SEI formation. It has been reported that in comparison to the SEI formed on graphite, the SEI on amorphous carbon is thinner and leads to higher initial coulombic efficiencies [5]. Copper is the material of choice for most anode current collectors because it is stable in the anode’s potential range and does not lithiate [6,7]. As the active material layer is porous, Cu often comes into contact with the electrolyte, and an SEI forms during battery cycling. Thus, the SEI formation on Cu in LIBs has some inherent relevance, but more importantly, “anode-free” lithium-metal batteries (LMBs) rely heavily on a mechanically stable SEI that conducts ions well, which makes the investigation of the SEI formation on Cu worthwhile [8,9]. When lithium metal is growing inhomogeneously in LMBs, e.g., in the form of dendrites, fresh lithium is exposed to the electrolyte, which results in lithium and electrolyte loss due to continued formation of SEI and electrochemically inaccessible “dead” lithium. These phenomena currently limit the life cycle of LMBs and can ultimately only be improved by a tailored SEI that controls cycling performance by regulating lithium morphology and dead lithium formation [10]. In our work, the two materials, amorphous carbon and Cu, are both investigated and compared with regards to their SEI formation.
Often, characterization methods of SEI investigation are applied ex situ and are prone to artifacts and data misinterpretations if not carried out carefully. Also, some cannot be used in liquid and require the sample with the SEI to be rinsed and dried. The rinsing is usually carried out using a linear organocarbonate, which evaporates fast and without residues, but can partially wash off soluble or loosely attached parts of the SEI. Furthermore, there is the risk of an additional intake of impurities by the rinsing agent, which can further chemically alter the SEI. Edström et al. report that rinsing can wash away loosely bound LiF crystals and that trace amounts of HF can react with Li2CO3 and thus reduce its detected amount [11]. The subsequent drying step, usually performed at room temperature in an argon-filled glovebox, may further change the morphology of the SEI by solidifying previously gel-like parts of the SEI. Some characterization methods even require the SEI to be exposed to ambient air for a short time (e.g., when transferring the sample), which may lead to an increased presence of Li2CO3 [11]. These findings are in agreement with results of Schroder et al. [12], who reported higher amounts of fluoride- and oxygen-containing species in the SEI of crystalline silicon electrodes after exposing them to the ambient environment.
As it is difficult to avoid the above pitfalls, when using ex situ techniques, in situ or operando techniques are often preferable if available. Different operando techniques are suitable for SEI investigations and have been used, especially recently. Among those are EIS [13,14,15,16], atomic force microscopy [17,18,19], time-slicing neutron reflectometry [20,21], EQCM [22,23,24,25], near-ambient pressure XPS [26], acoustic techniques [27], and others. Here, we use a combination of EQCM-D (“D” stands for dissipation monitoring) and EIS to reveal how the SEI evolves during its initial formation on copper and amorphous carbon and how different formation protocols and the additive vinylene carbonate (VC) influence the growth on both substrates.

2. Materials and Methods

2.1. The Electrochemical Cell, Materials, and Equipment

The electrochemical cell was developed for the simultaneous use of EQCM-D and EIS and contains three electrodes. The working electrode (WE) is a coated quartz crystal which also functions as the sensor of the EQCM-D. The quartz crystal has a larger electrode on the front side in contact with the electrolyte and a smaller, electrochemically inactive one on the backside. Both electrodes are contacted via spring-loaded pins integrated into a lab-made PEEK cell body (Figure 1).
The quartz crystals are coated in one case with a copper layer and in the other case with an additional amorphous carbon layer on top of the copper layer. All layers were deposited by physical vapor deposition, and chromium interlayers were used to improve adhesion. The working electrode is connected to a signal decoupler, based on a balun transformer (details in [29]), which splits the received signals into a high-frequency branch connected to the EQCM-D and a mid-to-low-frequency branch (<1 MHz) connected to the potentiostat, used for the SEI formation procedure and EIS measurements. The signal decoupler allows for a precise measurement of EQCM-D and EIS data simultaneously (details in [28]). As counter electrode (CE), a ring of lithium metal (99.9% purity, Sigma-Aldrich, Burlington, MA, USA) was used, which is placed circularly around the working electrode. This lithium metal ring has a small opening for the introduction of a reference electrode (RE), which consists of a thin insulated copper wire from a wiring pencil with a lithium tip. The wire, the lithium ring, and the coated quartz crystal are in contact with 1 mL of the battery electrolyte 1 M LiPF6 in EC/EMC (1:1, v/v) (Sigma-Aldrich, Burlington, MA, USA), which fills the volume inside the electrochemical cell. The lithium tip of the RE is produced in situ directly before the measurement by plating Li from the CE on the copper wire’s uninsulated tip. After filling the cell, it is sealed with a gastight lid to prevent evaporation. Further details on the cell design, the effect of the signal decoupler, and the effect of the counter electrode placement can be found in [28].
The devices used for the experiments were the potentiostat SP-240 (Biologic, Seyssinet-Pariset, France) and a modified vectorial network analyzer for the EQCM-D analysis (NanoVNA, originally designed by edy555, https://github.com/edy555, accessed on 14 July 2025). The electrochemical cell was assembled and operated in an MB 200B Glovebox (MBraun, Garching, Germany) with O2 and H2O concentrations below 1 ppm.

2.2. The Formation Procedure and Experimental Details

After assembling and filling the electrochemical cell with electrolyte, the reference electrode was plated with lithium by applying −200 mV vs. the lithium CE until 5 µAh Li was deposited. The electrochemical cell was then left at open circuit potential (OCP) for 20 min, and consequently, the working electrode was cathodically polarized with a constant scan rate of either 1 mV/s (fast formation procedure) or 0.066 mV/s (slow formation procedure) until it reached 2.0 V vs. Li/Li+. Then, the potential was kept constant for further 20 min. This alternating pattern between cathodic polarization and a constant potential was maintained for the potential steps 1.5 V, 1.25 V, 1.0 V, 0.8 V, 0.6 V, 0.4 V, and 0.2 V vs. Li/Li+. A dwell time of 20 min was chosen to allow for the EIS measurements to be performed at the end of the voltage plateaus, bringing those measurements closer to steady state conditions. The EIS analysis was performed in a frequency range between 200 kHz and 50 mHz with a voltage amplitude of 10 mV, recording 6 data points per decade. In total, the experimental duration was ca. 4 h for the scan rate of 1 mV/s and ca. 17 h for a scan rate of 0.066 mV/s. Variations in duration occur due to slightly different starting OCPs. The EQCM-D analysis was running throughout the entire formation procedure, using an AT-cut, 1-inch diameter quartz with a nominal fundamental resonance frequency of 5 MHz. The frequency span was set to 60 kHz, and for each frequency sweep, 401 data points were recorded. For the evaluation of the EQCM-D data, we will discuss the quantities −Δf (change in the maximum of the resonance curve of the quartz crystal) and ΔΓ (change in the half-bandwidth of the resonance curve). Roughly speaking, ΔΓ corresponds to the increase in damping of the quartz crystal. If ΔΓ is small compared to −Δf, the latter corresponds to a mass change (Δm), which can be calculated via the Sauerbrey equation (Equation (1), details in [30]):
Δ f = 2 n f f 2 Z q Δ m A
where n is the overtone order, f f is the fundamental resonance frequency, Z q is the acoustic impedance of the AT-cut quartz (8.8 × 10⁶ kg m−2 s−1), and A is the surface area.
If −Δf and ΔΓ are in the same order of magnitude, the layer would be viscoelastic and/or rough. To identify and distinguish specific relaxation times in the EIS spectra, the distribution of relaxation times (DRTs) was determined using the pyDRTtools software (https://github.com/ciuccislab/pyDRTtools, accessed on 14 July 2025) [31]. The L-curve method was applied for determining the regularization parameters λ [32], which are reported in Supplementary Materials.

3. Results and Discussion

3.1. EQCM Results

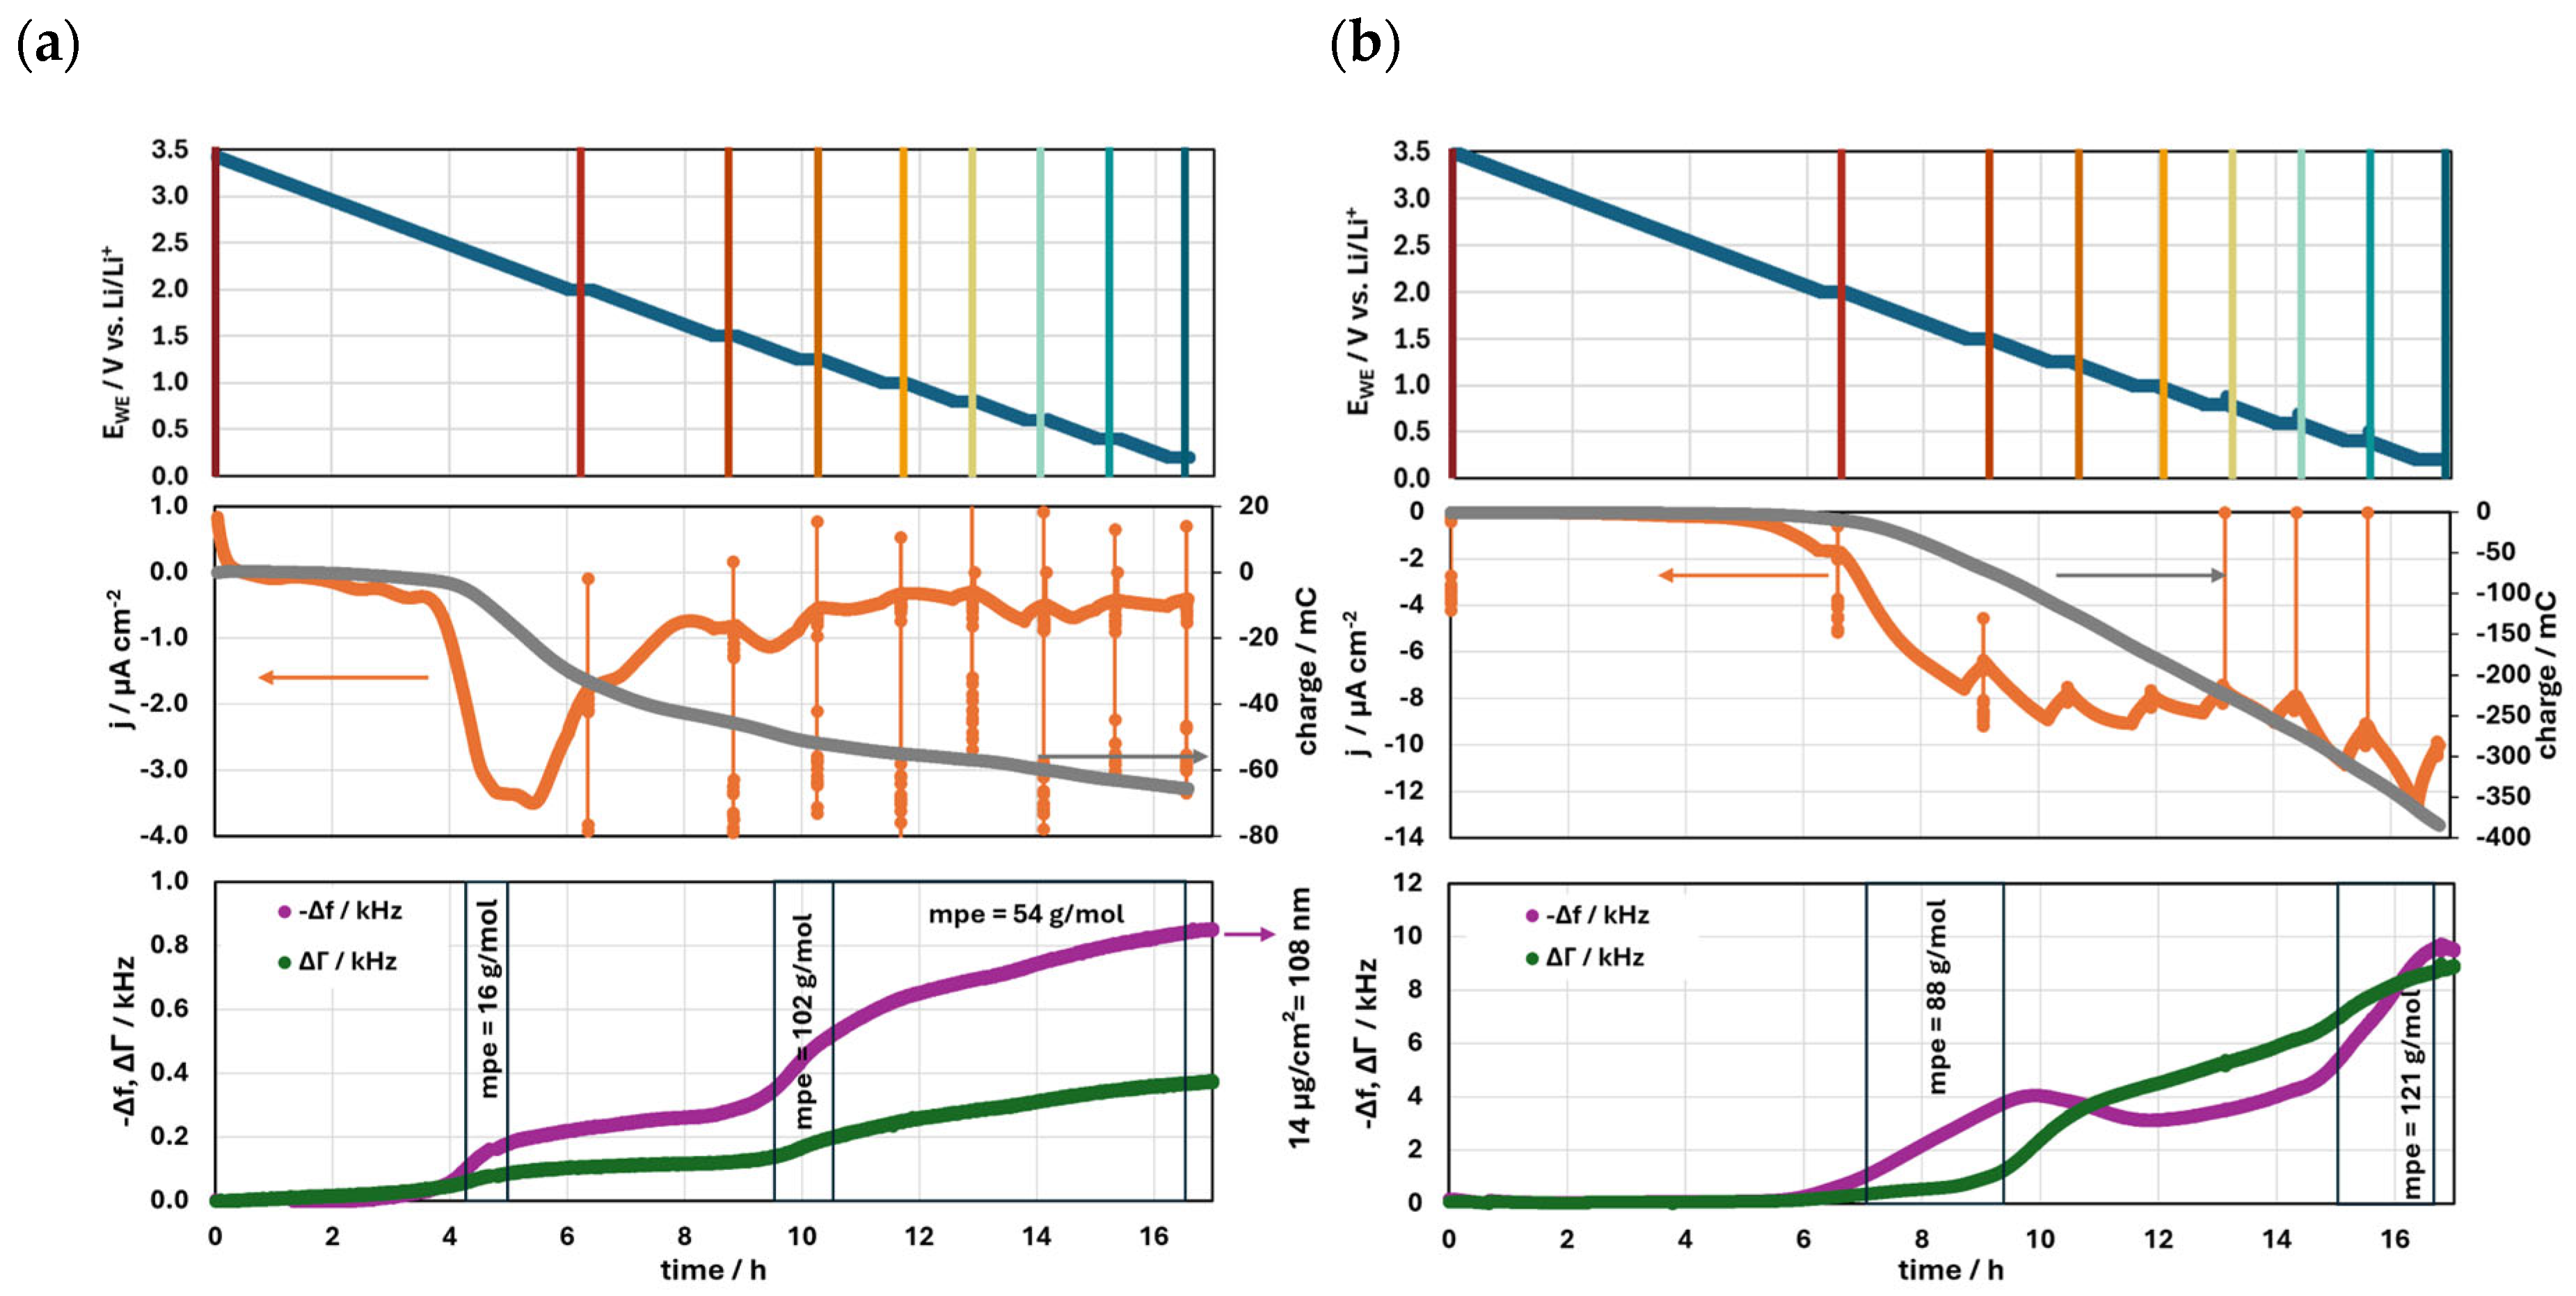
3.1.1. Slow Formation Procedure

When slowly forming an SEI layer on a Cu electrode, the largest cathodic current density is observed between 2.5 and 2 V vs. Li/Li+. This potential is significantly above the usually observed potentials of electrolyte/EC reduction of 1.7 V vs. Li/Li+ [33] and could originate from the reduction of CuO, as was shown by Kitz et al. [22], who propose reaction (2). In contrast, Song et al. [34] propose that the reduction of cupric oxide to Cu proceeds in two steps ((3a), (3b)) via the formation of cuprous oxide. The first reduction step is reported to occur at potentials between 2.5 and 2 V vs. Li/Li+, while the second reduction step happens below 2 V vs. Li/Li+.
CuO   s + 2   e + 2   Li + Cu   s +   Li 2 O   s
2   CuO   s + 2   e + 2   Li + Cu 2 O   s + Li 2 O   s
Cu 2 O   s + 2   e + 2   Li + 2   Cu s + Li 2 O   s
From reaction Equations (2) and (3a), it can be seen that CuO is reacting to form the two solids Cu/Cu2O and Li2O which will contribute to the mass increase of the WE surface. Thus, for both electrochemical reactions, an identical mass increase on the WE surface of 7 g per mol of transferred electrons can be derived. This theoretical mass change per mol of electrons transferred (mpe) can be compared to an experimental mpe derived from EQCM-D data. To calculate the experimental mpe, first the apparent mass change is obtained by converting the measured resonance frequency shift (s. Figure 2a, bottom panel) to a mass by applying the Sauerbrey equation. The apparent mass change is then divided by the number of electrons (mols), which can be determined from the charge transferred during the same time interval. The mpe can thus provide information on the mass/charge characteristics of reactions taking place during the SEI formation. To ensure a reliable mpe that is not greatly affected by non-gravimetric contributions (such as roughness, viscoelasticity, and slip), the change in bandwidth within the considered range should be relatively small compared to the change in resonance frequency. In the specific case of the previously mentioned main reduction peak, the experimentally determined mpe is 16 g/mol and, thus, ca. twice the mpe of Equation (2) or (3a) alone. It stands to reason that the reduction of CuO releases OH, according to Equation (4), which, as a strong nucleophile, has been shown to trigger a ring-opening reaction of EC yielding a di-alcoholate anion HOCH2CH2O (EG) and may lead to polymerization (poly-EG) [35]; see Equation (5). These and other decomposition products can deposit on the WE or increase the viscosity of the electrolyte in front of the WE. As these reactions are chemical in nature and do not involve further charge transfer, the mpe increases substantially, depending on the availability of HF which is a known impurity in LiPF6-based electrolytes. HF can also react with lithium ions forming LiF (s. Equation (6)), which corresponds to an mpe of 26 g/mol. A one-electron EC reduction, for example, has an mpe of 81 g/mol [22]. Consequently, it is likely that the reduction peak between 2.5 and 2 V vs. Li/Li+ can be associated with the CuO reduction and, additionally, some subsequent reactions.
Li 2 O   s + HF   LiF   s + OH + Li +
OH + n   EC   n   CO 2   g + poly EG s / l
HF + Li + + e LiF   s + 0.5   H 2 g
A second, smaller reduction peak can be observed between 1.5 V and 1.25 V vs. Li/Li+. Here, the experimentally determined mpe is 102 g/mol, which is slightly higher than the previously mentioned one-electron reduction of EC and could be related to additional ongoing reactions in the same potential range. It can thus be assumed that during the slow SEI formation on Cu, firstly a layer of CuO reduction products and its subsequent reactions is formed. This layer, however, does not seem to passivate the Cu surface entirely, as a subsequent reduction peak, roughly consistent in both potential and mpe with the expected reduction of EC, appears. At potentials below 1.25 V, the surface mass increases steadily, with an average mpe of 54 g/mol, which could be attributed to subsequent decomposition reactions of the electrolyte. Overall, using only the Sauerbrey equation, an apparent mass increase due to the SEI formation of ca. 14 µg/cm2 can be calculated. Assuming an average SEI density of 1.3 g/cm3, based on the results by Kwon et al. [36], using combined EQCM and spectroscopic ellipsometry on a carbon film electrode, this would correspond to an SEI thickness of approximately 108 nm. The Sauerbrey equation, however, is only valid for thin and rigid layers. In our measurements, especially those on carbon substrates, we see an increase in the energy dissipation, expressed by the change in half-bandwidth ΔΓ of the resonance curve of the quartz crystal, during the formation of the SEI, which introduces a systematic error to the mass results calculated with the Sauerbrey equation. The increase in dissipation can indicate a viscosity increase in the electrolyte within the penetration depth of the shear wave, a change in viscoelastic properties of the formed layer, or a roughness increase in said layer. Those effects cannot be easily separated, especially if the analysis of higher overtones is not available, and all of them are likely to occur to a certain extent. As the initial EC reduction reactions can also result in liquid products with high viscosity (Equation (5)), a viscosity increase at the interphase can be assumed. Also, a certain roughness increase compared to the very smooth pristine Cu working electrode (deposited by PVD) can be assumed and, as previous analyses of the SEI by operando AFM have shown, can be substantial [18,21,37,38]. As the SEI itself is known to contain oligomeric and polymeric components during its formation, a viscoelastic behavior is also rather likely.
If the increase in dissipation were caused solely by a viscosity change in a Newtonian fluid, a Gordon–Kanazawa-like behavior would be expected, where the negative shift in resonance frequency, −Δf, would be identical to the (positive) change in the half-bandwidth ΔΓ. This would result in two overlaying lines for −Δf and ΔΓ. In the bottom panel of Figure 2, −Δf and ΔΓ are displayed, and it becomes evident that after the end of the formation at 16.5 h, ΔΓ only accounts for about half of −Δf. This indicates that next to possible viscosity changes of the electrolyte, a (viscoelastic) layer formation also takes place.
In contrast to the slow SEI formation on copper, the slow SEI formation on amorphous carbon (Figure 2b) does not show a significant reduction current density above 2 V vs. Li/Li+. Instead, the reduction current starts and continues to rise from below 2 V vs. Li/Li+. A decrease in resonance frequency, indicating a rise in mass, also starts to become noticeable at the same potential. The mpe associated with this first rise in mass until ca. 1.5 V vs. Li/Li+ is 88 g/mol and could thus indicate that the dominant reaction here is the reduction of EC (mpe = 81 g/mol). During this formation step, the dissipation barely rises, which suggests that this mass increase originates from a layer deposition and not merely from reactions which increase the electrolyte viscosity at the interphase. Below 1.5 V vs. Li/Li+, however, ΔΓ rises significantly and continues to rise until the end of the formation procedure. This delayed rise in ΔΓ in comparison to −Δf is typical for growing thin viscoelastic films and is predicted by the Lu–Lewis equation with small-load approximation [29]. The reasons for the small decrease in −Δf after 10 h are unknown but could be explained by the further reduction of initial EC reaction products forming soluble or gaseous components. After the formation procedure is finished, the apparent Sauerbrey mass is 167 µg/cm2, and the associated apparent thickness corresponds to 1.28 µm (assumed ρ = 1.3 g/cm3), which is ~12 times higher than the mass recorded on the Cu substrate. Despite a systematic error introduced into this calculation by not compensating for the dissipation by viscoelastic modeling, it becomes evident that the SEI formed on amorphous carbon is much thicker and more viscoelastic than the SEI formed on Cu. Due to −Δf and ΔΓ being very similar in value after the SEI formation on amorphous carbon, it can be assumed that a viscosity increase in the electrolyte at the interphase of the WE also contributes to the EQCM-D signal.

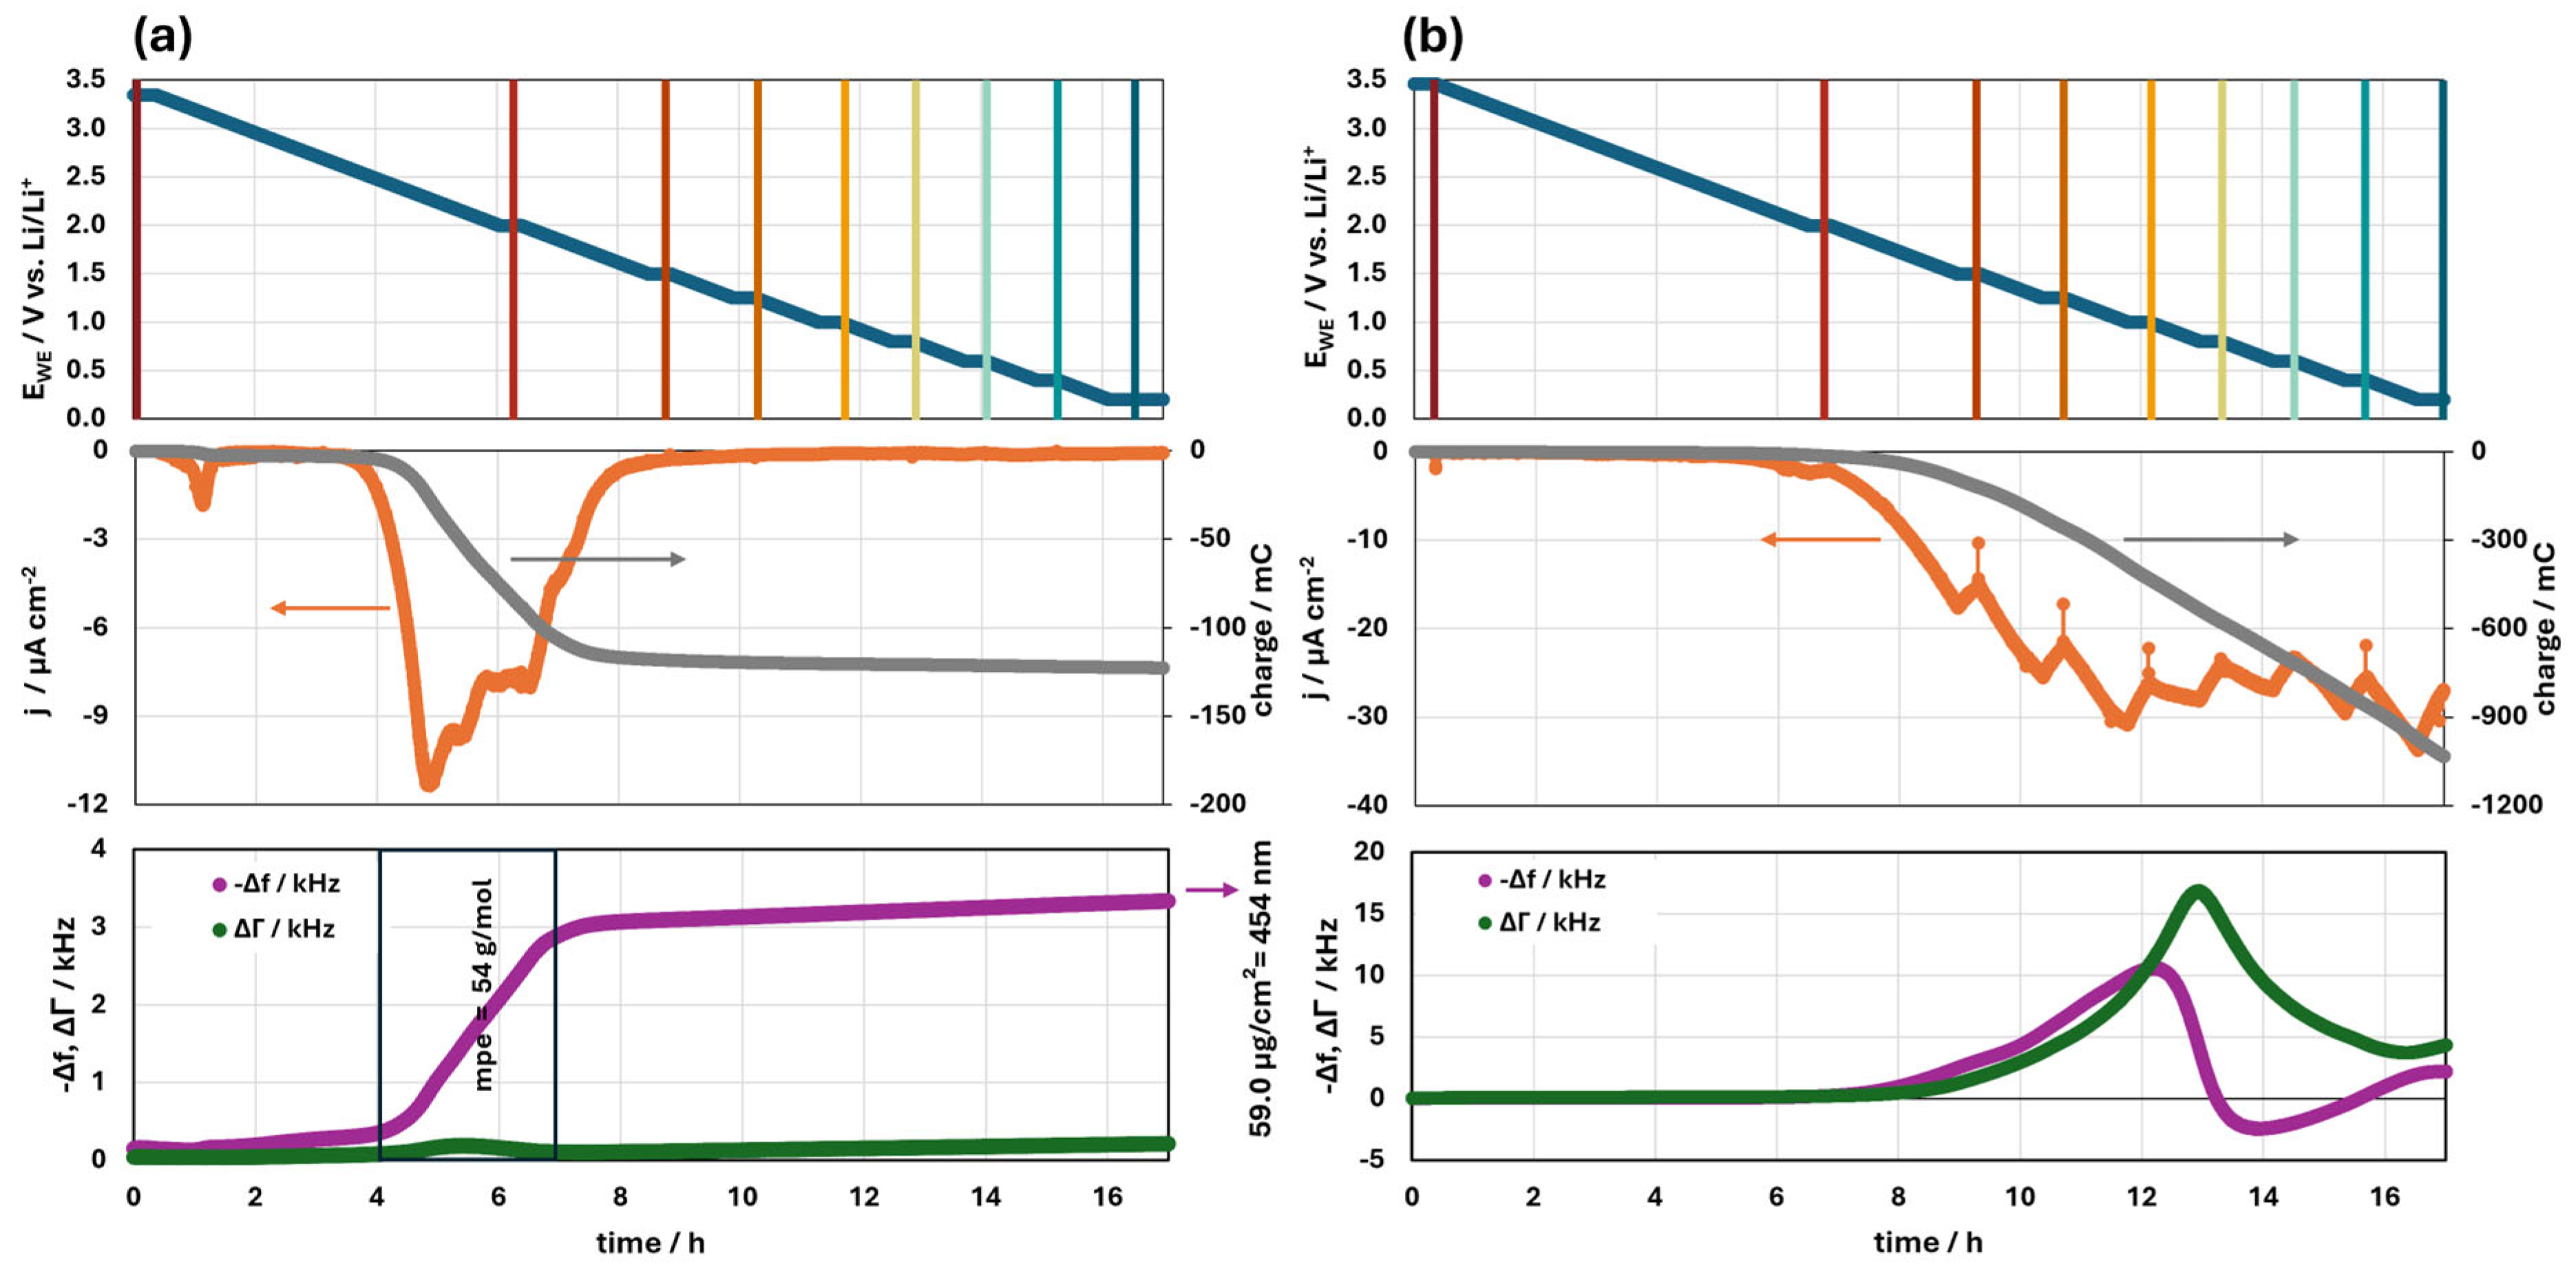
3.1.2. Fast Formation Procedure

The fast SEI formation with a scan rate of 1 mV/s on Cu (Figure 3a) shows a small reductive peak at ca. 3.1 V vs. Li/Li+, which leads to a tiny shift in −Δf that is too small for the calculation of a reliable mpe. This small reduction peak at 3.1 V was not visible in the slow SEI formation on Cu but has been reported in the literature, where it has been assigned to either Cu oxide reduction or HF decomposition [39,40]. As the quartz crystals used for these experiments were Cu-coated in the same batch and stored in the same environment, we believe it to be unlikely that different degrees in Cu oxidation cause the reduction peak in this experiment to be visible but not in the other. We thus assume the reduction peak at 3.1 V to originate from a higher water contamination, which reacts to HF at this potential. At around 2.5 V vs. Li/Li+, another larger reduction current peak can be observed, similar in potential but much larger in amplitude compared to the slow formation. This reductive current is accompanied by a mass increase but almost no dissipation increase. Also, at potentials below 1.5 V vs. Li/Li+, there is no substantial reduction current occurring, and the layer’s mass only increases slowly and linearly. Consequently, it can be assumed that the reactions taking place between 2.5 V and 1.5 V vs. Li/Li+ lead to a well-passivating surface that does not seem to allow for an EC reduction at lower potentials. These reactions have an average mpe of 40 g/mol. We propose that due to the higher initial water concentration in this experiment which causes the reductive peak at 3 V vs. Li/Li+, a higher HF concentration is present in this electrolyte, causing further subsequent reactions (Equations (4)–(6)) that passivate the surface sufficiently to inhibit a substantial reduction in the low-voltage range. The layer formed during the fast formation procedure on Cu seems to be rigid, with nearly no viscoelastic component. The Sauerbrey mass, which here should not contain a systematic error, is 22.4 µg/cm2 and corresponds to a thickness of 172 nm. The SEI is thus thicker than for the slow formation procedure on Cu, but much thinner than the ones observed on carbon.
On amorphous carbon, the fast SEI formation procedure starts to show notable reduction currents below 2 V vs. Li/Li+, which increase at lower potentials (Figure 3b). This behavior agrees with the slow SEI formation procedure, but the current densities are higher, as is expected at higher scan rates, which leads to a stronger polarization and, therefore, a stronger relaxation during the voltage plateaus. The SEI mass starts to increase with the onset of notable reduction currents and reaches 92 µg/cm2, or 707 nm, at the end of the experiment, which is 55% of the mass determined at the slow SEI formation on carbon. Yet, the SEI growth is not completed at this point and continues to grow if kept at a low potential, as is shown below.

3.1.3. The Effect of the VC Additive

When adding 2 vol.% of VC to the electrolyte, and repeating the slow SEI formation procedure on Cu, again at ca. 3.1 V vs. Li/Li+, a small reductive peak is visible, which could be attributed to H2O reduction [23] (Figure 4a). At around 2.5 V vs. Li/Li+, consistent with previous findings on Cu, we see the main reduction peak, with higher current densities than without VC. Also, instead of two distinct areas of mass increase, we see here, much like in the fast SEI formation on Cu, only one area of significant mass increase from 2.5 V to ca. 1.7 V vs. Li/Li+. After that, it appears that the surface is passivated, and the mass increase at lower potentials is only minimal. As in the other SEI formation experiments on Cu, the dissipation is very low, suggesting a rigid, smooth layer and no significant viscosity changes in the electrolyte at the Cu surface. Notably, the SEI formation in this experiment resembles the previous fast SEI formation procedure without VC more than the slow formation procedure. We attribute this to the small reduction peak at 3.1 V vs. Li/Li+, which is present in those two cases, but absent in the slow SEI formation procedure without VC. If this reduction indeed results from the H2O reduction and produces HF and LiF, then the water content seems to affect the SEI buildup markedly on Cu surfaces. Overall, the reduction current density is higher in the presence of VC and leads to a higher SEI mass of 59 µg/cm2 and associated thickness of 454 nm, maintaining rigid mechanical properties. This high thickness of the VC-based SEI is an atypical finding, which can also be reproduced on carbon substrate, as is shown below. Most publications in the literature report that the addition of VC leads to a thinner SEI [18,24] with lower amounts of dissipation [25], as VC-containing solutions have been found to produce more polymeric species and less short oligomeric products, whereas pure EC solutions produce a thick layer of unstable oligomer products [41]. We believe that the high mass of the SEI in this experiment is due to the use of a flooded cell in combination with an electrode of small physical surface area compared to particle-based electrodes. Therefore, the addition of 2 vol.% of VC represents a large total amount of VC available for reduction in comparison to the surface area available. Thus, it is noteworthy to mention that the ratio between the amount of added VC and the surface area for reduction strongly influences the SEI thickness and could indicate that VC-based SEIs continue to grow to a great thickness, if enough VC is supplied, while still effectively passivating against EC reduction. This highlights the need for adjusting the VC concentration to the available surface area. A work by Kitz et al. [24] supports this conclusion by demonstrating that by using lower VC concentrations (0.1 wt.% and 0.4 wt.%), which are normalized to the surface area of the carbon electrode, the SEI mass is decreased by about 50% in comparison to the electrolyte without VC additive after the first reduction cycle.
Performing the slow SEI formation on amorphous carbon with the addition of 2 vol.% VC leads to a first reduction current at ca. 2 V vs. Li/Li+, which is the same potential as for the slow SEI formation without VC. The current density, however, is much higher, which also results in a drastic increase in both −Δf and ΔΓ. The increase is so pronounced that a special effect called film resonance occurs, where the deposited layer itself develops a resonance frequency ([29], p. 23). This phenomenon is known from polymer layers, e.g., brushes or latex particles attached to a QCM while being immersed in a liquid phase [42,43]. It arises if the film behaves viscoelastically and exceeds a quarter of the shear wave’s wavelength. Its telltale sign is a drop in −Δf that aligns with a maximum in ΔΓ, as displayed in the bottom panel of Figure 4b. Just like when using the Cu substrate, the SEI grown with VC is significantly thicker than without VC, but its thickness cannot be accurately calculated due to the film resonance.

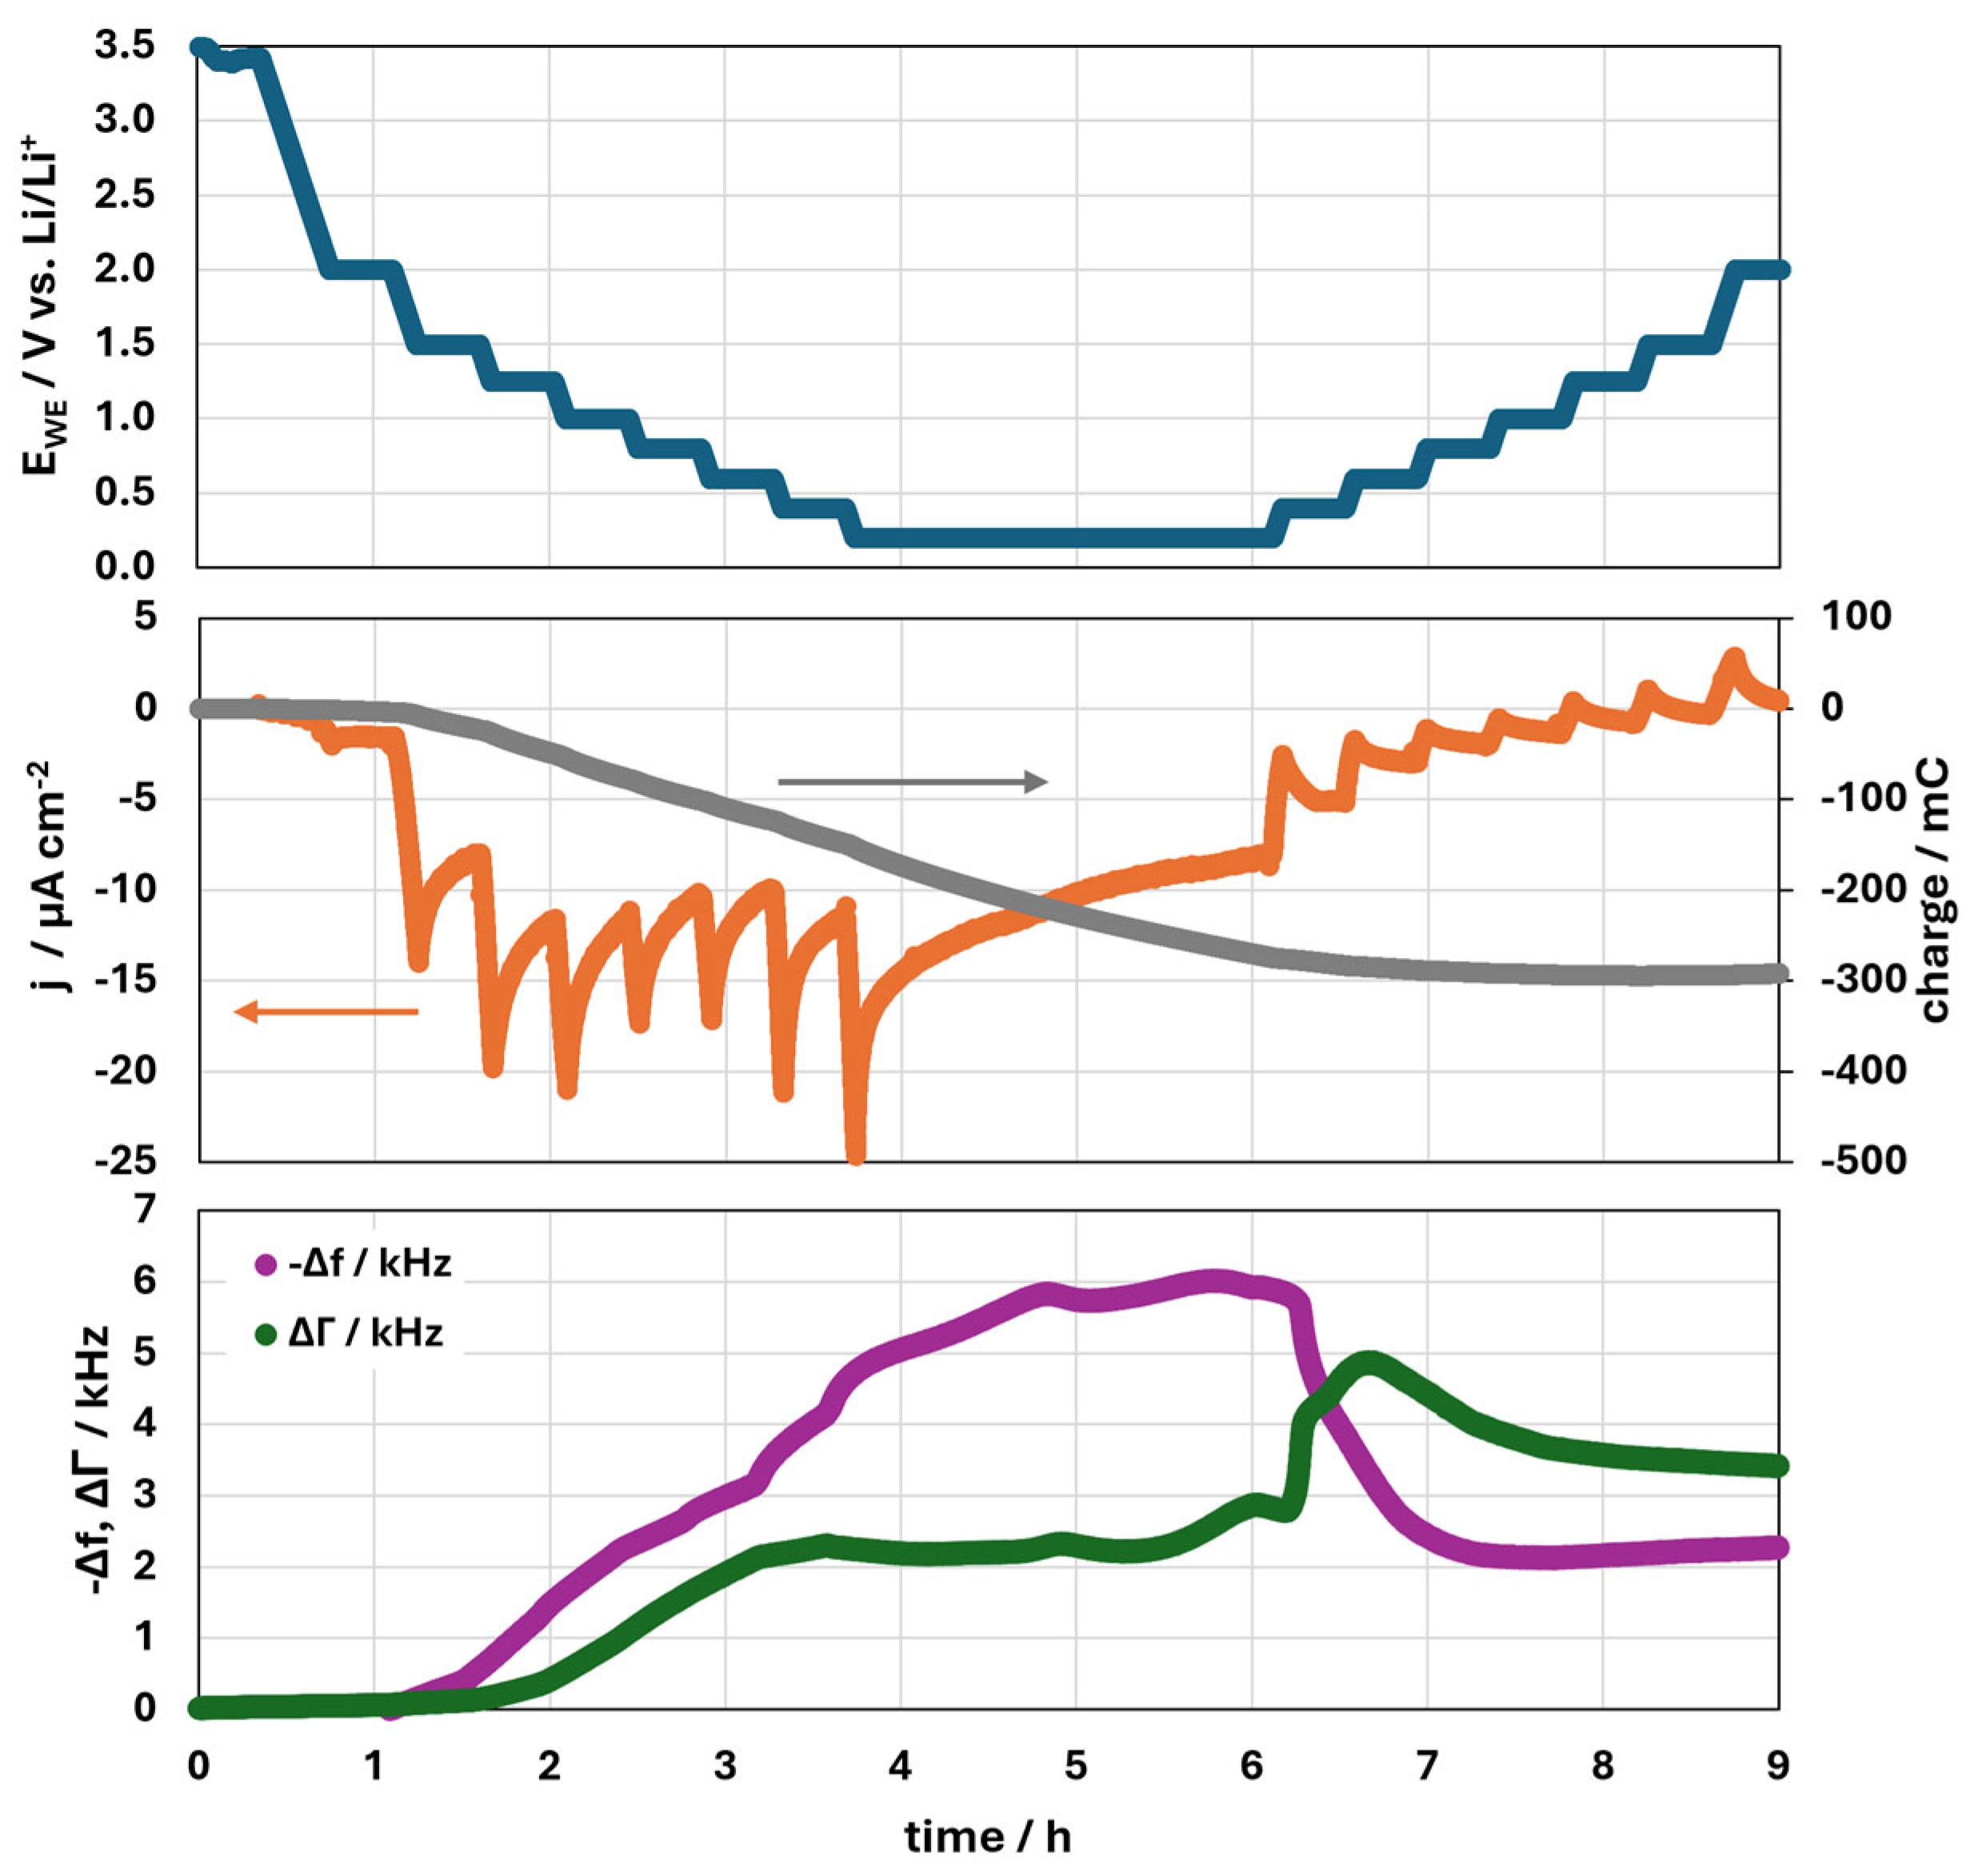
3.1.4. Continued SEI Formation and Potential Increase
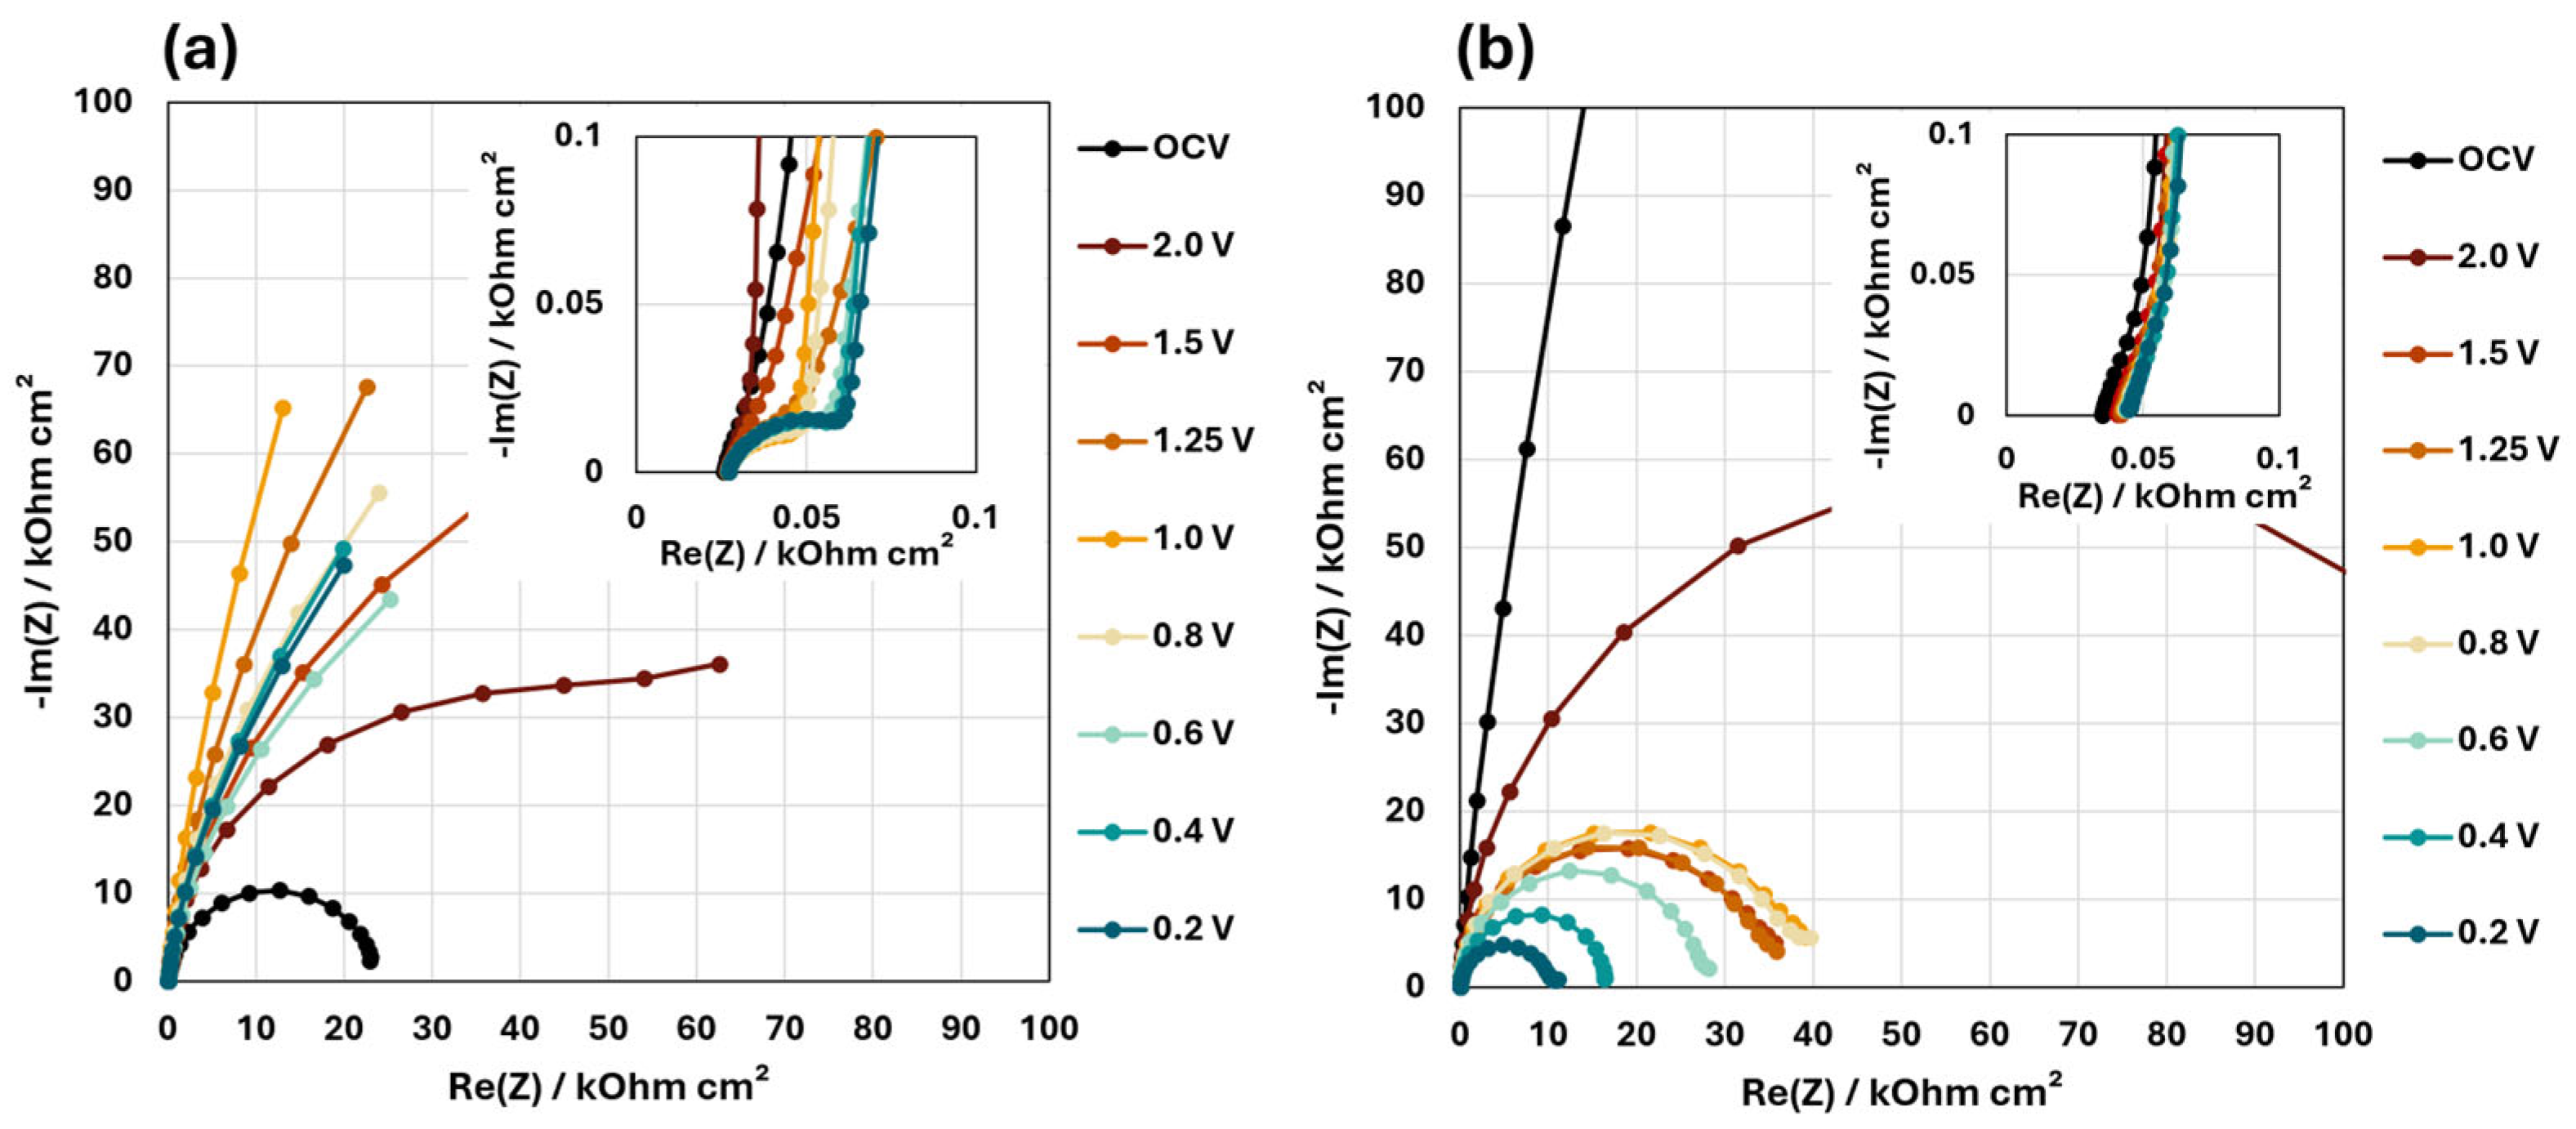
After the fast SEI formation on amorphous carbon, the potential was held for another two hours at 0.2 V vs. Li/Li+. During this period, −Δf continues to rise slowly, showing that the SEI growth is not complete after 4 h (Figure 5). The dissipation, however, does not rise substantially during this period. After these two hours, the potential was increased stepwise in inverse fashion to the formation. Here, it can be seen that −Δf sharply decreases to about one third of its maximum value, until the potential reaches ca. 0.8 V vs. Li/Li+, and then stays constant. The decrease in −Δf is accompanied by a further increase in ΔΓ, which is unusual, as a mass loss normally does not lead to an increase in dissipation. This behavior could be explained by a partial dissolution of the SEI, leaving a porous frame with trapped electrolyte behind. During this potential increase until 1 V vs. Li/Li+, the currents remain negative, which indicates that reductive processes are still dominant in this potential region. This means that the electrochemical SEI formation seems to be slower than the partial SEI dissolution, leading to an overall mass decrease of the SEI. We also conclude that the reductive currents during formation are primarily SEI formation currents and are not associated with a lithiation process of the amorphous carbon. If a substantial lithiation had taken place during the formation, one would have to expect an associated delithiation process during the increase in potential and, thus, oxidative currents.

3.2. EIS Results

The impedance spectra of both slow SEI formations on Cu and on amorphous carbon are displayed as Nyquist plots in Figure 6. The impedance spectrum on Cu (Figure 6a) at OCP displays a slightly depressed semicircle with a diameter of ca. 20 kOhm cm2. When decreasing the potential, the semicircles increase in diameter and are no longer fully developed due to the cut-off frequency of 50 mHz. Only when reaching potentials below 1 V does the semicircle diameter decrease again. At high frequencies (hf), the inset of Figure 6a reveals that an additional, much smaller semicircle is formed, becoming a distinct feature below 1.5 V. While the characteristic relaxation times for the big semicircle are in the range of 10−1–101 s, the small hf semicircles have characteristic relaxation times in the range of 10−4 s. This also matches roughly with the common correlation of processes to relaxation times provided in [44]. Using Cu as WE in this experiment eliminates the possibility of lithiation reactions of active materials taking place. Thus, it can be assumed that the large semicircles observed in the Nyquist plots correspond to the charge transfer resistance associated with the SEI formation, while the small hf semicircles could relate to ion transport resistances within the SEI, which amount to about 50 Ohm cm2.
The impedance spectra on amorphous carbon (Figure 6b) start with a larger semicircle at OCP that decrease in size as the potential decreases. Here, a possible second semicircle at high frequencies cannot be distinguished (Figure 6b, inset). Also, an analysis of the distribution of relaxation times (s. Figure S1) concludes that no separate relaxation time can be identified at higher frequencies or low relaxation times (>16 Hz or <10−2 s, respectively). As the impedance spectra cannot be further separated into distinct processes, only the “effective SEI formation resistance” (RSEI,eff), which encompasses the ion transport resistances, and the charge transfer resistances together can be discussed in this case. However, because small charge transfer resistances do yield a distinct semicircle in the Nyquist plot, as seen in the case for the slow SEI formation on the Cu substrate, it stands to reason that the charge transfer resistances on carbon are higher and thus cannot be separated from the ion transport resistances. The charge transfer resistances can relate to reactions of the SEI formation, which were previously shown to continue until low potentials or to minor lithiation reactions with the amorphous carbon. It should be noted that the resistances reported here are larger than those obtained from commercial electrode materials, as the physical surface area of the smooth and pore-free model electrodes used by us (deposited by PVD on smooth quartzes) are much smaller than those of particle-based commercial electrodes.
When fitting the charge transfer semicircles of the different SEI formations (slow, fast, and slow with 2 vol.% VC, missing full spectra shown in Supplementary Materials), it becomes visible that the RSEI,eff progression over the potential on amorphous carbon (Figure 7b) is far more consistent than the resistance progression on Cu (Figure 7a). Whereas RSEI,eff starts at relatively low values at OCV and increases significantly at intermediate voltages on Cu, the effective SEI formation resistance on amorphous carbon starts at very high resistances and decreases with decreasing potential. The RSEI,eff on carbon roughly correlates to the inverse formation current densities, with the slow formation procedure yielding the highest resistances and lowest current densities and the addition of VC resulting in the lowest resistances and highest current densities. This clearly suggests a strong influence of the SEI formation kinetics on RSEI,eff.
Despite the strong differences of RSEI,eff on carbon during the formation, at 0.2 V vs. Li/Li+, all tested formation procedures yield very similar resistances between 5 and 10 kOhm cm2.

4. Conclusions

The SEI formation on copper and on amorphous carbon substrates in 1 M LiPF6 in EC/DEC differs in many aspects. On copper, the SEI formation commences at higher potentials, with main reduction peaks between 2.5 and 1.5 V vs. Li/Li+. These reduction peaks are accompanied by a mass increase, as evidenced by EQCM-D. The mass change per transferred mol of electrons (mpe) suggests that the reactions in this potential range are initiated by a reduction of native CuO but that the reduction product Li2O triggers consecutive reactions, leading to a polymerization of EC. In two cases (fast formation and slow formation with VC addition), the main SEI reactions seem to have passivated the surface in this potential range and the SEI continues to grow only very slowly when further polarized to lower potentials. In the third case, a slow SEI formation procedure without additives, the reduction between 2.5 and 1.5 V vs. Li/Li+ also leads to a mass increase but to a lesser extent than for the other two cases. This SEI is not passivating the surface well, and thus, continued SEI formation is observed at lower potentials. These differences are not mainly attributed to the formation procedure or addition of the additive VC but to differences in water contaminations, which are visible by a small reduction peak at ca. 3.1 V vs. Li/Li+. SEIs with a higher water content seem to passivate more completely and earlier than those with low water contents. The SEIs formed in additive-free electrolytes on copper have specific masses of 14 and 22 µg/cm2, which are much lighter than the ones formed on amorphous carbon.
The SEI formation on amorphous carbon starts below 2 V vs. Li/Li+, with reduction current densities increasing with decreasing WE potential. In the additive-free electrolyte, the mpe and reduction potential better match the reduction of EC, which seems to be the main SEI forming reaction. The apparent specific masses of the SEI were calculated to be 167 µg/cm2 for the slow formation procedure and 92 µg/cm2 after the fast formation procedure, whereas this SEI continues to grow thicker if a low potential is applied. Assuming a density of 1.3 g/cm3, these SEIs would exceed a thickness of 1 µm and would, at least partially, consist of oligomeric and polymeric EC reduction species, which could be rinsed away easily in ex situ analyses. The addition of 2 vol.% of VC unexpectedly increased the thickness of the SEI layers on Cu, as well as on amorphous carbon, whereas in the literature, consistently thinner VC-based SEIs are reported. The reason for our results could originate in the use of a flooded cell (1 mL electrolyte) with an excess of VC in relation to a small physical surface area. This seems to suggest that VC-based SEIs are passivating against further VC reduction only at high thicknesses, highlighting the need for adjusting the VC concentration to the electrochemically active surface area.
The electrochemical impedance spectra of the slow SEI formation on Cu allow for a separation of two semicircles in the Nyquist plot. A larger one, with resistances in the range of hundreds of kOhm cm2, is attributed to the charge transfer resistance associated with the SEI formation. A smaller high-frequency semicircle is developing during the formation and is assumed to correspond to ion transport resistances within the SEI, which reach values of ca. 50 Ohm cm2 at low potentials. On the amorphous carbon substrate, however, only one semicircle develops, which cannot be separated into ion transport resistances and charge transfer resistances. These resistances can thus only be evaluated jointly and are termed the effective SEI formation resistance. On the carbon substrate, the effective formation resistance decreases with lowering potentials and shows a similar development for both formation speeds and for the addition of VC. The lowest resistances can be observed for the SEI formed with VC addition and the highest ones for the slow formation procedure. On copper, the effective formation resistance is less consistent between different formation parameters but generally starts at lower values and reaches a maximum at 1.5 or 1.25 V vs. Li/Li+ before it decreases again.

Supplementary Materials

The supporting information can be downloaded at: https://www.mdpi.com/article/10.3390/batteries11070273/s1.

Author Contributions

Conceptualization, M.S., C.L., A.B. and B.R.; investigation, M.S.; validation, C.L. and M.S.; writing—original draft preparation, M.S.; writing—review and editing, all authors. All authors have read and agreed to the published version of the manuscript.

Funding

This research was funded by the Deutsche Forschungsgemeinschaft (DFG), grant numbers RO1213/18-1/BU1200/36-1. C.L. gratefully acknowledges support from the German Federal Ministry of Research, Technology and Space (BMFTR), within the framework of the “BatFutur” program (GalvaNection, Grant No. 03XP0589).

Data Availability Statement

The original contributions presented in this study are included in the article and Supplementary Materials. Further inquiries can be directed to the corresponding author.

Conflicts of Interest

The authors declare no conflicts of interest.

References

  1. Peled, E. The Electrochemical Behavior of Alkali and Alkaline Earth Metals in Nonaqueous Battery Systems—The Solid Electrolyte Interphase Model. J. Electrochem. Soc. 1979, 126, 2047. [Google Scholar] [CrossRef]
  2. Winter, M. The Solid Electrolyte Interphase—The Most Important and the Least Understood Solid Electrolyte in Rechargeable Li Batteries. Z. Physiol. Chem. 2009, 223, 1395–1406. [Google Scholar] [CrossRef]
  3. Jia, T.; Zhong, G.; Lv, Y.; Li, N.; Liu, Y.; Yu, X.; Zou, J.; Chen, Z.; Peng, L.; Kang, F.; et al. Prelithiation Strategies for Silicon-Based Anode in High Energy Density Lithium-Ion Battery. Green Energy Environ. 2023, 8, 1325–1340. [Google Scholar] [CrossRef]
  4. Li, H.; Zhou, H. Enhancing the Performances of Li-Ion Batteries by Carbon-Coating: Present and Future. Chem. Commun. 2012, 48, 1201–1217. [Google Scholar] [CrossRef] [PubMed]
  5. Natarajan, C.; Fujimoto, H.; Tokumitsu, K.; Mabuchi, A.; Kasuh, T. Reduction of the Irreversible Capacity of a Graphite Anode by the CVD Process. Carbon 2001, 39, 1409–1413. [Google Scholar] [CrossRef]
  6. Zhu, P.; Gastol, D.; Marshall, J.; Sommerville, R.; Goodship, V.; Kendrick, E. A Review of Current Collectors for Lithium-Ion Batteries. J. Power Sources 2021, 485, 229321. [Google Scholar] [CrossRef]
  7. Matsumoto, F.; Fukunishi, M. Review of Current Collector-, Binder-, Conductive Additive-Free, and Freestanding Electrodes in Lithium and Related Batteries. Batteries 2024, 10, 330. [Google Scholar] [CrossRef]
  8. Wu, B.; Chen, C.; Raijmakers, L.H.J.; Liu, J.; Danilov, D.L.; Eichel, R.-A.; Notten, P.H.L. Li-Growth and SEI Engineering for Anode-Free Li-Metal Rechargeable Batteries: A Review of Current Advances. Energy Storage Mater. 2023, 57, 508–539. [Google Scholar] [CrossRef]
  9. Menkin, S.; O’Keefe, C.A.; Gunnarsdóttir, A.B.; Dey, S.; Pesci, F.M.; Shen, Z.; Aguadero, A.; Grey, C.P. Toward an Understanding of SEI Formation and Lithium Plating on Copper in Anode-Free Batteries. J. Phys. Chem. C 2021, 125, 16719–16732. [Google Scholar] [CrossRef] [PubMed]
  10. Jagger, B.; Pasta, M. Solid Electrolyte Interphases in Lithium Metal Batteries. Joule 2023, 7, 2228–2244. [Google Scholar] [CrossRef]
  11. Edström, K.; Herstedt, M.; Abraham, D.P. A New Look at the Solid Electrolyte Interphase on Graphite Anodes in Li-Ion Batteries. J. Power Sources 2006, 153, 380–384. [Google Scholar] [CrossRef]
  12. Schroder, K.W.; Celio, H.; Webb, L.J.; Stevenson, K.J. Examining Solid Electrolyte Interphase Formation on Crystalline Silicon Electrodes: Influence of Electrochemical Preparation and Ambient Exposure Conditions. J. Phys. Chem. C 2012, 116, 19737–19747. [Google Scholar] [CrossRef]
  13. Solchenbach, S.; Huang, X.; Pritzl, D.; Landesfeind, J.; Gasteiger, H.A. Monitoring SEI Formation on Graphite Electrodes in Lithium-Ion Cells by Impedance Spectroscopy. J. Electrochem. Soc. 2021, 168, 110503. [Google Scholar] [CrossRef]
  14. Steinhauer, M.; Risse, S.; Wagner, N.; Friedrich, K.A. Investigation of the Solid Electrolyte Interphase Formation at Graphite Anodes in Lithium-Ion Batteries with Electrochemical Impedance Spectroscopy. Electrochim. Acta 2017, 228, 652–658. [Google Scholar] [CrossRef]
  15. Iurilli, P.; Brivio, C.; Wood, V. On the Use of Electrochemical Impedance Spectroscopy to Characterize and Model the Aging Phenomena of Lithium-Ion Batteries: A Critical Review. J. Power Sources 2021, 505, 229860. [Google Scholar] [CrossRef]
  16. Kiani, S.; Gharibi, H.; Javadian, S.; Zhiani, M.; Kashani, H. The Effect of the SEI Layer on the Electrochemical Impedance in the Graphite/Li[Ni0.5Mn0.3Co0.2]O2 Lithium-Ion Full Cells. Appl. Surf. Sci. 2023, 633, 157638. [Google Scholar] [CrossRef]
  17. Luchkin, S.Y.; Lipovskikh, S.A.; Katorova, N.S.; Savina, A.A.; Abakumov, A.M.; Stevenson, K.J. Solid-Electrolyte Interphase Nucleation and Growth on Carbonaceous Negative Electrodes for Li-Ion Batteries Visualized with in Situ Atomic Force Microscopy. Sci. Rep. 2020, 10, 8550. [Google Scholar] [CrossRef] [PubMed]
  18. Zhang, Z.; Smith, K.; Jervis, R.; Shearing, P.R.; Miller, T.S.; Brett, D.J.L. Operando Electrochemical Atomic Force Microscopy of Solid–Electrolyte Interphase Formation on Graphite Anodes: The Evolution of SEI Morphology and Mechanical Properties. ACS Appl. Mater. Interfaces 2020, 12, 35132–35141. [Google Scholar] [CrossRef] [PubMed]
  19. He, Z.; Li, W.; Chen, Y.; Huang, F.; Jie, Y.; Li, X.; Cao, R.; Jiao, S. Nanoscale Characterization of the Solid Electrolyte Interphase and Lithium Growth by Atomic Force Microscopy. Battery Energy 2024, 3, 20230045. [Google Scholar] [CrossRef]
  20. Kawaura, H.; Harada, M.; Kondo, Y.; Kondo, H.; Suganuma, Y.; Takahashi, N.; Sugiyama, J.; Seno, Y.; Yamada, N.L. Operando Measurement of Solid Electrolyte Interphase Formation at Working Electrode of Li-Ion Battery by Time-Slicing Neutron Reflectometry. ACS Appl. Mater. Interfaces 2016, 8, 9540–9544. [Google Scholar] [CrossRef] [PubMed]
  21. Steinhauer, M.; Stich, M.; Kurniawan, M.; Seidlhofer, B.-K.; Trapp, M.; Bund, A.; Wagner, N.; Friedrich, K.A. In Situ Studies of Solid Electrolyte Interphase (SEI) Formation on Crystalline Carbon Surfaces by Neutron Reflectometry and Atomic Force Microscopy. ACS Appl. Mater. Interfaces 2017, 9, 35794–35801. [Google Scholar] [CrossRef] [PubMed]
  22. Kitz, P.G.; Lacey, M.J.; Novák, P.; Berg, E.J. Operando EQCM-D with Simultaneous in Situ EIS: New Insights into Interphase Formation in Li Ion Batteries. Anal. Chem. 2019, 91, 2296–2303. [Google Scholar] [CrossRef] [PubMed]
  23. Kitz, P.G.; Novák, P.; Berg, E.J. Influence of Water Contamination on the SEI Formation in Li-Ion Cells: An Operando EQCM-D Study. ACS Appl. Mater. Interfaces 2020, 12, 15934–15942. [Google Scholar] [CrossRef] [PubMed]
  24. Kitz, P.G.; Lacey, M.J.; Novák, P.; Berg, E.J. Operando Investigation of the Solid Electrolyte Interphase Mechanical and Transport Properties Formed from Vinylene Carbonate and Fluoroethylene Carbonate. J. Power Sources 2020, 477, 228567. [Google Scholar] [CrossRef]
  25. Ivanov, S.; Mai, S.; Himmerlich, M.; Dimitrova, A.; Krischok, S.; Bund, A. Microgravimetric and Spectroscopic Analysis of Solid−Electrolyte Interphase Formation in Presence of Additives. ChemPhysChem 2019, 20, 655–664. [Google Scholar] [CrossRef] [PubMed]
  26. Capone, F.G.; Sottmann, J.; Meunier, V.; Ramírez, L.P.; Grimaud, A.; Iadecola, A.; Scardamaglia, M.; Rueff, J.-P.; Dedryvère, R. Operando Observation of the Dynamic SEI Formation on a Carbonaceous Electrode by Near-Ambient Pressure XPS. Energy Environ. Sci. 2024, 17, 1509–1519. [Google Scholar] [CrossRef]
  27. Bommier, C.; Chang, W.; Li, J.; Biswas, S.; Davies, G.; Nanda, J.; Steingart, D. Operando Acoustic Monitoring of SEI Formation and Long-Term Cycling in NMC/SiGr Composite Pouch Cells. J. Electrochem. Soc. 2020, 167, 020517. [Google Scholar] [CrossRef]
  28. Stich, M.; Valdes Landa, J.E.; Pantenburg, I.; Krauss, F.T.; Baumer, C.; Roling, B.; Bund, A. Combining Operando Techniques for an Accurate Depiction of the SEI Formation in Lithium-Ion Batteries. Batteries 2025, 11, 117. [Google Scholar] [CrossRef]
  29. Johannsmann, D.; Langhoff, A.; Leppin, C. Studying Soft Interfaces with Shear Waves: Principles and Applications of the Quartz Crystal Microbalance (QCM). Sensors 2021, 21, 3490. [Google Scholar] [CrossRef] [PubMed]
  30. Sauerbrey, G. Verwendung von Schwingquarzen zur Wägung dünner Schichten und zur Mikrowägung. Z. Phys. 1959, 155, 206–222. [Google Scholar] [CrossRef]
  31. Wan, T.H.; Saccoccio, M.; Chen, C.; Ciucci, F. Influence of the Discretization Methods on the Distribution of Relaxation Times Deconvolution: Implementing Radial Basis Functions with DRTtools. Electrochim. Acta 2015, 184, 483–499. [Google Scholar] [CrossRef]
  32. Maradesa, A.; Py, B.; Wan, T.H.; Effat, M.B.; Ciucci, F. Selecting the Regularization Parameter in the Distribution of Relaxation Times. J. Electrochem. Soc. 2023, 170, 030502. [Google Scholar] [CrossRef]
  33. Peled, E.; Menkin, S. Review—SEI: Past, Present and Future. J. Electrochem. Soc. 2017, 164, A1703. [Google Scholar] [CrossRef]
  34. Song, H.; Gong, Y.; Su, J.; Li, Y.; Li, Y.; Gu, L.; Wang, C. Surfaces/Interfaces Modification for Vacancies Enhancing Lithium Storage Capability of Cu2O Ultrasmall Nanocrystals. ACS Appl. Mater. Interfaces 2018, 10, 35137–35144. [Google Scholar] [CrossRef] [PubMed]
  35. Metzger, M.; Strehle, B.; Solchenbach, S.; Gasteiger, H.A. Hydrolysis of Ethylene Carbonate with Water and Hydroxide under Battery Operating Conditions. J. Electrochem. Soc. 2016, 163, A1219. [Google Scholar] [CrossRef]
  36. Kwon, K.; Kong, F.; McLarnon, F.; Evans, J.W. Characterization of the SEI on a Carbon Film Electrode by Combined EQCM and Spectroscopic Ellipsometry. J. Electrochem. Soc. 2003, 150, A229. [Google Scholar] [CrossRef]
  37. Thaman, H.L.; Li, M.; Rose, J.A.; Narasimhan, S.; Xu, X.; Yeh, C.-N.; Jin, N.; Akbashev, A.; Davidoff, I.; Bazant, M.Z.; et al. Two-Stage Growth of Solid Electrolyte Interphase on Copper: Imaging and Quantification by Operando Atomic Force Microscopy. ACS Nano 2025, 19, 11949–11960. [Google Scholar] [CrossRef] [PubMed]
  38. Putra, R.P.; Matsushita, K.; Ohnishi, T.; Masuda, T. Operando Nanomechanical Mapping of Amorphous Silicon Thin Film Electrodes in All-Solid-State Lithium-Ion Battery Configuration during Electrochemical Lithiation and Delithiation. J. Phys. Chem. Lett. 2024, 15, 490–498. [Google Scholar] [CrossRef] [PubMed]
  39. Guo, L.; Thornton, D.B.; Koronfel, M.A.; Stephens, I.E.L.; Ryan, M.P. Degradation in Lithium Ion Battery Current Collectors. J. Phys. Energy 2021, 3, 032015. [Google Scholar] [CrossRef]
  40. Lee, H.; Cho, J.-J.; Kim, J.; Kim, H.-J. Comparison of Voltammetric Responses over the Cathodic Region in LiPF6 and LiBETI with and without HF. J. Electrochem. Soc. 2005, 152, A1193. [Google Scholar] [CrossRef]
  41. Soto, F.A.; Ma, Y.; Martinez de la Hoz, J.M.; Seminario, J.M.; Balbuena, P.B. Formation and Growth Mechanisms of Solid-Electrolyte Interphase Layers in Rechargeable Batteries. Chem. Mater. 2015, 27, 7990–8000. [Google Scholar] [CrossRef]
  42. Domack, A.; Prucker, O.; Rühe, J.; Johannsmann, D. Swelling of a Polymer Brush Probed with a Quartz Crystal Resonator. Phys. Rev. E 1997, 56, 680–689. [Google Scholar] [CrossRef]
  43. Johannsmann, D.; Petri, J.; Leppin, C.; Langhoff, A.; Ibrahim, H. Particle Fouling at Hot Reactor Walls Monitored In Situ with a QCM-D and Modeled with the Frequency-Domain Lattice Boltzmann Method. Results Phys. 2023, 45, 106219. [Google Scholar] [CrossRef]
  44. Plank, C.; Rüther, T.; Jahn, L.; Schamel, M.; Schmidt, J.P.; Ciucci, F.; Danzer, M.A. A Review on the Distribution of Relaxation Times Analysis: A Powerful Tool for Process Identification of Electrochemical Systems. J. Power Sources 2024, 594, 233845. [Google Scholar] [CrossRef]
Figure 1. A CAD model of the electrochemical cell used for the combined EQCM-D and EIS experiments. The inner compartment is filled with electrolyte during the experiment and closed off with a gastight lid [28].
Batteries 11 00273 g001
Figure 2. Results of the SEI formation on Cu (a) and amorphous C (b) with the slow formation procedure. (Top panel) working electrode potential evolution during the formation, with position of EIS measurements highlighted as colored vertical lines. (Middle panel) current density (j) and charge of the WE, with EIS measurements visible as current spikes. (Bottom panel) negative resonance frequency shift (−Δf) and half-bandwidth shift (ΔΓ) as determined by EQCM-D. Highlighted are mpe values of relevant sections and the apparent SEI mass and thickness.
Batteries 11 00273 g002
Figure 3. Results of the SEI formation on Cu (a) and amorphous C (b) with the fast formation procedure. (Top panel) working electrode potential evolution during the formation, with position of EIS measurements highlighted as colored vertical lines. (Middle panel) current density and charge of the WE, with EIS measurements visible as current spikes. (Bottom panel) negative resonance frequency shift and half-bandwidth shift as determined by EQCM-D. Highlighted are mpe values of relevant sections and the apparent SEI mass and thickness.
Batteries 11 00273 g003
Figure 4. Results of the SEI formation on Cu (a) and amorphous C (b) with the slow formation procedure and the addition of 2 vol.% VC to the electrolyte. (Top panel) working electrode potential evolution during the formation, with position of EIS measurements highlighted as colored vertical lines. (Middle panel) current density and charge of the WE, with EIS measurements visible as current spikes. (Bottom panel) negative resonance frequency shift and half-bandwidth shift as determined by EQCM-D. Highlighted are mpe values of relevant sections and the apparent SEI mass and thickness.
Batteries 11 00273 g004
Figure 5. Fast SEI formation and consecutive oxidation procedure on amorphous carbon (extension of Figure 3b). (Top panel) working electrode potential evolution during the formation. (Middle panel) current density and charge of the WE. (Bottom panel) negative resonance frequency shift and half-bandwidth shift as determined by EQCM-D.
Batteries 11 00273 g005
Figure 6. The Nyquist plots of (a) the slow SEI formation on Cu and (b) the slow SEI formation on amorphous carbon. The respective insets show the high-frequency part of the impedance data separately.
Batteries 11 00273 g006
Figure 7. The effective SEI formation resistance RSEI,eff progression resulting from the various SEI formation procedures on (a) Cu substrate and (b) amorphous carbon.
Batteries 11 00273 g007
Disclaimer/Publisher’s Note: The statements, opinions and data contained in all publications are solely those of the individual author(s) and contributor(s) and not of MDPI and/or the editor(s). MDPI and/or the editor(s) disclaim responsibility for any injury to people or property resulting from any ideas, methods, instructions or products referred to in the content.

