Article

Coupling Performance of Cored and Coreless Circular Coils for WPTS: Experimental Validation Under Misalignment Scenarios

by
Ahmed M. Ibrahim
and
Osama A. Mohammed
*
Energy Systems Research Laboratory, Department of Electrical and Computer Engineering, Florida International University, Miami, FL 33174, USA
*
Author to whom correspondence should be addressed.
Batteries 2025, 11(7), 257; https://doi.org/10.3390/batteries11070257
Submission received: 5 June 2025 / Revised: 1 July 2025 / Accepted: 7 July 2025 / Published: 10 July 2025

Abstract

Wireless power transfer systems (WPTSs) are critical for efficient and reliable electric vehicle (EV) charging, but challenges such as misalignment and coupling variations limit their performance. This paper addresses a proposed design approach for WPTSs by optimizing the following two widely used coil types: ring and spiral circular coils. An analytical estimation of inductive characteristics is conducted to establish a foundation for system optimization. The study framework focuses on coil geometrical parameters and relative placements, accounting for horizontal, vertical, and angular misalignments to ensure a consistent performance under varying coupling conditions. COMSOL simulations accurately determine inductive parameters, validating the theoretical analysis for a 200 W charging coil prototype. Experimental investigations of coupling coefficients for coreless and cored charging pads highlight the superior performance of the Square I-Core-based spiral winding configuration in enhancing the coupling coefficient while ensuring that it remains below the critical value required for stable system operation. The agreement between the analytical results, simulation data, and experimental findings underscores the reliability of the proposed design approach.

1. Introduction

Wireless power transfer (WPT) systems have become more viable in today’s applications, especially with the use of electric vehicles (EVs). The design of coils and magnetic cores plays a pivotal role in enhancing the performance and alignment flexibility of WPTSs [1]. Coupling coils are generally classified into the following two categories: polarized and non-polarized pads. Non-polarized pads, such as circular and rectangular pads, generate only a vertical flux component, while polarized pads, such as double-D pads, double-D quadrature pads, and bipolar pads, produce both vertical and horizontal flux components, offering a wider range of coil configurations [2]. Magnetic cores, particularly ferrite-based materials, are commonly integrated with primary and secondary coils to concentrate flux and reduce leakage, thereby improving the coupling coefficient. This enhancement reduces the coil turns required to reach a target inductance, contributing to compact and efficient designs. However, the trade-offs between cored and coreless systems, such as core losses, weight, and cost, necessitate a systematic evaluation, especially under misaligned conditions.
In practical EV charging scenarios, misalignment is not a single-axis issue, but a complex, three-dimensional problem. Vertical misalignment occurs due to variations in vehicle suspension load, tire pressure, and the manufacturing differences between vehicle models. Horizontal misalignment (both lateral and longitudinal) is the most common challenge, arising directly from driver parking errors. Finally, angular misalignment is introduced when parking on uneven surfaces, inclines, or ramps. Since a robust WPT system must function reliably under any combination of these real-world conditions, it is insufficient to analyze only one offset type. Therefore, a comprehensive investigation into system performance under vertical, horizontal, and angular misalignments is critical for developing commercially viable and user-friendly EV charging solutions [3].
The recent literature has explored various analytical and numerical methods for calculating self-inductance and mutual inductance across various coil geometries. For instance, the researchers in [4] derived precise expressions for the self-inductance and mutual inductance of planar spiral coils using Euler angles, accommodating dense and sparse winding configurations. Their results, validated through simulations and experiments, demonstrated their approach’s superiority over traditional approximation methods. Similarly, a semi-analytical method based on the Biot–Savart Law was proposed in [5] to simplify the calculation process by avoiding complex integrals and offering a straightforward and efficient solution. In [6], a method for calculating the mutual inductance between thin disk coils was introduced, which accounted for the gaps between coil turns and wire diameters without relying on coefficients or complex integrals. Additionally, ref. [7] presented a simplified approach inspired by the Archimedean spiral for calculating mutual inductance across various coaxial and non-coaxial distances, catering to diverse coil geometries.
Further advancements in inductance calculation methods were explored for rectangular coil pairs in WPTSs, as detailed in [8]. This study highlighted the importance of accurate self-inductance and mutual inductance calculations for optimizing WPT designs, experimentally validating the results. In [9], self-inductance for spiral coils was modeled using parameters like coil radius and wire diameter. At the same time, mutual inductance was calculated using Neumann’s integral, incorporating alignment and misalignment factors validated through 3D electromagnetic simulations and experiments. Moreover, a novel analytical approach leveraging magnetic vector potential was presented in [10], where the flux generated by the primary coil and linking the secondary was determined through the line integral of the magnetic vector potential over the filament’s half-turn path, showcasing its effectiveness for precise mutual inductance estimation.
Analytical methods for inductance calculation have also advanced significantly. The authors in [11] extended the truncated region eigenfunction expansion method to accurately calculate mutual inductance under various misalignments, incorporating bilateral magnetic shields for improved accuracy. In [12], high-temperature superconducting coils were modeled for high-power, high-efficiency WPT systems, employing a hybrid analytical–numerical approach validated via finite element simulations and experiments. Similarly, ref. [13] proposed an analytical method using Neumann’s integral and Taylor expansion to calculate mutual inductance under misalignments, showing agreement with FEM simulations and experimental results. The authors in [14] emphasized magnetic shielding to enhance mutual inductance and reduce flux leakage, using coordinate transformation and electric field intensity methods for accurate calculations validated by FEM simulations. These studies collectively address the critical aspects of WPT system design, providing innovative solutions to improve performance and efficiency under varying operational conditions.
The design and experimental validation of WPTSs, particularly in addressing self-inductance and mutual inductance calculations under misalignment conditions, is an active area of research. The authors in [15] explored the challenges in WPT for EV charging, focusing on issues like power pad misalignment and compensation topology. Using tools like Ansys Maxwell®3D and MATLAB®/Simulink, they analyzed a rectangular power pad’s performance, evaluating parameters like self-inductance, mutual inductance, and coupling coefficients under various misalignment conditions. The study also proposed a series compensation model to estimate output power and efficiency. Similarly, the authors in [16] proposed an integrated coupler for hybrid WPT systems to improve misalignment tolerance, achieving an 82.7% power transfer efficiency with a 40% misalignment through frequency tracking and resonant state regulation. Other studies, like [17], have examined mutual couplings in planar circular coils, highlighting efficiency variations based on coil distances but lacking detailed inductance analysis under misalignment scenarios. In contrast, ref. [18] introduced a misalignment-tolerant modular WPT system with rectangular and orthogonal solenoidal compensation coils, achieving stable voltage outputs with minimal fluctuations.
Further contributions include advancements in compact WPT systems and magnetic field enhancement techniques. In [19], the researchers addressed space limitations by developing a method for adding decoupled coils to increase power capacity, validated by a 3 kW prototype with an impressive 94% system efficiency. Similarly, ref. [20] proposed a finite-element-based coil optimization to enhance magnetic flux density and minimize leakage, achieving a 92% efficiency with a misalignment tolerance of up to 200 mm. Meanwhile, ref. [21] tackled stray magnetic field issues by developing a dual-band coil array with high-order circuit designs, successfully reducing harmonic leakage and achieving effective shielding. To address compatibility issues among manufacturers, ref. [2] introduced self-adaptive decoupled coils capable of tolerating multiple coil types (unipolar, bipolar, and quadrupole), with validated prototypes demonstrating an efficient misalignment tolerance.
While advanced misalignment compensation techniques exist, they often involve trade-offs in cost and complexity, and much of the supporting research is simulation-based [3]. This leaves a critical gap in experimental data for the foundational performance of cored versus coreless circular coils under combined, real-world misalignments. Extending our earlier simulation-based analyses [22,23,24], this study addresses that gap by presenting a comprehensive experimental validation. A 200 W prototype is developed to assess real-world coupling performance under vertical, horizontal, and angular offsets. A structured, stepwise design methodology is adopted to optimize coil parameters, such as the number of turns, and meet targeted inductance values while ensuring that the coupling coefficient remains below the critical threshold to prevent operational instabilities. This approach facilitates the systematic evaluation of incorporating a square I-core to enhance magnetic coupling. The influence of coil geometry on system robustness is thoroughly analyzed, and the proposed methodology is validated through the strong agreement between analytical models, finite element simulations (COMSOL Multiphysics, Ver 6.2), and experimental hardware testing, confirming its reliability for practical EV charging applications.
The rest of the sections are organized as follows: Section 2 presents the proposed design methodology for spiral and ring coil structures. Section 3 details the analytical estimation of key inductive characteristics. Section 4 provides the simulation results and discusses parameter variations, while Section 5 describes the experimental validation conducted under all misalignment scenarios. Finally, Section 6 summarizes the main findings and conclusions of the study.

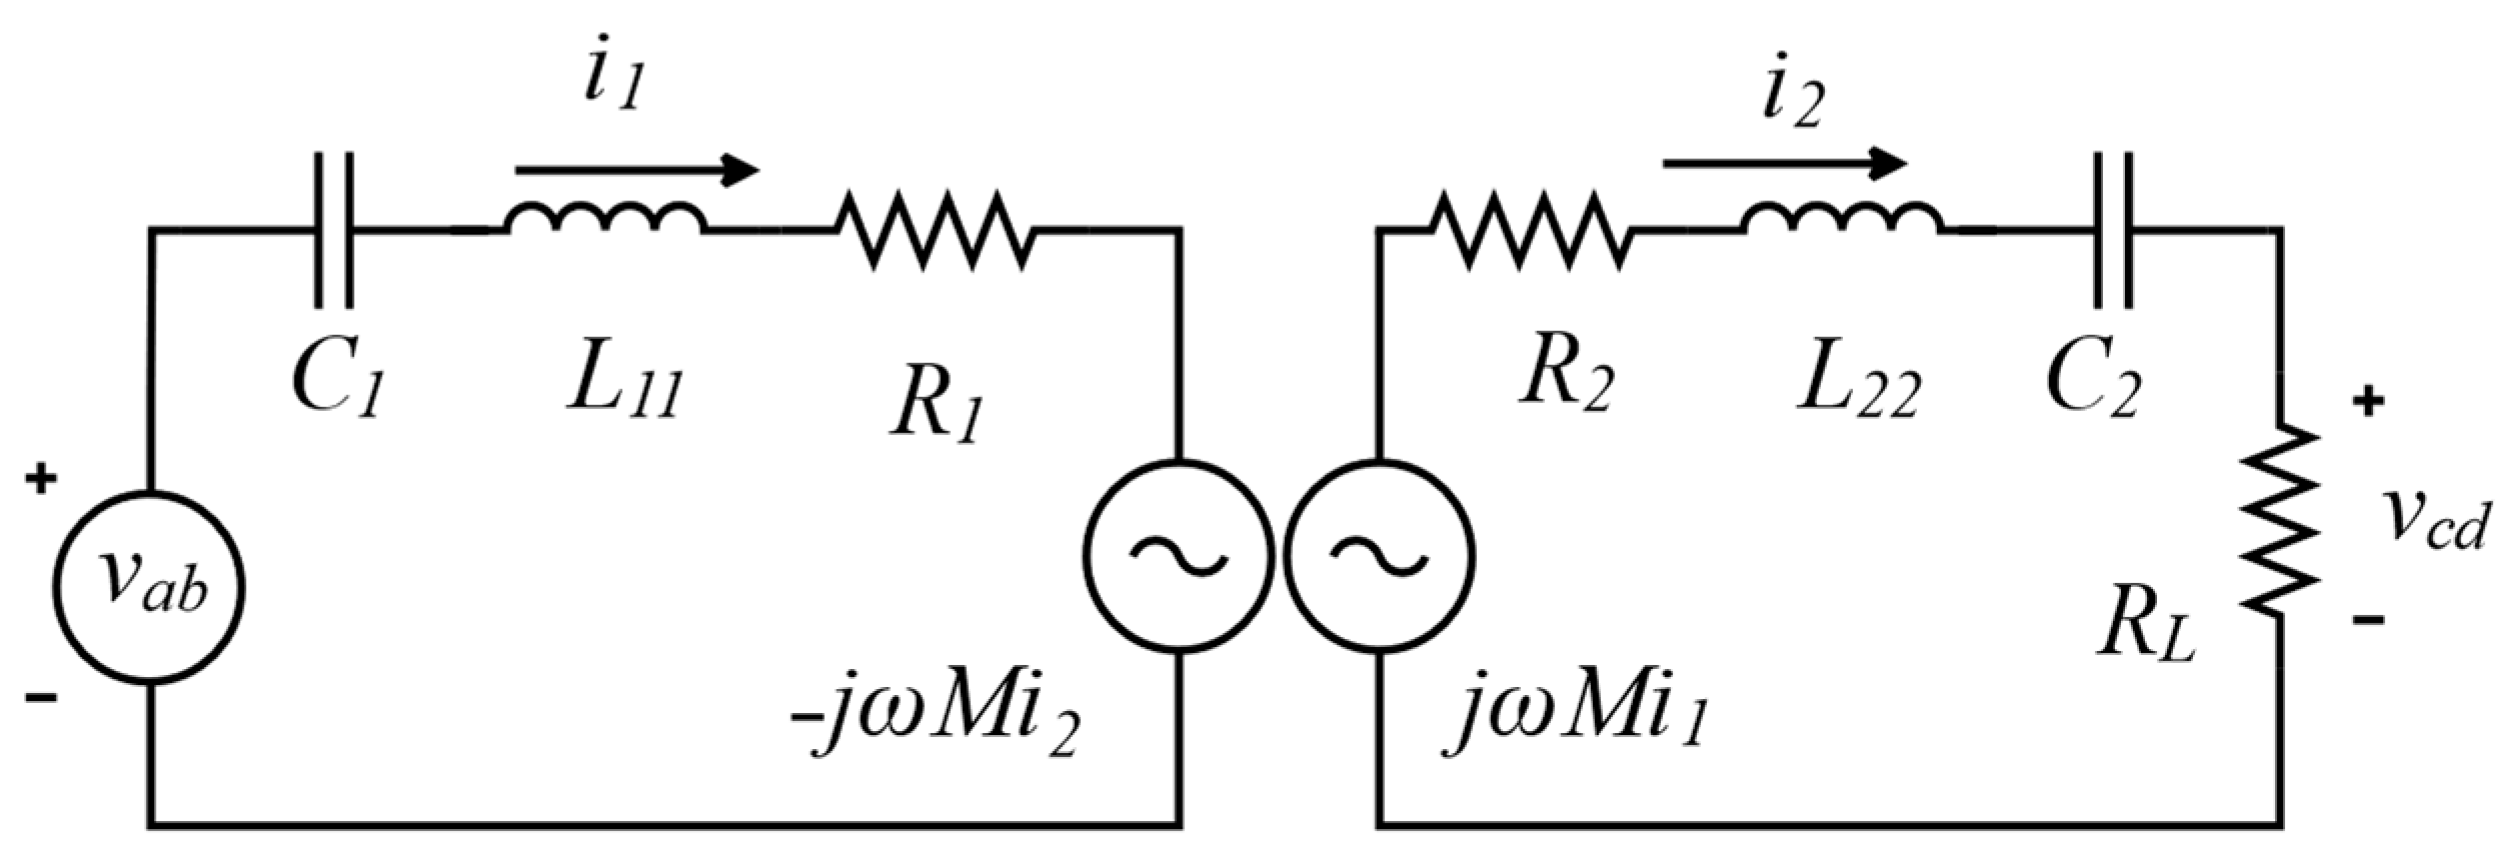
2. Coil Design Considerations

A resonant inductive power transfer system is built on a double-tuned circuit configuration incorporating two capacitors, as shown in Figure 1. The primary capacitor is specifically chosen to minimize the VA rating of the series–series (SS) resonant system, a common topology in WPTSs. This configuration often experiences multiple zero-phase angle frequencies, known as bifurcation or pole splitting. Bifurcation significantly influences system performance by improving efficiency and power transfer capability [25]. However, to prevent bifurcation in the designed system, the coupling coefficient ( K ) must remain below the critical coupling coefficient ( K c ). This critical value is defined by (4), which shows its dependence on the load quality factor ( Q L ).
The design of the WPTS begins with establishing the key electrical parameters for the SS topology, as illustrated in the circuit diagram in Figure 1. The system’s target specifications determine the necessary component values using Equations (1)–(8). The variables for these equations are defined as follows:
  • P L : The target output power in Watts (W).
  • ν c d and ν a b : The RMS output and input voltages (V).
  • R L : The equivalent load resistance (Ω).
  • i 1 and i 2 : The RMS primary and secondary currents (A).
  • L 22 and L 22 : The self-inductances of the primary and secondary coils (H).
  • M : The mutual inductance between the coils (H).
  • C 1 and C 2 : The primary and secondary series compensation capacitances (F).
  • ω : The angular resonant frequency (rad/s), defined as 2 π f .
In the practical applications of a WPTS, the load’s quality factor typically ranges between 2 and 10, depending on the specific requirements for power transfer efficiency and load impedance characteristics. The proposed study selects a quality factor value of four as a representative condition, with a corresponding coupling coefficient ( K ) of 0.2. This value ensures that the system operates below the critical coupling coefficient ( K c ), calculated to be 0.248. The choice of K and Q L aims to balance efficient power transfer while preventing the onset of bifurcation phenomena, which can degrade system stability and performance.
The system is designed to operate at a resonant frequency of 85 kHz, adhering to the SAE J2954 standard for WPTSs in EV applications [26]. At this frequency, skin and proximity effects become significant, increasing the AC resistance of the coils and potentially reducing system efficiency. Performance at other frequencies can be qualitatively predicted based on electromagnetic behavior. At higher frequencies, while the coupling coefficient may slightly increase due to enhanced field interaction, the severity of AC losses also increases and core losses in magnetic materials become more prominent, posing thermal and efficiency challenges. At lower frequencies, resistive losses are reduced, but magnetic coupling may decrease, and the need for larger inductive components can negatively impact system compactness and dynamic response. Consequently, deviation from the 85 kHz operating point would require re-optimizing the coil design, compensation network, and control strategy to maintain a high efficiency and stable operation across varying alignment conditions.
To mitigate these losses, Litz wire consists of multiple thin, individually insulated strands woven to distribute the current evenly across its cross-section. This structure ensures that the current density is uniform, thereby minimizing resistive losses. The diameter of each strand in the Litz wire is selected to be less than twice the skin depth ( δ ) calculated in Equation (9) [27], where ρ represents the resistivity of copper, f is the operating frequency, and μ o is the permeability of free space. By ensuring that the strand diameter is less than 2 δ , the design effectively minimizes the resistive losses associated with high-frequency operation [27]. This approach enhances the efficiency and reliability of the WPTS while meeting industry standards for performance. This careful selection of wire type and strand dimensions is a critical step in the design process, ensuring that the system achieves an optimal performance under the specified operating conditions, as shown in Figure 2. Furthermore, Figure 2 emphasizes the importance of selecting the optimum number of turns for the ring and spiral coils to achieve the desired inductive characteristics. This step is crucial for optimizing the coupling configuration and ensuring efficient power transfer under the specified operating conditions. After this design phase, the inductive characteristics of coils are validated analytically and using finite element method (FEM) simulations, as discussed in Section 4.
R L = ν c d 2 P L
i 1 = P L ν a b
i 2 = ν c d R L
K c = 1 Q L 1 1 4 Q L 2
L 22 = Q L R L ω
M = i 2     R L i 1     ω
L 11 = M 2 L 22     K 2
ω = 1 L 11 C 1 = 1 L 22 C 2
δ = ρ π f μ o

3. Analytical Estimation of Inductive Characteristics

The magnetic properties of the WPT coils are evaluated using the fundamental principles of electromagnetic theory, assuming that both transmitter and receiver coils exhibit uniform electromagnetic characteristics. This approach simplifies the analysis by considering a constant magnetic flux density across the entire coil area and perpendicular magnetic field lines within the coil geometry. This uniformity enables accurate ring and spiral coil configuration modeling for inductive power transfer systems.

3.1. Self-Inductance of Ring Coils

The self-inductance of the coils is analyzed by considering two coupled ring coils arranged in a rectangular configuration. Each coil is characterized by its wire diameter D w , as well as the dimensions of the primary and secondary windings, including their widths ( h p and h s ) and lengths ( a and b ). The number of turns for the primary and secondary coils is represented by N 1 and N 2 , respectively. Furthermore, as illustrated in Figure 3, the average radii of the primary and secondary coils are calculated using R p = 0.5 R 1 + R 2 for the primary coil and R s = 0.5 R 3 + R 4 for the secondary coil.
Using the above assumptions and configurations, the self-inductance of the primary and secondary coils is determined by applying the Wheeler formula [28], as shown in (10). This evaluation method provides a practical framework for evaluating and optimizing coil design for optimal turn numbers, as illustrated in Figure 2.
L R i n g = 31.4961 R p × N 1 2 6 R p + 9 a + 10 h p

3.2. Self-Inductance of Spiral Coils

Spiral coils are distinct from ring coils, consisting of a single layer of turns, as illustrated in Figure 4. Unlike ring coils, the turns in spiral coils are spaced apart, ensuring minimal overlap and reducing proximity effects. This unique arrangement allows for efficient power transfer and is often used in WPTSs to simplify coil fabrication and improve coupling under misalignment conditions. The uniform spacing of turns in spiral coils also minimizes parasitic effects and improves magnetic field uniformity.
This study evaluates the self-inductance of two coupled spiral coils using two well-established methods. The first method utilizes the Wheeler formula [28], as given in (11), which provides a straightforward analytical approach for estimating inductance based on geometric parameters. The second method utilizes the approximation developed by Mohan [29], as shown in (12), which incorporates additional factors such as the coil shape and fill ratio to enable more accurate calculations.
L S p i r a l = 31.4961 R p × N 1 2 8 R p + 11 c
L S p i r a l = μ o N 1 2 C 1 R p [ ln C 2 / ρ + C 3 ρ + C 4 ρ 2 ]
In (12), the coefficients C 1 = 1.00 , C 2 = 2.46 ,   C 3 = 0.00 , and   C 4 = 0.20 are specific to the circular coil geometry. Additionally, the fill ratio, ρ , is defined as ρ = ( R 2 R 1 + D w ) / ( R 1 + R 2 ) .   These parameters represent the proportion of the coil area occupied by the wire, directly affecting both the inductance and coupling performance. By comparing these two methods, a comprehensive assessment of the self-inductance of spiral coils is achieved, facilitating optimal coil design.

3.3. Mutual Inductance of Ring Coils

Accurate calculation of the mutual inductance between coupled coils is fundamental for achieving the maximum efficiency and performance in WPTSs. Utilizing the filament method, the mutual inductance between two coaxial ring coils separated by a distance ccc can be mathematically expressed as shown in (13) [30]. For precise computation, the cross-sectional area of the primary coil is discretized into ( 2 M 1 + 1 ) × ( 2 N 1 + 1 ) cells, while the secondary coil is subdivided into ( 2 M 2 + 1 ) × 2 N 2 + 1 cells, as shown in Figure 3a. This detailed subdivision allows for considering minor geometric variations, thereby enabling the highly accurate modeling of mutual inductance.
M R i n g = N 1 N 2   ( 2 M 1 + 1 ) ( 2 N 1 + 1 ) ( 2 M 2 + 1 ) ( 2 N 2 + 1 ) × g = M 1 M 1 h = N 1 N 1 q = M 2 M 2 l = N 2 N 2 M i j ( g , h , q , l )
where M i j ( g , h , q , l ) is calculated as follows:
M i j ( g , h , q , l ) = μ 0 R p ( h ) R s ( l ) 2 k k K k 2 k E ( k )
Here, k = 2 R p ( h ) R s ( l ) ( R p ( h ) + R s ( l ) ) 2 + ( d ( g , q ) ) 2 , and the radii of the primary and secondary coils are defined as follows:
R p h = R p + h p 2 N 1 + 1 h
R s l = R s + h s 2 N 2 + 1 l
The distance between the coil planes is expressed as follows:
d g , q = c a 2 M 1 + 1 g + b 2 M 2 + 1 q
The parameters h p and h s define the effective thicknesses of the primary and secondary coils, respectively, as follows:
h p = R 2 R 1 + D w
h s = R 4 R 3 + D w
Additionally, K k and E k represent the complete elliptic integrals of the first and second kinds, respectively, and are defined as follows:
K k = 0 π / 2 ( 1 k 2 sin 2 θ ) 1 / 2 d θ
E k = 0 π / 2 ( 1 k 2 sin 2 θ ) 1 / 2 d θ

3.4. Mutual Inductance of Spiral Coils

The mutual inductance of planar spiral coils can be accurately evaluated using methods derived from Neumann’s integral formula, as presented in [7]. This approach applies the integral in a cylindrical coordinate framework and leverages numerical techniques to determine the mutual inductance for a wide range of coil geometries and spatial configurations, including both coaxial and non-coaxial alignments. A compact, approximate formula has also been developed to improve computational efficiency while retaining a high accuracy. This alternative expression simplifies the mutual inductance calculation and achieves an error margin of 0.038% when the axial separation between the coils is less than their inner radius. The approximate formula for mutual inductance is given in Equation (22).
M S p i r a l = i = 1 N 1 j = 1 N 2 M i j  
where the mutual inductance between individual turns, M i j , is given by the following:
M i j = μ 0 π R i 2 R j 2 2 R i 2 + R j 2 + c 2 3 / 2 1 + 15 32 γ i j 2 315 1024 γ i j 4
The parameters R i and R j denote the radii of the i -th and j -th turns of the primary and secondary coils, respectively, and are defined as follows:
R i = R 2 t d ( i 1 )
R j = R 4 t d ( j 1 )
where t d is the turn-to-turn spacing between adjacent conductors. The parameter γ i j is given by the following:
γ i j = 2 R i R j R i 2 + R j 2 + c 2
This approximated approach significantly simplifies the computational process while providing results closely aligned with those obtained from Neumann’s formula. The combination of the numerical method described in [7] and the compact approximation in (22) offers flexible and accurate options for evaluating the mutual inductance of spiral coils in various configurations.

3.5. Coupling Coefficient

The coupling coefficient, K , is a critical parameter for assessing the performance of inductive coupling systems, especially in WPTSs. It is defined as follows:
K = M L 11 L 22
where L 22 is the mutual inductance and L 11 and L 22 are the self-inductances of the primary and secondary coils, respectively.
Equations (10)–(27) provide a comprehensive framework for estimating the inductive characteristics of coil systems by considering their geometric dimensions and spatial configuration. These analytical expressions reduce the dependence on computationally intensive numerical simulations, enabling the rapid prediction and optimization of key design parameters for WPTSs.

4. Parameter Variation Analysis

This section employs the COMSOL Multiphysics 6.2 software to accurately evaluate the inductive parameters of the coil configurations, following the methodology illustrated in Figure 2. The simulation results provide a robust foundation for validating the theoretical framework discussed in the previous section. To ensure that the design parameters satisfy the system requirements summarized in Table 1, the advanced simulation capabilities of COMSOL are utilized to gain comprehensive insights into the coils’ magnetic coupling and inductive behavior.

4.1. Simulation Parameters

The coils were modeled in COMSOL Multiphysics using a 2D axisymmetric model for analytical studies and verifications, as shown in Table 2 and Table 3. Subsequently, a complete 3D model was used to analyze changes in geometry parameters and for vertical, horizontal, and angular misalignment analyses to capture broken symmetry. A Magnetic Insulation boundary condition ( n H = 0 ) was applied to the outer boundary of a large spherical air domain with a radius of 1 m to simulate an open environment. A physics-controlled mesh was employed, with a finer triangular mesh automatically generated in the regions of the conductors and the surrounding air gap to accurately capture field gradients. The minimum and maximum mesh element sizes were 0.25 mm and 74 mm, respectively. The AC/DC module’s ‘Magnetic Fields (mf)’ interface was utilized with a frequency domain study at an operating frequency of 85 kHz. The self-inductance and mutual inductance were calculated based on the current injected into the primary coil for the homogenized multi-turn primary and secondary coils.

4.2. Validation of the Proposed Method

The effectiveness of the proposed methodology for determining the inductive parameters of wireless power transfer coils is comprehensively validated through practical measurements, analytical calculations, and finite element simulations. Table 2 and Table 3 present a detailed comparison of the key inductive parameters for both ring and spiral coil structures, as depicted in Figure 3 and Figure 4. This comparative analysis ensures that the evaluation encompasses real-world performance, theoretical predictions, and simulation-based insights.
In Table 2 and Table 3, the second column lists the required inductive values derived from the analytical expressions given in (1)–(9). These equations establish the fundamental design specifications for the 200 W WPTS under investigation. For all coil configurations, the outer diameter is fixed at 400 mm. To maintain a coupling coefficient of 0.2, the axial separation between the coils is carefully adjusted, resulting in an optimal distance ( d ) of 105 mm for the ring coil and 131 mm for the spiral coil. This distinction highlights the inherently stronger magnetic coupling achievable with spiral coils compared to ring coils, a finding further corroborated in subsequent sections.
The required number of turns for both the primary and secondary coils is determined analytically using the design formulations provided in Equations (10) and (11). The optimal number of turns for the ring coil is 30.007 for the primary and 9.155 for the secondary. For the spiral coil, these values are 42.923 and 11.093, respectively. In practical implementation, these values are rounded to the nearest integer number, yielding 30 and 9 turns for the ring coil and 43 and 11 turns for the spiral coil.
It is important to note that the actual self-inductance and mutual inductance values obtained for these integer turn numbers show slight deviations from the analytically required values, as detailed in Table 2 and Table 3. Table 2 shows close agreement between the required, analytical, and FEM-2D-simulated values. The primary self-inductance values, L 11 , calculated analytically and via FEM-2D, are within 0.5% of the required values. In contrast, the secondary self-inductance, L 22 , and mutual inductance show a slightly higher but acceptable deviation. The coupling coefficient also aligns closely with the target value. These results confirm the accuracy and reliability of the analytical and simulation methods for practical ring coil design in WPTSs.
Table 2. Validation of 200 W ring coil parameters.
Ring CoilRequired Values Based on (1)–(9)Analytical (10), (13), (27)Error %FEM-2DError %
L 11 (µH)800.982800.6310.0438801.07570.0116
L 22 (µH)81.44878.7993.25282.66291.4916
M (µH)51.08352.482.73451.57940.9705
K 0.20.20894.4690.200440.220
Table 3 comprehensively compares the required, analytically calculated, FEM-2D-simulated, and experimentally measured inductive parameters. Across all approaches, the L 11 , L 22 , and M values show strong agreement with the required design targets, with most deviations remaining well below 1%. The highest deviation for any parameter remains under 1.5%, confirming the high accuracy of both the analytical formulations and simulation techniques. The coupling coefficient ( K ) is also consistently close to the target value of 0.2 across all methods.
Table 3. Validation of 200 W spiral coil parameters.
Spiral CoilRequired Values Based on (1)–(9)Analytical (11), Ref. [7]Error %Analytical (12), (22)Error %FEM-2DError %ExperimentationError %
L 11 (µH)800.982802.6530.2085794.03230.867804.01980.37927950.7469
L 22 (µH)81.44880.36511.329582.61381.431281.19020.3166810.5501
M (µH)51.08351.0290.105351.1010.034251.05260.060750.251.6319
K 0.20.20090.460710.19950.24030.19980.09140.1980.9898
Spiral coils, in particular, show a slightly improved accuracy for self-inductance and coupling coefficient calculations, attributable to their inherently higher magnetic coupling. This comprehensive comparison underscores the accuracy and practicality of the proposed approach and offers valuable insights into the trade-offs between analytical design and real-world implementation. These findings validate the methodology for optimizing coil geometries and enable the precise estimation of inductive parameters for a circular winding configuration.

4.3. Examination of Inductive Characteristics for Coreless Coils

The following subsections investigate the inductive characteristics of two identical coreless coils, focusing on identifying the geometric parameters and spatial arrangements that enhance the coupling coefficient. This analysis utilizes the geometric parameter ranges summarized in Table 4, which explains the key variables influencing inductive performance.

4.3.1. Effect of Turn Number and Turn Distance

Figure 5, Figure 6 and Figure 7 illustrate how variations in the number of turns ( N ) and the turn-to-turn distance ( t d ) influence the self-inductance and mutual inductance of both the ring and spiral coils. Figure 5 presents the relationship between inductance and turn number for ring coils at different coil separations. The results show that both self-inductance and mutual inductance increase nonlinearly, approximately with the square of the number of turns, consistent with (10) and (13). Notably, self-inductance remains largely unaffected by changes in the coil separation, while mutual inductance decreases as the axial distance between the coils increases, reflecting reduced magnetic coupling.
In Figure 6, a similar analysis is extended to spiral coils, with a fixed turn spacing of t d = 2 mm. Spiral coils exhibit lower self-inductance and mutual inductance values than ring coils for the same number of turns. This reduction is primarily attributed to the diminished flux linkage within spiral geometries, where the inner turns enclose less area and, thus, contribute less to the overall inductance.
Figure 7 explores the effect of a varying turn spacing on a spiral coil with N = 30 turns and a coil separation of d = 100 mm. The self-inductance exhibits a pronounced decrease as the turn spacing increases due to reduced magnetic coupling between widely spaced turns. The mutual inductance also declines, though to a lesser extent, indicating a gradual reduction in magnetic coupling between primary and secondary coils as the conductor spacing grows. Overall, these results highlight the importance of optimizing turn number and spacing to maximize inductive performance in WPTSs.

4.3.2. Influence of Coil Placement and Misalignment on Coupling Coefficient

Figure 8, Figure 9 and Figure 10 illustrate the impact of vertical, horizontal, and angular misalignments on the coupling coefficient for ring and spiral coil arrangements, using the geometric parameters outlined in Table 4. Each coil has 30 turns for these analyses, and the spiral coil’s turn distance is zero.
Figure 8 demonstrates how the coupling coefficient decreases with an increasing vertical separation between coils. Across the entire range, spiral coils consistently achieve higher coupling coefficients, by 11–25%, compared to ring coils. This indicates that spiral coils are more effective in maintaining magnetic coupling and efficient power transfer despite changes in coil spacing, making them preferable in applications subject to vertical misalignments.
Figure 9 examines the effect of horizontal misalignment at a fixed coil distance of 100 mm. Initially, the spiral coils show a clear advantage, achieving coupling coefficients 6–24% higher than the ring coils. However, as misalignment increases, both coil types experience a sharp decrease in coupling. This pronounced sensitivity is a direct result of reduced magnetic flux linkage and the consequent change in mutual inductance. The profile of this decrease can be explained in stages. In the first portion, the coupling coefficient decreases as a growing portion of the flux generated by the primary coil no longer passes through the secondary coil. At a specific misalignment value, the coefficient becomes zero due to flux cancellation, where the positive and negative flux components passing through the secondary coil are perfectly balanced. Beyond this null point, the coupling becomes negative because the amount of flux entering the secondary coil from the bottom is less than that entering from the top, leading to a net reversal of flux linkage. This sensitivity, which results in a 77% decrease for spiral coils and a 69% decrease for ring coils by 200 mm, emphasizes the necessity for precise alignment in practical WPTS implementations.
Figure 10 explores the influence of angular misalignment at a fixed distance of 250 mm. Both coil types show an initial increase in coupling coefficient with angle, peaking near 40°, before decreasing at higher angles. The ring coil arrangement exhibits a greater relative increase (6%) compared to the spiral coil (3%). Despite this, spiral coils retain a higher absolute coupling coefficient throughout, confirming their resilience under varying angular misalignments.
In summary, spiral coils consistently demonstrate a superior coupling performance under all forms of misalignment, making them a robust choice for applications where precise coil alignment cannot always be guaranteed. Based on these results, subsequent analyses focus on spiral coils for further core structure design and practical implementation insights.

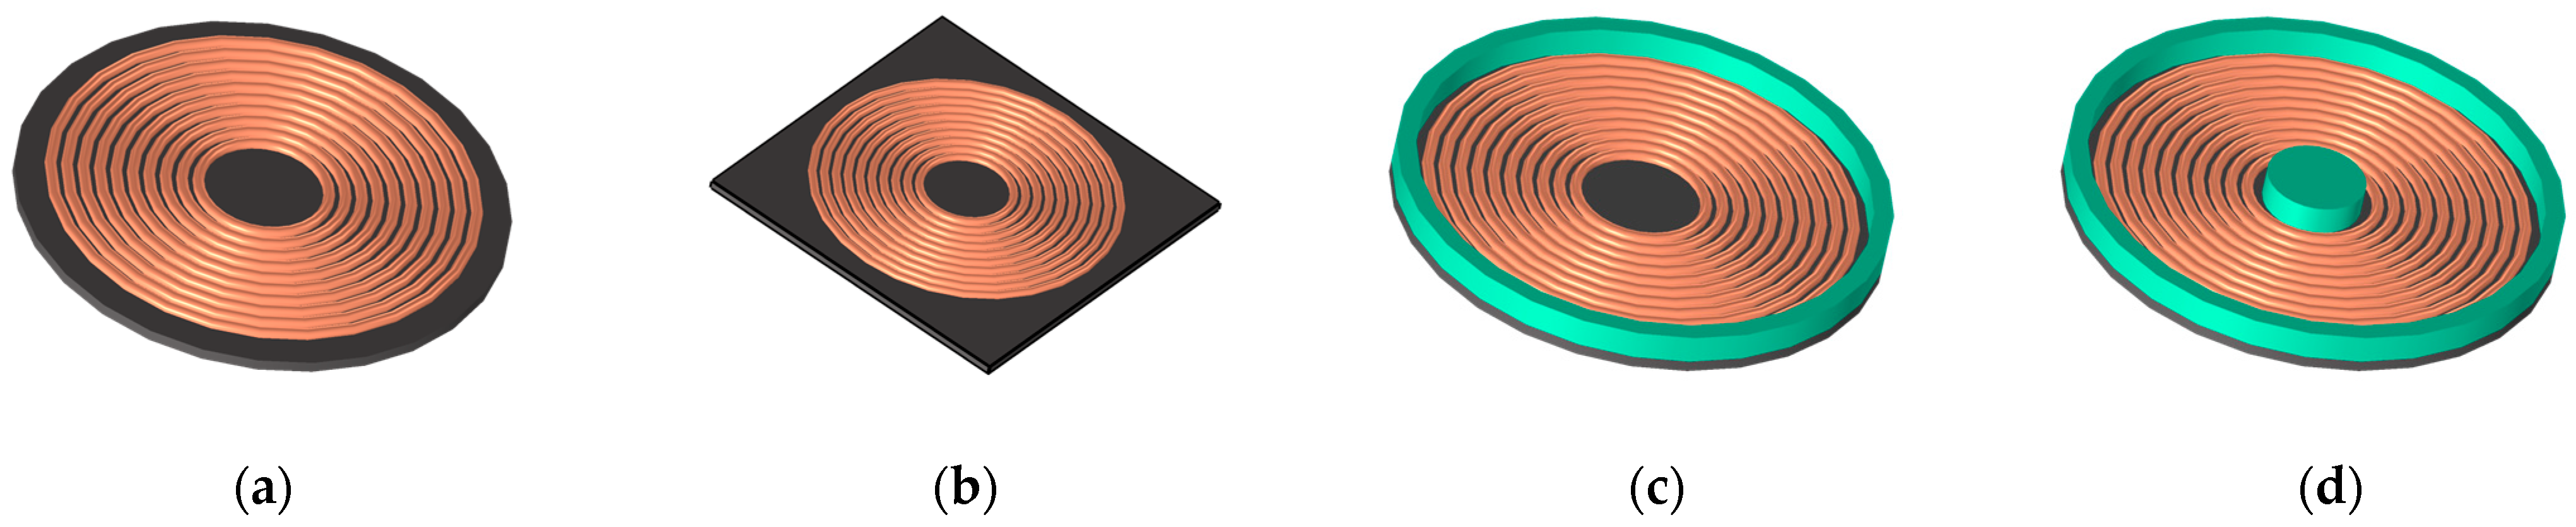
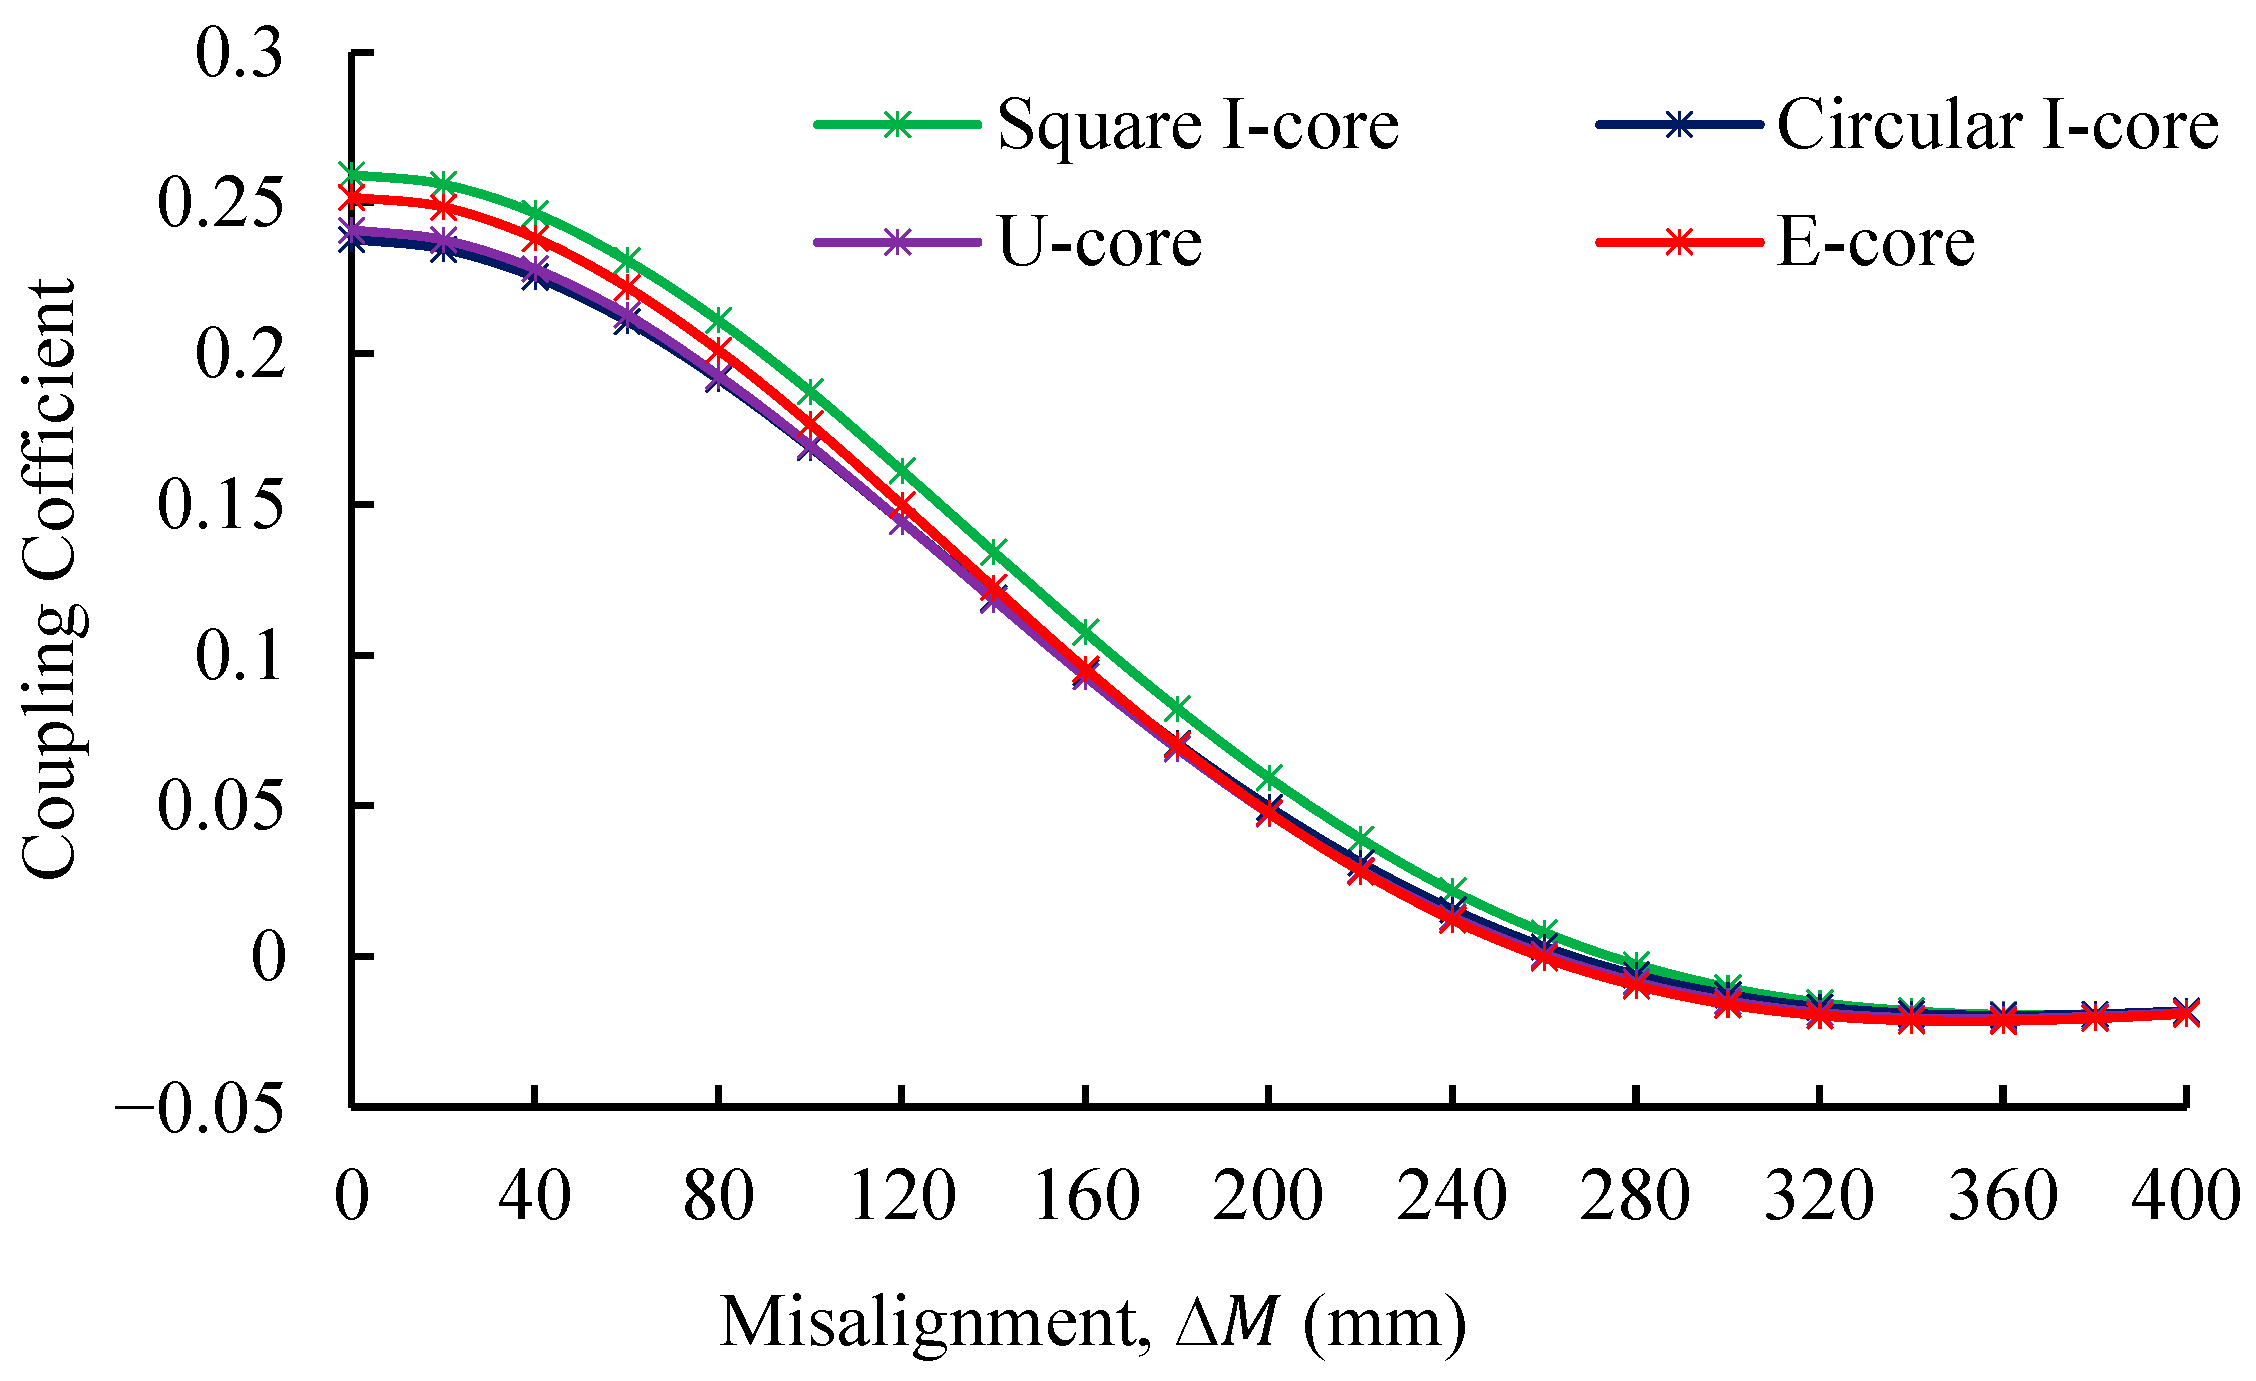
4.4. Examination of Inductive Characteristics for Cored Coils

Introducing magnetic cores significantly enhances the coupling coefficient while reducing the number of turns required to achieve the same inductance as coreless coil configurations. To evaluate the impact of cores on coupling performance, the same coreless spiral coil from the previous analysis is now integrated with the following four distinct core structures: Circular I-Core, Square I-Core, U-Core, and E-Core, all with a turn spacing of 2 mm. These cores, measuring 450 mm × 450 mm with a thickness of 5 mm and a magnetic permeability of μ r = 2200, are employed to enhance the coupling between the primary and secondary arrangements. The U-core and E-core are represented by a green rim with a height of 10 mm, as depicted in Figure 11.
While electromagnetic performance is a primary driver, a comprehensive analysis must also consider the practical implications of material volume, which directly impacts system weight and cost. Table 5 compares these factors for the four core geometries based on their specified dimensions. Focusing on the two planar designs, the Square I-Core is approximately 27% more voluminous and, therefore, heavier and more costly than the Circular I-Core. This reveals the central design trade-off: the superior coupling performance and misalignment tolerance demonstrated by the Square I-Core at larger distances come at a significant premium in material, weight, and budget, making the final selection dependent on specific application priorities.
As illustrated in Figure 12, the E-Core initially delivers the highest coupling coefficient for coil separations up to 120 mm. For example, at a 40 mm gap, the E-Core achieves a coupling coefficient of 0.8496, outperforming the Square I-Core and U-Core by 2.3% and 3.3%, respectively. However, as the coil distance increases, the Square I-Core surpasses the E-Core, demonstrating a coupling coefficient of 0.1759 at 200 mm, 4.3% higher than the E-Core and 8.3% greater than the Circular I-Core. The reason for this performance shift lies in the core geometries’ effect on the magnetic field. The superiority of the Square I-Core at greater distances is attributed to its ability to provide a more continuous and guided path for the magnetic flux. While the E-Core excels at flux concentration at close range, its shape is more susceptible to flux leakage as the air gap grows. The I-Core’s simpler structure better sustains the flux linkage, explaining its more robust performance over distance.
Table 5. Final weight and cost analysis based on calculated geometric volume.
Core TypeCalculated Geometric Volume (mm3)Total Estimated Weight (kg)Total Estimated Cost ($)
Circular I-Core794,99014.1 kg$263.94
Square I-Core1,012,50017.9 kg$335.79
U-Core930,28016.5 kg$308.82
E-Core1,065,80018.9 kg$353.64
To evaluate the system’s sensitivity to horizontal misalignment, the offset is varied from 0 to 400 mm in simulation steps of 20 mm. Figure 13 illustrates the resulting behavior of the coupling coefficient at a fixed vertical distance of 160 mm. The Square I-Core consistently delivers the highest coupling coefficient, maintaining a superior performance over the Circular I-Core, U-Core, and E-Core across all distances. At 0 mm misalignment, the Square I-Core achieves a coupling coefficient of 0.2595, 8.25% higher than the Circular I-Core, 7.09% higher than the Circular C-Core, and 2.89% higher than the E-Core. As misalignment increases, the coupling coefficients for all cores decrease, with the Square I-Core showing the most gradual decline. Beyond 260 mm misalignment, the coupling coefficients for all cores drop sharply, eventually reaching negative values. This phenomenon indicates that the flux entering the secondary coil from the bottom becomes zero or less than that from the top. These results highlight the superior robustness of the Square I-Core in maintaining coupling performance under horizontal misalignment conditions compared to the other core designs.
Figure 14 examines the coupling coefficient performance under angular misalignment ranging from 0° to 90° at a 250 mm distance between coils. The Square I-Core achieves its peak performance at 20°, with a coupling coefficient of 0.1116. At this point, it outperforms the Circular I-Core by 9.94%, the U-Core by 9.55%, and the E-Core by 5.92%. Beyond this peak, the coupling coefficients for all cores gradually decline as the angular misalignment increases, with the Square I-Core demonstrating a superior resilience. These findings underscore the Square I-Core’s ability to maintain a stronger coupling performance even under angular misalignment conditions.

5. Hardware and Experimentation Results

This section presents the experimental validation of four test scenarios using prototype coil structures developed according to the design methodology outlined in Figure 2 and the parameters listed in Table 1. The complete power electronics circuit used for testing, shown in Figure 15, consists of a DC voltage source that supplies a full-bridge inverter. This inverter excites the primary coil, transferring power wirelessly to the secondary coil. The secondary side is connected to a full-bridge diode rectifier to convert the AC power back to DC for the load. In each case, the coupling coefficient is experimentally measured using a precision LCR 600 m as the separation between the transmitter and receiver coils is varied. The measurements are then compared with results from finite element simulations and analytical calculations based on mutual inductance formulations.

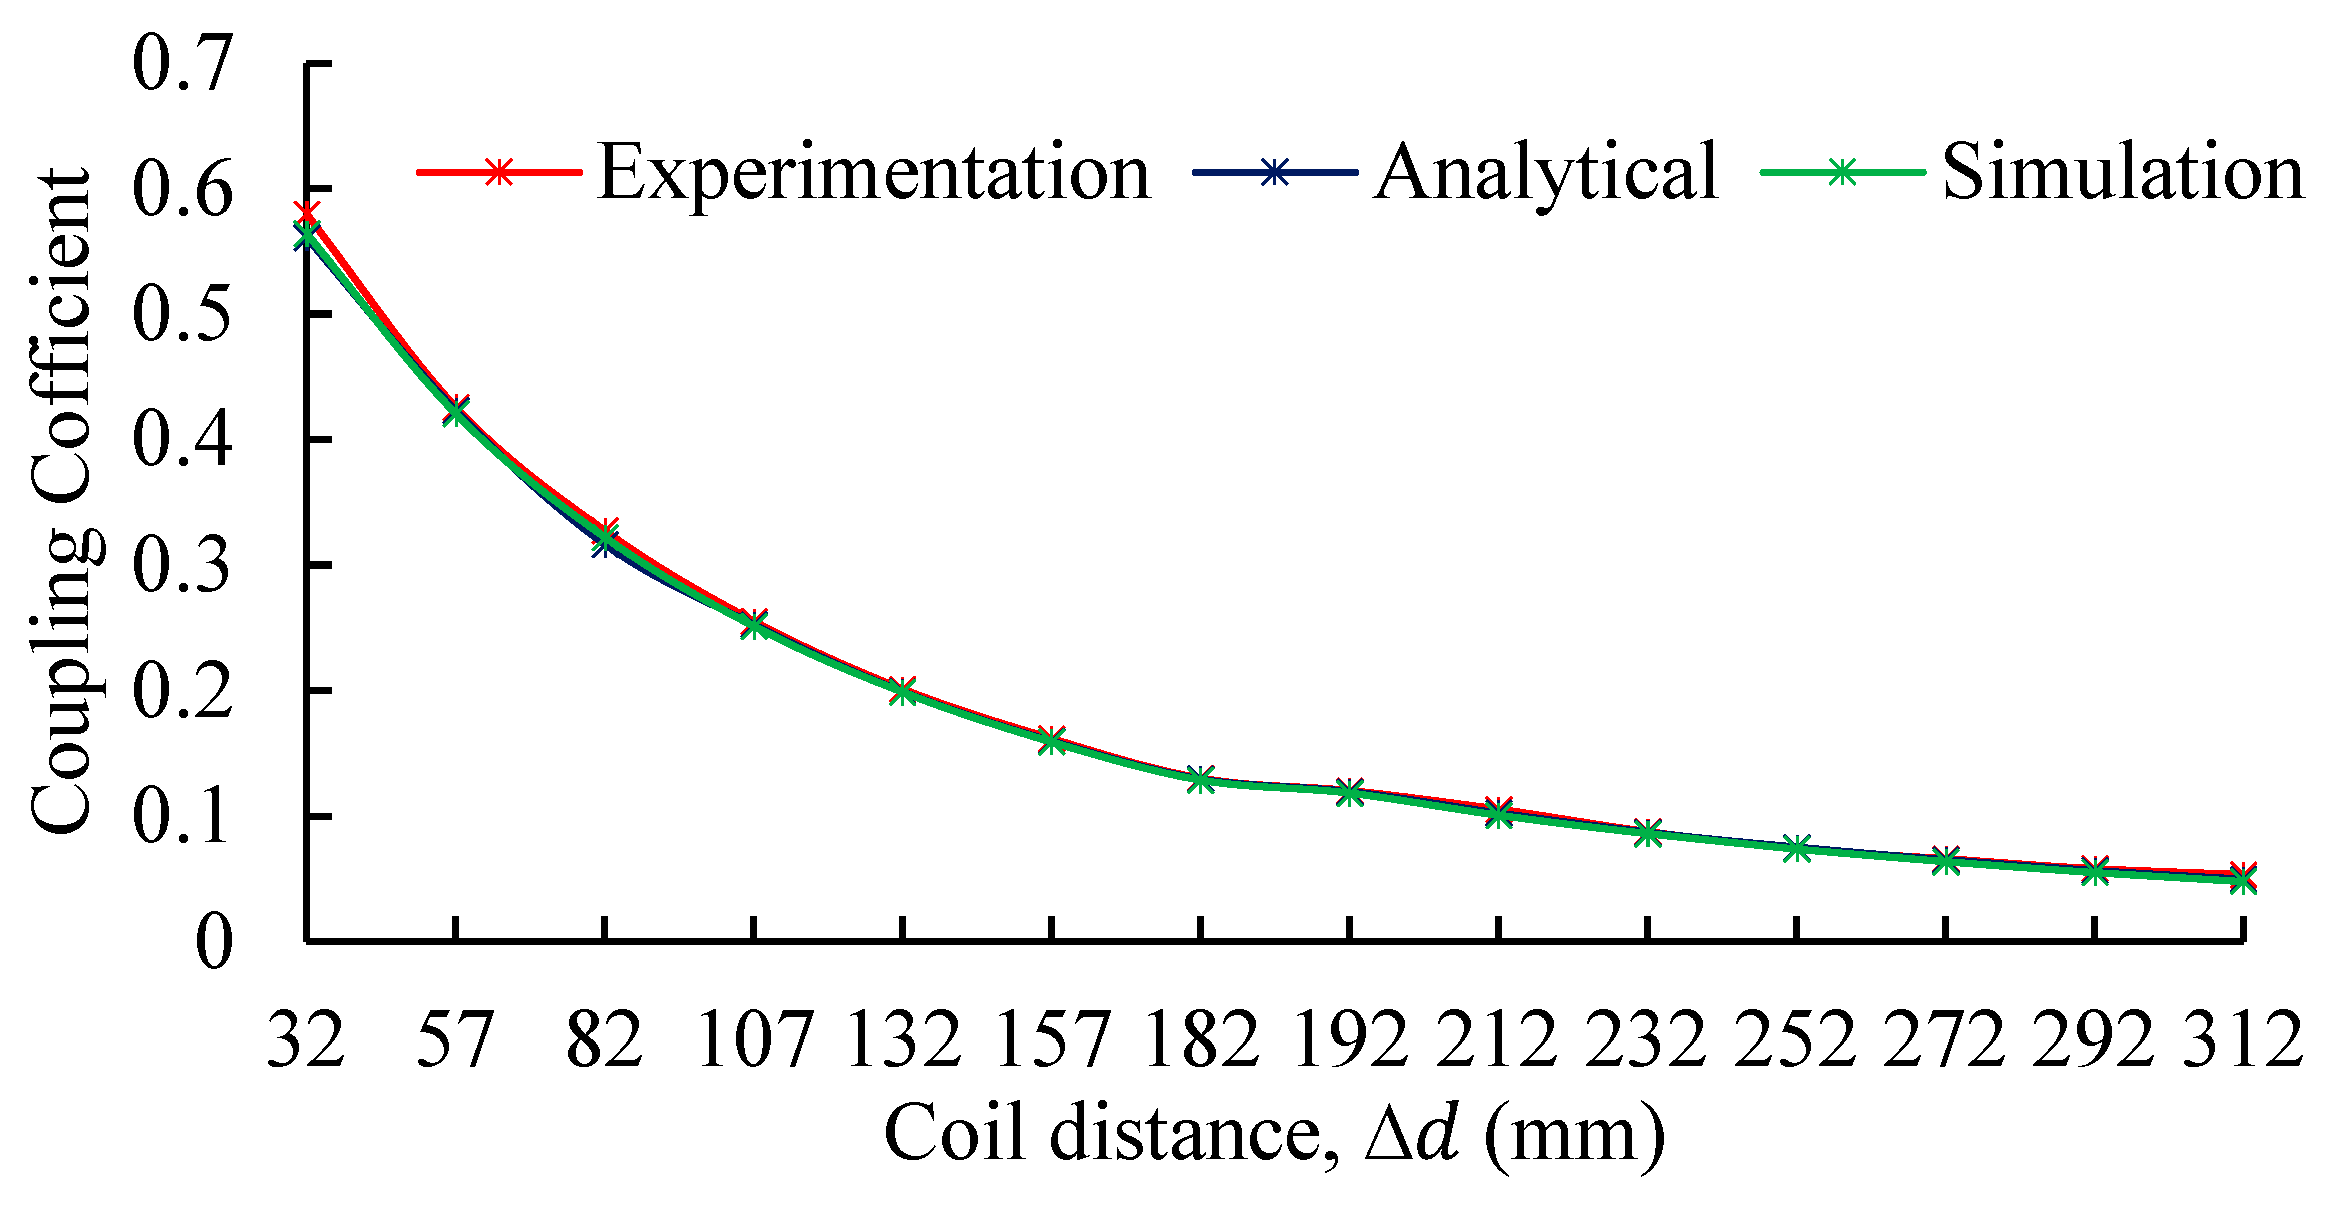
5.1. Experimental Validation Under Vertical Misalignments

The prototypes are fabricated and assembled as shown in Figure 16 for the first scenario. This scenario evaluates the coupling coefficient as a function of an increasing coil distance. The results are illustrated in Figure 17, which plots the coupling coefficient versus distance for the following three methods: experimental, analytical, and simulation. As expected, the coupling coefficient exhibits a monotonic decrease with an increasing coil distance, reflecting the weakening of magnetic coupling due to spatial separation. Both the analytical and simulation results closely match the experimental data across the range of distances, confirming the validity of the underlying models.
Quantitatively, Figure 18 presents the percentage error between the experimental measurements and the analytical and simulation results as a function of coil separation. The figure demonstrates that the error remains relatively low for most of the tested distances for both methods. Specifically, the analytical model maintains an error below 3.1% for most distances, with a maximum deviation of 6.8% at the largest tested separation (312 mm). The simulation-based results exhibit similar behavior, with errors generally below 5.1% and peaking at 10% at the farthest distance. At shorter coil separations (up to 182 mm), both methods show a very high fidelity, with percentage errors consistently below 3%.

5.2. Experimental Validation Under Horizontal Misalignments

The second scenario investigates the impact of horizontal misalignment on the coupling coefficient, using the experimental setup depicted in Figure 19. During this experiment, the vertical separation between the coils is fixed at 100 mm, while the horizontal offset is systematically varied to introduce controlled misalignment.
The measured coupling coefficient as a function of horizontal misalignment is illustrated in Figure 20. As the misalignment increases, the coupling coefficient gradually declines, reflecting the reduced magnetic linkage between the transmitter and receiver coils. Both analytical and simulation results closely track the experimental data across the range of tested misalignments. A quantitative assessment of model accuracy is presented in Figure 21, where the error between analytical and experimental values remains below 5%, reaching its maximum (5.68%) at 130 mm and a minimum of 0.54% at 90 mm. Similarly, the simulation error is also consistently under 5%, with a minimum of 0.53% at 90 mm and a maximum of 6.07% at 130 mm.

5.3. Experimental Validation Under Angular Misalignments

The third scenario explores the effect of angular misalignment on the coupling coefficient. The experimental setup and simulation model for this scenario are shown in Figure 22. During this experiment, the planar coils are fixed at a constant vertical separation of 275 mm, while the transmitting coil is rotated incrementally to introduce controlled angular misalignment.
The measured coupling coefficient as a function of angular misalignment is presented in Figure 23. The results reveal a nonlinear trend: the coupling coefficient remains relatively stable at small angular misalignments but decreases sharply as the angle approaches 90°, indicating a significant degradation of magnetic coupling. The simulation model demonstrates excellent agreement with the experimental data at lower misalignment angles, with errors consistently below 6% for angles up to 50°. However, discrepancies become pronounced at larger angles, particularly at 80° and 90°. This divergence is attributed to the simulation’s assumption of ideal currents becoming less valid, combined with the more pronounced effects of unmodeled parasitic capacitances and fringing fields. Furthermore, practical alignment challenges at these extreme angles mean that minor measurement errors have a larger relative impact.
These three scenarios demonstrate the robustness and limitations of the developed analytical and simulation models for predicting the coupling coefficient in planar coreless coils. Both models show excellent agreement with the experimental measurements for vertical and horizontal displacement cases, with error percentages typically remaining below 6% across a broad range of separations and offsets, confirming their suitability for practical design and control purposes. In contrast, while the simulation model provides accurate predictions for small to moderate angular misalignments, notable discrepancies emerge at larger angles. These increased errors are primarily attributed to a greater sensitivity to alignment tolerances and unmodeled environmental effects, which become more pronounced as the misalignment or separation increases.

5.4. Experimental Validation of Cored Structures

This scenario assesses the impact of integrating magnetic cores on the coupling performance. A specialized coil arrangement incorporating twelve ferrite I-cores (EPCOS I93x28x16, N87 material) is employed, with the cores uniformly distributed around the periphery of both the primary and secondary coils at 30° intervals. The physical test setup and the corresponding 3D simulation model are depicted in Figure 24a and Figure 24b, respectively.
The coupling coefficient of the cored structure is measured experimentally as a function of horizontal misalignment, and the results are presented in Figure 25. The data show a gradual reduction in the coupling coefficient as the misalignment increases, showing the same trend observed in coreless configurations. Notably, the experimental measurements track the simulation model with a remarkable fidelity, exhibiting errors below 1.6% across the entire range of tested misalignments. The minimum observed error is 0.13% at 80 mm, while the most significant error of 1.65% occurs at zero misalignment, as shown in Figure 26.
Table 6 summarizes the key findings from the experimental validation of the proposed models under four representative misalignment scenarios. For each case, the key parameter varied, typical simulation error, maximum error point, and coefficient of correlation ( R 2 ) between the experimental and simulation results are provided. The results demonstrate strong agreement across all scenarios, with R 2 values above 0.99 for vertical, horizontal, and cored horizontal misalignments, indicating an excellent model fidelity. A lower R 2 of 0.9752 for the angular misalignment scenario reflects the model’s reduced accuracy, as discussed.
A 200 W prototype of the proposed WPTS was built for experimental verification under practical conditions. The physical implementation is depicted in Figure 27, with the system’s circuit diagram shown in Figure 15. The system operated with a DC input voltage of 130 V and consistently delivered an output voltage of 52 V across a load resistance of 13.52 Ω. The primary and secondary self-inductances were measured at 1103.3 μH and 114.1 μH, respectively, with a mutual inductance of 44.85 μH between the coils at an axial separation of 192 mm. Resonance was achieved using a 3.4 nF primary compensation capacitor and a 32.48 nF secondary compensation capacitor, yielding an operating frequency of 82.169 kHz.
Figure 28a displays the experimental waveforms of the wireless power transfer system operating under specified conditions. The primary and secondary voltages ( V a b and V c d ) exhibited the expected resonant switching behavior, while the primary and secondary currents ( I p and I s ) showed sinusoidal profiles characteristic of resonant power transfer. These measurements confirm stable operation and a robust system performance at the designed resonant frequency.
The practical viability of the proposed design was confirmed through experimental testing of the 200 W prototype, with the steady-state output characteristics presented in Figure 28b. The system consistently delivered its target output power of approximately 200 W ( V b a t t at 52 V and I b a t t at 3.85 A), demonstrating a high measured AC-to-AC power transfer efficiency of 89.45% between the charging coils. This level of efficiency corresponds to a total system power loss of roughly 23.3 W. A brief thermal assessment was conducted to apportion these losses. The copper losses in the coil windings were calculated to be approximately 7.0 W based on the measured AC resistances and RMS current values of i 1 , r m s   = 2.25 A and i 2 , r m s = 4.92 A. This indicates that the majority of the heat, roughly 16.3 W, was generated in the power electronics (inverter switching and rectifier conduction losses) and within the ferrite core (hysteresis and eddy current losses). This stable, efficient operation, combined with low and well-distributed thermal losses, validates the effectiveness of the proposed design methodology and confirms that temperature rise did not significantly impact the experimental results.

6. Conclusions

This study systematically validated circular coil configurations for WPT, confirming the effectiveness of a structured design methodology through close agreement between analytical models, simulations, and hardware experiments. The validation of coreless coils under vertical and horizontal misalignments demonstrated a high fidelity, with model errors remaining below 6.8% and 6.07%, respectively. The analysis confirmed that while spiral coils consistently outperform ring coils, their coupling coefficient can decrease by as much as 77% under significant horizontal misalignment. The findings confirm that integrating a square I-core is a highly effective strategy for enhancing magnetic coupling, with experimental validation showing a remarkably low error of less than 1.6% between the simulation and hardware results for cored structures. The practical viability of this approach was demonstrated by a 200 W prototype, which achieved stable operation, delivering a consistent 52 V output and exhibiting a power transfer efficiency of 89.45%. Beyond performance, this work quantified the critical trade-offs in cost and weight, revealing that the superior misalignment tolerance of the Square I-Core came at a nearly 27% increase in cost and weight over the Circular I-Core. Overall, these quantitatively validated findings offer valuable guidance for developing robust, misalignment-tolerant static wireless charging systems for EVs in applications like residential garages or commercial parking lots, where balancing performance against common parking errors is paramount.

Author Contributions

Conceptualization, A.M.I. and O.A.M.; methodology, A.M.I. and O.A.M.; software, A.M.I.; validation, A.M.I.; formal analysis, A.M.I. and O.A.M.; resources, O.A.M.; data curation, A.M.I. and O.A.M.; writing—original draft preparation, A.M.I. and O.A.M.; writing—review and editing, A.M.I. and O.A.M.; visualization, A.M.I. and O.A.M.; supervision, O.A.M.; project administration, O.A.M.; funding acquisition, O.A.M. All authors have read and agreed to the published version of the manuscript.

Funding

This research received no external funding.

Data Availability Statement

Data are available upon request from the corresponding author.

Conflicts of Interest

The authors declare no conflicts of interest.

References

  1. Amjad, M.; Farooq-i-Azam, M.; Ni, Q.; Dong, M.; Ansari, E.A. Wireless charging systems for electric vehicles. Renew. Sustain. Energy Rev. 2022, 167, 112730. [Google Scholar] [CrossRef]
  2. Zhang, Y.; Zhou, H.; Shen, Z.; Xie, R.; Zheng, Z.; Chen, X. A Family of Self-Adaptive Interoperable Receivers Based on Multiple Decoupled Receiving Poles for Electric Vehicle Wireless Charging Systems. IEEE Trans. Power Electron. 2024, 39, 11794–11802. [Google Scholar] [CrossRef]
  3. Ghazizadeh, S.; Ahmed, K.; Seyedmahmoudian, M.; Mekhilef, S.; Chandran, J.; Stojcevski, A. Critical Analysis of Simulation of Misalignment in Wireless Charging of Electric Vehicles Batteries. Batteries 2023, 9, 106. [Google Scholar] [CrossRef]
  4. Liu, S.; Su, J.; Lai, J.; Zhang, J.; Xu, H. Precise Modeling of Mutual Inductance for Planar Spiral Coils in Wireless Power Transfer and Its Application. IEEE Trans. Power Electron. 2021, 36, 9876–9885. [Google Scholar] [CrossRef]
  5. Aydin, E.; Yildiriz, E.; Aydemir, M.T. A new semi-analytical approach for self and mutual inductance calculation of hexagonal spiral coil used in wireless power transfer systems. Electr. Eng. 2021, 103, 1769–1778. [Google Scholar] [CrossRef]
  6. Yıldırız, E.; Kemer, S.B. Novel semi-analytical method for mutual inductance calculation of the thin spiral disk coils. IET Electr. Power Appl. 2019, 13, 1607–1612. [Google Scholar] [CrossRef]
  7. Hussain, I.; Woo, D.K. Simplified Mutual Inductance Calculation of Planar Spiral Coil for Wireless Power Applications. Sensors 2022, 22, 1537. [Google Scholar] [CrossRef]
  8. Yıldırız, E. Optimal Design with Generalized Inductance Calculation for IPTs Using a Spiral Rectangular Coil Pair. Electric. Power Compon. Syst. 2022, 50, 1212–1222. [Google Scholar] [CrossRef]
  9. Khan, S.R.; Pavuluri, S.K.; Desmulliez, M.P.Y. Accurate Modeling of Coil Inductance for Near-Field Wireless Power Transfer. IEEE Trans. Microw. Theory Tech. 2018, 66, 4158–4169. [Google Scholar] [CrossRef]
  10. Pirincci, N.; Altun, H. A New Analytical Study on Mutual Inductance Calculations for Wireless Power Transfer Using Magnetic Vector Potential. IEEE Trans. Magn. 2022, 58, 8002714. [Google Scholar] [CrossRef]
  11. Wei, G.; Hao, L.; Zhang, Y.; Zhang, T. Completely Analytical Calculation of Inductance for Circular Coils With Bilateral Finite Magnetic Cores at Arbitrary Position in WPT Systems. IEEE Trans. Power Electron. 2024, 39, 6597–6602. [Google Scholar] [CrossRef]
  12. Shi, Z.H.; Qiu, Z.C. Modeling of mutual inductance between superconducting pancake coils used in wireless power transfer systems. In Proceedings of the 2018 IEEE International Conference on Applied Superconductivity and Electromagnetic Devices ASEMD, Tianjin, China, 15–18 April 2018. [Google Scholar] [CrossRef]
  13. Qian, L.; Chen, M.; Cui, K.; Shi, G.; Wang, J.; Xia, Y. Modeling of Mutual Inductance between Two Misalignment Planar Coils in Wireless Power Transfer. IEEE Microw. Wirel. Compon. Lett. 2020, 30, 814–817. [Google Scholar] [CrossRef]
  14. Zhang, X.; Quan, C.; Li, Z. Mutual Inductance Calculation of Circular Coils for an Arbitrary Position with Electromagnetic Shielding in Wireless Power Transfer Systems. IEEE Trans. Transp. Electrif. 2021, 7, 1196–1204. [Google Scholar] [CrossRef]
  15. Viqar, S.; Ahmad, A.; Kirmani, S.; Rafat, Y.; Hussan, M.R.; Alam, M.S. Modelling, simulation and hardware analysis of misalignment and compensation topologies of wireless power transfer for electric vehicle charging application. Sustain. Energy Grids Netw. 2024, 38, 101285. [Google Scholar] [CrossRef]
  16. Wang, F.; Yang, Q.; Zhang, X.; Chen, T.; Li, G. Enhancing Misalignment Tolerance in Hybrid Wireless Power Transfer System With Integrated Coupler via Frequency Tuning. IEEE Trans. Power Electron. 2024, 39, 11885–11899. [Google Scholar] [CrossRef]
  17. Seo, D.-W.; Liu, Z.; Stankiewicz, J.M. Analysis of the Wireless Power Transfer System Using a Finite Grid of Planar Circular Coils. Energies 2023, 16, 7651. [Google Scholar] [CrossRef]
  18. Zhu, K.; Kiourti, A. Partial Shielding to Improve Sensitivity of a Fully Passive Bio-Magnetic Signal Detection System. In Proceedings of the 2023 International Applied Computational Electromagnetics Society Symposium (ACES), Monterey/Seaside, CA, USA, 26–30 March 2023. [Google Scholar] [CrossRef]
  19. Wu, M.; Yang, X.; Chen, W.J.; Wang, L.L.; Jiang, Y.B.; Gao, Q.Q.; Yan, Z.C.; Yu, X.P. A Compact Coupler with Integrated Multiple Decoupled Coils for Wireless Power Transfer System and its Anti-Misalignment Control. IEEE Trans. Power Electron. 2022, 37, 12814–12827. [Google Scholar] [CrossRef]
  20. Zhang, P.; Saeedifard, M.; Onar, O.C.; Yang, Q.; Cai, C. A Field Enhancement Integration Design Featuring Misalignment Tolerance for Wireless EV Charging Using LCL Topology. IEEE Trans. Power Electron. 2021, 36, 3852–3867. [Google Scholar] [CrossRef]
  21. He, X.; Zeng, Y.; Liu, R.; Lu, C.; Rong, C.; Liu, M. A Dual-Band Coil Array With Novel High-Order Circuit Compensation for Shielding Design in EV Wireless Charging System. IEEE Trans. Ind. Electron. 2024, 71, 2545–2555. [Google Scholar] [CrossRef]
  22. Elbeshbeshy, A.; Rizk, M.; Kaddah, S. Analysis of Inductive Characteristics for various Helical and Spiral Coil Configurations supported by COMSOL Multiphysics. Mansoura. Eng. J. 2021, 46, 23. [Google Scholar] [CrossRef]
  23. Ibrahim, A.M.; Soliman, A.S.; Mohammed, O.A. Optimizing Wireless Power Transfer Systems for Improved Efficiency Through Geometric and Dimensional Alignments. In Proceedings of the 2024 IEEE International Conference on Environment and Electrical Engineering and 2024 IEEE Industrial and Commercial Power Systems Europe (EEEIC/I&CPS Europe), Rome, Italy, 17–20 June 2024; pp. 1–6. [Google Scholar] [CrossRef]
  24. Ibrahim, A.M.; Soliman, A.S.; Mohammed, O.A. Intelligent Geometric Alignment and Dimensions-Guided Approach for Design Optimization for Efficiency Improvement of WPT Systems. In Proceedings of the 2024 International Applied Computational Electromagnetics Society Symposium (ACES), Orlando, FL, USA, 19–22 May 2024; pp. 1–2. [Google Scholar]
  25. Chao, Y.H.; Shieh, J.J.; Pan, C.T.; Shen, W.C. A closed-form oriented compensator analysis for series-parallel loosely coupled inductive power transfer systems. In Proceedings of the PESC Record-IEEE Annual Power Electronics Specialists Conference, Orlando, FL, USA, 17–21 June 2007; pp. 1215–1220. [Google Scholar] [CrossRef]
  26. J2954_202010; Wireless Power Transfer for Light-Duty Plug-in/Electric Vehicles and Alignment Methodology. SAE International: Warrendale, PA, USA, 2020. [CrossRef]
  27. Sullivan, C.R.; Zhang, R.Y. Simplified design method for Litz wire. In Proceedings of the IEEE Applied Power Electronics Conference and Exposition–APEC, Fort Worth, TX, USA, 16–20 March 2014; pp. 2667–2674. [Google Scholar] [CrossRef]
  28. Wheeler, H.A. Simple inductance formulas for radio coils. Proc. Inst. Radio Eng. 1928, 16, 1398–1400. [Google Scholar] [CrossRef]
  29. Mohan, S.S.; Hershenson, M.D.M.; Boyd, S.P.; Lee, T.H. Simple, accurate expressions for planar spiral inductances. IEEE J. Solid-State Circuits 1999, 34, 1419–1420. [Google Scholar] [CrossRef]
  30. Akyel, C.; Babic, S.I.; Mahmoudi, M.M. Mutual inductance calculation for noncoaxial circular air coils with parallel axes. Prog. Electromagn. Res. 2009, 91, 287–301. [Google Scholar] [CrossRef]
Figure 1. Simplified circuit diagram of SS WPTS.
Batteries 11 00257 g001
Figure 2. Flowchart of the proposed coil design scheme, with sequential steps indicated by color.
Batteries 11 00257 g002
Figure 3. Ring coil coupling arrangement, showing (a) the schematic representation of the coupled coils and (b) the corresponding 3D illustration.
Batteries 11 00257 g003
Figure 4. Spiral coil coupling arrangement, showing (a) the schematic representation of the coupled coils and (b) the corresponding 3D illustration.
Batteries 11 00257 g004
Figure 5. Variation in self-inductance and mutual inductance with turn number for a ring coil at different coil separations.
Batteries 11 00257 g005
Figure 6. Self-inductance and mutual inductance of a spiral coil as a function of turn number ( t d = 2 mm) at various coil separations.
Batteries 11 00257 g006
Figure 7. Effect of turn-to-turn distance on self-inductance and mutual inductance for a spiral coil ( N = 30, d = 100 mm).
Batteries 11 00257 g007
Figure 8. Coupling coefficient of ring and spiral coils as a function of vertical coil distance.
Batteries 11 00257 g008
Figure 9. Coupling coefficient of ring and spiral coils versus horizontal misalignment.
Batteries 11 00257 g009
Figure 10. Coupling coefficient of ring and spiral coils as a function of angular misalignment.
Batteries 11 00257 g010
Figure 11. Magnetic ferrite cores, (a) Circular I-Core, (b) Square I-Core, (c) U-core, and (d) E-core [22].
Batteries 11 00257 g011
Figure 12. Coupling coefficient of four magnetic core structures as a function of coil distance.
Batteries 11 00257 g012
Figure 13. Coupling coefficient of four magnetic core structures versus horizontal misalignment at 160 mm coil distance.
Batteries 11 00257 g013
Figure 14. Coupling coefficient of four magnetic core structures as a function of angular misalignment at 250 mm coil distance.
Batteries 11 00257 g014
Figure 15. The circuit schematic of the WPTS is used for experimental validation.
Batteries 11 00257 g015
Figure 16. Experimental setup for the first scenario: (a) prototype of the planar coil structure and (b) corresponding 3D simulation model.
Batteries 11 00257 g016
Figure 17. Coupling coefficient versus vertical coil separation: comparison among experimental, analytical, and simulation results.
Batteries 11 00257 g017
Figure 18. Error percentage between experimental coupling coefficient and analytical and simulation models as a function of coil distance.
Batteries 11 00257 g018
Figure 19. Experimental setup for the second scenario: (a) prototype of the planar coil structure and (b) corresponding 3D simulation model.
Batteries 11 00257 g019
Figure 20. Coupling coefficient at various coil horizontal misalignments: comparison among experimental, analytical, and simulation results.
Batteries 11 00257 g020
Figure 21. Error percentage between experimental coupling coefficient and analytical and simulation models as a function of horizontal misalignment.
Batteries 11 00257 g021
Figure 22. Experimental setup for the third scenario: (a) prototype of the planar coil structure and (b) corresponding 3D simulation model.
Batteries 11 00257 g022
Figure 23. Coupling coefficient at various coil angular misalignments: comparison among experimental, and simulation results.
Batteries 11 00257 g023
Figure 24. Experimental setup for cored structure: (a) prototype of the planar coil structure and (b) corresponding 3D simulation model.
Batteries 11 00257 g024
Figure 25. Coupling coefficient of the cored structure as a function of horizontal misalignment.
Batteries 11 00257 g025
Figure 26. Error percentage between experimental and simulated coupling coefficients for the cored structure at various horizontal misalignments.
Batteries 11 00257 g026
Figure 27. Experimental setup for proposed WPTS.
Batteries 11 00257 g027
Figure 28. Experimental results of the 200 W WPTS prototype: (a) primary and secondary voltages and currents and (b) steady-state output voltage, current, and power delivered to the load.
Batteries 11 00257 g028
Table 1. Parameters of the 200 W coil structure.
ParameterSymbolValue
Input Voltage ν a b , r m s 117 V
Output Voltage ν c d , r m s 46.6 V
Output Power P L 200 W
Frequency f 85 kHz
Load Resistance R L 10.87 Ω
Primary Current i 1 , r m s 1.71 A
Secondary Current i 2 , r m s 4.29 A
Primary Self-Inductance L 11 800.98 μH
Secondary Self-Inductance L 22 81.45 μH
Mutual Inductance M 51.0835 μH
Primary Capacitance C 1 4.377 nF
Secondary Capacitance C 2 43.044 nF
Skin Depth δ 0.2264 mm
Strand Diameter AWG (38) d s t d 0.102 mm
Strands Number N s t d 180 strands
Conductor Diameter D w 1.9 mm
Table 4. Range of variation for geometric parameters.
ParameterSymbolValue
Turn Number N 5~50
Turn Distance t d 0~4.5 mm
Coil Distance d 20~400 mm
Misalignment M 0~400 mm
Angular Misalignment A M 0~90 deg
Table 6. Summary of experimental validation and model correlation.
ScenarioKey Parameter VariedTypical ErrorMaximum Error R 2 (Sim vs. Exp)
Coreless: Vertical MisalignmentVertical Distance (32–312 mm)~5.1%10% at 312 mm0.99978
Coreless: Horizontal MisalignmentHorizontal Offset
(0–130 mm)
~2.7%6.07% at 130 mm0.99943
Coreless: Angular MisalignmentAngular Offset
(0–90°)
<6% up to 50°High at 90°0.975207
Cored: Horizontal MisalignmentHorizontal Offset
(0–150 mm)
~1.0%1.65% at 0 mm0.998136
Disclaimer/Publisher’s Note: The statements, opinions and data contained in all publications are solely those of the individual author(s) and contributor(s) and not of MDPI and/or the editor(s). MDPI and/or the editor(s) disclaim responsibility for any injury to people or property resulting from any ideas, methods, instructions or products referred to in the content.

