1. Introduction
The rapid advancement of electric vehicles (EVs) and renewable energy storage systems has significantly increased the demand for reliable and efficient battery technologies. Among various battery chemistries, lithium iron phosphate (LiFePO4—LFP) batteries have gained considerable attention due to their superior thermal stability, long cycle life, and safety features [
1,
2]. These attributes make LFP batteries particularly suitable for high-power applications such as EVs and large-scale energy storage systems.
One critical parameter when managing and optimizing the performance of LFP batteries is the open-circuit voltage (OCV) [
3]. The OCV is essential for accurate state of charge (SoC) estimation, which directly impacts the battery management system (BMS)’s ability to ensure efficient and safe battery operation [
4,
5]. Accurate SoC estimation helps to prevent overcharging and deep discharging, thereby extending the battery life and enhancing the overall reliability of battery-powered systems [
6]. The accurate determination of the OCV is challenging due to the inherent relaxation effects that occur after charging or discharging a battery [
7]. These relaxation effects cause the voltage to change gradually until it stabilizes at the true OCV. This phenomenon, known as voltage relaxation, can lead to significant errors in SoC estimation if not properly accounted for [
8], particularly in the flat regions of the OCV–SoC curve [
9]. Furthermore, voltage hysteresis during charge and discharge cycles adds complexity, making it imperative to develop methods capable of reliably capturing the true OCV [
10]. The relaxation time, defined as the period required for the voltage to stabilize after a perturbation, is a crucial factor in accurate OCV measurement [
11].
Different electrochemical processes within the battery, such as charge transfer and diffusion, contribute to varying relaxation times. The conventional guideline suggests that, after charging or discharging, a battery should undergo a rest period of approximately one hour [
12]. Researchers have generally accepted this period as the necessary relaxation time for a battery to reach its OCV. However, recent studies have clearly demonstrated that the true relaxation time can be extended to 24 h and, in some extreme cases, even longer [
13]. In this paper, a different approach is adopted: instead of using a fixed rest period of 1 h to determine the OCV, the stopping criterion is either when the voltage variation stabilizes within ±1 mV/hour or when a maximum duration of 24 h is reached. Using this criterion ensures the stabilization of deeper electrochemical processes, mitigates concentration gradients, and minimizes measurement artifacts. This approach adapts to the battery’s state, providing a more accurate equilibrium voltage. It captures the completion of slower diffusion processes, ensuring true OCV measurement, and aligns with practical requirements for battery management in EVs and energy storage applications. Other studies use a similar stopping criterion to assess the true relaxation time or the OCV–SoC relationship. An equivalent circuit model with time-varying parameters is employed in several studies [
3,
14], while other approaches utilize fast extrapolation methods based on the OCV–SoC relationship with brief relaxation times (6–10 min), resulting in errors exceeding 7% in OCV estimation [
13]. A notable hybrid method involves an initial 24 h testing period followed by a 5.2 h secondary test and a transition from a normal to a logarithmic time scale. Combined with a 5τ time constant R-C model, this method achieves an OCV estimation error of less than 1% [
8]. Inspired by this approach, a new and improved technique has been developed. On the other end of the spectrum, advanced techniques, such as those employing machine learning algorithms or the Unscented Kalman Filter (UKF) combined with particle filters, offer higher precision but at the cost of increased computational demands. These methods require sophisticated hardware and complex sensing systems, which limit their practicality in real-time applications or scenarios where cost sensitivity is crucial [
15,
16].
Instead of relying on two arbitrarily selected points from the resting voltage curve—typically, one measured after one hour and another at the end of a 24 h relaxation peri-od—this paper introduces a novel statistical method for open-circuit voltage (OCV) estimation, which utilizes only two strategically chosen points from the voltage relaxation curve. The critical innovation is the introduction of the knee/elbow point as one of these points. The selection of data points employed in the model’s development was guided by an analysis of correlated electrochemical phenomena. Specifically, the knee/elbow point results from the complex interplay among various electrochemical processes previously described in the literature [
17,
18]. During charging or discharging, the initial rapid voltage changes primarily arise from surface charge effects and double-layer capacitance, phenomena that tend to stabilize relatively quickly. However, slower and deeper electrochemical processes, such as lithium-ion diffusion and phase transitions within electrode active materials, continue evolving over an extended period. These slower processes gradually establish a more homogeneous ionic distribution within the electrodes, leading to subsequent voltage stabilization and linearization beyond the knee/elbow point.
Accurately identifying this transition point is essential for precise OCV determination, as it signifies the battery’s transition from predominantly surface-driven electrochemical phenomena to slower bulk processes. Given that the region following the knee/elbow point exhibits a quasi-linear voltage profile, it becomes feasible to accurately estimate the battery’s true OCV using linear regression methods, relying solely on the knee/elbow point and one additional point within this stable region. This approach significantly reduces experimental time and complexity compared to traditional methods.
Thus, the main contributions of the present work are as follows: analyzing the novelty of the proposed technique (
Section 2); the development of an online knee/elbow detection algorithm based on the Kneedle method (detailed in
Section 3); the proposal of a novel, efficient statistical method for OCV estimation using only two critical points from short-duration relaxation tests combined with linear regression techniques (outlined in
Section 4); and the validation of this new methodology through comprehensive experimental data (provided in
Section 5).
2. Novel Statistical Method for OCV Estimation of LFP Batteries
The method introduced herein is fundamentally based on accurately determining the knee/elbow point in the voltage relaxation curve and subsequently applying a multivariable linear regression model to estimate the OCV. The knee/elbow point is mathematically defined as the location where a significant change in curvature occurs, signifying the transition from rapid surface-dominated electrochemical phenomena—such as surface charges and double-layer capacitance effects—to slower, bulk-driven processes, including lithium-ion diffusion and intercalation reactions. This critical transition is dynamically identified in real time using the Kneedle v0.8.5 algorithm [
19,
20], an online method specifically designed to detect points of maximum curvature by monitoring real-time changes in relaxation data. Once the knee/elbow point is detected, the method leverages the resulting linear stabilization phase of the voltage relaxation curve. Here, a straightforward yet robust multivariable linear regression model estimates the OCV using only the knee/elbow point and the initial point following the completion of the charge/discharge process. This approach dramatically reduces the time required for experimental characterization.
A significant advantage of the proposed method is its independence from variations in charge/discharge rates. Since the model is based solely on electrochemical relaxation behavior at specific SoC levels, the specific current rate employed to reach this SoC level has no significant effect. This finding aligns well with recent studies [
4,
7,
10,
21]. Additionally, although the temperature is known to slightly affect the OCV—typically in the order of 1–2% at extremely low temperatures (below −15 °C) and high temperatures (above 50 °C)—these minor influences were considered negligible in the context of this investigation and were therefore not explicitly addressed [
10,
17].
Compared with traditional methods reported in the literature, such as the Gaussian, polynomial, exponential, and sine function models [
1,
21,
22], the proposed statistical model demonstrates several distinct advantages.
- -
Reduced experimentation time: By identifying the knee/elbow point online, the method significantly shortens the waiting period to reach full relaxation, making it highly suitable for real-time monitoring in dynamic operating environments.
- -
Enhanced accuracy with minimal complexity: While polynomial models can achieve high accuracy by increasing the model order, they risk computational inefficiency and overfitting. In contrast, the method presented here provides a balance, achieving low relative errors without resorting to complex model configurations.
- -
Robustness and adaptability: The method’s adaptability to the battery condition ensures reliability across various operational scenarios, addressing limitations in techniques that fail to account for variations in battery states or environmental conditions.
- -
Practicality and implementation simplicity: Compared to sophisticated electrochemical or machine learning-based models requiring extensive datasets and powerful computational platforms, the proposed method uses minimal input data and offers ease of implementation with a lower computational overhead.
By balancing simplicity, accuracy, and computational efficiency, this study marks the first step towards a more realistic OCV estimation methodology—one that does not rely on a fixed one-hour relaxation period but instead leverages an electrochemical under-standing of voltage relaxation, enhanced by statistical processing. Although the current approach is demonstrated at the single-cell level, future research could focus on scaling this method to full battery pack implementations, specifically investigating the influence of battery management systems (BMSs), series/parallel connections, and broader operating conditions to validate it further and extend its practical applicability.
3. Knee/Elbow Online Observer
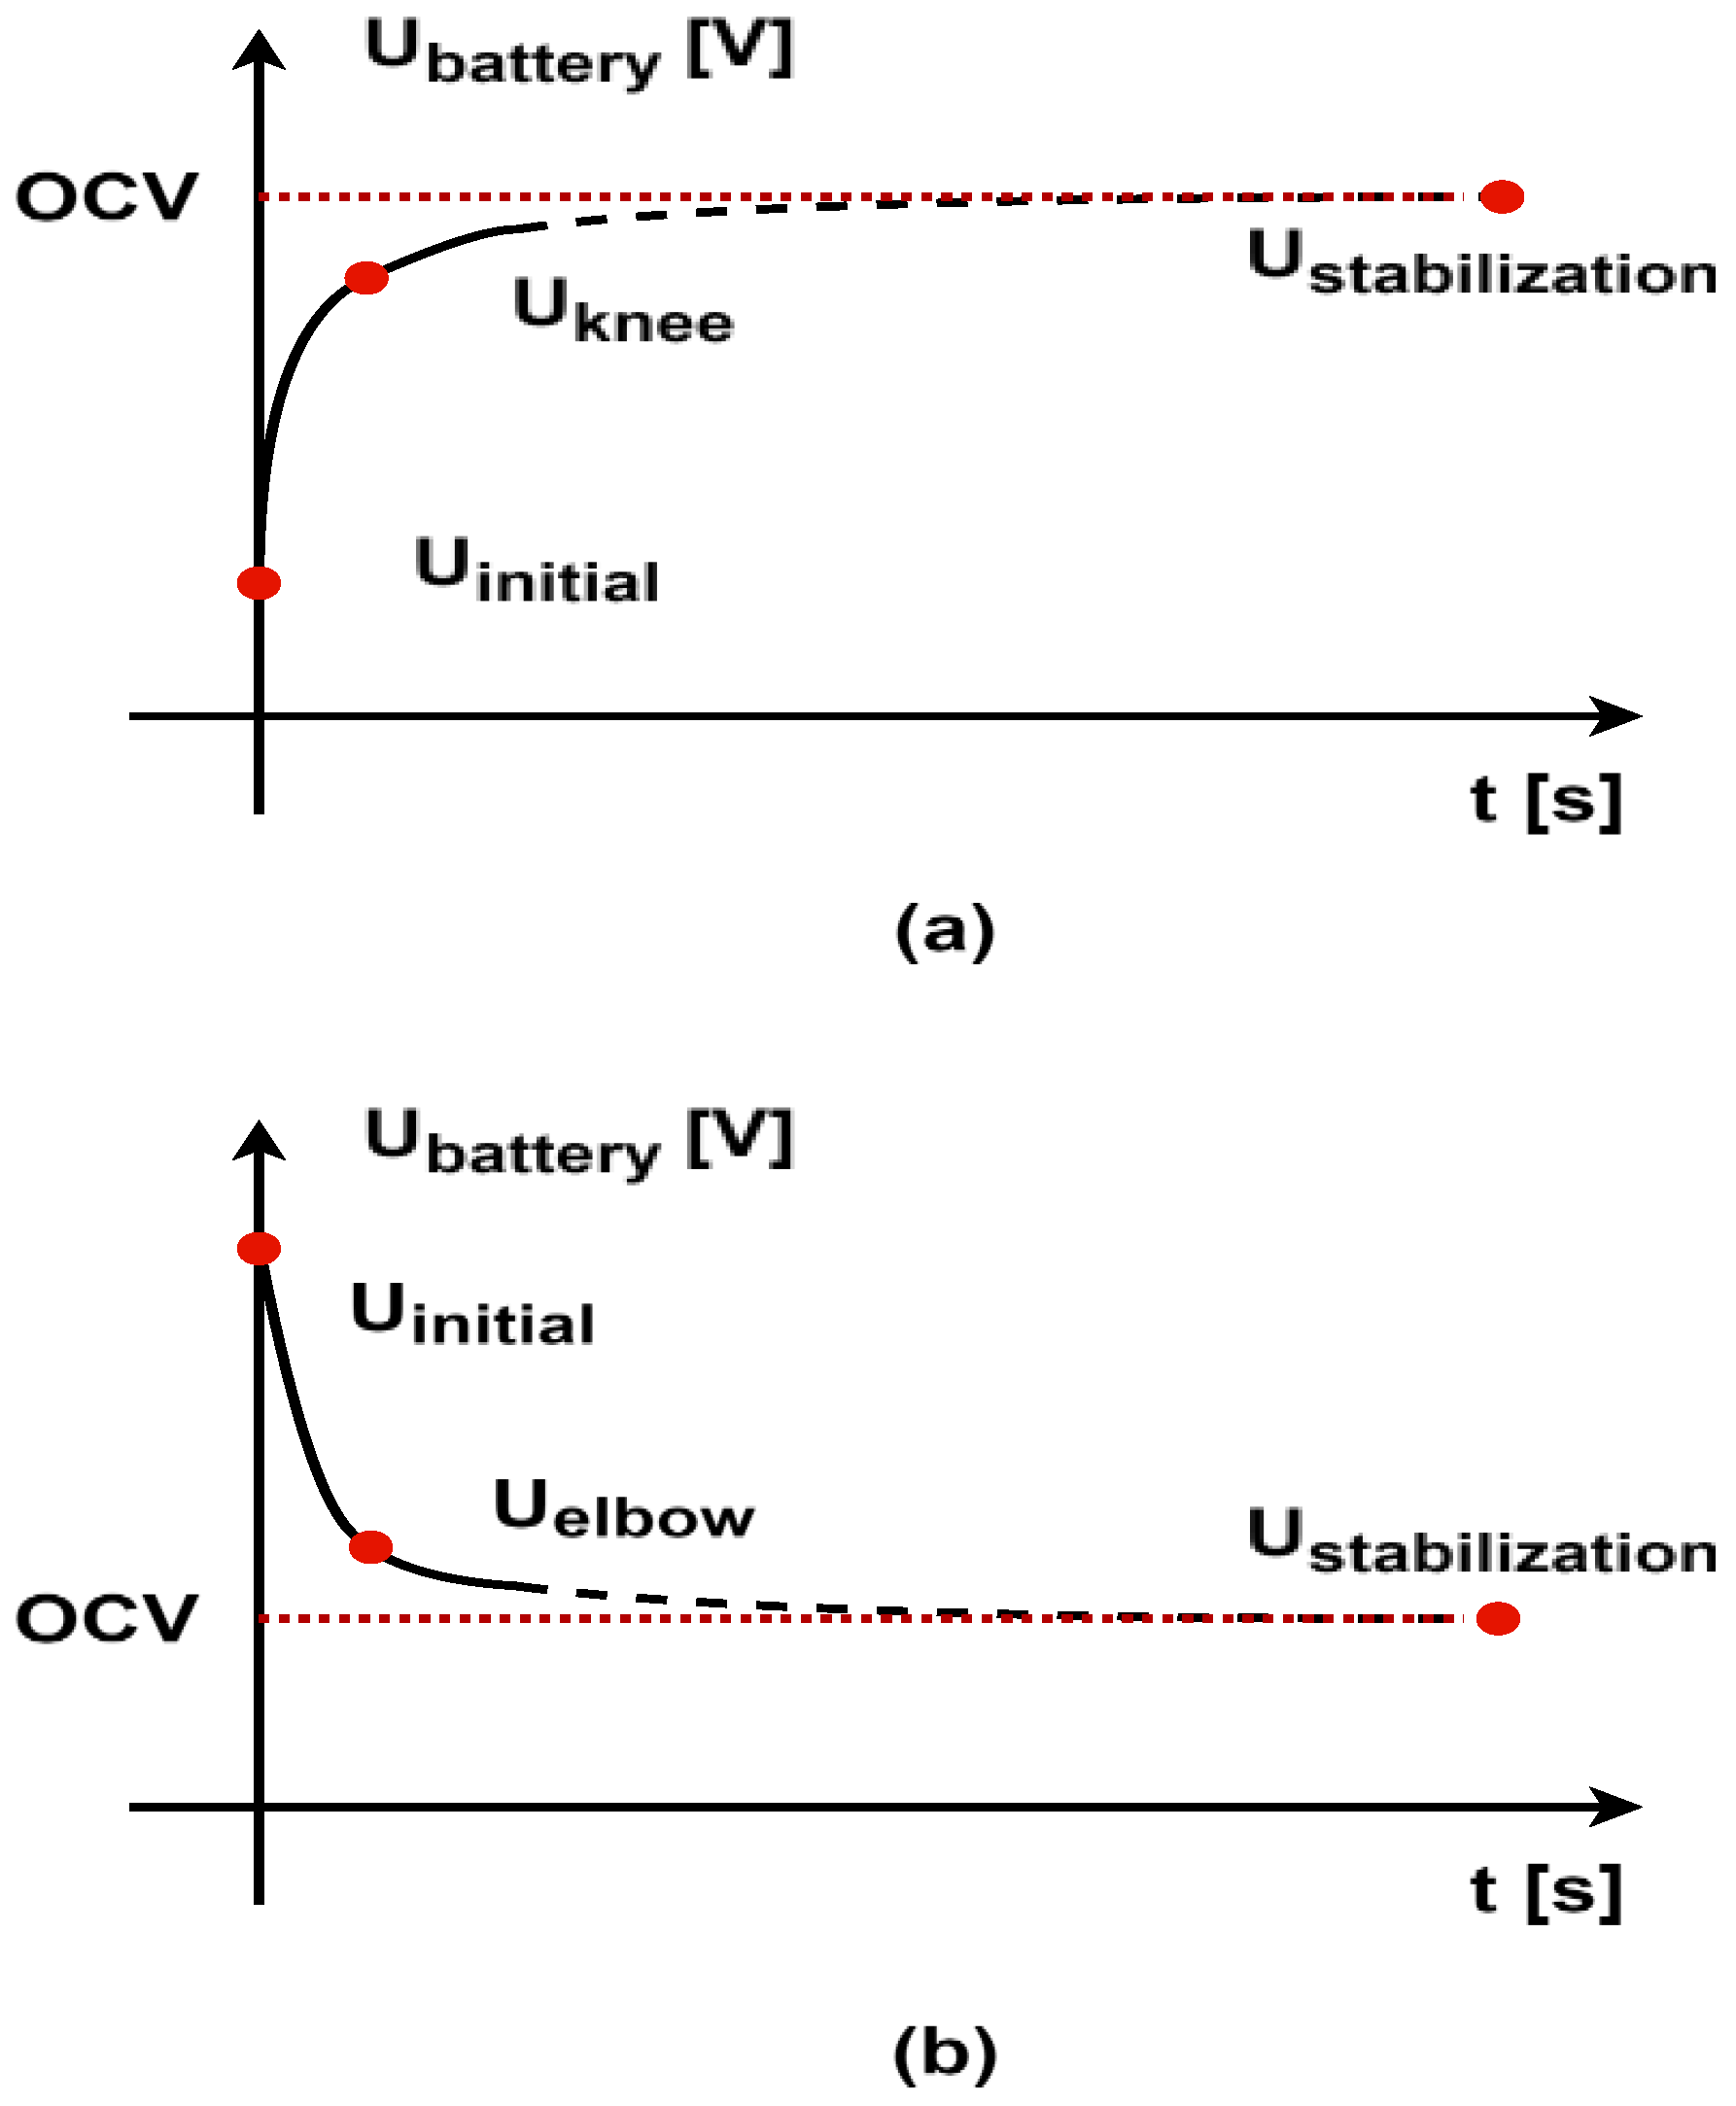
The Kneedle algorithm offers an efficient, real-time method for the identification of critical transition points in the voltage relaxation curve, thus serving as the cornerstone of the proposed estimation framework. This algorithm identifies the knee/elbow point in the data by detecting significant changes in the curvature of a plotted curve, ensuring that the points of maximum curvature, where the rate of increase transitions to a more gradual slope, are accurately identified. This method normalizes the data, calculates differences, and uses local maxima in the difference curve to pinpoint knees. It effectively separates regions of rapid change from stable, linear regions, making it suitable for online estimation—see
Figure 1.
The proposed knee/elbow online detector is based on the “kneed” library [
19,
20]. The process begins by collecting all voltage relaxation points in a .csv file every second. After an initial period of 10 s, this file is accessed by the developed observer, which computes a new value for the knee/elbow point every second. The algorithm continuously evaluates incoming data, updating the knee/elbow point detection as new data arrive and visualizes the results, highlighting the detected knee/elbow point on the curve. This approach ensures the accurate and dynamic identification of critical inflexion points in real-time data streams. The algorithm terminates when the detected knee/elbow point stabilizes, indicating that subsequent data points do not significantly change the identified knee/elbow point.
4. Statistical Method to Estimate OCV
For the development and evaluation of this statistical method, ten new lithium iron phosphate (LFP) batteries were employed. These batteries were categorized into two distinct groups, both of which shared identical chemical compositions but exhibited differing electrical characteristics. The first group was utilized for model development and validation purposes, while the second group was reserved exclusively for testing. The electrical characteristics of both battery groups are illustrated in
Figure 2. Additionally, a comparative summary of their main electrical parameters is provided in
Table 1.
Each battery received a unique ID before testing to keep track of its behavior. APR1 to ARP5 were used to determine the statistical model for OCV estimation. Starting with APR1, each battery underwent the USABC test to determine its effective capacity by employing a constant discharge sequence using three different currents: C1/1, C2/2, and C3/3. This sequence was repeated three times, and the effective capacity was computed to be 1.0975 Ah. The other batteries had effectives capacities within a 2% margin. After this, APR1 was fully charged using the CC-CV method indicated by the manufacturer at a 0.5 C current rate and left to rest for 24 h, during which the voltage relaxation was recorded. The discharge/charge voltage relaxation data for different SoC levels are presented in
Figure 3 and
Figure 4.
Subsequently, 20% of the effective capacity was discharged using the USABC constant discharge method at a 0.2 C current rate, and the battery was allowed to rest until a ±1 mV/hour voltage variation was observed or the 24 h mark was reached. This process was repeated five times. Following this, the battery was charged using the CC-CV method for 20% of the capacity, and the voltage relaxation was recorded using the same stop criterion. Again, five steps were implemented and recorded. To ensure the test conditions, the batteries were placed in a thermal chamber where the temperature was maintained at 23 ± 2 °C.
These data served as the input for the development of the multivariable regression model. The model was constructed based on the following assumptions.
The initial voltage before each relaxation and the voltage determined by the observer at the knee/elbow represent the independent variables. The shape of the curve is assumed to have a knee for discharge and an elbow for charge.
No outliers are present in the data, as verified using the 3-sigma test.
The observations for these variables are independent, confirmed by the Durbin–Watson test.
There is a strong correlation between the independent variables and the dependent variable (OCV), as tested by the Pearson coefficient.
The overall regression model is a good fit for the data, validated using the ANOVA test.
After thorough analysis, the model was deliberately partitioned into two distinct sub-models: one aimed at estimating the open-circuit voltage (OCV) following a charging cycle and the other focused on estimating the OCV after a discharging cycle. This structural division was necessitated in part by the pronounced hysteresis effect exhibited by the cell during charge and discharge processes, which results in differing voltage responses. In addition to hysteresis, other nonlinear and path-dependent behaviors were observed, further complicating the use of a single unified model for accurate OCV prediction. By separating the estimation tasks, the model is better able to capture the dynamic characteristics of the system under varying operational conditions. This modeling strategy aligns closely with findings from prior research, where similar hysteresis phenomena have been documented in lithium iron phosphate (LFP) batteries, particularly in [
4,
10].
The Durbin–Watson statistics, falling between the critical values of 1.5 and 2.5, demonstrate that the chosen variables are independent and that there is no first-order linear autocorrelation in the multiple linear regression data. The minimal Pearson coefficient value of 0.957 indicates a strong correlation between the chosen variables. The F-ratio computed by the ANOVA test and its significance level (
p < 0.05) show that the independent variables statistically significantly predict the dependent variable. Once these assumptions were verified, the multiple regression coefficients for each model were computed, and they are presented in Equations (1) and (2).
where
—the last voltage after the charge/discharge process was terminated (first relaxation voltage);
—the voltage determined by the online observer;
—the estimated value for the OCV.
The five assumptions were carefully checked for both submodels, and the results are summarized in
Table 2.
A preliminary evaluation of the proposed model was performed at two distinct SoCs, namely 100% (corresponding to a fully charged battery) and 0% (corresponding to a fully discharged battery). This assessment employed statistical measures and was carried out using all batteries from group 1. The R and R2 values were computed, yielding values of 0.99 for R and 0.99 for R2. These results indicate that the model exhibits high prediction accuracy of 99% and that the independent variables explain 99% of the variance in the dependent variable. Next, to assess the accuracy of the developed model, a thorough evaluation involving different SoC levels and the batteries from group 2 was conducted.
5. Results and Discussion
A comprehensive experimental setup—see
Figure 5—was implemented to evaluate the accuracy and feasibility of the proposed OCV estimation method.
The metrological characteristics of the equipment (PC, thermal chamber, DAQ system, DC power supply, and DC electronic load) are presented in
Table 3.
The experimental setup involved the real-time monitoring of the voltage relaxation behavior of the batteries from group 1 (APR), as well as the cells from group 2 (BSE). Noise present in the voltage measurements was mitigated through a combination of hardware and software solutions. Specifically, the high input impedance of the voltage measurement channels provided by the NI DAQ system was complemented by an FIR moving-average filter implemented in the software. This integrated approach effectively reduced most of the measurement noise inherent in the experimental setup.
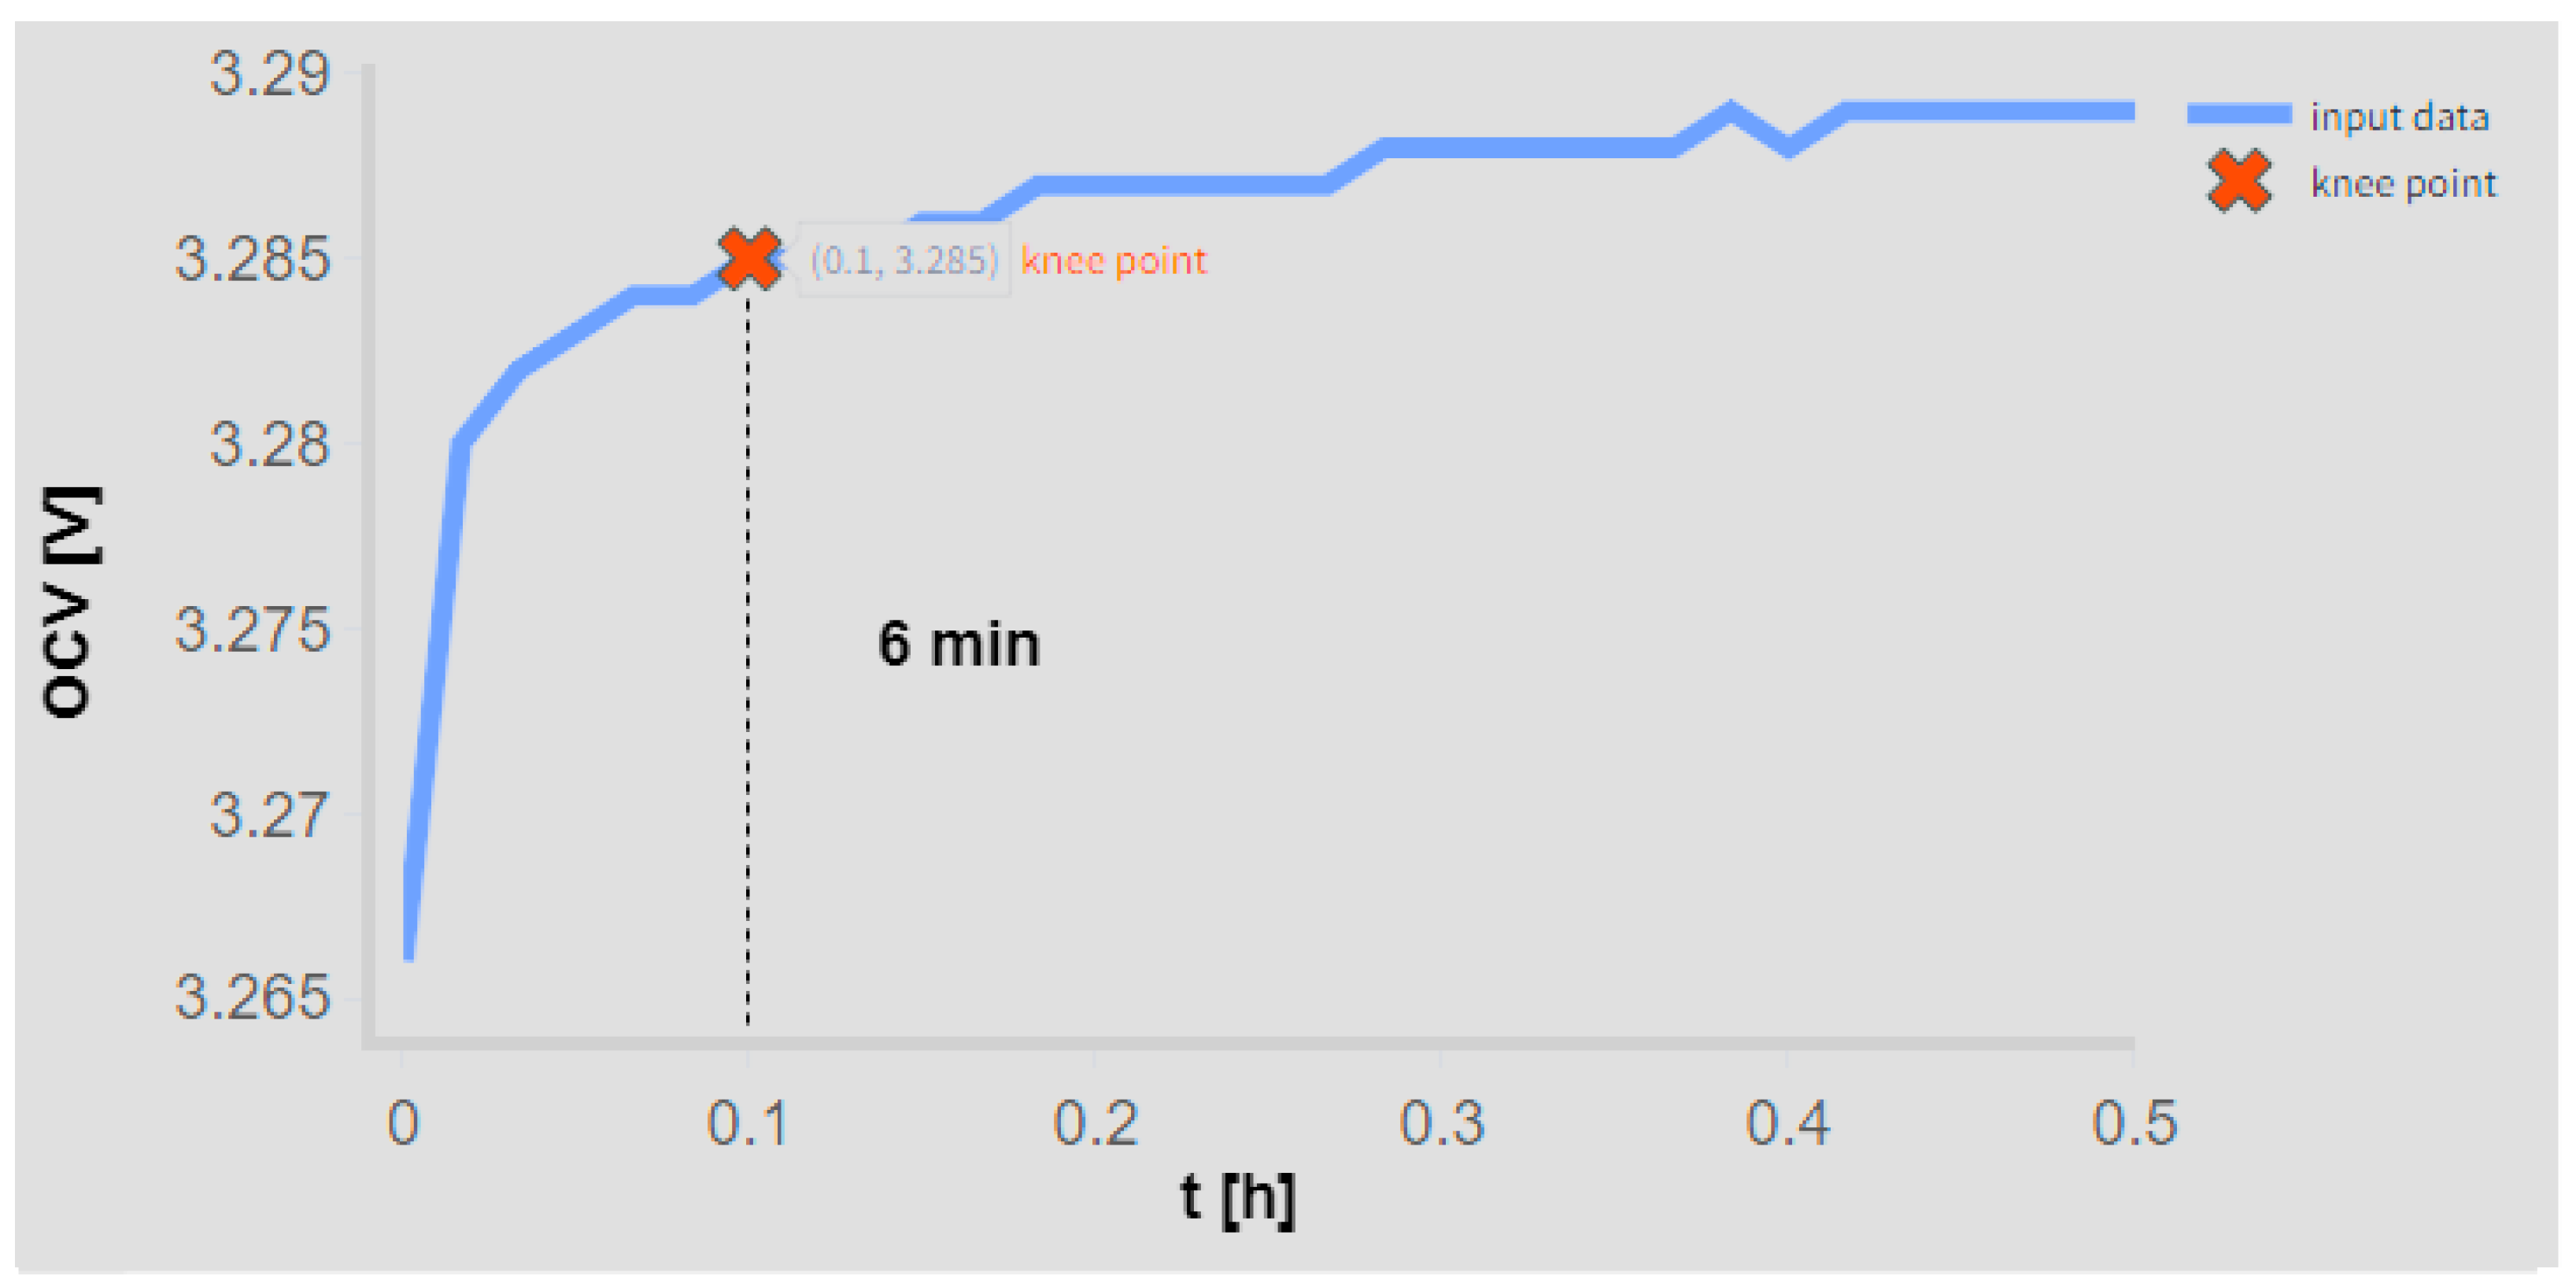
The testing methodology developed to rigorously assess the accuracy of the pro-posed model was conducted in two distinct stages. Initially, cell APR2 was subjected to controlled charge/discharge cycles, and its voltage relaxation response was continuously monitored over a period of 24 h. Using the collected data, knee/elbow points were first identified offline for the entire relaxation period. Subsequently, sections of the recorded data, each comprising 30 min intervals, were removed to evaluate whether such modifications influenced the determination of the knee/elbow point. This preliminary analysis indicated that the knee/elbow point was reached within approximately 6 min and it required a conservative time frame of 30 min of relaxation data to be accurately determined. All other cells from the APR group were similarly tested, confirming that this 30 min window of real-time voltage relaxation monitoring was indeed adequate for the accurate online determination of the knee/elbow point. The results for APR2 at a 60% SoC following a discharge/charge process are presented in
Figure 6,
Figure 7,
Figure 8,
Figure 9 and
Figure 10.
Following this validation phase, a comprehensive second stage of testing was conducted. All battery cells from the APR group were charged and discharged from 0% to 100% in 20% SoC intervals, and their voltage relaxation profiles were monitored continuously for 24 h, starting after each step. These 24 h relaxation data served as reference OCV values against which the proposed statistical method was evaluated. Subsequently, additional tests were performed, during which each battery cell was charged or discharged to predetermined SoC levels, followed by real-time voltage relaxation monitoring for just 30 min. During this shorter relaxation period, the knee/elbow point was determined online using the Kneedle algorithm. This online-detected knee/elbow point and the initial voltage reading from the relaxation curve were then used in the multivariable linear regression model to estimate the true OCV value. These estimated OCV values were directly compared with the reference OCV obtained from the full 24 h relaxation tests; see
Table 4 and
Table 5.
The proposed method for OCV estimation was tested at various SoC levels, particularly at 50% and 60%, where the plateau effect of LiFePO4 batteries poses a significant challenge due to minimal voltage variation. The method’s robustness was evaluated using four distinct data sets: an APR2 battery at 60% SoC (used to train the model), the same APR2 battery at 50% SoC (for model verification), and a BSE4 battery at both 60% and 50% SoCs, with previously unknown characteristics. The monitoring process extended over 24 h, using the stop condition of ±1 mV/hour voltage variation to determine the true OCV, allowing for precise comparisons between the true and computed OCV values. The relative errors computed from this comparison were summarized specifically for the most challenging scenarios, representing the largest deviations from the actual measured values, as shown in
Table 6 and
Table 7.
The results demonstrated high accuracy in OCV computation. During the discharge process, the model showed a relative error ranging between 1.087% and 1.187% across the different batteries and SoC levels. For instance, the APR battery at a 60% SoC yielded a computed OCV of 3.2555 V, closely matching the true OCV of 3.294 V, with a relative error of 1.168%. Similarly, the method achieved even higher accuracy during the charging process, with relative errors ranging from 0.027% to 0.257%. The APR battery at a 60% SoC exhibited a computed OCV of 3.3001 V, nearly identical to the true OCV of 3.301 V, resulting in a minimal relative error of 0.027%. These findings underscore the method’s ability to provide highly accurate OCV estimations during both charging and discharging scenarios.
The proposed method offers significant advantages compared to others from the literature. The fast characterization method from [
7] reported errors exceeding 7%, particularly when brief relaxation times were used. In contrast, the proposed method achieves much lower errors. It also reduces the time required for OCV determination by focusing on real-time data until the knee/elbow point is detected—typically within an hour—compared to other methods’ traditional 24 h rest periods. This efficiency is particularly advantageous for real-time applications, such as in electric vehicles and large-scale energy storage systems, where minimizing downtime is critical. Another key advantage is the model’s adaptability. Traditional methods, such as those relying on fixed relaxation periods, like [
1], often fail to adjust dynamically to varying battery conditions, leading to inaccuracies. The proposed method leverages the Kneedle algorithm to dynamically identify the knee/elbow point in real time, ensuring accurate OCV estimation even under fluctuating conditions. This real-time capability enhances the method’s applicability in environments requiring quick and accurate battery management, improving the overall system efficiency and reliability. Moreover, the proposed approach strikes an effective balance, delivering low relative errors without relying on intricate model structures, like in [
21], or sophisticated electrochemical or machine learning-based models that require extensive datasets and powerful computational platforms [
5].
While the proposed method offers significant advantages in accuracy and time efficiency, it is not without limitations. One of the primary challenges is its reliance on the accurate detection of the knee/elbow point in the voltage relaxation curve. Although the Kneedle algorithm is effective in identifying this point, its accuracy can be affected by noise in the data or atypical battery behavior, potentially leading to less reliable OCV estimates in certain scenarios. Additionally, the method requires continuous data collection until the knee/elbow point is detected, which, although typically less than an hour, might still be too long for applications that demand immediate OCV estimations. Furthermore, the method has been primarily validated on LiFePO4 batteries, and its effectiveness across other battery chemistries or under extreme environmental conditions has not been thoroughly tested, potentially limiting its generalizability. Finally, while the method reduces the computational complexity compared to some advanced techniques, it still necessitates real-time processing capabilities, which may not be available in all battery management systems, particularly in cost-sensitive applications.
6. Conclusions
In this study, a novel statistical model for the determination of the OCVs of LFP batteries has been developed and validated using experimental data. The key innovation of this model lies in its ability to dynamically and reliably detect the critical knee/elbow point in the battery’s voltage relaxation curve through an online observer based on the Kneedle algorithm. When coupled with the initial voltage measurement, this method facilitates the precise, real-time computation of the OCV at the onset of voltage stabilization. The experimental results highlight the effectiveness of this approach, demonstrating consistently high accuracy, with estimation errors below 0.26% following charging processes and less than 1.2% during discharge.
The introduced dual-model framework—explicitly distinguishing between charging and discharging processes—effectively accounts for the electrochemical hysteresis and inherent nonlinearities characteristic of LFP battery chemistries. This clear separation significantly enhances the robustness, reliability, and practical applicability of the proposed method compared to traditional approaches, which commonly rely on fixed relaxation intervals or overly complex electrochemical models. Furthermore, the method’s minimal data requirements, computational simplicity, and independence from operational variables such as the current rate and temperature render it particularly suitable for real-time battery management systems.
Author Contributions
Conceptualization, T.-I.V.; methodology, T.-I.V. and M.-A.P.; validation, methodology, T.-I.V. and M.-A.P.; investigation, T.-I.V., M.-A.P., B.-A.E., V.A., P.S. and G.-C.S.; writing—original draft preparation, T.-I.V.; writing—review and editing, B.-A.E., V.A. and G.-C.S.; visualization, P.S. and G.-C.S.; software, T.-I.V., B.-A.E. and V.A.; supervision, G.-C.S. All authors have read and agreed to the published version of the manuscript.
Funding
This research was funded by the “PubArt” Program, which is financed by the National University of Science and Technology POLITEHNICA Bucharest.
Data Availability Statement
The original contributions presented in this study are included in the article. Further inquiries can be directed to the corresponding author.
Conflicts of Interest
The authors declare no conflicts of interest.
References
- Dang, X.; Yan, L.; Jiang, H.; Wu, X.; Sun, H. Open-circuit voltage-based state of charge estimation of lithium-ion power battery by combining controlled auto-regressive and moving average modeling with feedforward-feedback compensation method. Int. J. Electr. Power Energy Syst. 2017, 90, 27–36. [Google Scholar] [CrossRef]
- Liu, Q.-Q.; Chen, B.; Zhang, J. Life prediction of satellite lithium battery based on multi time-scale Extended Kalman Filter (EKF) algorithm. Univ. Politeh. Buchar. Sci. Bull. Ser. C—Electr. Eng. Comput. Sci. 2018, 80, 67–80. [Google Scholar]
- Pei, L.; Wang, T.; Lu, R.; Zhu, C. Development of a voltage relaxation model for rapid open-circuit voltage prediction in lithium-ion batteries. J. Power Sources 2014, 253, 412–418. [Google Scholar] [CrossRef]
- Somakettarin, N.; Funaki, T. Study on Factors for Accurate Open Circuit Voltage Characterizations in Mn-Type Li-Ion Batteries. Batteries 2017, 3, 8. [Google Scholar] [CrossRef]
- Liu, H.; Liang, F.; Hu, T.; Hong, J.; Ma, H. Multi-scale Fusion Model Based on Gated Recurrent Unit for Enhancing Prediction Accuracy of State-of-charge in Battery Energy Storage Systems. J. Mod. Power Syst. Clean Energy 2024, 12, 405–414. [Google Scholar] [CrossRef]
- Xu, J.; Cao, B.; Chen, Z.; Zou, Z. An online state of charge estimation method with reduced prior battery testing information. Int. J. Electr. Power Energy Syst. 2014, 63, 178–184. [Google Scholar] [CrossRef]
- Baronti, F.; Zamboni, W.; Roncella, R.; Saletti, R.; Spagnuolo, G. Open-circuit voltage measurement of Lithium-Iron-Phosphate batteries. In Proceedings of the 2015 IEEE International Instrumentation and Measurement Technology Conference (I2MTC) Proceedings, Pisa, Italy, 11–14 May 2015; pp. 1711–1716. [Google Scholar]
- Theuerkauf, D.; Swan, L. Characteristics of Open Circuit Voltage Relaxation in Lithium-Ion Batteries for the Purpose of State of Charge and State of Health Analysis. Batteries 2022, 8, 77. [Google Scholar] [CrossRef]
- Petzl, M.; Danzer, M.A. Advancements in OCV Measurement and Analysis for Lithium-Ion Batteries. IEEE Trans. Energy Convers. 2013, 28, 675–681. [Google Scholar] [CrossRef]
- Barai, A.; Widanage, W.D.; McGordon, A.; Jennings, P. The influence of temperature and charge-discharge rate on open circuit voltage hysteresis of an LFP Li-ion battery. In Proceedings of the 2016 IEEE Transportation Electrification Conference and Expo (ITEC), Dearborn, MI, USA, 27–29 June 2016; pp. 1–4. [Google Scholar]
- Rashid, M.; Pathan, T.S.; McGordon, A.; Kendrick, E.; Widanage, W.D. Investigation of hysteresis and relaxation behaviour in graphite and LiNi0.33Mn0.33Co0.33O2 electrodes. J. Power Sources 2019, 440, 227153. [Google Scholar] [CrossRef]
- Agudelo, B.O.; Pavan, A.M.; Zamboni, W.; Todd, R.; Forsyth, A.; Monmasson, E.; Spagnuolo, G. Experimental Analysis of Capacity Degradation in Lithium-ion Battery Cells with Different Rest Times. In Proceedings of the 2020 2nd IEEE International Conference on Industrial Electronics for Sustainable Energy Systems (IESES), Cagliari, Italy, 1–3 September 2020; pp. 44–49. [Google Scholar]
- Li, A.; Pelissier, S.; Venet, P.; Gyan, P. Fast Characterization Method for Modeling Battery Relaxation Voltage. Batteries 2016, 2, 7. [Google Scholar] [CrossRef]
- Zhou, M.-Y.; Zhang, J.-B.; Ko, C.-J.; Chen, K.-C. Precise prediction of open circuit voltage of lithium ion batteries in a short time period. J. Power Sources 2023, 553, 232295. [Google Scholar] [CrossRef]
- Baccouche, I.; Jemmali, S.; Manai, B.; Omar, N.; Amara, N. Improved OCV Model of a Li-Ion NMC Battery for Online SOC Estimation Using the Extended Kalman Filter. Energies 2017, 10, 764. [Google Scholar] [CrossRef]
- Baghdadi, I.; Briat, O.; Gyan, P.; Vinassa, J.M. State of health assessment for lithium batteries based on voltage–time relaxation measure. Electrochim. Acta 2016, 194, 461–472. [Google Scholar] [CrossRef]
- Magri, L.; Sequino, L.; Ferrari, C. Simulating the Electrochemical-Thermal Behavior of a Prismatic Lithium-Ion Battery on the Market under Various Discharge Cycles. Batteries 2023, 9, 397. [Google Scholar] [CrossRef]
- Hosen, M.S.; Gopalakrishnan, R.; Kalogiannis, T.; Jaguemont, J.; Van Mierlo, J.; Berecibar, M. Impact of Relaxation Time on Electrochemical Impedance Spectroscopy Characterization of the Most Common Lithium Battery Technologies—Experimental Study and Chemistry-Neutral Modeling. World Electr. Veh. J. 2021, 12, 77. [Google Scholar] [CrossRef]
- Satopaa, V.; Albrecht, J.; Irwin, D.; Raghavan, B. Finding a “Kneedle” in a Haystack: Detecting Knee Points in System Behavior. In Proceedings of the 2011 31st International Conference on Distributed Computing Systems Workshops, Minneapolis, MN, USA, 20–24 June 2011; pp. 166–171. [Google Scholar]
- Arvai, K. Kneed (v0.8.5); Zenodo, 9 July 2023. Available online: https://zenodo.org/records/8127224 (accessed on 16 March 2025).
- Yang, J.; Du, C.; Wang, T.; Gao, Y.; Cheng, X.; Zuo, P.; Ma, Y.; Wang, J.; Yin, G.; Xie, J.; et al. Rapid Prediction of the Open-Circuit-Voltage of Lithium Ion Batteries Based on an Effective Voltage Relaxation Model. Energies 2018, 11, 3444. [Google Scholar] [CrossRef]
- Zhang, R.; Xia, B.; Li, B.; Cao, L.; Lai, Y.; Zheng, W.; Wang, H.; Wang, W.; Wang, M. A Study on the Open Circuit Voltage and State of Charge Characterization of High Capacity Lithium-Ion Battery Under Different Temperature. Energies 2018, 11, 2408. [Google Scholar] [CrossRef]
Figure 1.
Methodology for the identification of characteristic points in the open-circuit voltage (OCV) profile: (a) knee point following discharge; (b) elbow point following charge.
Figure 1.
Methodology for the identification of characteristic points in the open-circuit voltage (OCV) profile: (a) knee point following discharge; (b) elbow point following charge.
Figure 2.
LFP batteries used for model development and testing (Group 1—LithiumWerks APR18650) and those used for the validation of the model (Group 2—BSE18650).
Figure 2.
LFP batteries used for model development and testing (Group 1—LithiumWerks APR18650) and those used for the validation of the model (Group 2—BSE18650).
Figure 3.
Experimentally recorded open-circuit voltage (OCV) profile for 24 h following a discharge process in 20% SoC intervals.
Figure 3.
Experimentally recorded open-circuit voltage (OCV) profile for 24 h following a discharge process in 20% SoC intervals.
Figure 4.
Experimentally recorded open-circuit voltage (OCV) profile for 24 h following a charge process in 20% SoC intervals.
Figure 4.
Experimentally recorded open-circuit voltage (OCV) profile for 24 h following a charge process in 20% SoC intervals.
Figure 5.
Experimental setup for open-circuit voltage (OCV) profile acquisition and validation.
Figure 5.
Experimental setup for open-circuit voltage (OCV) profile acquisition and validation.
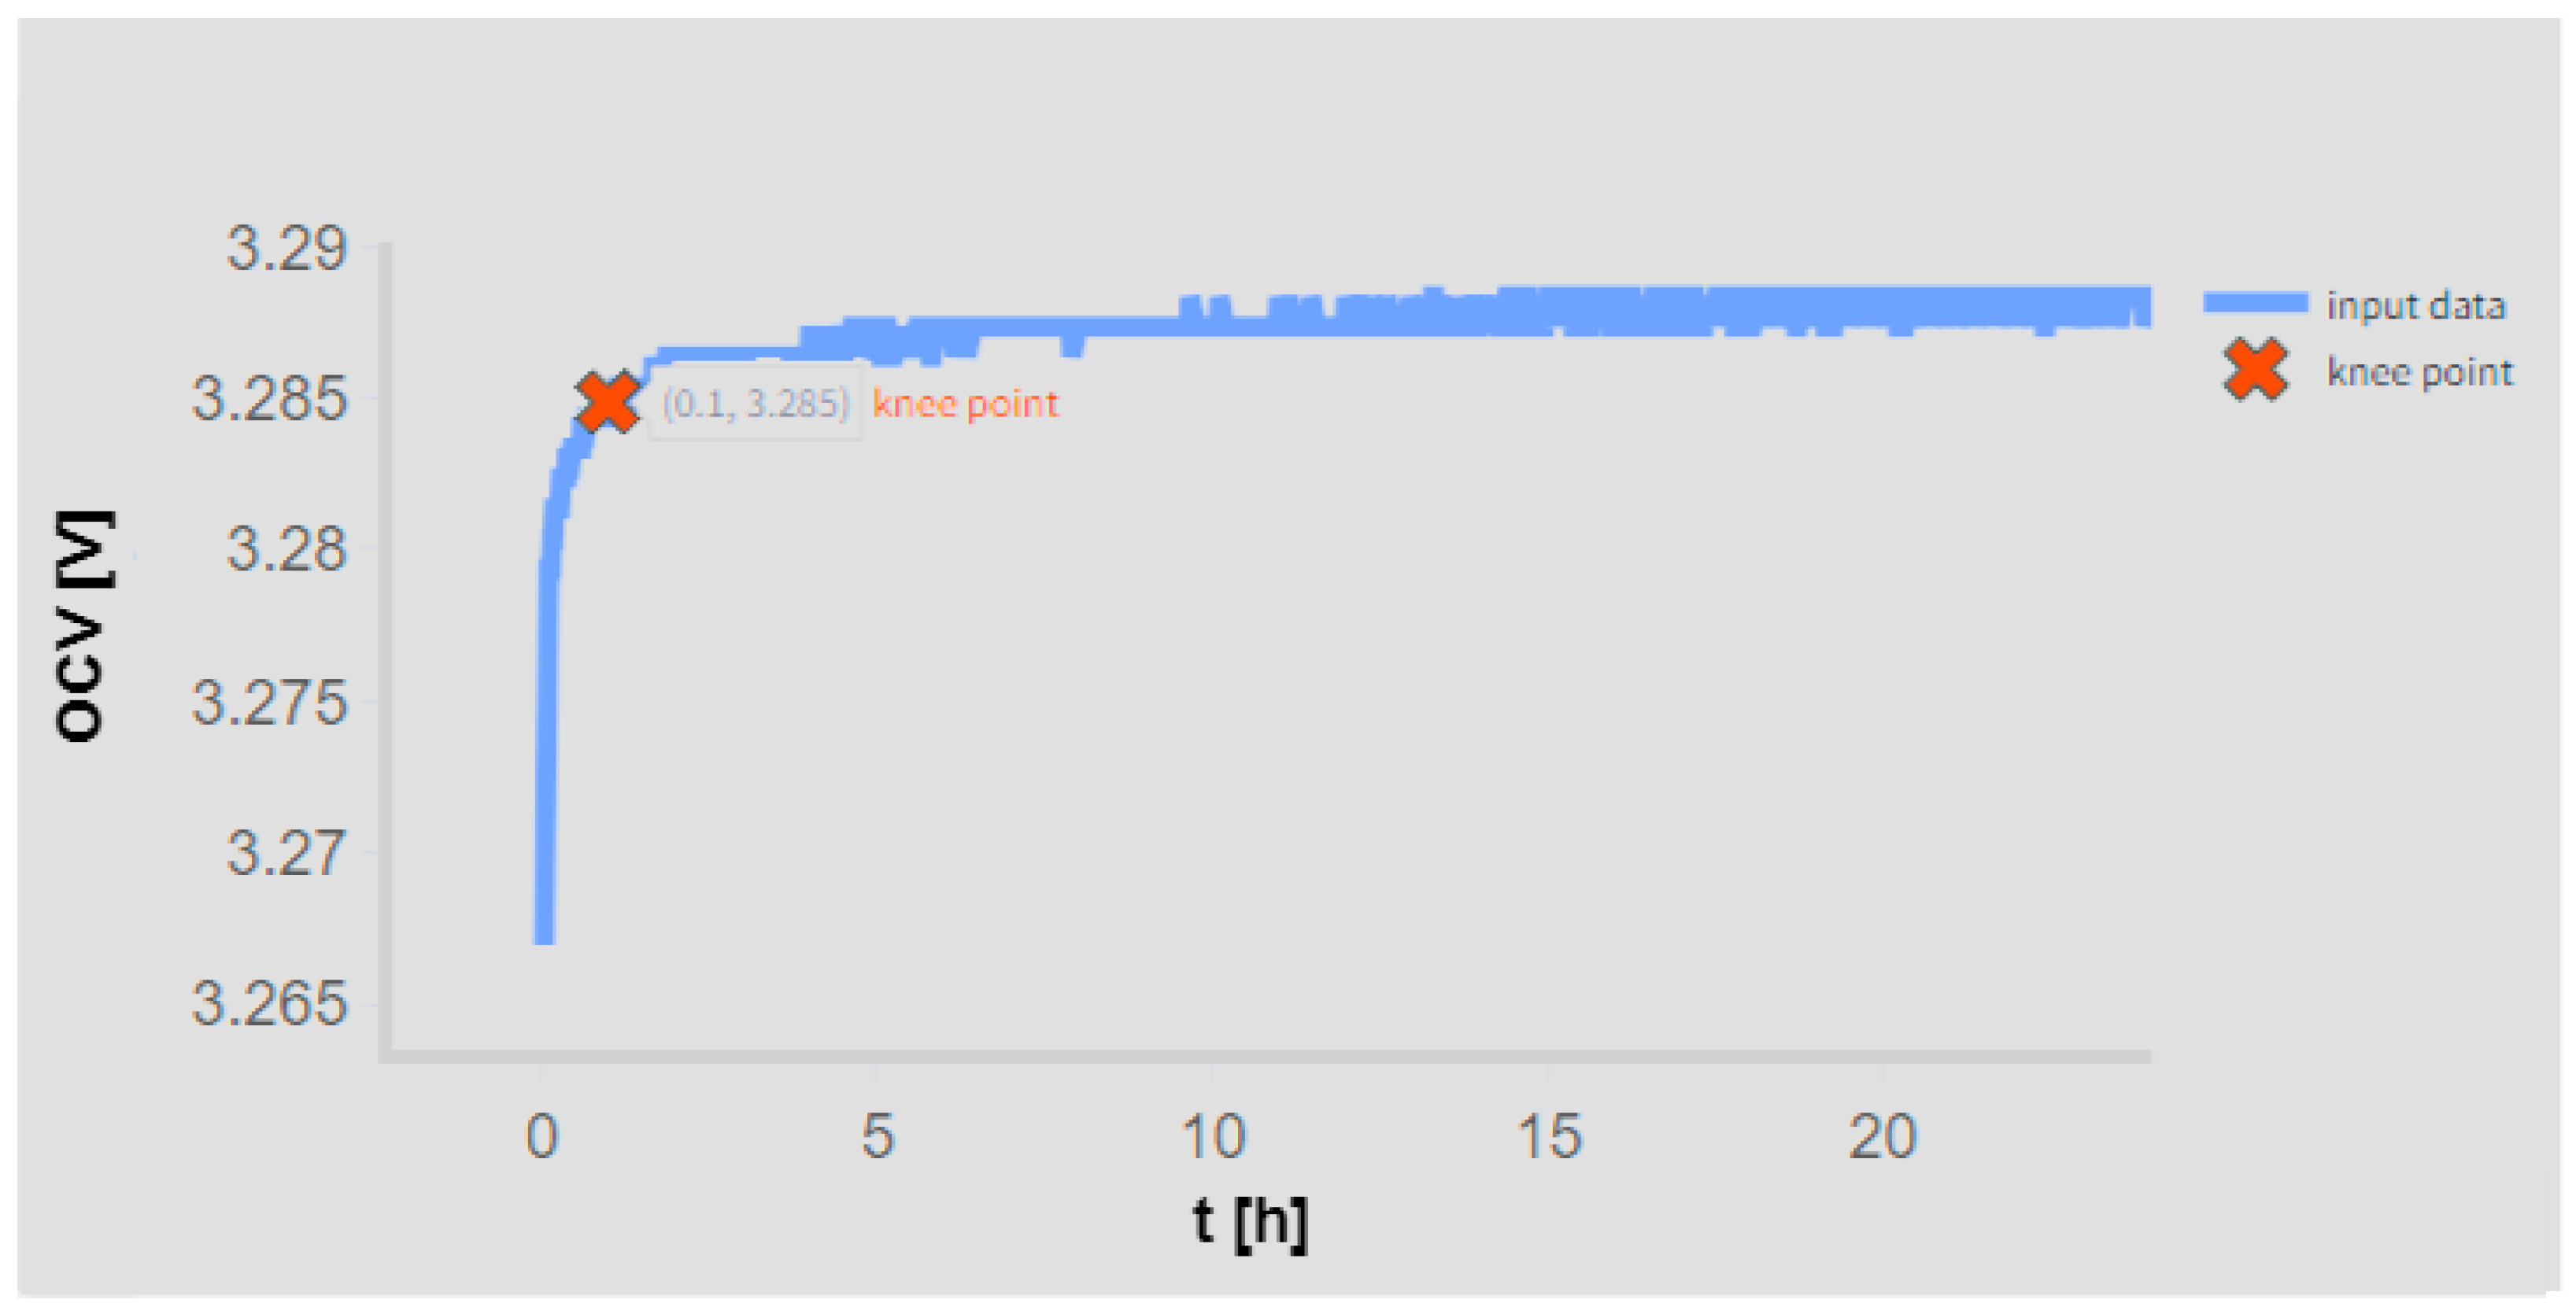
Figure 6.
Real-time identification of the knee point on the open-circuit voltage (OCV) profile using the Kneedle algorithm for the APR battery at 60% SoC for 24 h after discharge.
Figure 6.
Real-time identification of the knee point on the open-circuit voltage (OCV) profile using the Kneedle algorithm for the APR battery at 60% SoC for 24 h after discharge.
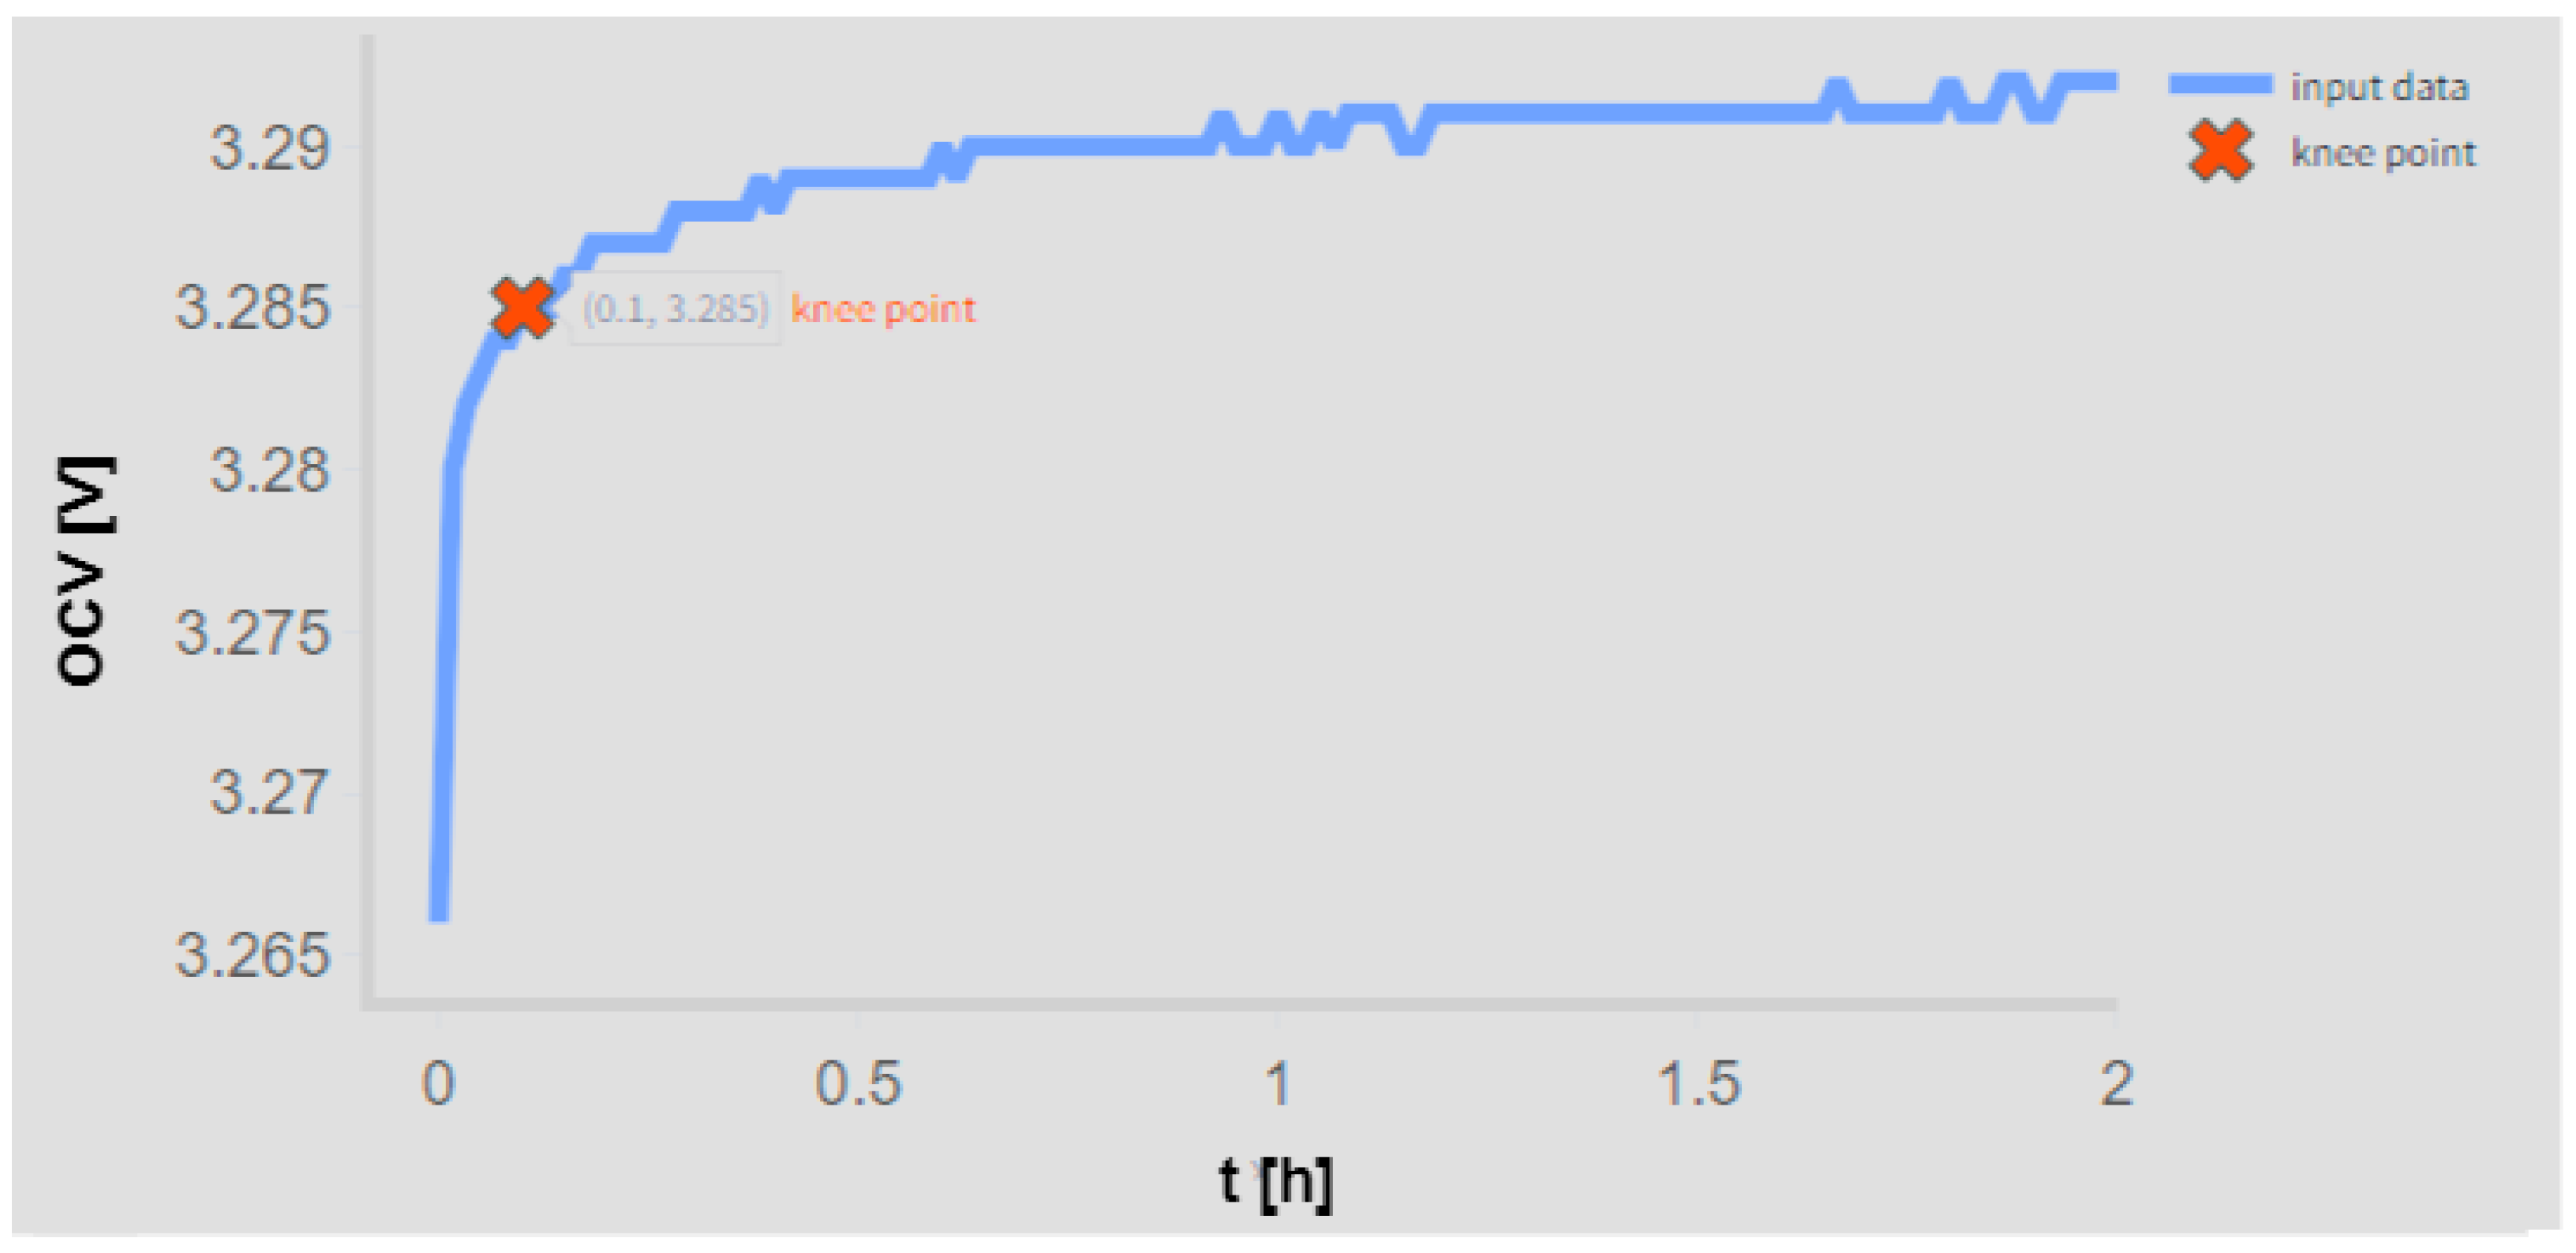
Figure 7.
Real-time identification of the knee point on the open-circuit voltage (OCV) profile using the Kneedle algorithm for the APR battery at 60% SoC for 2 h after discharge.
Figure 7.
Real-time identification of the knee point on the open-circuit voltage (OCV) profile using the Kneedle algorithm for the APR battery at 60% SoC for 2 h after discharge.
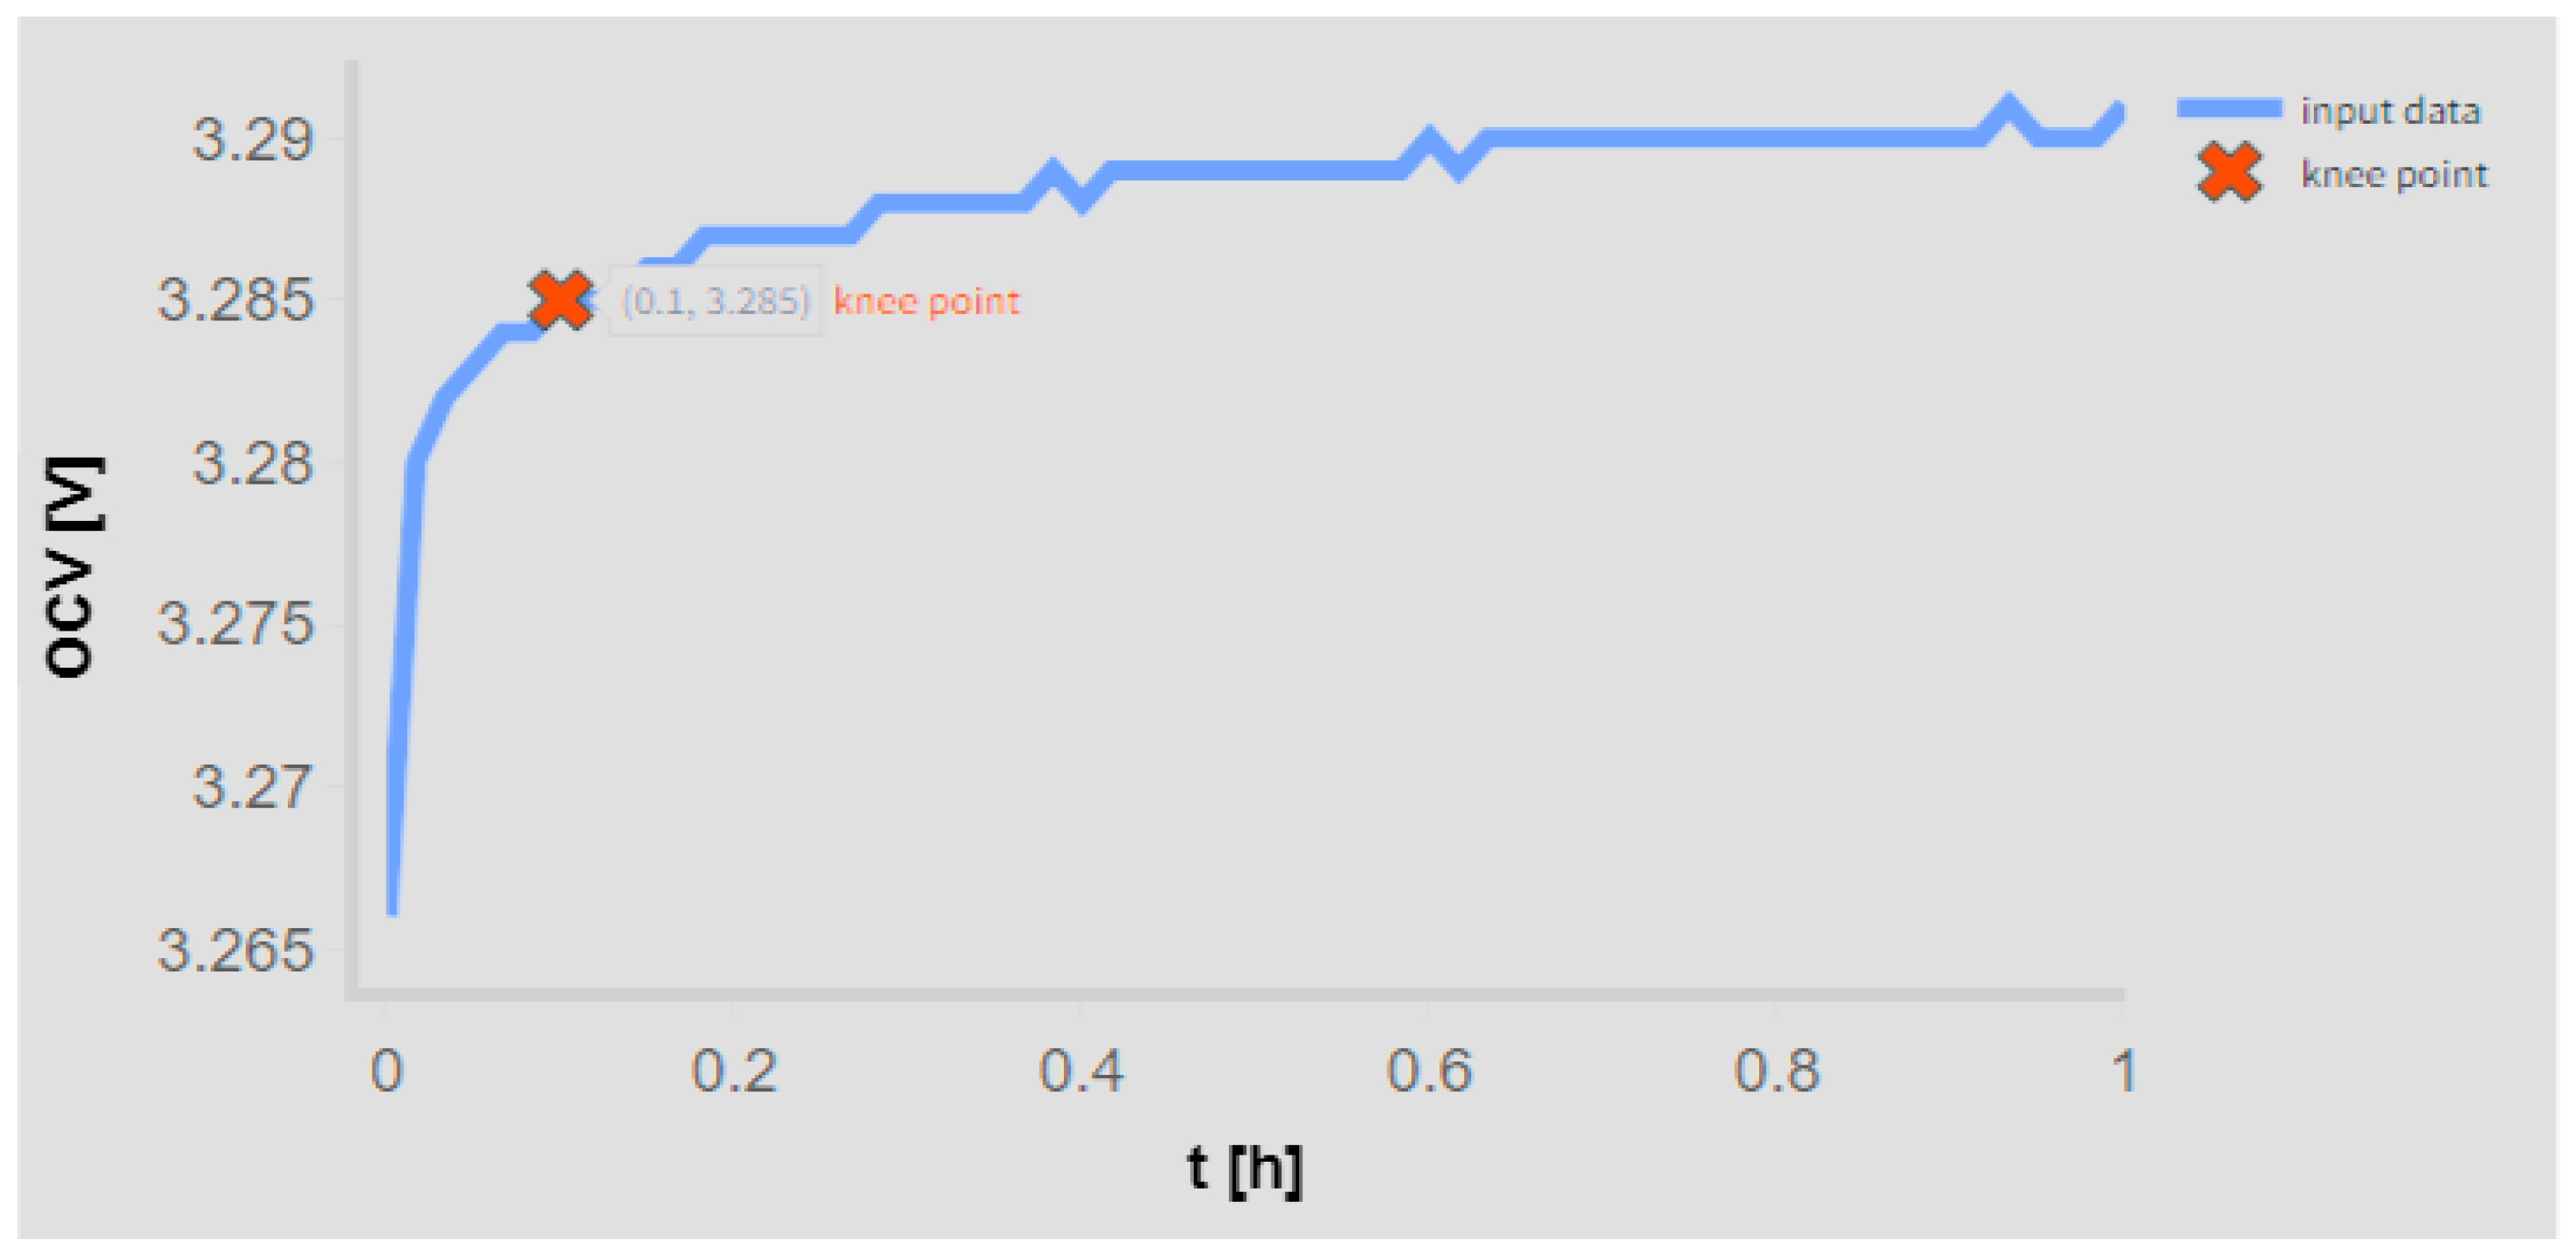
Figure 8.
Real-time identification of the knee point on the open-circuit voltage (OCV) profile using the Kneedle algorithm for the APR battery at 60% SoC for 1 h after discharge.
Figure 8.
Real-time identification of the knee point on the open-circuit voltage (OCV) profile using the Kneedle algorithm for the APR battery at 60% SoC for 1 h after discharge.
Figure 9.
Real-time identification of the knee point on the open-circuit voltage (OCV) profile using the Kneedle algorithm for the APR battery at 60% SoC for 30 min after discharge.
Figure 9.
Real-time identification of the knee point on the open-circuit voltage (OCV) profile using the Kneedle algorithm for the APR battery at 60% SoC for 30 min after discharge.
Figure 10.
Real-time identification of the elbow point on the open-circuit voltage (OCV) profile using the Kneedle algorithm for the APR battery at 60% SoC for 30 min after charge.
Figure 10.
Real-time identification of the elbow point on the open-circuit voltage (OCV) profile using the Kneedle algorithm for the APR battery at 60% SoC for 30 min after charge.
Table 1.
Characteristic parameters of the batteries.
Table 1.
Characteristic parameters of the batteries.
| Characteristic | APR | BSE |
|---|
| Supplier | LithiumWerks (Enschede, The Netherlands) | BSE (Eindhoven, The Netherlands) |
| Chemistry | LiFePO4 | LiFePO4 |
| Type | 18,650 | 18,650 |
| Nominal voltage | 3.3 V | 3.2 V |
| Nominal capacity | 1.1 Ah | 1.5 Ah |
| Standard charge | 3.6 V/1 C/<50 mA | 3.65 V/0.5 C/<15 mA |
| Standard discharge | 2 V/0.2 C | 2.5 V/0.2 C |
| Internal resistance | 12.6 mΩ | 35 mΩ |
| Standard test conditions | 23 ± 2 °C | 23 ± 2 °C |
Table 2.
Model assumption verification.
Table 2.
Model assumption verification.
| Test Performed | OCV Charge | OCV Discharge |
|---|
| 3-Sigma | No outliers | No outliers |
| Durbin–Watson | 2.416 | 2.297 |
| Pearson coeff. min. | 0.957 | 0.998 |
| ANOVA | F(2,2) = 1975.59 | F(2,2) = 9117.26 |
Table 3.
Metrological characteristics of the equipment.
Table 3.
Metrological characteristics of the equipment.
| Equipment | Name | Description |
|---|
| DC power supply | TENMA 72-2535 | Voltage range: 0–30 V
Current range: 0–3 A
Resolution: 10 mV/1 mA
Accuracy: 0.5% + 20 mV/0.5% + 5 mA |
| DC electronic load | TENMA 72-13200 | Input: 150 W/0–120 V/0–30 A
Resolution: 0.1 mA (0–3 A)/1 mA (0–30 A), 0.1 mV (0–18 V), 1 mV (0–120 V)
Accuracy CC mode: ±(0.0% + 0.05% FS)
Accuracy CV mode: ±(0.05% + 0.025% FS) |
| Thermal chamber | - | Temperature range: −55 °C to 83 °C
Resolution: 0.1 °C
Accuracy: 0.5 °C |
| Personal computer | HP ProDesk 400G7 | Processor: i3-10100 CPU 3.6 GHz
RAM: 8 GB
Storage: SSD 256 GB |
| DAQ system | NI USB-6251 | ADC resolution: 16 bits
Sample rates: 1–1.25 MS/s
Sensitivity 28 µV
CMRR: 100 dB |
Table 4.
Experimental data for discharge model development.
Table 4.
Experimental data for discharge model development.
| DCHG | APR 0% | APR 20% | APR 40% | APR 60% | APR 80% |
|---|
| 2.012 V | 3.141 V | 3.255 V | 3.266 V | 3.292 V |
| 2.737 V | 3.236 V | 3.283 V | 3.285 V | 3.326 V |
| Computed OCV | 2.8259 V | 3.2186 V | 3.2547 V | 3.2555 V | 3.2959 V |
| True OCV | 2.847 V | 3.247 V | 3.289 V | 3.294 V | 3.330 V |
| Relative error | 0.738% | 0.872% | 1.042% | 1.168% | 1.023% |
Table 5.
Experimental data for charge model development.
Table 5.
Experimental data for charge model development.
| CHG | APR 20% | APR 40% | APR 60% | APR 80% | APR 100% |
|---|
| 3.285 V | 3.332 V | 3.357 V | 3.399 V | 3.594 V |
| 3.263 V | 3.310 V | 3.313 V | 3.345 V | 3.413 V |
| Computed OCV | 3.2490 V | 3.2998 V | 3.3001 V | 3.3333 V | 3.3896 V |
| True OCV | 3.249 V | 3.299 V | 3.301 V | 3.333 V | 3.389 V |
| Relative error | 0.002% | 0.025% | 0.027% | 0.009% | 0.017% |
Table 6.
Experimental data for the discharge process.
Table 6.
Experimental data for the discharge process.
| DCHG | APR 60% | APR 50% | BSE 60% | BSE 50% |
|---|
| 3.266 V | 3.261 V | 3.244 V | 3.244 V |
| 3.285 V | 3.282 V | 3.284 V | 3.285 V |
| Computed OCV | 3.2555 V | 3.2529 V | 3.2571 V | 3.2581 V |
| True OCV | 3.294 V | 3.292 V | 3.296 V | 3.294 V |
| Relative error | 1.168% | 1.187% | 1.179% | 1.087% |
Table 7.
Experimental data for the charge process.
Table 7.
Experimental data for the charge process.
| CHG | APR 60% | APR 50% | BSE 60% | BSE 50% |
|---|
| 3.357 V | 3.348 V | 3.409 V | 3.397 V |
| 3.313 V | 3.308 V | 3.317 V | 3.312 V |
| Computed OCV | 3.3001 V | 3.2952 V | 3.2979 V | 3.2934 V |
| True OCV | 3.301 V | 3.299 V | 3.304 V | 3.302 V |
| Relative error | 0.027% | 0.113% | 0.183% | 0.257% |
| Disclaimer/Publisher’s Note: The statements, opinions and data contained in all publications are solely those of the individual author(s) and contributor(s) and not of MDPI and/or the editor(s). MDPI and/or the editor(s) disclaim responsibility for any injury to people or property resulting from any ideas, methods, instructions or products referred to in the content. |
© 2025 by the authors. Licensee MDPI, Basel, Switzerland. This article is an open access article distributed under the terms and conditions of the Creative Commons Attribution (CC BY) license (https://creativecommons.org/licenses/by/4.0/).


 ,
, 


