Article

Multistage Early Warning of Sodium-Ion Battery Thermal Runaway Using Multidimensional Signal Analysis and Redundancy Optimization

by
Jinzhong Li
1,
Yuguang Xie
1,
Bin Xu
1,
Jiarui Zhang
2,
Xinyu Wang
2,* and
Lei Mao
2,*
1
State Grid Anhui Electric Power Research Institute, 299 Ziyun Road, Hefei 230601, China
2
Department of Precision Machinery and Precision Instrumentation, University of Science and Technology of China, No. 96 Jinzhai Road, Hefei 230026, China
*
Authors to whom correspondence should be addressed.
Batteries 2025, 11(3), 108; https://doi.org/10.3390/batteries11030108
Submission received: 21 January 2025 / Revised: 6 March 2025 / Accepted: 12 March 2025 / Published: 13 March 2025
(This article belongs to the Special Issue Batteries Aging Mechanisms and Diagnosis)

Abstract

:
This paper proposes an early warning method for thermal runaway in sodium-ion batteries (SIBs) based on multidimensional signal analysis and redundancy optimization. By analyzing signals such as voltage, temperature, strain, and gas concentrations, Principal Component Analysis (PCA) is employed to evaluate the contribution of each signal and reduce data redundancy, while correlation analysis further refines the signal set by eliminating overlapping information. The optimized signals enable a stage-specific warning framework, which identifies distinct phases of thermal runaway progression with high precision. Experimental results validate the effectiveness of the proposed method, showcasing its potential for real-time monitoring and enhanced safety management of sodium-ion battery systems in critical applications.

1. Introduction

Sodium-ion batteries (SIBs) are a promising alternative to lithium-ion batteries (LIBs) due to their lower cost, environmental benefits, and material abundance [1,2,3,4]. With the growing demand for energy storage in applications such as electric vehicles (EVs), grid systems, and portable devices, SIBs offer significant potential [5,6,7,8]. However, like other battery technologies, SIBs face critical safety challenges, particularly thermal runaway. This phenomenon, characterized by uncontrolled temperature increases, triggers exothermic reactions that further accelerate heat generation, often resulting in catastrophic outcomes such as fires or explosions [9]. Early detection of thermal runaway is essential for ensuring the safe operation of sodium-ion batteries [10,11,12,13].
Existing methods for detecting thermal runaway in sodium-ion batteries (SIBs) encompass not only the monitoring of parameters such as voltage, current, or temperature but also include advanced techniques like pulse resistance-based detection and calorimetric analysis [14,15,16]. For instance, Guo et al. [17] investigated thermal runaway by tracking the evolution of temperature and gas emissions, while Arnaud Bordes et al. [18] analyzed exhaust components generated during the thermal runaway process, proposing these as potential early warning indicators. In addition, studies on electrolyte thermal stability have been carried out to improve early warning strategies. Robinson et al. [19] advanced early warning models by conducting a comparative analysis of thermal runaway mechanisms in sodium-ion and lithium-ion batteries.
While these studies provide valuable insights, single-parameter approaches fail to capture the multidimensional and dynamic behavior of batteries under stress. Since internal changes that may indicate the onset of thermal runaway are often missed, the ability of these methods is significantly limited to providing comprehensive and timely warnings [20,21].
To overcome these challenges, this paper introduces a multidimensional early warning framework for thermal runaway in SIBs. The proposed method leverages signals such as voltage, temperature, strain, and gas concentrations to capture a battery’s internal state comprehensively. Principal Component Analysis (PCA) [22,23,24] and correlation analysis are used to reduce signal redundancy while retaining critical information. These optimized signals are then integrated into a predictive framework based on Long Short-Term Memory (LSTM) [25,26,27] neural networks to identify different stages of thermal runaway with high precision. Experimental validation demonstrates the method’s ability to improve early warning accuracy and stage-specific detection, supporting the real-time safety management of sodium-ion batteries.
The main contributions are summarized as follows:
  • A hierarchical early warning method based on multidimensional signals is proposed, utilizing redundancy analysis and an LSTM neural network to achieve accurate early detection of different stages of thermal runaway in sodium-ion batteries.
  • The proposed method is validated through electrical abuse experiments under different charging rates, demonstrating superior performance in reducing data redundancy, enhancing early warning accuracy, and improving stage classification capability, with a prediction accuracy exceeding 95%.
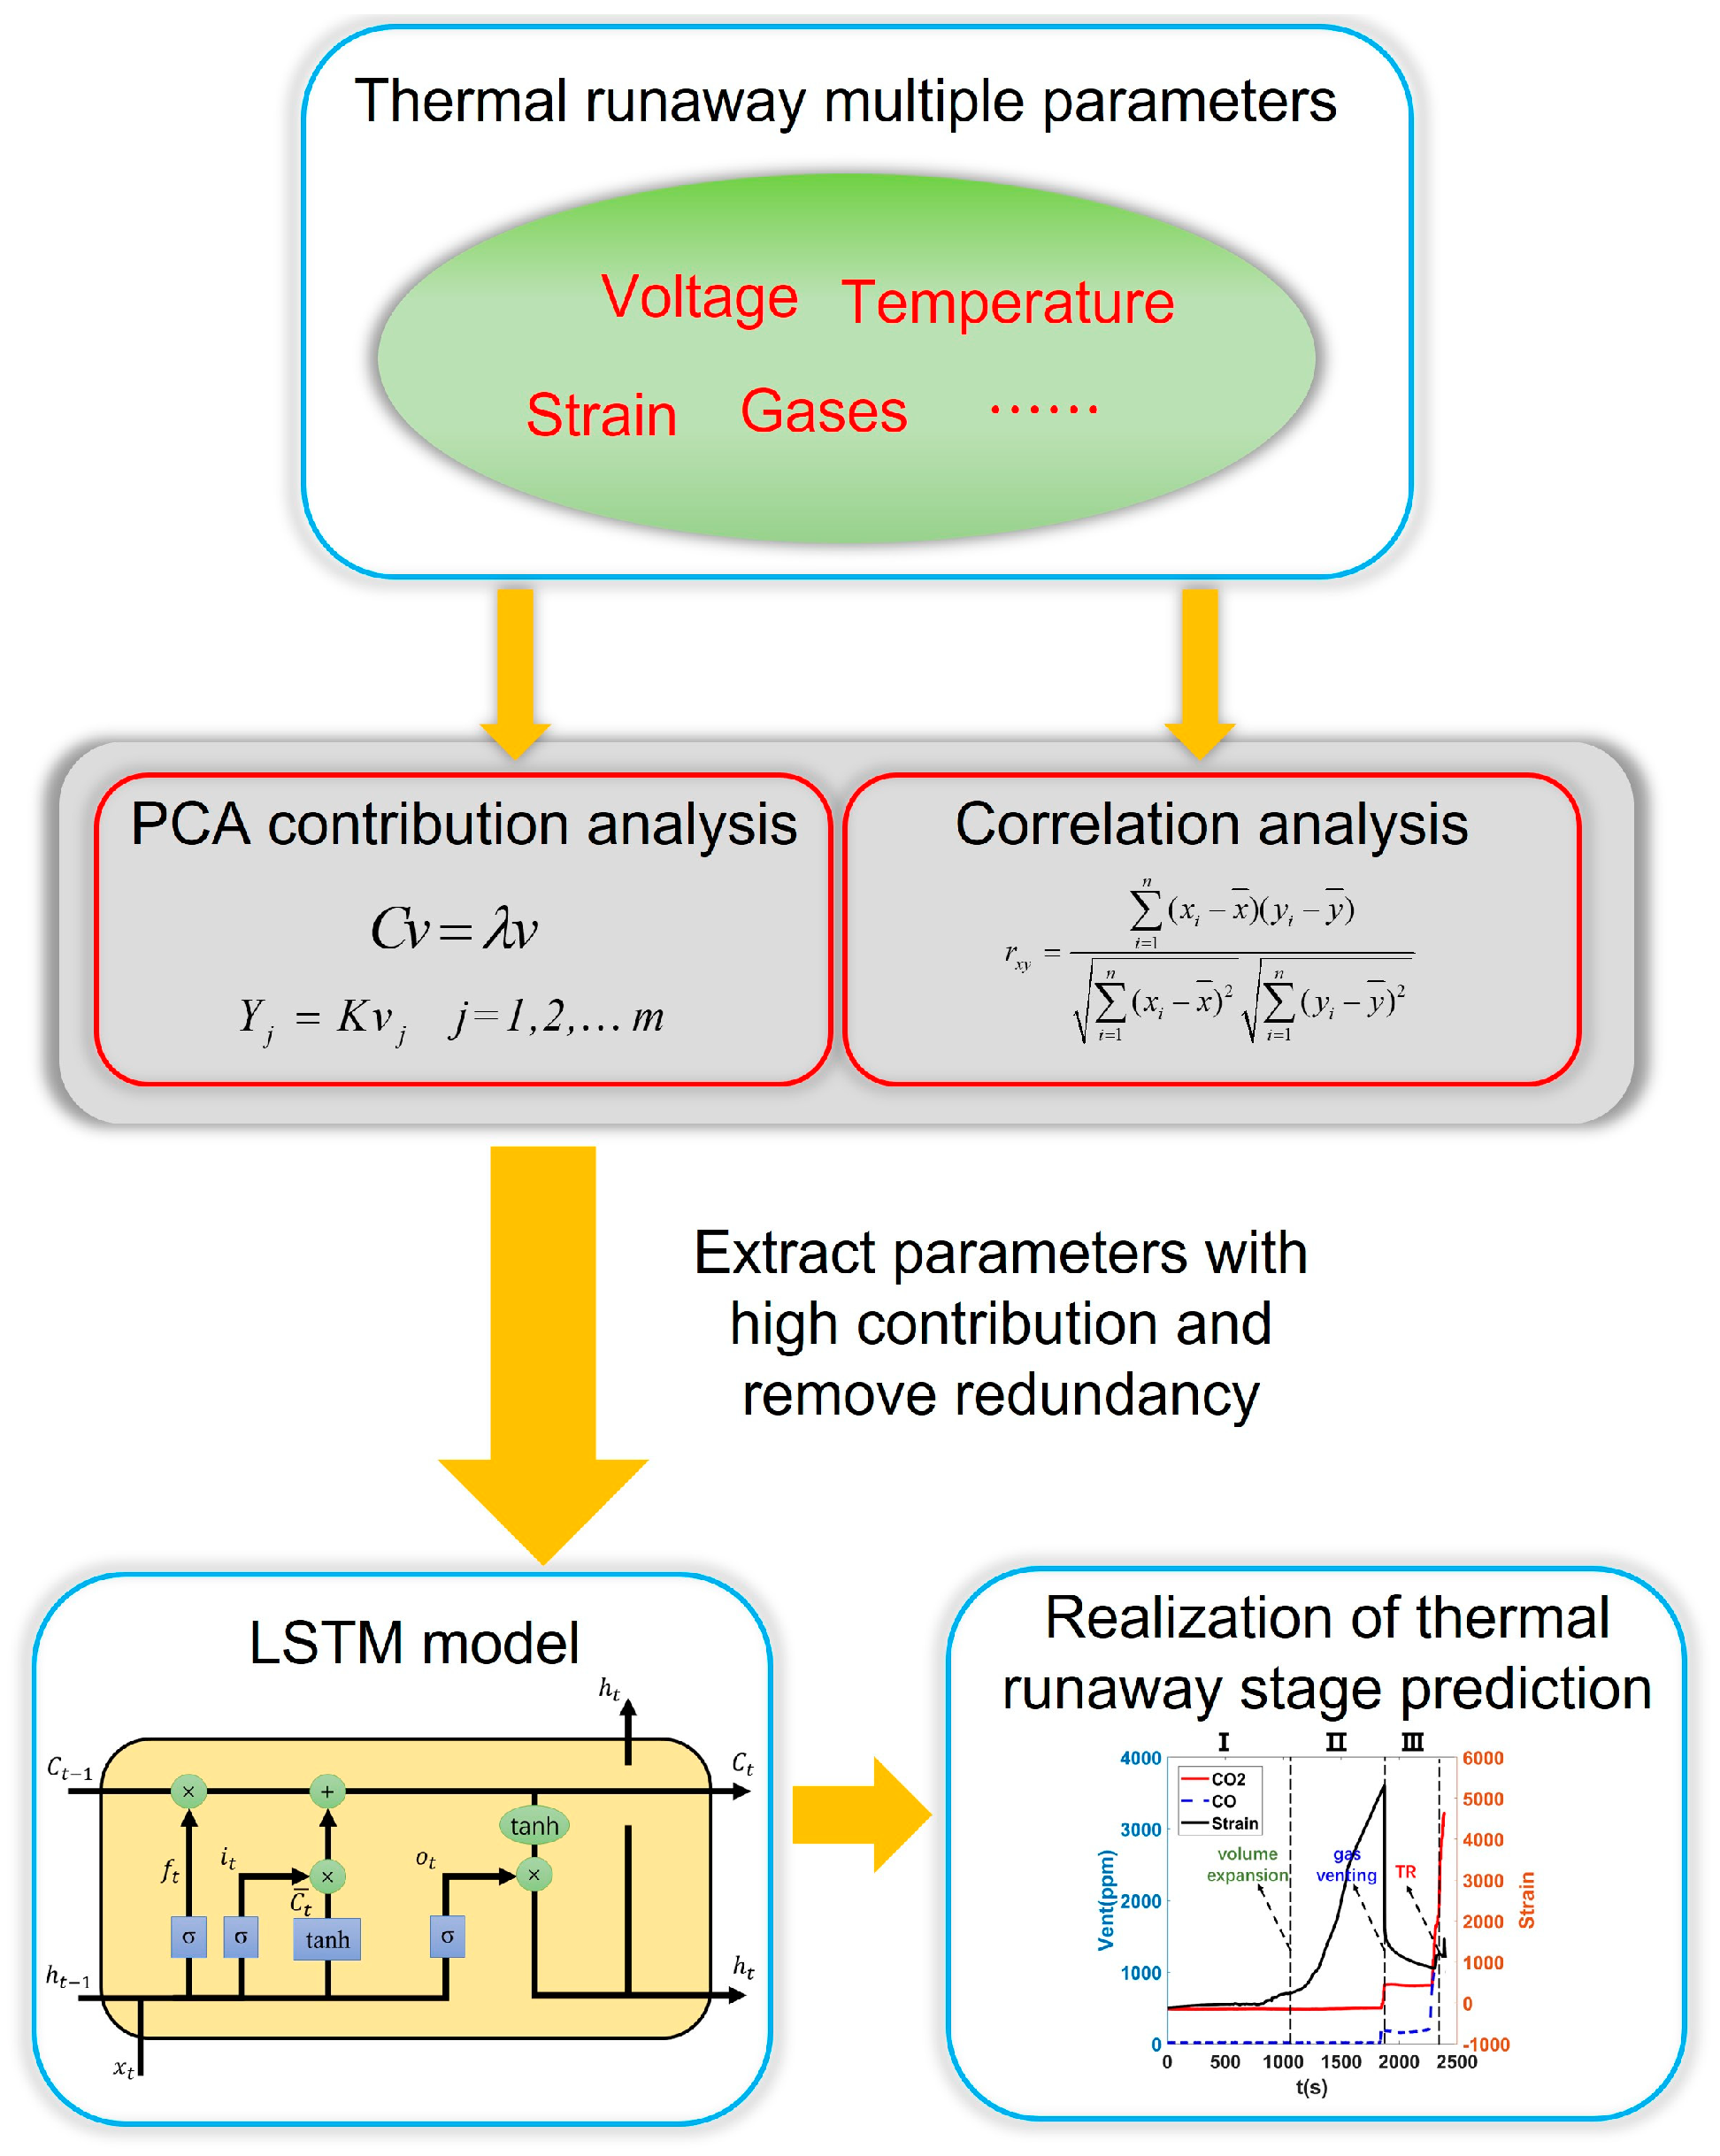
This paper is structured as follows: Section 2 outlines the methodology, including signal analysis and predictive modeling. Section 3 describes the experimental setup and data collection process. Section 4 presents the results and analysis. Finally, Section 5 concludes with key findings and future research directions.

2. Methodology

A flow chart of the proposed method is shown in Figure 1. The process begins with the collection of key parameters related to the thermal runaway process, such as voltage, temperature, strain, and exhaust gas. Next, PCA and correlation analysis are applied to reduce data redundancy while retaining critical features. Finally, an LSTM model is employed to predict the stages of thermal runaway.

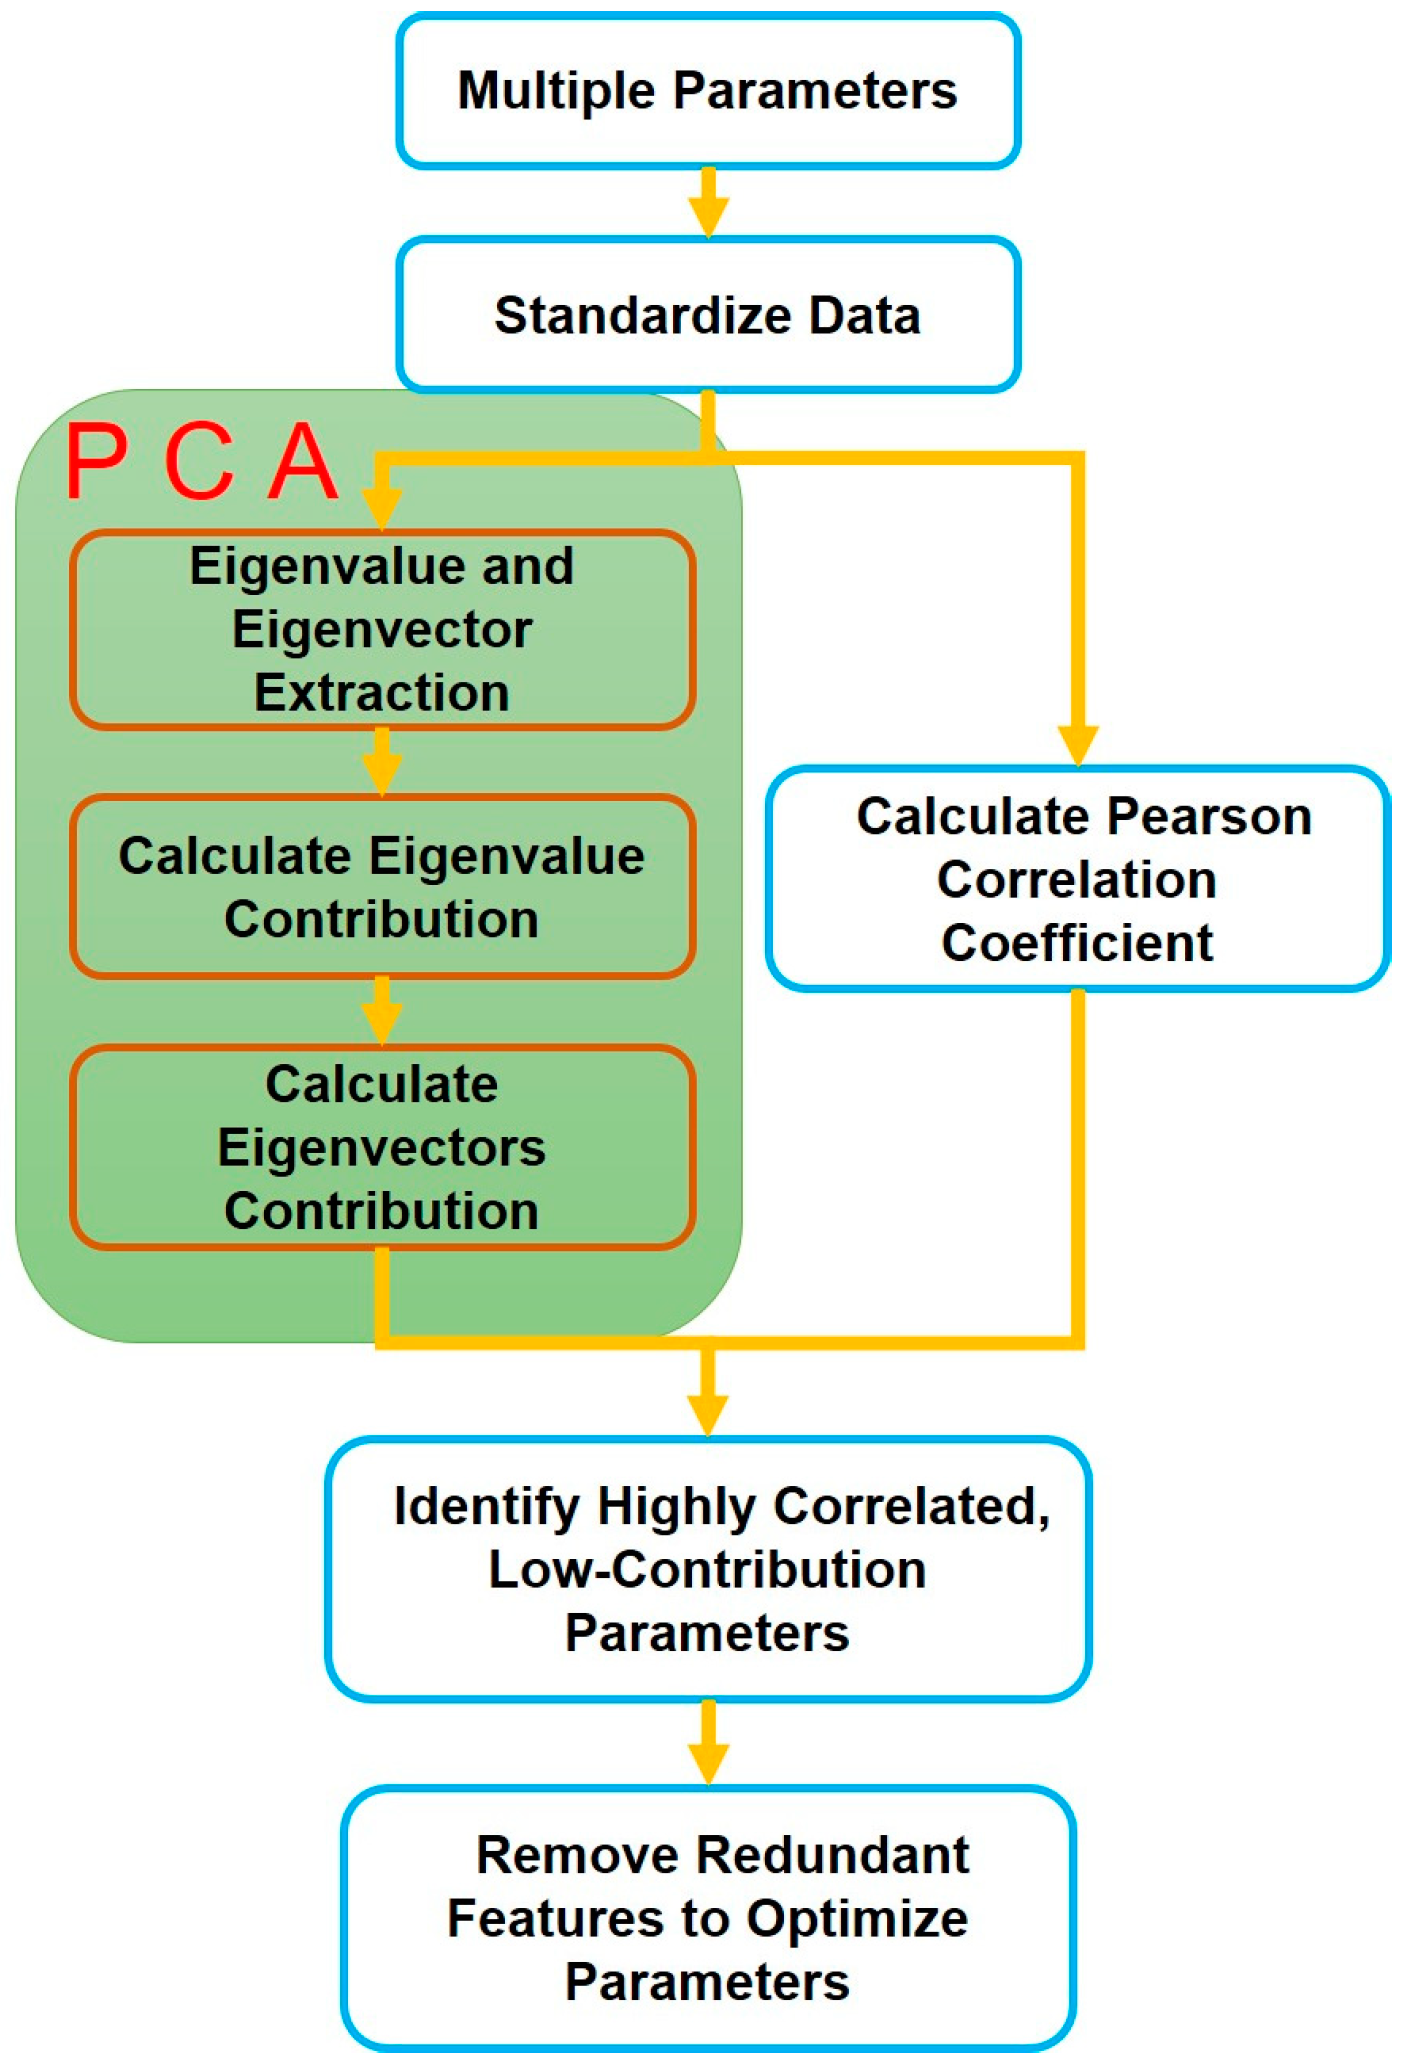
2.1. PCA-Based Feature Extraction

PCA is employed to evaluate the contribution of various parameters across different stages of thermal runaway, enabling the identification of key parameters that significantly influence each stage. Concurrently, correlation analysis is conducted to quantify the degree of redundancy among parameters, identifying those with high interdependence. By systematically eliminating parameters with low contributions and high redundancy, the structure of the detection parameters can be effectively optimized, thereby enhancing the efficiency and accuracy of the thermal runaway evaluation process. The process of reducing redundancy is shown in Figure 2.
In this study, PCA is employed as an effective dimensionality reduction technique to analyze complex datasets. By identifying directions that capture the maximum variance in the data, PCA transforms the original variables (e.g., voltage, temperature, strain, and gas venting) into a new coordinate system. Each parameter’s coefficient in the dimensionality reduction process is used to quantify its contribution to different stages of thermal runaway. This highlights the relative importance of each parameter in characterizing the progression of thermal runaway.
The main steps of principal component analysis are as follows:
(1)
To mitigate the effects of differing parameter dimensions, the original data matrix X is standardized to matrix K. The standardization is expressed by Equation (1).
K = X X ¯
where X is a sample matrix of n × m; n is the number of samples; and m is the number of features. X ¯ is the mean of the following:
X = x 11 x 12 x 1 m x 21 x 22 x 2 m x n 1 x n 2 x n m
x ¯ j = 1 n i = 1 n x i j ,    j = 1 , 2 , m
where x i , j , i = 1,2 , , n   a n d   j = { 1,2 , . . , m } are the i t h value of the j t h features.
(2)
Following data standardization, the covariance matrix for these features is calculated, which indicates the relationship of changes between each feature. The covariance matrix is calculated by Equation (4).
C o v ( K ) = 1 n 1 K T K
where v is the eigenvector of covariance matrix C for samples, and λ is the corresponding eigenvalue.
(3)
The eigenvalues and eigenvectors are extracted from the covariance matrix. Each eigenvalue represents the magnitude of the variance explained by its corresponding eigenvector, while each eigenvector explains the direction of a principal component. These values help identify the most important directions, or components, in the data for dimensionality reduction. Eigenvectors and eigenvalues are calculated in Equation (5).
C v = λ v
where v is the eigenvector, and λ is the corresponding eigenvalue.
(4)
Project the original data onto the principal component eigenvectors to achieve dimensionality reduction. The projection of the sample onto the eigenvector is calculated in Equation (6).
Y j = K v j j = 1 , 2 , m
Y j is the value obtained by projecting the normalized dataset on the j t h principal component eigenvector v j .
(5)
Calculate the contribution rate of each eigenvalue, which is expressed in Equation (7). Then, the eigenvectors v j of each principal component are weighted by the ratio of their corresponding eigenvalues as shown in Equation (8). Furthermore, the coefficients of each parameter within the eigenvector v ¯ are utilized to characterize the contribution of each parameter to the evaluation of thermal runaway stages. This approach allows for a quantifiable and systematic assessment of how each parameter influences the progression of thermal runaway.
ω j = λ j j = 1 m λ j
v ¯ = j = 1 m ω j v j
where ω j is the weight of each principal component eigenvalue, and ν ¯ is the weighted eigenvector, which is the combined contribution of each parameter. In the evaluation process of thermal runaway using multidimensional signals, the presence of highly redundant parameters, characterized by strong correlations between certain parameters, can lead to overlapping or repeated information. Such redundancy increases the complexity of data processing, reduces computational efficiency, and may negatively impact the accuracy of model predictions. To address this, correlation analysis can be employed to evaluate and optimize parameter selection, ensuring that only the most informative and independent parameters are retained for subsequent analysis. This approach not only simplifies data structures but also enhances model performance by eliminating irrelevant or redundant features.
The Pearson correlation coefficient is used to quantify the linear correlation between pairs of parameters. It measures the strength and direction of the linear relationship between two variables [28,29]. It is calculated in Equation (9).
r x y = i = 1 n ( x i x ¯ ) ( y i y ¯ ) i = 1 n ( x i x ¯ ) 2 i = 1 n ( y i y ¯ ) 2
where x ¯ and y ¯ are the mean values of x and y. x ¯ and y ¯ are the means of the two features, respectively, and r x y is the Pearson correlation coefficient of the two features.

2.2. Long Short-Term Memory Neural Network-Based SIBs Warning

After completing the parameter selection process, a classification model based on the LSTM network is developed [30]. The LSTM network is well-suited for capturing dynamic variations and temporal dependencies inherent in time-series signals, and selected parameters serve as inputs to the model, enabling the classification of each signal into corresponding stages of the thermal runaway evolution process.
As illustrated in Figure 3, each LSTM cell consists of current input x t , output h t , and three gates: input gate i t , forget gate f t , and output gate o t . These gates are designed to regulate output values at each time step, ensuring that errors are effectively controlled during neuron transitions. In LSTM architecture, new input and all gate computations incorporate the previous output h t 1 as part of the current input. Consequently, inputs for x t , i t , f t , and o t are all formulated as a concatenation of [ x t , h t 1 ].
The modeling process with LSTM can be outlined as follows:
(1)
Identify and specify input features (selected parameters) and corresponding output labels (thermal runaway stages) required for the modeling task.
(2)
Normalize input data using a standard normalization method to ensure all features are on a similar scale. Divide the normalized data into two subsets, including a training set for model learning and a testing set for performance evaluation.
(3)
Construct an LSTM network and randomly initialize its hyperparameters, including learning rate, weights, and biases. Train the LSTM model using a training dataset, iteratively updating parameters until termination criteria are met.
(4)
After training the LSTM model, evaluate the network’s classification performance using a confusion matrix. The confusion matrix provides a quantitative comparison of actual class labels ( y t r u e ) and predicted class labels ( y p r e d ) for the test dataset. It is structured in Equation (10).
T P F P F N T N
where True Positives (TP) means correct predictions for a specific class; True Negatives (TN) means correct predictions for other classes; False Positives (FP) means misclassified samples as the target class; and False Negatives (FN) means misclassified samples not belonging to the target class. The evaluation standard Accuracy is used to evaluate the accuracy of model detection, which is calculated in Equation (11).
A c c u r a c y = T P + T N T P + T N + F P + F N
This systematic process ensures that the LSTM network effectively captures temporal dependencies within the data and performs robust classification or prediction tasks.

3. Experiment

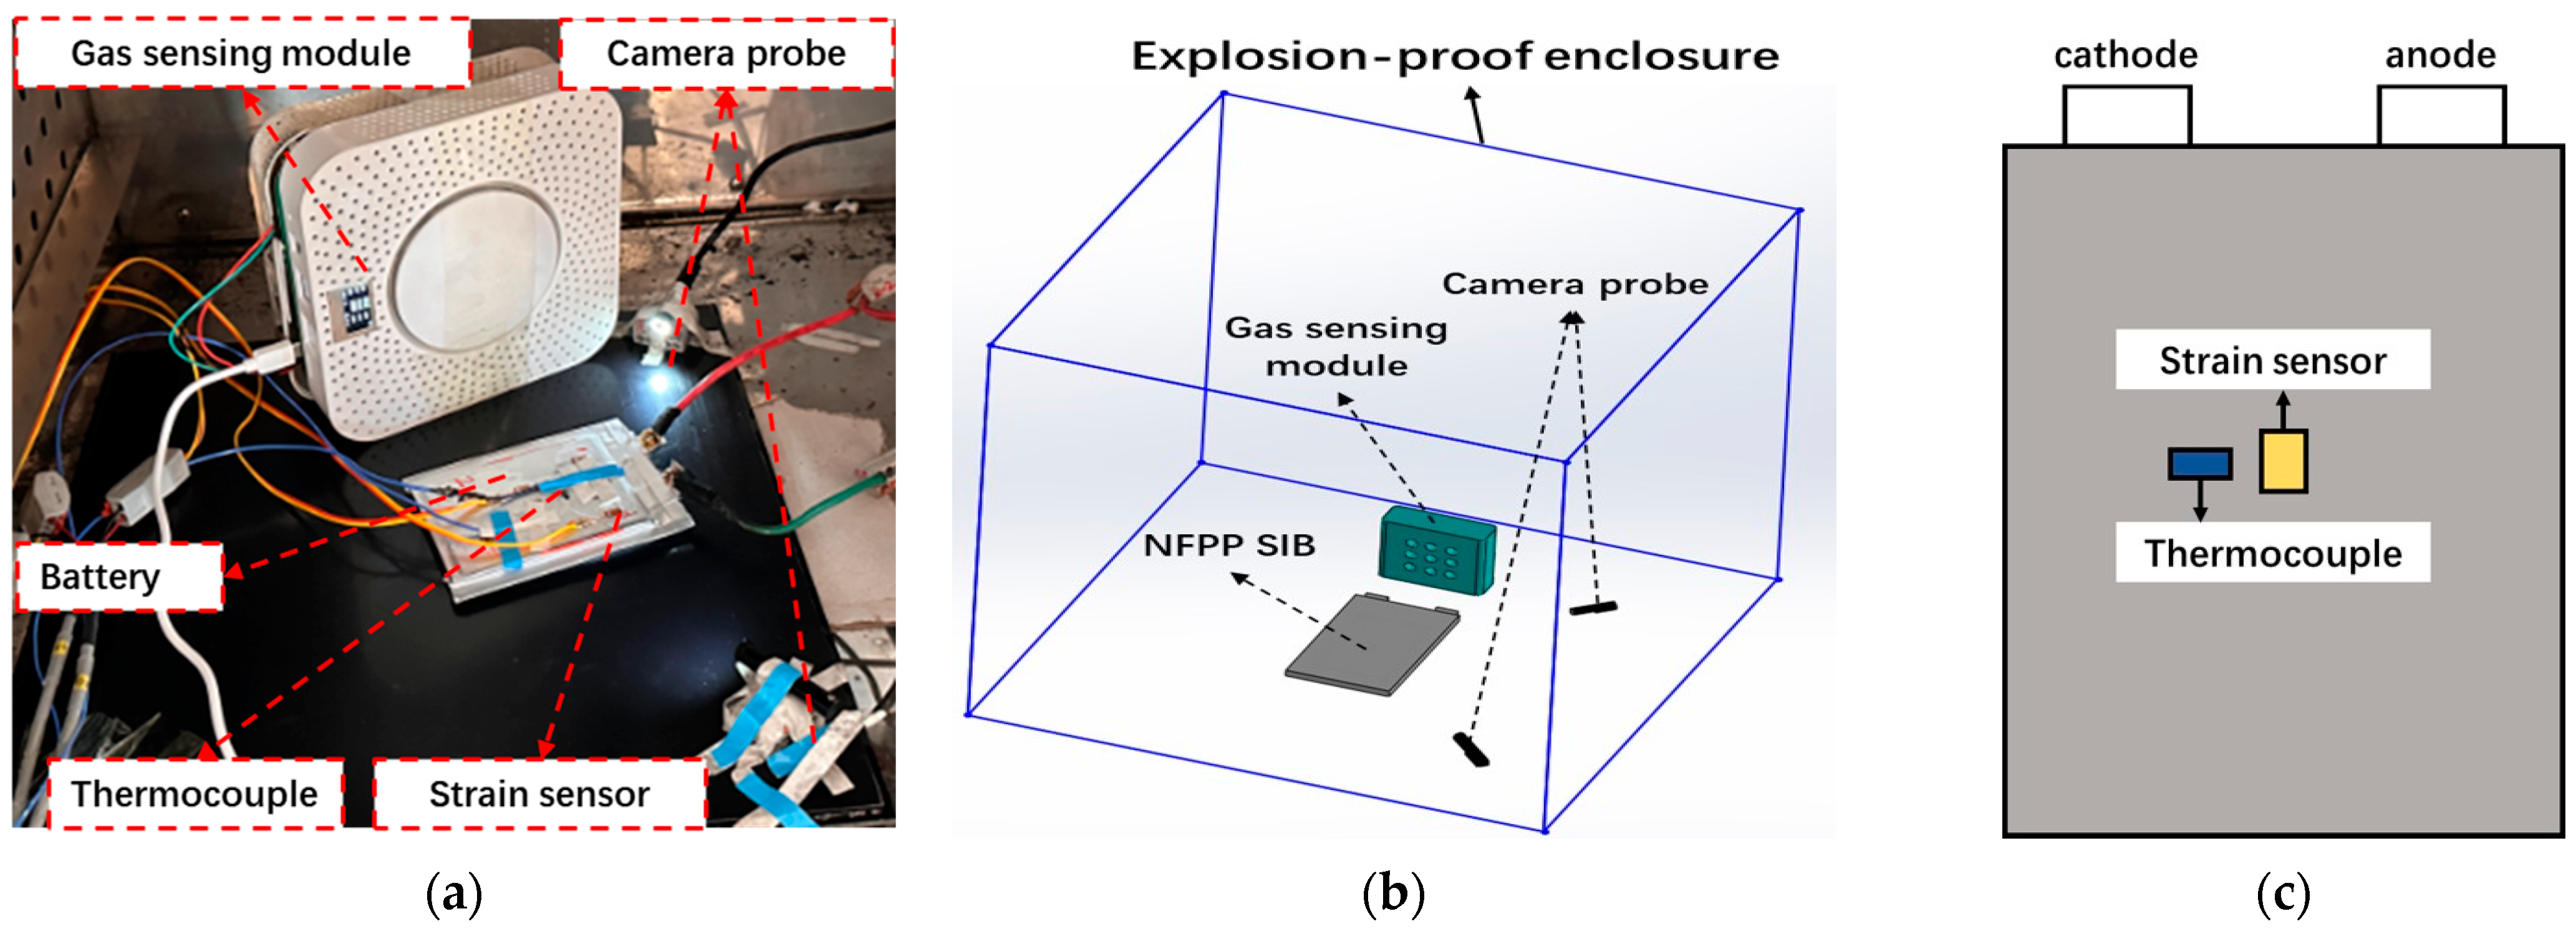
3.1. Experimental Settings
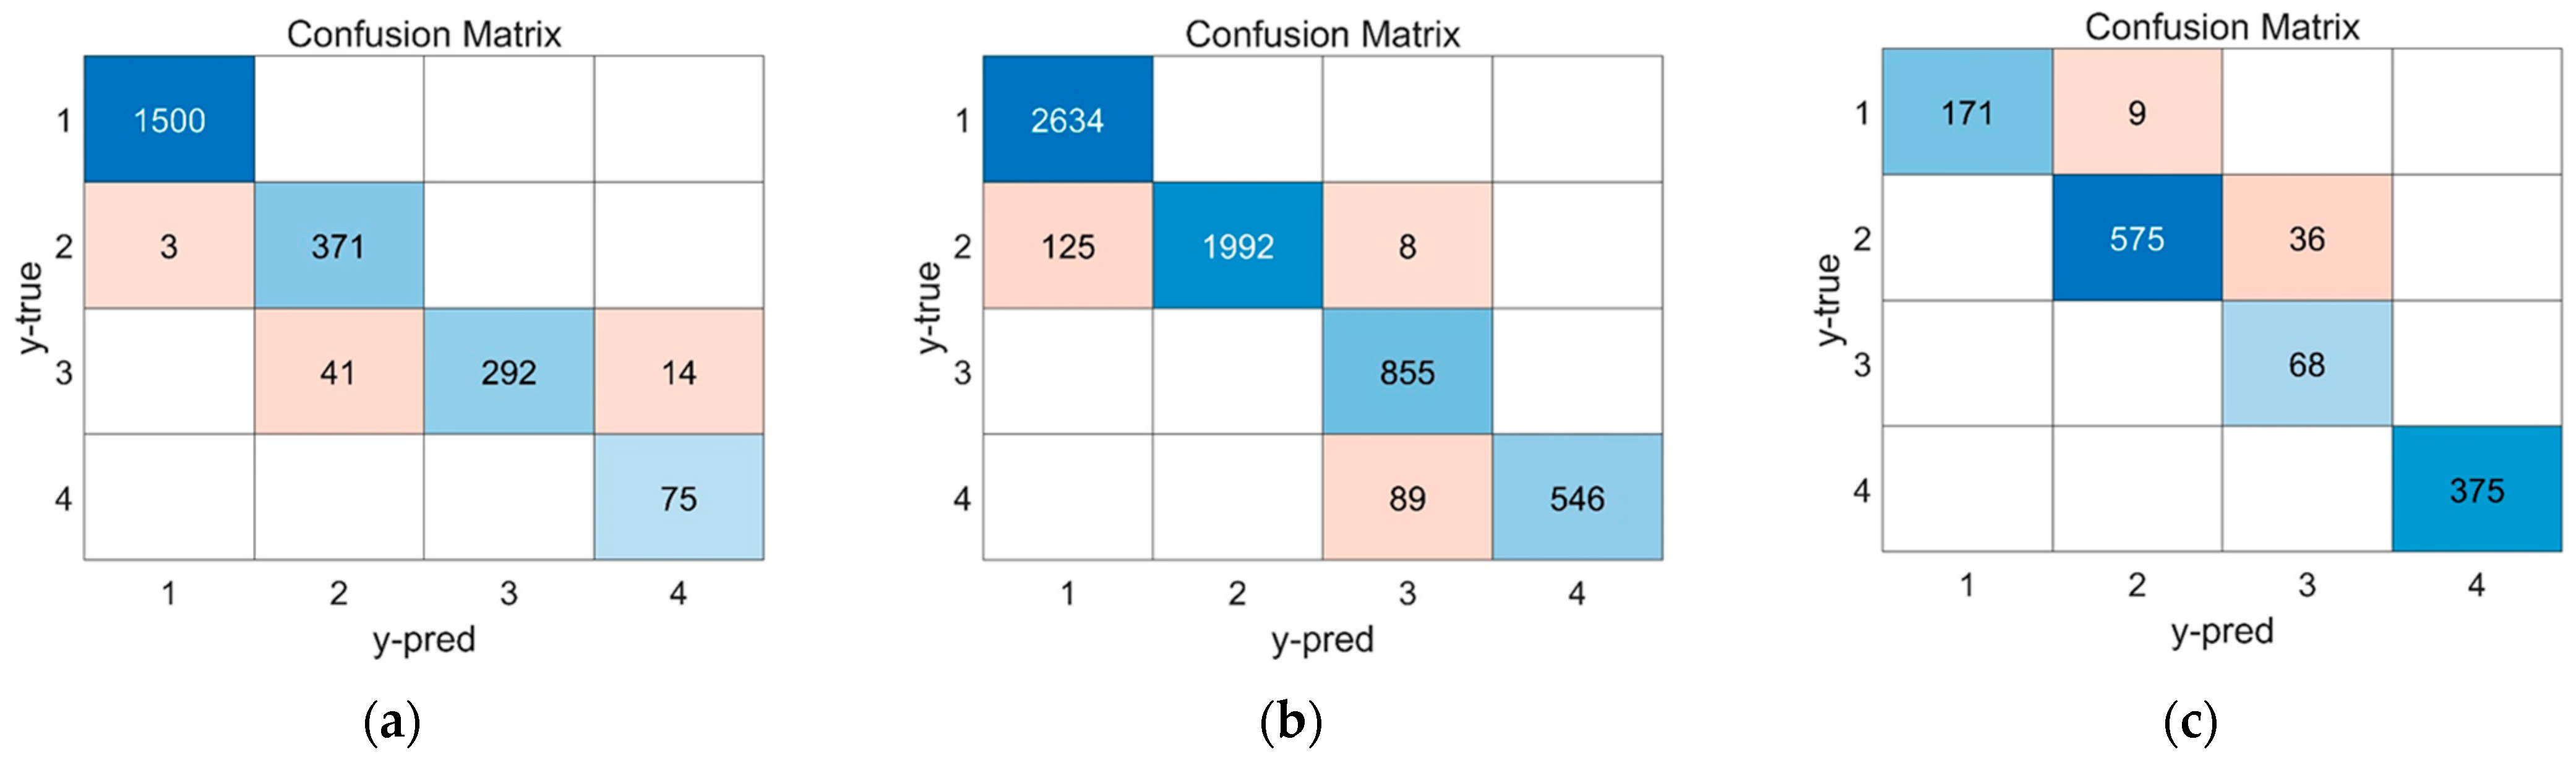
In this study, an experiment is devised to investigate TR resulting from the overcharging of SIBs. Data related to changes in voltage, temperature, strain, and gas venting during the overcharging process were systematically collected. Subsequently, a detailed analysis was conducted to compare the effectiveness of various parameters in providing early warnings for TR. This comprehensive examination aimed to discern and evaluate the predictive capabilities of each parameter in identifying the onset of TR in sodium batteries subjected to overcharging conditions.
In this experiment, SIB anode materials, specifically Natrium Ferrous Pyrophosphate (NFPP), are selected for testing, and the basic parameters of the battery are listed in Table 1.
Initially, the battery undergoes four charge and discharge cycles within the State of Charge (SOC) range of 0–100%, employing a constant current of 3.29 A (1C rate). Subsequently, the battery is fully discharged and left idle for the period of 1 day, which is undertaken to ensure that the battery reaches a stable state, allowing for consistency and reliability in subsequent testing.
Prior to the overcharge experiment, the soft-pack battery undergoes a preparation phase. The battery is carefully placed within an explosion-proof chamber, and charging is conducted using a dedicated charging cabinet. Strain and temperature sensors are affixed to the midpoint of the battery surface, while gas sensors are strategically positioned around the battery; moreover, real-time status of the battery is vigilantly monitored through the camera system.
The physical layout of the experimental platform is shown in Figure 4, and the specific model and parameters of instruments employed are detailed in Table 2.
Subsequently, the battery undergoes a charging process at the rate of 1C until its SOC reaches 100%, and is further overcharged at 1C until TR occurrence. Furthermore, to assess the warning capabilities of these parameters under different charging rates, identical SIBs undergo intentional overcharging, inducing TR experiments at 0.5C and 2C rates, respectively.

3.2. Error Analysis

Table 2 provides an overview of the equipment used in the overcharging tests. The instruments employed for capturing multidimensional signals, including temperature sensors, strain sensors, and gas concentration sensors, carry inherent uncertainties. Moreover, the experiment operates with a data acquisition rate of 1.0 Hz, which could lead to measurement inaccuracies, particularly for capturing rapid events like venting forces and peak temperature spikes. In addition, the manually assembled battery testing setup introduces variability, making it difficult to maintain consistent conditions across different trials under varying ambient environments. These factors contribute to the overall measurement uncertainty and underscore the challenges in ensuring reproducible experimental conditions.

3.3. Repeatability Analysis

In the thermal runaway experiments of sodium-ion batteries under a 1C charging rate, three independent tests were conducted to validate the repeatability of the experiment. As shown in Figure 5, the recorded temperature and voltage data exhibit a highly consistent trend across all trials. In the initial stage, the temperature increases gradually. At approximately 2000 to 2500 s, the voltage surges to 20 V, reaching the saturation limit of the measurement system. Upon the onset of thermal runaway, a severe internal short circuit occurs, leading to a rapid voltage drop, while the temperature sharply rises to its peak, ranging from approximately 220 °C to 240 °C. The initiation time of thermal runaway, peak temperature, and voltage variation patterns remain consistent across the tests, with minimal standard deviations at critical points. These results confirm the high repeatability of the experimental findings.

4. Thermal Runaway Multi-Parameter Hierarchical Warning

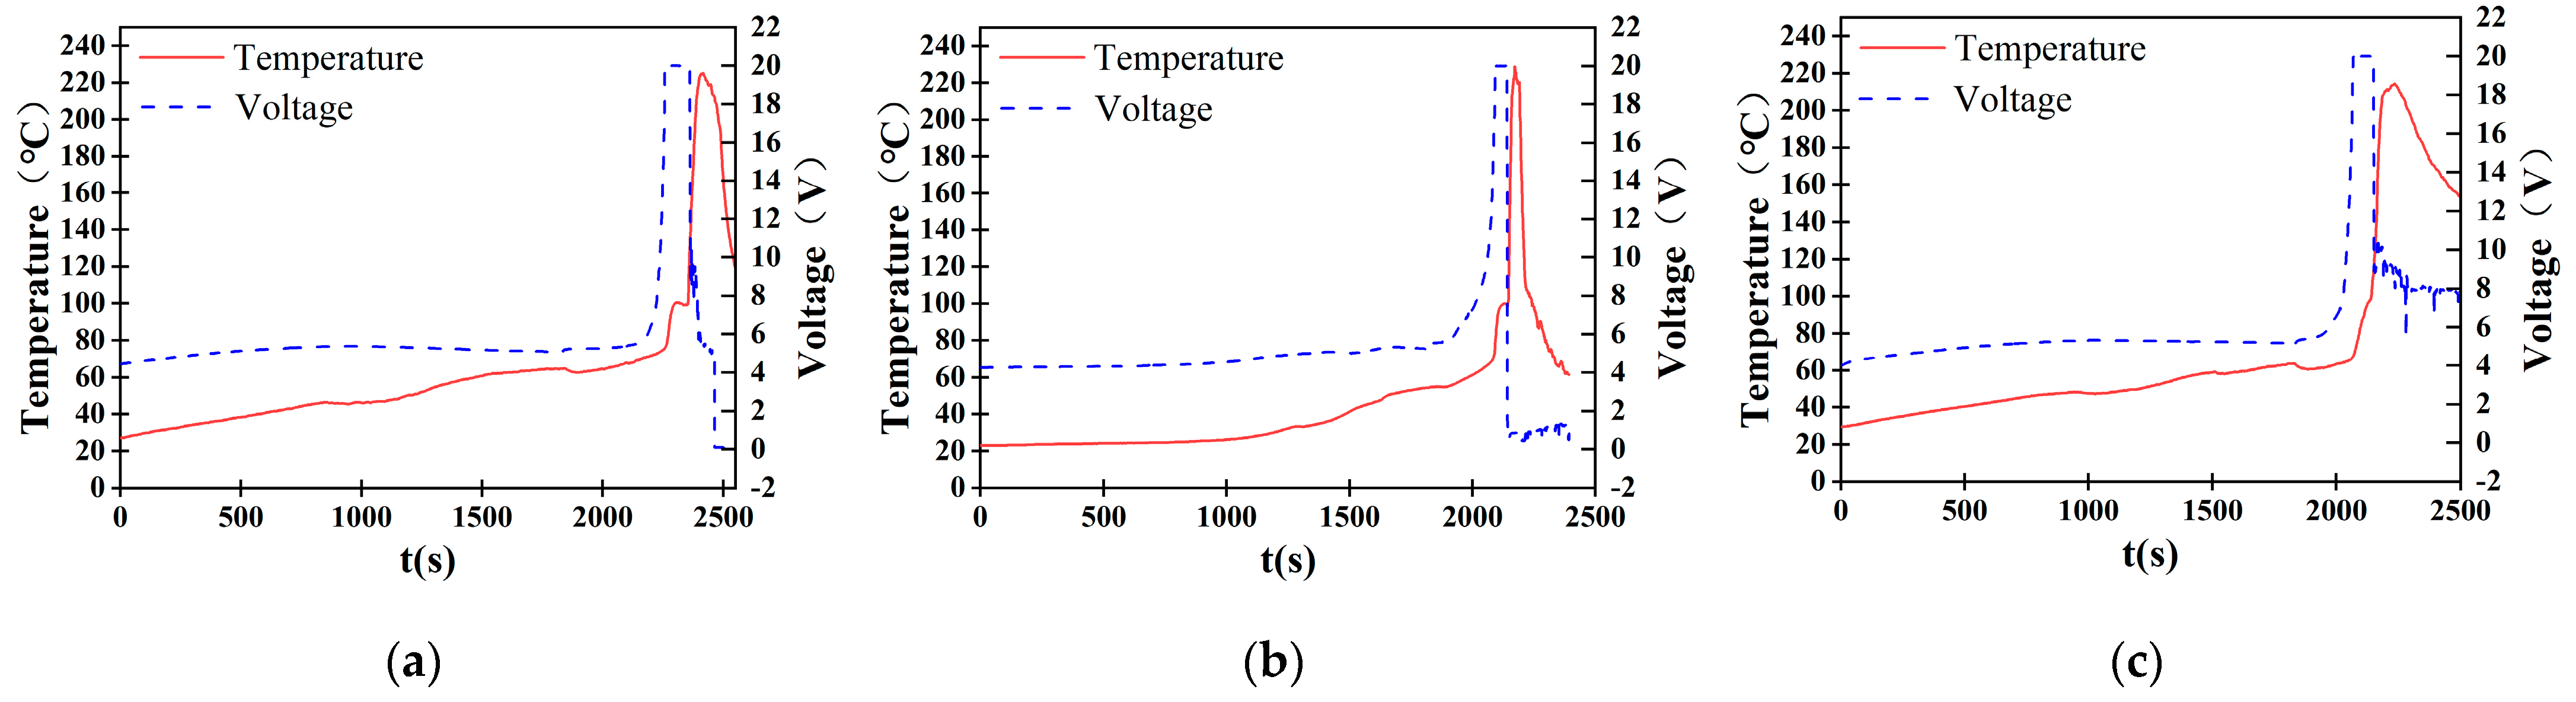
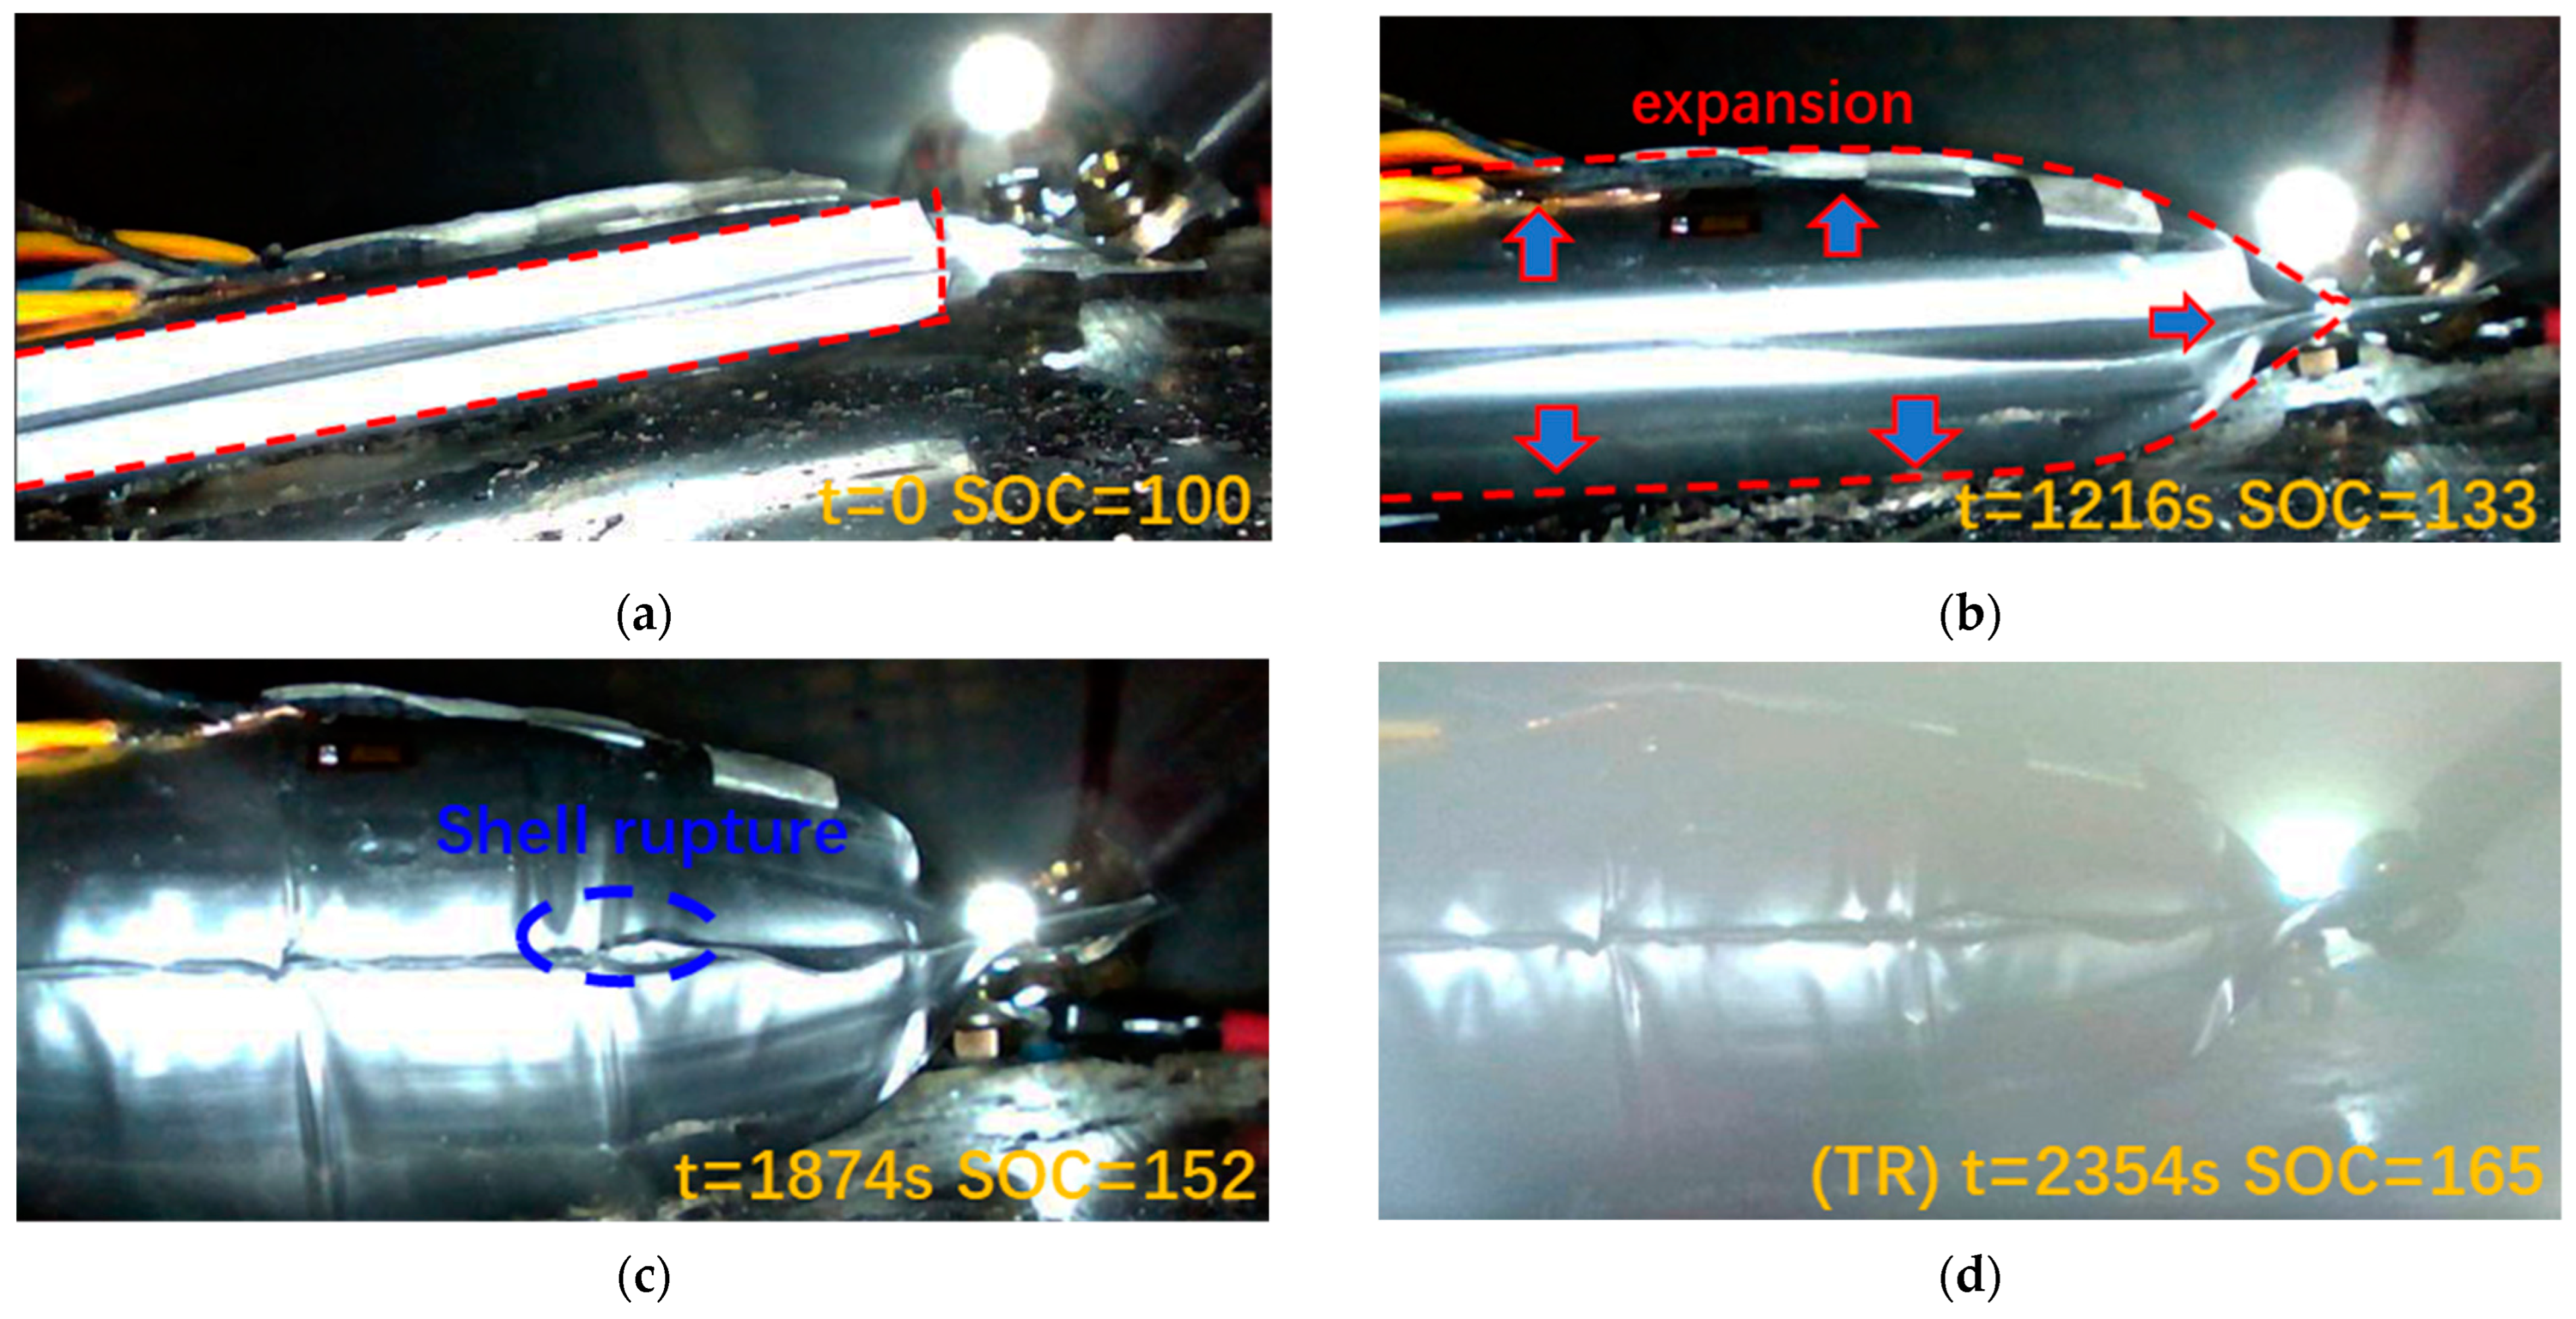
4.1. Division of Thermal Runaway Stages

The data for each parameter during the overcharging process are shown in Figure 6. It can be seen that the process can be divided into four stages. Real-time images of batteries at different stages are shown in Figure 7.
In stage I, as shown in Figure 7a, the sodium-ion battery remains stable, with all parameters exhibiting minimal fluctuations. This indicates that no significant internal reactions occur during this initial phase.
In stage II, gas is gradually generated inside the battery as evidenced by the rising CO2 and CO concentrations in Figure 6. The accumulation of gas leads to expansion of the battery shell, which corresponds to a sharp increase in the strain signal during this stage.
Stage III is characterized by the rupture of the battery shell due to reaching the strain limit as shown in Figure 7c. Accordingly, the strain curve reaches a peak and then drops suddenly. Simultaneously, the gas concentration (CO2 and CO) shows a significant rise in the figure, corresponding to gas venting during this phase. This release relieves the internal mechanical stress, causing a contraction of the shell, as reflected by a drop in strain.
In stage IV, the internal short circuit triggers an intense exothermic REDOX reaction between the electrolyte and oxygen as evidenced by rapid and simultaneous spikes in both temperature and gas concentrations. The sharp rise in CO2 and CO concentrations, along with the steep temperature increase, indicate the onset of thermal runaway.

4.2. Parameter Contribution Degree Analysis

By applying the PCA method as aforementioned, voltage, temperature, strain, carbon dioxide concentration, and carbon monoxide concentration are analyzed through weighted dimensionality reduction, which determines the contribution degree of each parameter in various stages.
Table 3 presents the contribution degree of parameters in each stage, where the contribution of different parameters at various stages can be quantitatively analyzed. The contribution degree in the reaction parameters presented in the table effectively highlights the dominant influencing factors at each stage. Temperature is crucial for anomaly detection in the initial stage, while voltage plays a major role during the gas venting stage (stage III) and thermal runaway stage (stage IV). Strain dominates in the development stage (stage II), whereas carbon dioxide becomes increasingly important in the later stages (stage III and stage IV), serving as a key indicator. In contrast, carbon monoxide shows the smallest overall contribution.
The correlation analysis results shown in Table 4 and Figure 8 reveal that voltage and strain exhibit relatively low correlations with other parameters, indicating their independence. Voltage, with its weak correlations to temperature and CO2, primarily reflects the electrochemical state without directly aligning with thermal or gas-generation processes. Similarly, strain shows minimal correlations with CO2 and CO, suggesting its mechanical behavior is not strongly tied to thermal or chemical dynamics.
On the other hand, parameters like temperature, CO2, and CO display high redundancy due to their strong interrelationships. Temperature correlates strongly with CO2 and CO, highlighting their joint involvement in thermal runaway progression. Furthermore, the high correlation between CO2 and CO suggests their concurrent release during critical electrochemical reactions. These highly redundant parameters collectively emphasize the interconnected nature of heat generation and gas evolution during thermal runaway.
Based on the correlation analysis, CO exhibits strong correlations with temperature and CO2, indicating significant redundancy among parameters. Additionally, the contribution analysis revealed that CO provides limited unique information for characterizing thermal runaway processes. Therefore, CO is excluded to streamline the parameter set without compromising the accuracy of the analysis.

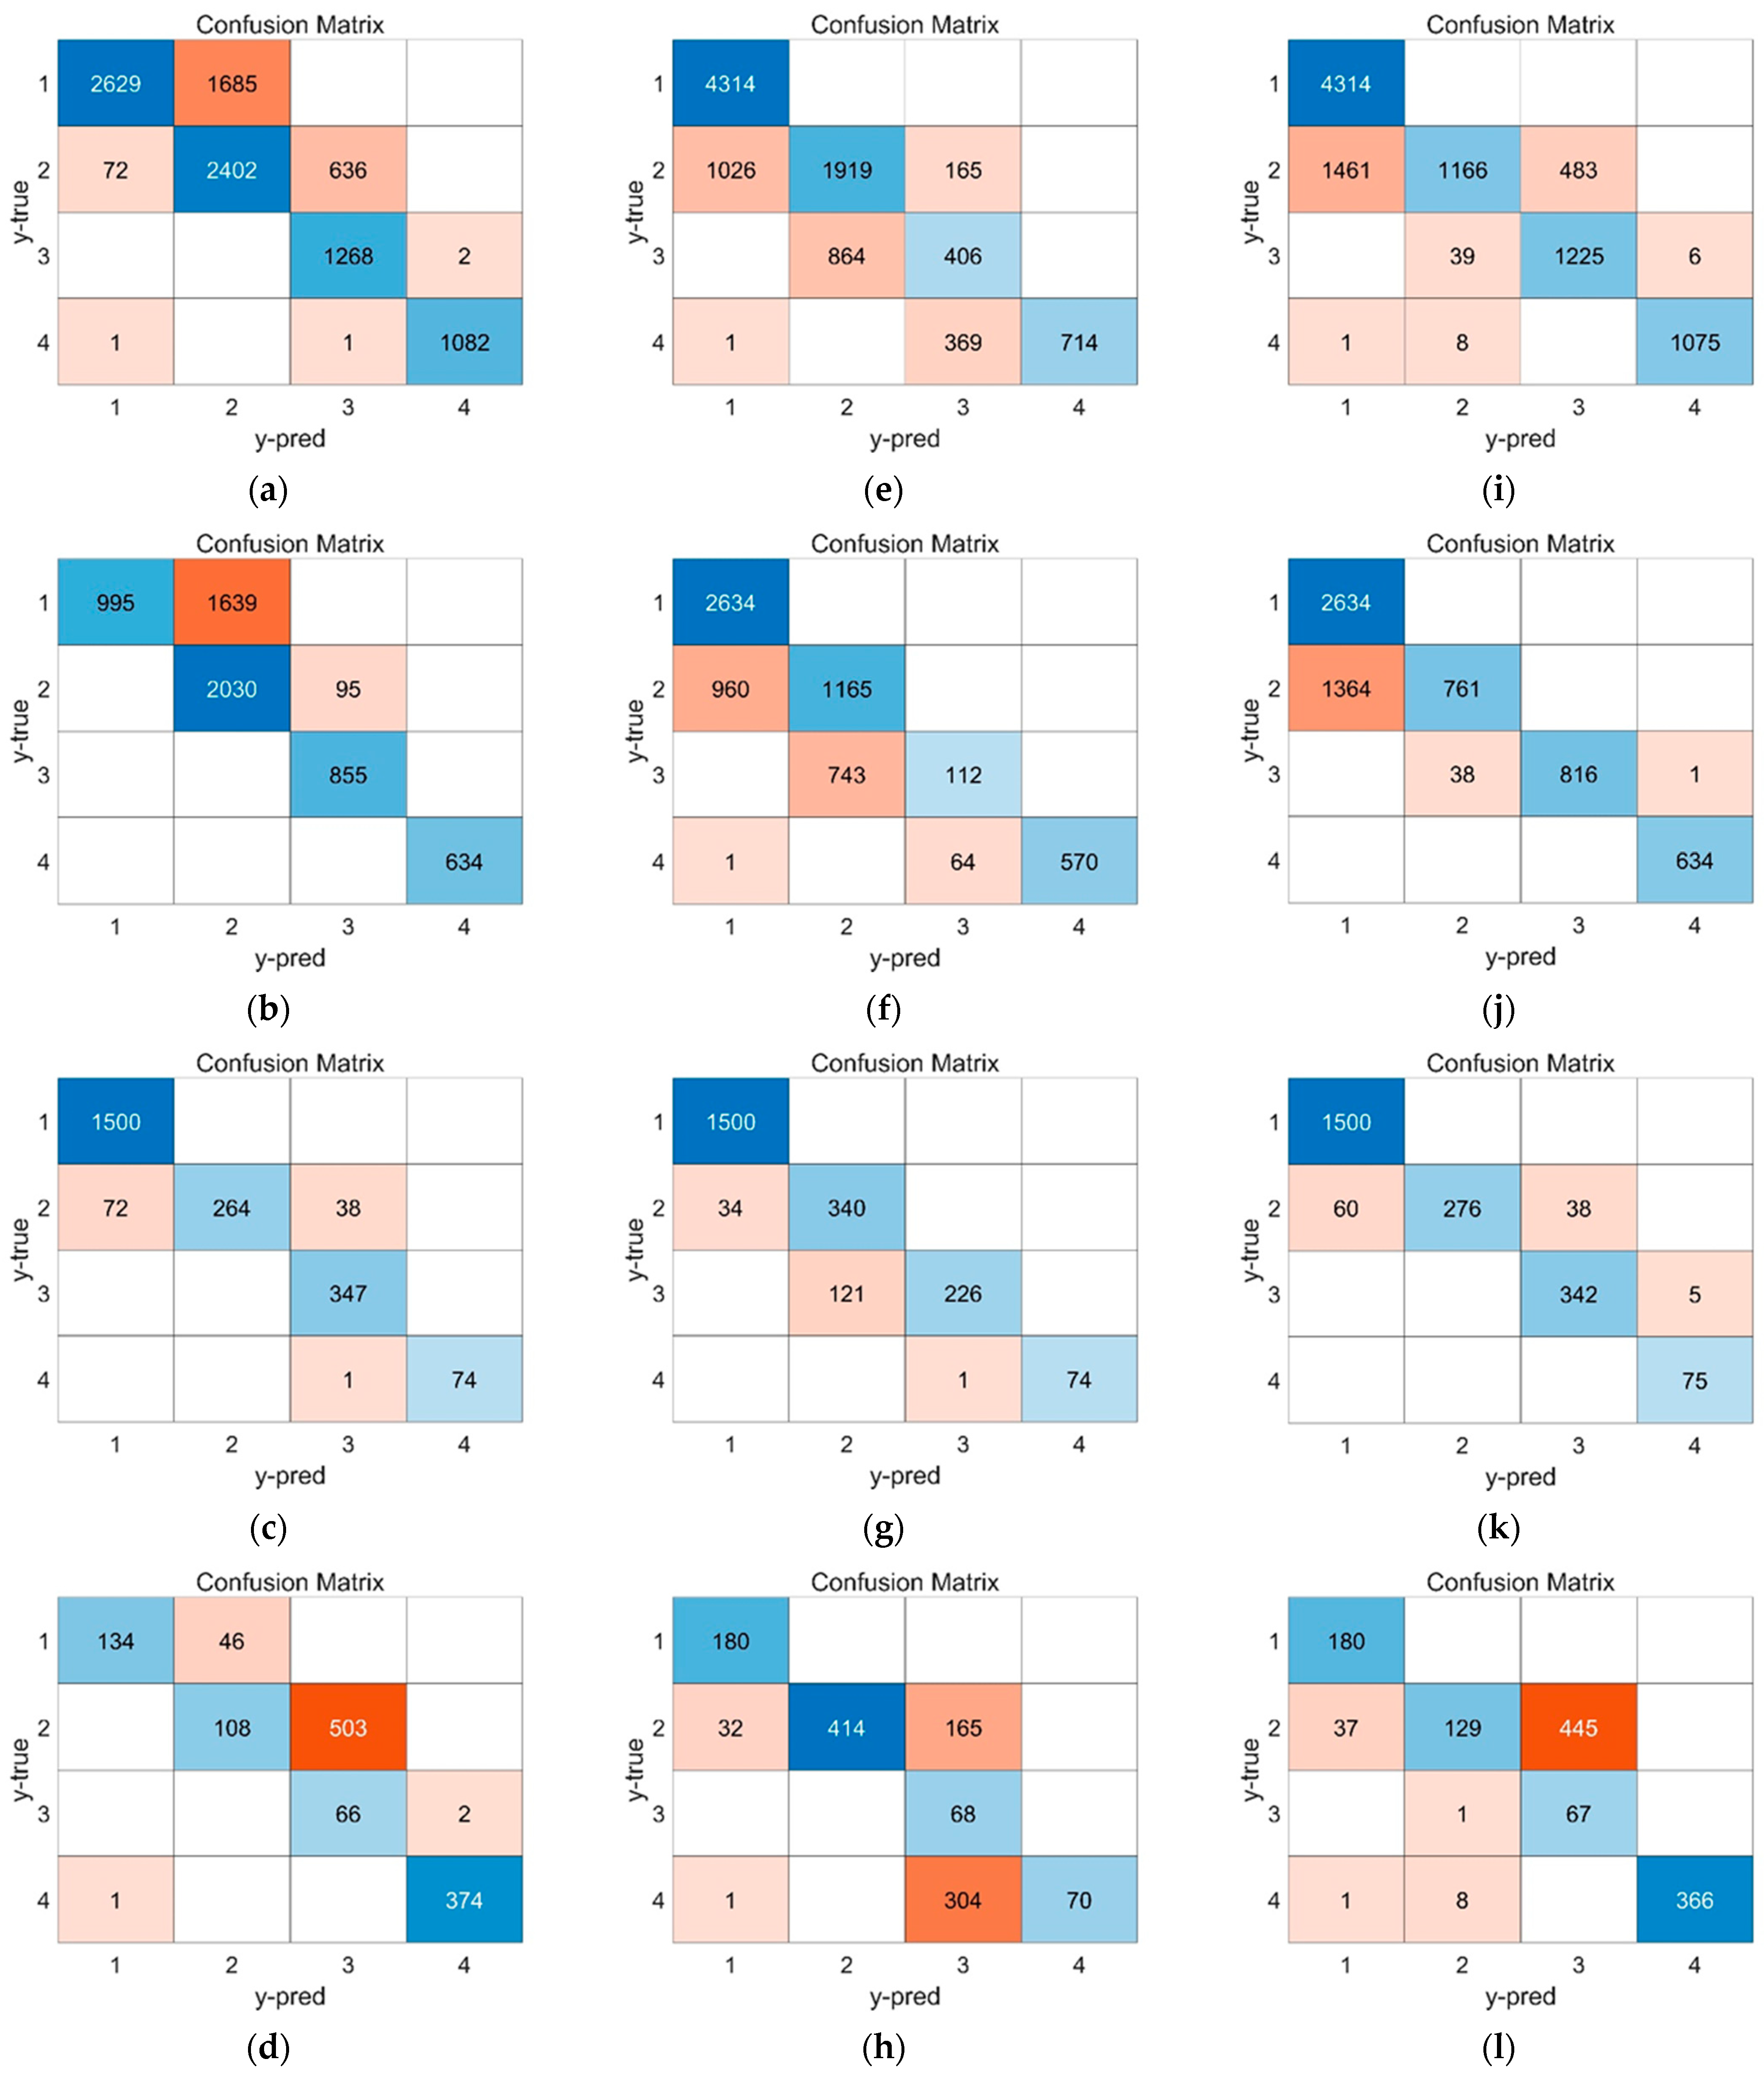
4.3. Predictive Performance of the LSTM Model

Based on comprehensive contribution scores, key parameters with higher importance, such as voltage, temperature, strain, and carbon dioxide concentration, are selected as input variables for the LSTM model, while corresponding stage numbers in the time series are designated as output labels.
In this study, ten thermal runaway experiments are conducted at charging rates of 0.5C, 1C, and 2C. Two groups are selected from the 1C experiments, one group from the 0.5C experiment, and one group from the 2C experiment to form the dataset. The composition of the dataset is shown in Table 5.
In the dataset, the sampling frequency is set to 1 Hz. The test set includes a complete thermal runaway dataset for sodium-ion batteries at a 1C charging rate, comprising approximately 20% of the total dataset. Additionally, thermal runaway data from 1C, 0.5C, and 2C charging rates are selected, collectively accounting for about 80% of the dataset. This division aims to evaluate the versatility of the model across different charging rates.
As shown in Figure 9, the LSTM model’s prediction results are presented in the form of a confusion matrix. Evaluation metrics derived from the confusion matrix are summarized in Table 6. The results show that under different charging rates, the accuracy of the model can reach above 0.95, and the precision and recall of each stage can mostly remain above 0.9, indicating that the classification model based on LSTM not only has high prediction accuracy but also has high versatility under different charging rates. Considering the model’s high prediction accuracy under the 2C high charging rate, it is expected that the model would still exhibit good generalization performance when the charging rate increases to 3C or 4C.
To compare the early warning capabilities of multidimensional signals with those of traditional single-type signals, this study separately analyzes the early warning performance of voltage and temperature. Specifically, the voltage, temperature, and combined voltage-temperature signals are used as input parameters to train the LSTM model, and the prediction accuracy differences between models based on traditional single signals and multidimensional signals are compared.
The prediction result of traditional signals is shown in Figure 10, and the prediction accuracy of different training datasets is shown in Table 7. In Figure 10, it is challenging to effectively predict the thermal runaway of sodium-ion batteries using only voltage and temperature signals, leading to a high rate of misjudgment, particularly in stage Ⅱ and stage Ⅲ. During these stages, strain and gas venting signals play a dominant role, while voltage and temperature signals are less sensitive to the evolution of the internal reactions within the battery. As a result, they fail to provide an effective response.
In Table 7, compared to prediction methods using multiple parameters, the accuracy of traditional signal prediction decreases obviously, especially under different charging rates, where the versatility of single-signal prediction is notably low. Based on the advantages of multi-parameter LSTM models, further optimization of sample distribution, network architecture, and feature selection could significantly enhance the model’s performance. Such improvements would provide more robust and reliable support for the precise identification and monitoring of multistage thermal runaway processes, contributing to enhanced safety and operational reliability in sodium-ion battery systems.

5. Conclusions

This study proposes an innovative method for the early detection of thermal runaway in sodium-ion batteries, integrating PCA–based contribution evaluation with LSTM neural network modeling. The method effectively captures the multidimensional nature of battery signals, such as voltage, temperature, strain, and gas concentrations, enabling accurate identification and classification of thermal runaway stages. By leveraging PCA to reduce data redundancy while retaining critical features, the LSTM model achieves high predictive accuracy. Experimental results validate the effectiveness of this approach, demonstrating its ability to improve early warning performance and provide stage-specific classifications for thermal runaway dynamics. Unlike conventional single-parameter monitoring methods, this multidimensional framework offers a comprehensive and reliable solution for enhancing the safety and operational reliability of sodium-ion batteries in various applications. Future work will focus on further optimizing the model through improved sample distribution, enhanced feature selection techniques, and adaptations for broader application across different battery chemistries. Additionally, real-time integration into battery management systems will be explored to support practical deployment in operational environments.

Author Contributions

Conceptualization, L.M. and X.W.; methodology, Y.X.; software, J.Z.; validation, B.X., J.L. and X.W.; formal analysis, J.L.; investigation, J.L.; resources, B.X.; data curation, Y.X.; writing—original draft preparation, J.L.; writing—review and editing, Y.X.; visualization, J.L.; supervision, Y.X.; project administration, L.M.; funding acquisition, L.M. All authors have read and agreed to the published version of the manuscript.

Funding

This work is supported by the State Grid Corporation of China Science and Technology Project (Grant No. SGAHDK00DJJS2310248).

Data Availability Statement

The data presented in this study are available on request from the corresponding author due to the confidentiality of experimental data.

Conflicts of Interest

The authors declare no conflicts of interest.

References

  1. Kim, S.H.; Lee, H.M.; Shin, Y.-J. Aging Monitoring Method for Lithium-Ion Batteries Using Harmonic Analysis. IEEE Trans. Instrum. Meas. 2021, 70, 3506811. [Google Scholar] [CrossRef]
  2. Gallien, T.; Krenn, H.; Fischer, R.; Lauterbach, S.; Schweighofer, B.; Wegleiter, H. Magnetism Versus LiFePO4 Battery’s State of Charge: A Feasibility Study for Magnetic-Based Charge Monitoring. IEEE Trans. Instrum. Meas. 2015, 64, 2959–2964. [Google Scholar] [CrossRef]
  3. Wang, D.; Yang, F.; Tsui, K.-L.; Zhou, Q.; Bae, S.J. Remaining Useful Life Prediction of Lithium-Ion Batteries Based on Spherical Cubature Particle Filter. IEEE Trans. Instrum. Meas. 2016, 65, 1282–1291. [Google Scholar] [CrossRef]
  4. Yu, J. Health Degradation Detection and Monitoring of Lithium-Ion Battery Based on Adaptive Learning Method. IEEE Trans. Instrum. Meas. 2014, 63, 1709–1721. [Google Scholar] [CrossRef]
  5. Kong, X.; Lu, L.; Yuan, Y.; Sun, Y.; Feng, X.; Yang, H.; Zhang, F.; Zhang, J.; Liu, X.; Han, X.; et al. Foreign matter defect battery and sudden spontaneous combustion. eTransportation 2022, 12, 100170. [Google Scholar] [CrossRef]
  6. Sun, Y.; Yuan, Y.; Lu, L.; Han, X.; Kong, X.; Wang, H.; Ouyang, M.; Gao, P.; Zheng, H.; Wang, K. A comprehensive research on internal short circuits caused by copper particle contaminants on cathode in lithium-ion batteries. eTransportation 2022, 13, 100183. [Google Scholar] [CrossRef]
  7. Feng, X.; Ren, D.; He, X.; Ouyang, M. Mitigating thermal runaway of lithium-ion batteries. Joule 2020, 4, 743–770. [Google Scholar] [CrossRef]
  8. Jin, C.; Sun, Y.; Yao, J.; Feng, X.; Lai, X.; Shen, K.; Wang, H.; Rui, X.; Xu, C.; Zheng, Y.; et al. No thermal runaway propagation optimization design of battery arrangement for cell-to-chassis technology. eTransportation 2022, 14, 100199. [Google Scholar] [CrossRef]
  9. Bauer, A.; Song, J.; Vail, S.; Pan, W.; Barker, J.; Lu, Y. The scale-up and commercialization of nonaqueous SIB technologies. Adv. Energy Mater. 2018, 817, 1702869. [Google Scholar] [CrossRef]
  10. Zuo, W.; Innocenti, A.; Zarrabeitia, M.; Bresser, D.; Yang, Y.; Passerini, S. Layered oxide cathodes for sodium-ion batteries: Storage mechanism, electrochemistry, and techno-economics. Acc. Chem. Res. 2023, 56, 284–296. [Google Scholar] [CrossRef]
  11. Chang, X.; Yang, Z.; Liu, Y.; Chen, J.; Wu, M.; Li, L.; Chou, S.; Qiao, Y. The guarantee of large-scale energy storage: Non-flammable organic liquid electrolytes for high-safety sodium ion batteries. Energy Storage Mater. 2024, 69, 103407. [Google Scholar] [CrossRef]
  12. Tarascon, J.-M. Na-ion versus Li-ion batteries: Complementarity rather than competitiveness. Joule 2020, 4, 1616–1620. [Google Scholar] [CrossRef]
  13. Yabuuchi, N.; Kubota, K.; Dahbi, M.; Komaba, S. Research development on sodium-ion batteries. Chem. Rev. 2014, 114, 11636–11682. [Google Scholar] [CrossRef] [PubMed]
  14. Zhao, L.; Zhang, T.; Li, W.; Li, T.; Zhang, L.; Zhang, X.; Wang, Z. Engineering of sodium-ion batteries: Opportunities and challenges. Engineering 2023, 24, 172–183. [Google Scholar] [CrossRef]
  15. Gomez, M.R.; Ludwig, S.; Jocher, P.; Frank, A.; Fedoryshyna, Y.; Jossen, A. A Novel Pulse Resistance Based Thermal Runaway Early Detection Approach for Lithium-Ion and Sodium-Ion Batteries. Available online: http://papers.ssrn.com (accessed on 9 August 2024).
  16. Feng, X.; Zheng, S.; Ren, D.; He, X.; Wang, L.; Cui, H.; Liu, X.; Jin, C.; Zhang, F.; Xu, C.; et al. Investigating the thermal runaway mechanisms of lithium-ion batteries based on thermal analysis database. Appl. Energy 2019, 246, 53–64. [Google Scholar] [CrossRef]
  17. Guo, X.; Guo, S.; Wu, C.; Li, J.; Liu, C.; Chen, W. Intelligent monitoring for safety-enhanced lithium-ion/sodium-ion batteries. Adv. Energy Mater. 2023, 13, 2203903. [Google Scholar] [CrossRef]
  18. Bordes, A.; Marlair, G.; Zantman, A.; Chesnaye, A.; Lore PA, L.; Lecocq, A. Safety evaluation of a sodium-ion cell: Assessment of vent gas emissions under thermal runaway. ACS Energy Lett. 2022, 7, 3386–3391. [Google Scholar] [CrossRef]
  19. Robinson, J.B.; Finegan, D.P.; Heenan, T.M.M.; Smith, K.; Kendrick, E.; Brett, D.J.L.; Shearing, P.R. Microstructural Analysis of the Effects of Thermal Runaway on Li-Ion and Na-Ion Battery Electrodes. J. Electrochem. En. Conv. Stor. 2018, 15, 11010. [Google Scholar] [CrossRef]
  20. Wang, X.; Gui, Q.; Liu, Z.; Li, J.; Xie, Y.; Liu, P.; Mao, L. Evaluation of Multiparameter Warning Capability of Sodium-Ion Battery. IEEE Trans. Instrum. Meas. 2024, 73, 3541308. [Google Scholar] [CrossRef]
  21. Gui, Q.; Xu, B.; Yu, K.; Wang, X.; Li, J.; Xie, Y.; Yu, R.; Zhou, X.; Mao, L. Comparison of NaNi1/3Fe1/3Mn1/3O2 and Na4Fe3(PO4)2(P2O7) cathode sodium-ion battery behavior under overcharging induced thermal runaway. Chem. Eng. J. 2024, 497, 154732. [Google Scholar] [CrossRef]
  22. Hammoumi, D.; Al-Aizari, H.S.; Alaraidh, I.A.; Okla, M.K.; Assal, M.E.; Al-Aizari, A.R.; Moshab, M.S.; Chakiri, S.; Bejjaji, Z. Seasonal variations and assessment of surface water quality using water quality index (WQI) and principal component analysis (PCA): A case study. Sustainability 2024, 16, 5644. [Google Scholar] [CrossRef]
  23. Laghmati, S.; Hamida, S.; Hicham, K.; Cherradi, B.; Tmiri, A. An improved breast cancer disease prediction system using ML and PCA. Multimedia Tools Appl. 2024, 83, 33785–33821. [Google Scholar] [CrossRef]
  24. Christensen, O.; Bagger, A.; Rossmeisl, J. The Missing Link for Electrochemical CO2 Reduction: Classification of CO vs HCOOH Selectivity via PCA, Reaction Pathways, and Coverage Analysis. ACS Catal. 2024, 14, 2151–2161. [Google Scholar] [CrossRef]
  25. Zhou, M.; Wang, L.; Hu, F.; Zhu, Z.; Zhang, Q.; Kong, W.; Zhou, G.; Wu, C.; Cui, E. ISSA-LSTM: A new data-driven method of heat load forecasting for building air conditioning. Energy Build. 2024, 321, 114698. [Google Scholar] [CrossRef]
  26. Ullah, K.; Ahsan, M.; Hasanat, S.M.; Haris, M.; Yousaf, H.; Raza, S.F.; Tandon, R.; Abid, S.; Ullah, Z. Short-Term Load Forecasting: A Comprehensive Review and Simulation Study with CNN-LSTM Hybrids Approach. IEEE Access 2024, 12, 111858–111881. [Google Scholar] [CrossRef]
  27. Al-Selwi, S.M.; Hassan, M.F.; Abdulkadir, S.J.; Muneer, A.; Sumiea, E.H.; Alqushaibi, A.; Ragab, M.G. RNN-LSTM: From applications to modeling techniques and beyond—Systematic review. J. King Saud Univ.-Comput. Inf. Sci. 2024, 36, 102068. [Google Scholar] [CrossRef]
  28. Fan, Y.; Liu, J.; Tang, J.; Liu, P.; Lin, Y.; Du, Y. Learning correlation information for multi-label feature selection. Pattern Recognit. 2024, 145, 109899. [Google Scholar] [CrossRef]
  29. Sun, Z.; Wang, G.; Li, P.; Wang, H.; Zhang, M.; Liang, X. An improved random forest based on the classification accuracy and correlation measurement of decision trees. Expert Syst. Appl. 2024, 237, 121549. [Google Scholar] [CrossRef]
  30. Yadav, H.; Thakkar, A. NOA-LSTM: An efficient LSTM cell architecture for time series forecasting. Expert Syst. Appl. 2024, 238, 122333. [Google Scholar] [CrossRef]
Figure 1. Hierarchical warning method for a sodium−ion battery.
Batteries 11 00108 g001
Figure 2. The process of reducing redundancy.
Batteries 11 00108 g002
Figure 3. Loop structure of LSTM.
Batteries 11 00108 g003
Figure 4. The overcharging experimental setup. Gas sensing sensors are placed near the battery to collect the concentration of carbon dioxide and carbon monoxide. (a) Realistic experimental setup, (b) Schematic of experimental devices in explosion-proof enclosure, (c) Position of strain sensor and thermocouple.
Batteries 11 00108 g004
Figure 5. Temperature−voltage curve during thermal runaway at 1C overcharging rate. (a) Sample 1. (b) Sample 2. (c) Sample 3.
Batteries 11 00108 g005
Figure 6. Evolution of SIB behaviors under thermal runaway at 1C charging rate.
Batteries 11 00108 g006
Figure 7. Real-time images from the video of the test before, during, and after thermal runaway. (a) Stage I. (b) Stage II. (c) Stage III. (d) Stage IV.
Batteries 11 00108 g007
Figure 8. Heatmap of correlation analysis.
Batteries 11 00108 g008
Figure 9. The prediction result of the LSTM model: (a) 1C. (b) 0.5C. (c) 2C.
Batteries 11 00108 g009
Figure 10. The prediction results of the LSTM model based on traditional parameters. (ad) Prediction result based on voltage signal. Population, 0.5C, 1C, 2C; (eh) prediction result based on temperature signal. Population, 0.5C, 1C, 2C; (il) prediction result based on voltage-temperature combined signal. Population, 0.5C, 1C, 2C.
Batteries 11 00108 g010
Table 1. Basic information about the tested battery.
ParametersValue
Nominal capacity3.29 Ah
Cathode materialNa4Fe3(PO4)2(P2O7)
Cut-off voltage1.5–3.9 V
Overall dimensions100’75’10 mm
Table 2. Sensor parameters.
Experimental ApparatusInstrument ModelParameterValue
ThermocoupleK-typeMaximum temperature/°C482
Carbon dioxide sensorNDIR 6703Sample frequency/Hz1
Range/ppm5000
Sensitivity ratio±0.5%
Carbon monoxide sensorZE03Sample frequency/Hz1
Range/ppm1000
Sensitivity ratio±0.5%
Strain sensorBSF120-3AA-TSize of base (length’width)/mm6.6’3.2
Size of wire grating (length’width)/mm3.0’2.3
Resistance/Ω120 ± 0.1
Sensitivity ratio2.0 ± 1%
Table 3. The PCA contribution degree of parameters in each stage.
StageIIIIIIIV
Voltage0.50170.02210.62440.6359
Temperature0.84780.13930.09600.2926
Strain0.11410.97580.00940.0202
Carbon dioxide0.00950.01950.15750.3533
Carbon monoxide0.00070.04320.03340.0898
Table 4. Parameter correlation analysis results.
FeatureVoltageTemperatureStrainCO2CO
Voltage1.000000.18274−0.006360.253510.49282
Temperature0.182741.000000.240050.947370.87906
Strain−0.006360.240051.000000.041670.04826
CO20.253510.947370.041671.000000.93118
CO0.492820.879060.048260.931181.00000
Table 5. Dataset of thermal runaway.
Battery
Number
Charging RateTypeDataset
Data PointsStage 1 Data PointsStage 2 Data PointsStage 3 Data PointsStage 4 Data Points
#11CTrain2500827104755175
#2Test2296150037434775
#30.5CTest624826342124855634
#42CTest123418061068375
Table 6. Confusion matrix classification performance index.
Charging Rate1C0.5C2C
Accuracy0.9750.9640.963
Precision (Stage Ⅰ)0.9980.9551
Precision (Stage Ⅱ)0.90010.985
Precision (Stage Ⅲ)10.8980.653
Precision (Stage Ⅳ)0.84311
Recall (Stage Ⅰ)110.950
Recall (Stage Ⅱ)0.9920.9370.941
Recall (Stage Ⅲ)0.84111
Recall (Stage Ⅳ)10.8601
F1-Score (Stage Ⅰ)0.999 0.977 0.974
F1-Score (Stage Ⅱ)0.944 0.967 0.962
F1-Score (Stage Ⅲ)0.914 0.946 0.790
F1-Score (Stage Ⅳ)0.915 0.925 1
Table 7. Prediction accuracy between different training datasets.
Charging RateTraining Dataset
VoltageTemperatureVoltage-TemperatureMultidimensional Parameter
0.5C0.7220.7170.7750.964
1C0.9510.9320.9550.975
2C0.5520.5930.6010.963
Disclaimer/Publisher’s Note: The statements, opinions and data contained in all publications are solely those of the individual author(s) and contributor(s) and not of MDPI and/or the editor(s). MDPI and/or the editor(s) disclaim responsibility for any injury to people or property resulting from any ideas, methods, instructions or products referred to in the content.

