Article

Experimental Analysis of Battery Cell Heating Through Electromagnetic Induction-Based Liquid System Considering Induction Power and Flow Rate Effects in Extreme-Cold Conditions

1
Department of Electrical–Electronic Engineering, Faculty of Engineering and Natural Sciences, Samsun University, Samsun 55139, Türkiye
2
Department of Mechanical Engineering, Faculty of Engineering and Natural Sciences, Samsun University, Samsun 55139, Türkiye
*
Author to whom correspondence should be addressed.
Batteries 2025, 11(3), 105; https://doi.org/10.3390/batteries11030105
Submission received: 4 February 2025 / Revised: 7 March 2025 / Accepted: 10 March 2025 / Published: 12 March 2025

Abstract

:
The performance of lithium-ion batteries deteriorates significantly under extreme-cold conditions due to increased internal resistance and decreased electrochemical activity. This study presents an experimental analysis of a battery thermal management system (BTMS) incorporating electromagnetic induction heating and a fluid-based heat transfer mechanism to alleviate these problems. The experimental setup utilizes a closed-loop circulation system where ethylene glycol-based fluid flows through induction-heated copper tubes, ensuring efficient heat transfer to an 18650-cell battery. This study evaluates heating performance under varying ambient temperatures (−15 °C and −5 °C), fluid flow rates (0.22, 0.3, and 0.5 L/min), and induction power levels (150 W, 225 W, 275 W, and 400 W). The results indicate that lower flow rates (e.g., 0.22 L/min) provide faster heating due to longer thermal interaction time with the battery; however, localized boiling points were observed at these low flow rates, potentially leading to efficiency losses and thermal instability. At −15 °C and 400 W, the battery temperature reached 25 °C in 383 s at 0.22 L/min, while at 0.5 L/min, the same temperature was achieved in 463 s. Higher flow rates improved temperature uniformity but slightly reduced heating efficiency due to increased heat dissipation. Internal resistance measurements revealed a substantial decrease as battery temperature increased, further validating the effectiveness of the system. These findings present a viable alternative for heating electric vehicle batteries in sub-zero environments, thereby optimizing battery performance and extending operational lifespan.

1. Introduction

1.1. Background

Interest in electric vehicles (EVs) has surged in recent years, driven by technological advances, environmental concerns, and supportive policies. In 2022, global electric car sales exceeded 10 million units, accounting for 14% of total car sales, up from just 9% in 2021 and less than 5% in 2020. This trend continued in 2023, with global EV sales reaching approximately 14 million, a 35% year-on-year increase, making up 18% of total car sales [1]. China remains the dominant player in the EV market, with over 60% of global sales. Europe is the second-largest market, with electric vehicles comprising 25% of all car sales in 2023, while in the United States, EV sales accounted for 10% of the market [1].
Lithium-ion batteries operate best between 20 and 40 °C [2] or 15 and 35 °C [3]. Cold weather significantly impacts EV performance, especially in extreme conditions, reducing battery efficiency. In sub-zero temperatures, the chemical reactions within lithium-ion batteries slow down, leading to a reduced driving range and increased energy consumption as the vehicle needs to heat both the cabin and the battery. In such conditions, batteries charge more slowly and suffer from capacity degradation, resulting in up to a 40% reduction in EV range [4]. In Norway, during a cold snap in January 2024, Oslo’s electric bus fleet faced operational issues, with hundreds of cancellations due to the batteries discharging faster than expected in the extreme cold [5]. Similarly, in the U.S., some Tesla owners in Chicago reported being stranded when their vehicles could not charge properly in freezing conditions [6]. Friesen et al. [7] examined the effects of low-temperature cycling on 18650 lithium-ion batteries, highlighting lithium plating on the graphite anode as a major factor accelerating aging and posing safety risks. Lin et al. [8] identified anode polarization as the key limitation in low-temperature performance, with Mesocarbon microbead (MCMB)-based cells showing irreversible capacity loss below −20 °C due to lithium deposition. Nagasubramanian [9] compared the low-temperature performance of A&T, Moli, and Panasonic 18650 cells, revealing a drastic power decline from 800 W/L at 25 °C to less than 10 W/L at −40 °C, mainly due to high interfacial impedance at the cathode. Ouyang et al. [10] investigated the impact of low-temperature charging on LiFePO4 batteries, finding that charging below −10 °C accelerates aging, especially when the current exceeds 0.25C or the cut-off voltage surpasses 3.55 V, emphasizing the need for optimized charging strategies in cold conditions.

1.2. Problems and Literature Review

In cold climates, batteries suffer significant performance degradation. Low temperatures increase internal resistance and reduce efficiency, as mentioned earlier. Different heating systems help maintain battery performance in cold conditions. These include induction heating, thermoelectric systems, resistance heating, phase change materials (PCMs), and hybrid systems that combine multiple methods, such as forced air or liquid cooling. Each system has unique advantages depending on its application. Induction heating and liquid-based systems are among the most efficient.
Thermoelectric heating systems utilize the Peltier effect, enabling both heating and cooling by reversing current flow through thermoelectric modules (TEMs). This dual functionality makes them effective for battery temperature regulation. Zhang et al. [11] demonstrated a hybrid thermoelectric system that improved temperature control and energy efficiency in EVs, while Lyu et al. [12] focused on cooling, thermoelectric (TE) systems can also provide heating by reversing current flow. Despite their precision, TE systems suffer from high power consumption, inefficiency, and limited scalability for large-scale applications.
Resistance heating is widely used in BTMSs due to its simplicity and low cost. It works by passing current through a resistive element, which generates heat. This method warms batteries in cold climates and complements other thermal management techniques.
Induction heating has been widely utilized across diverse fields due to its efficiency, precision, and ability to target specific areas [13], making it ideal for battery thermal management applications. Induction heating is an emerging technology in the field of battery thermal management as said before. Both resistive heating and electromagnetic induction ultimately transfer heat to the working fluid, but the fundamental difference lies in how heat is generated. In resistive heating, electrical energy is converted into heat through a resistive element, which must first warm up before transferring heat to the fluid. This introduces thermal inertia due to the additional conduction step. In contrast, electromagnetic induction directly generates heat within a tube placed inside the induction coil via eddy currents, allowing for immediate heating of the tube itself. The heated tube then transfers energy to the circulating fluid, which subsequently flows through the system and enters the copper tubes wrapped around the battery, effectively heating the battery cell. While both the induction-heated tube and the copper tubes around the battery exhibit some thermal inertia, the direct heating mechanism of induction heating ensures a much faster response time compared to conventional resistive heaters. This method is particularly useful in cold environments where traditional heating methods may be slow or inefficient and offer several advantages, particularly in cold climates, where rapid temperature increases are needed to restore battery efficiency.
Hybrid systems that combine various heating and cooling methods are becoming increasingly popular in battery thermal management. By integrating thermoelectric, resistance, and induction heating technologies, these systems can provide more comprehensive and efficient solutions to maintain battery temperatures in a wide range of operating conditions.
Table 1 presents a summary of various battery thermal management methods, highlighting their key findings from different studies.

1.3. Research Objectives

In the current literature, there are limited studies focusing specifically on the use of induction heating for battery thermal management, particularly in extremely cold conditions. While induction heating has been successfully applied in various fields such as metalworking, medical treatments, and household appliances, its potential for battery heating has not been thoroughly explored. Previous studies, such as those by Wang and Yan [20] and Raza et al. [19], have primarily focused on the general advantages of induction heating systems in rapid and localized heating applications, but without detailed investigation into how critical parameters such as power consumption and fluid flow rates can be optimized for efficient heating in sub-zero environments.
This study provides a novel contribution by investigating the heating performance across varying ambient temperatures (−15 °C and −5 °C), fluid flow rates (0.22, 0.3, and 0.5 L/min), and induction power levels (150 W, 225 W, 275 W, and 400 W) for battery thermal management under extreme-cold conditions. The primary objective is to achieve rapid temperature regulation while minimizing energy consumption, a crucial factor for electric vehicle batteries in sub-zero environments. Unlike previous studies, this research integrates these parameters into a unified framework, offering a comprehensive analysis of induction heating for battery applications. To the best of our knowledge, no prior research has approached the problem with this level of detail, particularly focusing on how these systems can be adapted for applications in electric vehicle batteries. Thus, this work not only fills a gap in the literature but also sets the stage for future advancements in the thermal management of batteries using induction heating.

2. Materials and Methods

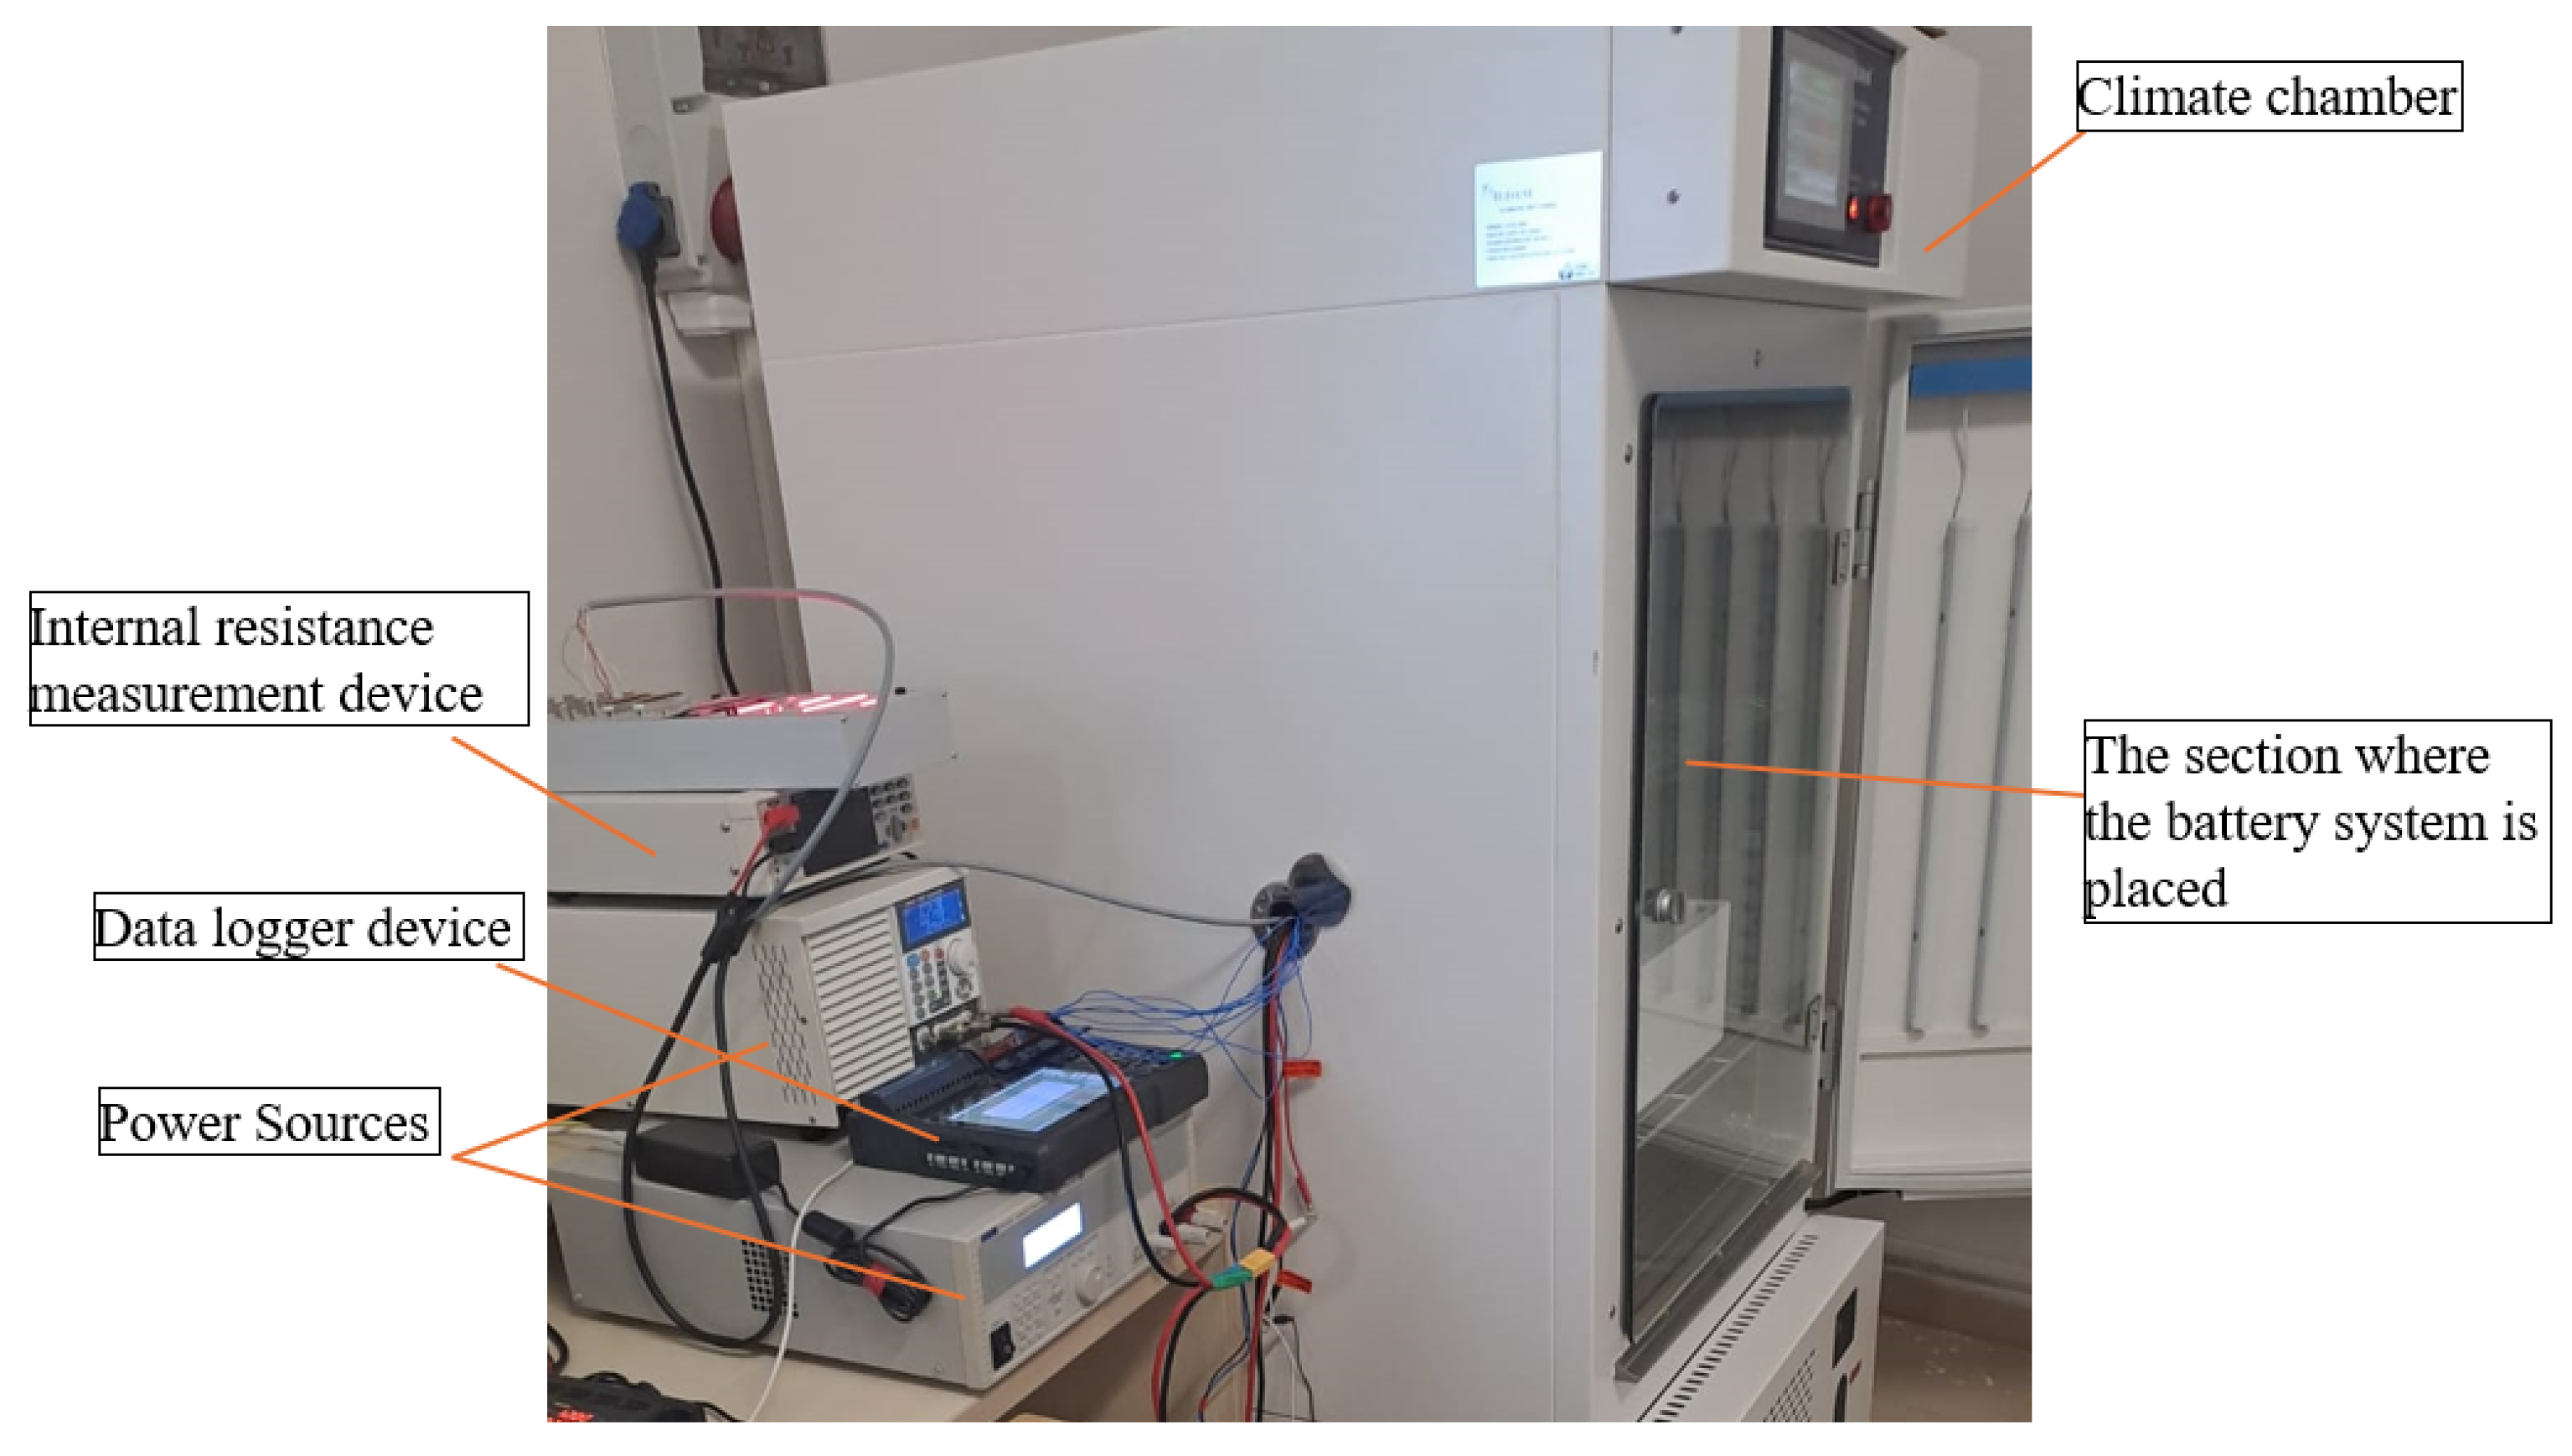
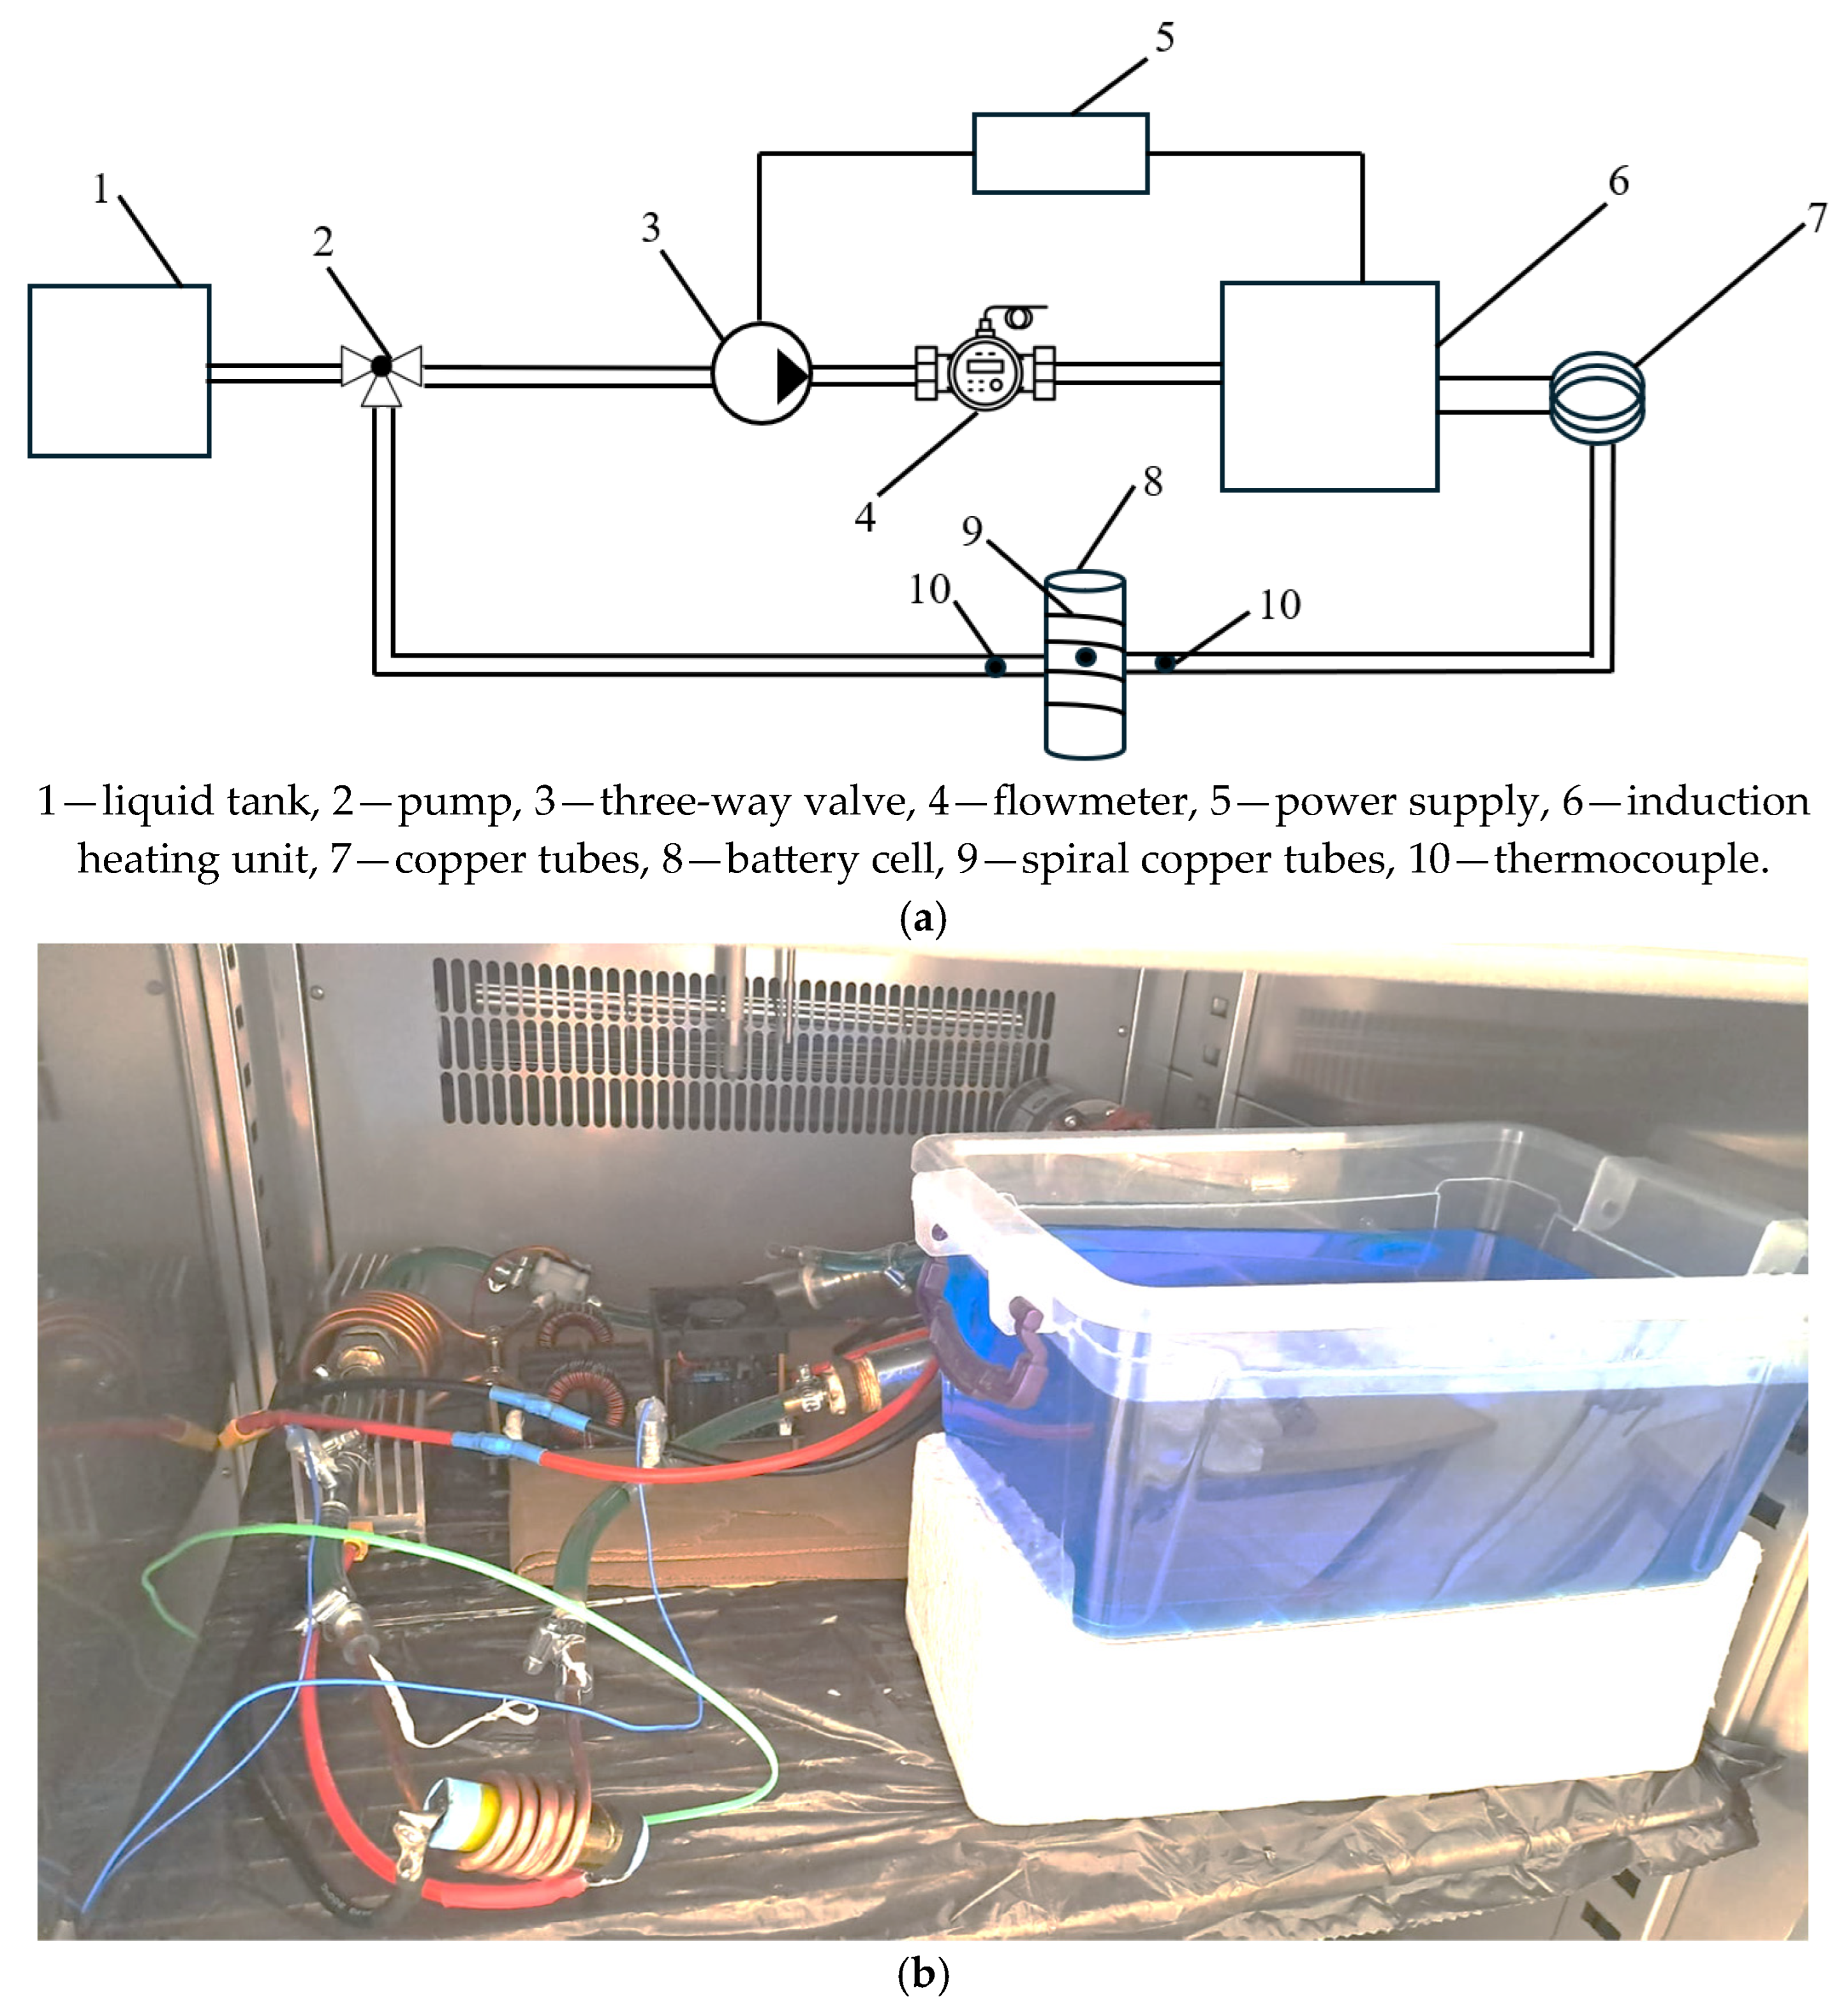
2.1. Experimental Setup

The selected battery cell in this research is a cylindrical 18650 lithium-ion battery cell (Aspilsan INR18650A28 model (Aspilsan Energy, Kayseri, Türkiye)), incorporating a nickel manganese cobalt oxide (NMC) cathode and a graphite anode. This battery has a diameter of 18.30 mm (+0.1/−0.2), a height of 65 ± 0.2 mm, and a weight of 44.5 ± 0.7 g. Its discharge capacity ranges from 2850 mAh (minimum) to 2950 mAh (maximum), with a typical capacity of 2900 mAh. It operates at a nominal voltage of 3.68 V and has an energy density of 244 Wh/kg. The standard charge current is 1450 mA, with a maximum continuous charge current of 4000 mA (within 10–50 °C). The charge cut-off current is 140 mA, and the charge end voltage is 4.25 V. For discharge, it has a standard discharge current of 580 mA, a maximum continuous discharge current of 25,000 mA, and a discharge end voltage of 2.5 V.
To maintain the consistency of experimental data and to provide several different temperatures, all tests were carried out within a climate chamber, depicted in Figure 1. This experimental setup consists of multiple devices integrated to evaluate battery performance under controlled environmental conditions. A climate chamber is a controlled environment chamber where temperature and humidity can be regulated. It houses the battery system and allows for precise testing under varied climate conditions. The section where the battery system is placed, inside the climate chamber, is designated for the battery system, enabling controlled exposure to environmental variables during testing. The Internal Resistance Measurement Device (Hioki BT3562A Battery HiTester, Hioki E.E. Corporation, Ueda, Japan) measures the internal resistance of the battery, providing essential data on battery performance and health. The Data Logger Device (Hioki LR8450, Hioki E.E. Corporation, Ueda, Japan) collects and records data from the battery cell and other devices in real time, essential for monitoring parameters over the test duration.
The schematic and real view of the experimental setup of induction-liquid based battery heating system is presented in Figure 2. Throughout the experiments, the battery remained in a resting condition, meaning no charging or discharging currents were applied. This approach was chosen to evaluate the effect of induction heating independently, without additional heat generation from electrochemical processes. The induction-based liquid battery heating system operates by utilizing a closed-loop liquid circuit, designed to raise the temperature of a battery cell efficiently in extremely cold conditions. The system begins with a liquid tank that stores a thermally conductive liquid, providing a consistent supply for circulation. This liquid is pumped through the system by a pump, ensuring a steady flow that is essential for continuous and stable heat transfer. By adjusting the direction of flow, three-way valves allow specific amounts of fluid to be directed to related parts of the system. As the liquid flows, it passes through a flowmeter, which measures the flow rate in real-time, allowing for precise monitoring. The main heating mechanism is the induction heating unit, which heats the liquid indirectly. The induction unit generates an electromagnetic field around copper tubes, which are chosen for their excellent thermal conductivity, allowing for rapid and efficient heat absorption. These copper tubes serve as a conduit, heating the liquid inside as it flows through the electromagnetic field. The heated liquid then passes through a series of spiral copper tubes wrapped around the battery cell. The spiral configuration of these tubes maximizes the surface area in contact with the battery, allowing for uniform heat distribution and efficient thermal transfer. While the current experimental design uses five copper tube passes around a single 18650 battery cell to maximize the heat transfer surface, we recognize that such a configuration may not be directly applicable in EV battery modules. In practical applications, reducing the number of copper passes or using thinner tubes could provide a more space-efficient design. To measure the liquid temperatures, thermocouples located at both the inlet and outlet of the battery cell enable an accurate assessment of heat transfer by monitoring the temperature changes in the circulating fluid. Also, the surface temperature of the battery cell was measured through the experiments. The liquid used in this study is ethylene glycol, which remains unfrozen down to −37 °C when mixed at a 50% ratio with water, or down to −20 °C at a 33% ratio. The thermophysical properties of the operating fluid are as follows: a specific heat capacity of approximately 3323 J·kg−1·K−1, a density of 1069 kg·m−3, a kinematic viscosity of 2.58 × 10⁻⁶ m2·s−1, and a thermal conductivity of 0.3892 W·m−1·K−1 [19].
The decision to use electromagnetic induction heating instead of resistive heating elements is based on its ability to achieve a faster and more uniform heating performance, particularly under extreme-cold conditions. While some energy losses occur during electromagnetic energy transfer, direct heating enables rapid heat delivery to the battery cell, reducing cold-start times and enhancing overall system performance [19,20].
The temperatures −15 °C and −5 °C were selected to represent a wide range of environmental conditions that lithium-ion batteries commonly experience in cold-climate applications. Each temperature is chosen to simulate different operational scenarios, enabling a comprehensive understanding of how temperature impacts battery internal resistance, temperature increase velocity and efficiency. A total of 24 experiments were conducted under two different ambient temperatures (−15 °C and −5 °C), three different fluid flow rates (0.22 L/min, 0.3 L/min, and 0.5 L/min), and four different induction heating power levels (150 W, 225 W, 275 W, and 400 W). Table 2 represents the experimental matrix conducted under various conditions of ambient temperature, flow rate, and induction heating power. The experiments were designed to assess the effectiveness of induction heating in bringing the battery temperature to 25 °C as rapidly and efficiently as possible. Once this target temperature was reached, the experiments were finalized, and no active thermal management system was implemented to regulate the temperature beyond this point.

2.2. Heat Transfer Analysis and Dimensionless Parameters

In this section, flow and heat transfer analyses are presented, focusing on the Reynolds number, convective heat transfer coefficient, and Nusselt number. The Reynolds number is calculated using Equation (1):
R e = ρ   v   D h μ
where ρ is the fluid density (kg/m3), v is the fluid velocity (m/s), D h is the hydraulic diameter of the tube (m), and μ is the dynamic viscosity of the fluid (Pa·s).
The heat transferred to the liquid (W) was calculated using Equation (2):
Q = m ˙   C p , l T l , o T l , i
where T l , i and T l , o is the liquid inlet and outlet temperatures of the battery cell, m ˙ is the liquid mass flow rate (kg/s), and C p , l is the liquid specific heat capacity (kJ/kgK) [24].
The convective heat transfer coefficient quantifies the heat transfer rate between the fluid and the battery surface, calculated using Equation (3):
h = Q A T l T b
where Q is the heat transfer rate (W), A is the heat transfer surface area (m2), T l is the average temperature of the liquid at the inlet and outlet and T b is the battery surface temperature (°C). The heat transfer coefficient depends on fluid properties, flow conditions, and surface characteristics, with induction heating enhancing heat transfer by generating localized turbulence within the copper tube’s fluid boundary layer.
The dimensionless Nusselt number (Nu) is used to evaluate natural convective heat transfer in a fluid flow. It represents the ratio of convective to conductive heat transfer, providing a detailed understanding of fluid flow dynamics, convective heat transfer, and thermal conduction. A higher Nusselt number indicates more effective convective heat transfer, increased heat exchange capacity, and greater heat transfer efficiency. The Nusselt number is determined using Equation (4):
N u = h   D h k
where h is the convective heat transfer coefficient (W/m2·K), D h the hydraulic diameter of the tube (m), and k is the thermal conductivity of the liquid (W/m·K) [25].
In addition to these parameters, the battery cell’s temperature increase rate (°C/s), heating efficiency (°C/s·W), and internal resistance (mohm) were also analyzed. The battery cell temperature increase rate indicates how quickly the battery reaches the target temperature under varying experimental conditions. Heating efficiency (°C/s·W) is defined as the ratio of the heating rate (°C/s) to the applied induction power, indicating how effectively the input power is converted into useful heat for battery warming. Internal resistance measurements were evaluated to assess the battery’s electrical performance, as variations in internal resistance significantly affect heat generation and battery performance under different operating conditions.

3. Results and Discussion

In this section, the experimental results are analyzed to evaluate the performance of the induction-based liquid battery thermal management system under extreme-cold conditions. The findings are categorized based on two different ambient temperatures: −15 °C and −5 °C. The results are discussed in terms of battery temperature evolution, heating rates, internal resistance variations, and system efficiency under varying induction power levels and fluid flow rates. In Section 3.1, the performance of the system at −15 °C is examined, focusing on how different heating power levels (150 W, 225 W, 275 W, and 400 W) and flow rates (0.22, 0.3, and 0.5 L/min) influence battery heating time and efficiency. The impact of low temperatures on internal resistance and the risk of localized overheating at lower flow rates are also discussed. In Section 3.2, the system’s behavior at −5 °C is evaluated under the same test parameters. Comparisons between −15 °C and −5 °C conditions highlight the role of ambient temperature in heating performance, revealing how warmer conditions affect heating rates, heat transfer efficiency, and energy consumption.
The analysis of the Reynolds numbers for the given flow rates indicates that the flow regime within copper tubes remains laminar, with calculated Reynolds numbers of approximately 302, 411, and 685 for flow rates of 0.22 L/min, 0.30 L/min, and 0.50 L/min, respectively. These values are significantly below the critical threshold of 2300, confirming the laminar nature of the flow under the experimental conditions. However, localized turbulence can still occur due to nucleate boiling, especially at lower flow rates where heat transfer to the fluid is more concentrated. The induction heating process may cause temperature gradients that induce transient turbulent structures in these localized regions, potentially affecting heat transfer performance. These phenomena are crucial for optimizing the heating efficiency and stability of the system under varying operational conditions.

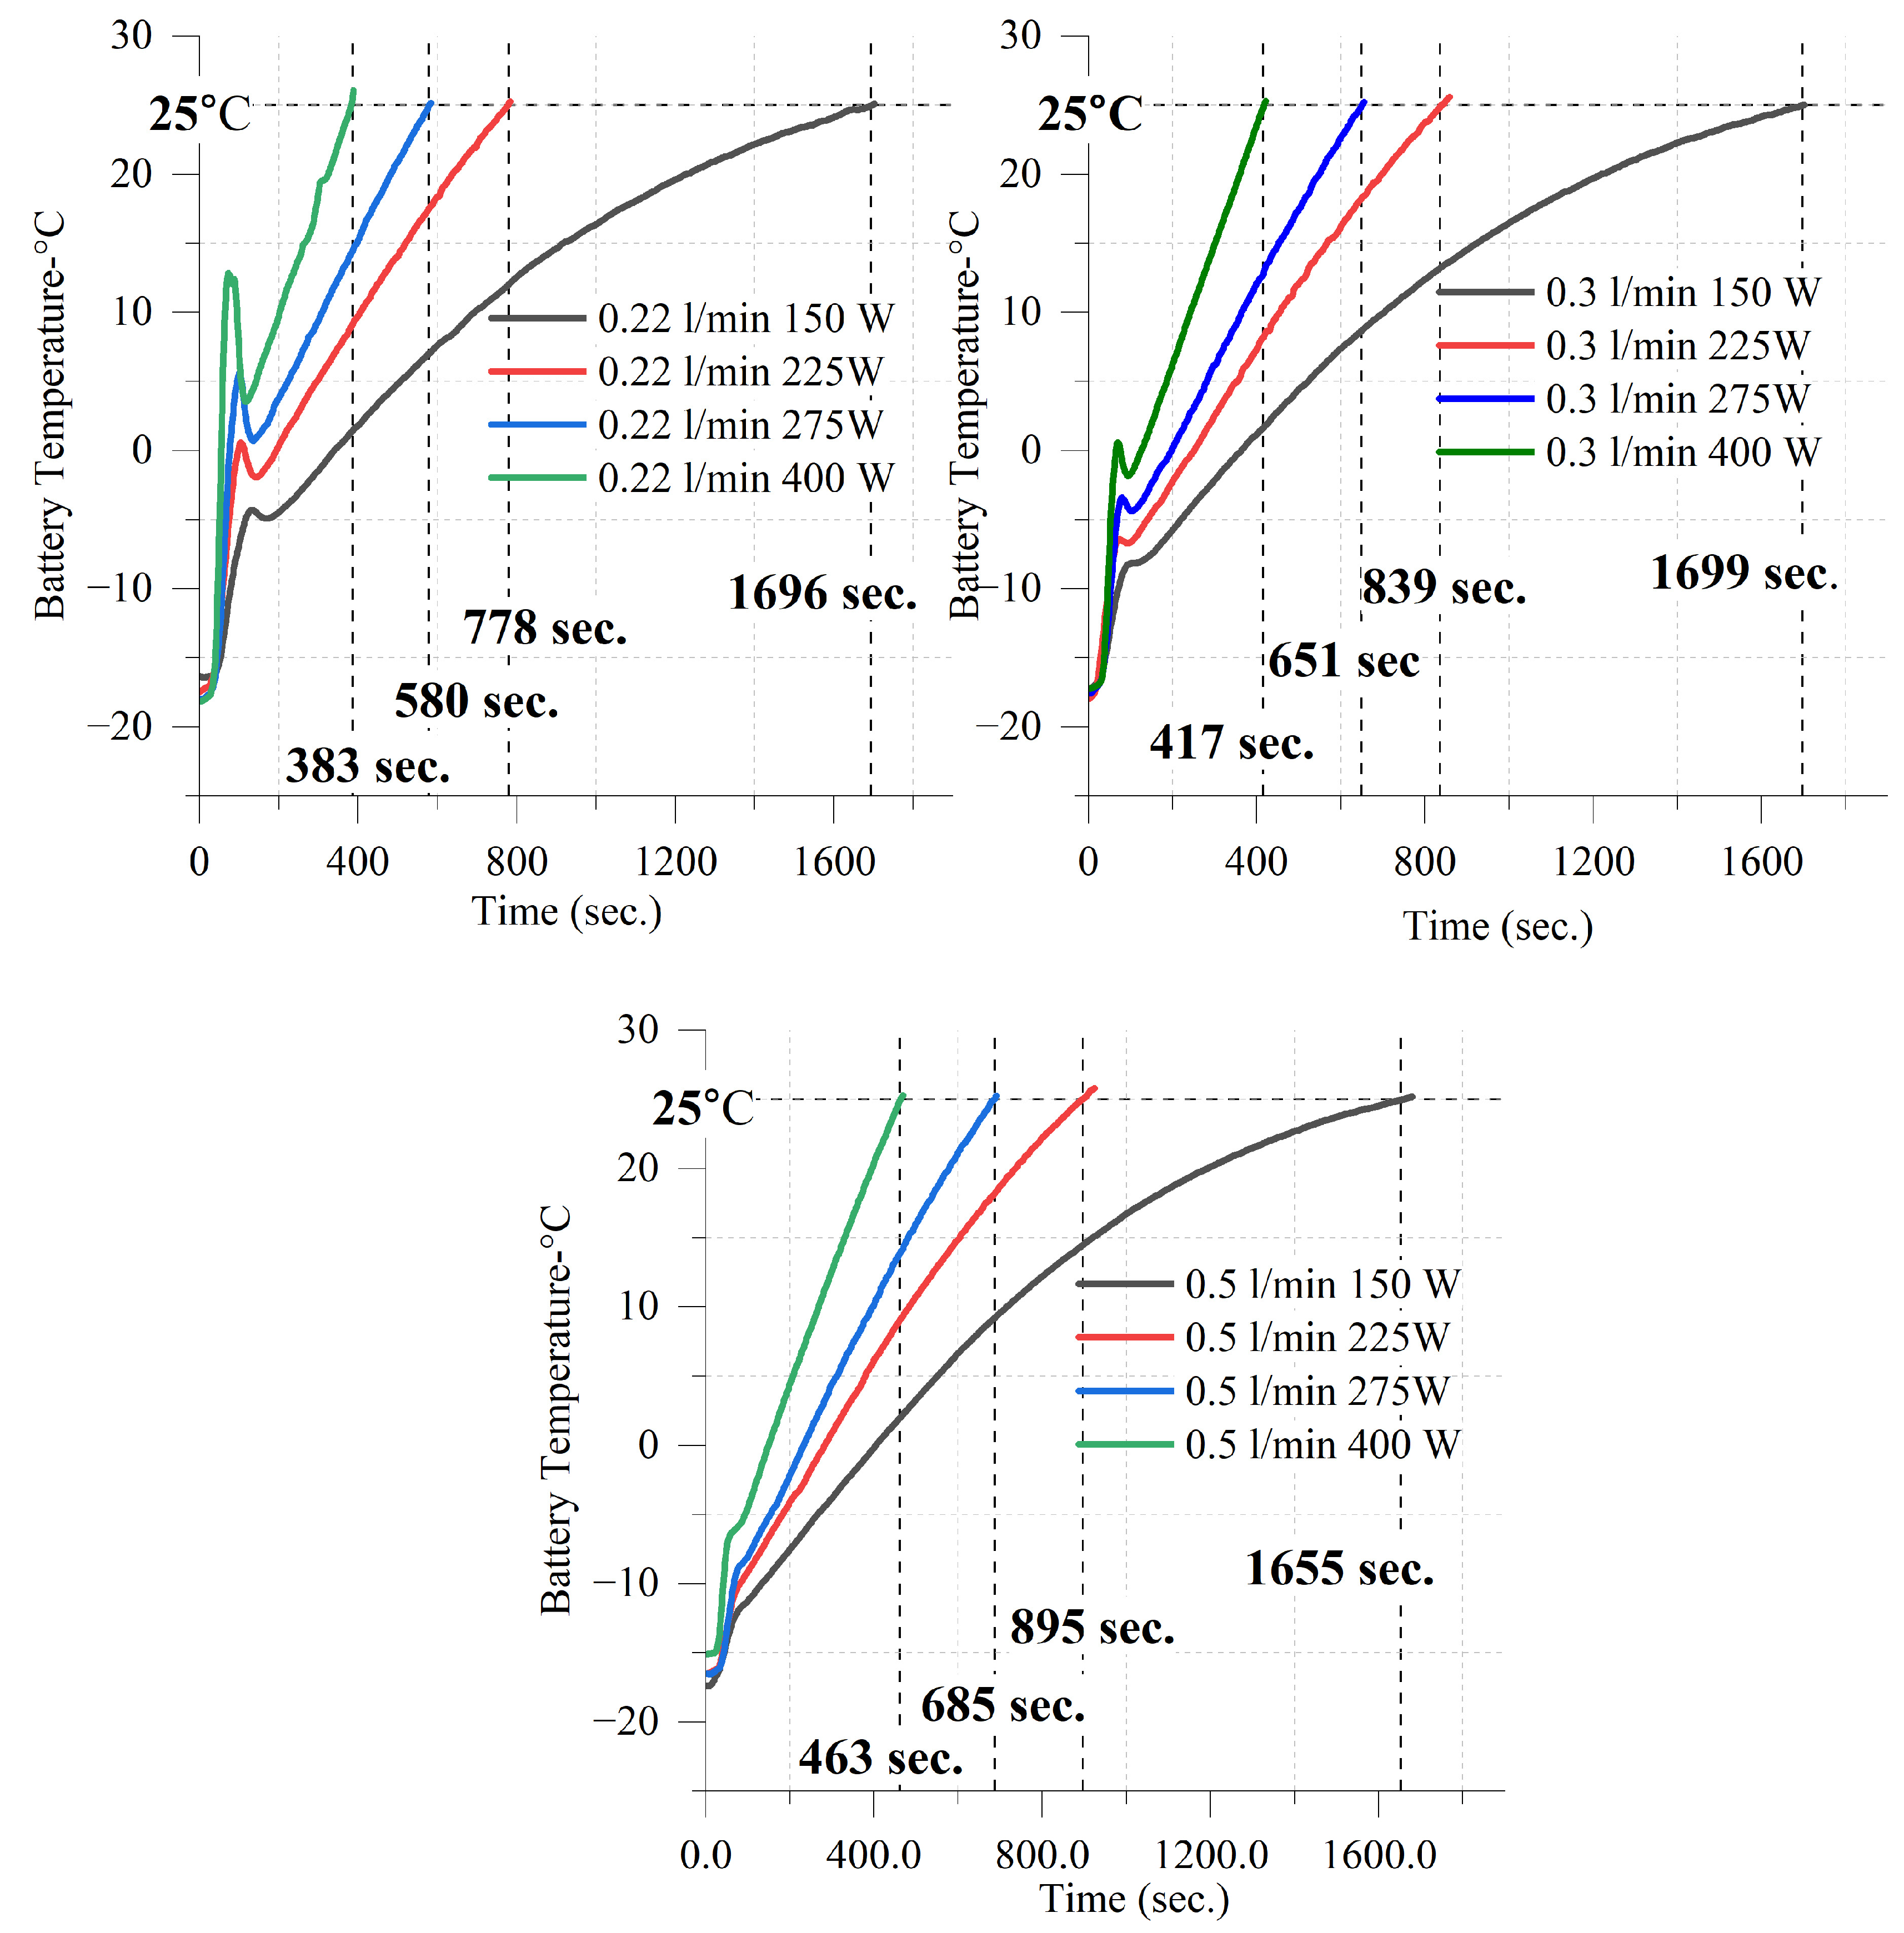
3.1. Evaluation of the Results at −15 °C Conditions

In Figure 3, the battery cell temperatures at different flow rates for constant induction power levels (150 W, 225 W, 275 W, and 400 W) under −15 °C conditions are given. It is observed that increasing the induction power significantly reduces the time required to reach the target temperature of 25 °C. At a power input of 150 W, the heating process exhibits a significantly slow rate across all flow conditions, with the longest heating duration observed at a flow rate of 0.5 L/min. Conversely, at 400 W, the heating time is substantially reduced, with the 0.22 L/min flow rate achieving the fastest temperature rise. However, at lower flow rates, an unstable heating pattern is detected due to nucleate boiling within the fluid, which leads to sudden temperature fluctuations. In the conditions of 0.22 L/min, the heating rate is initially the highest, particularly at 400 W, but rapid temperature increases are followed by noticeable drops. This behavior suggests that nucleate boiling occurs within the liquid surrounding the battery, momentarily reducing effective heat transfer before re-establishing thermal contact. The localized formation of vapor bubbles disrupts the uniformity of heat distribution, leading to temporary reductions in temperature before stabilizing again. At higher flow rates (0.5 L/min), the heating process is more stable, with temperature rising smoothly without sudden drops. However, due to the increased convective heat removal, the total heating time is longer compared to 0.22 L/min. This indicates that while higher flow rates mitigate core boiling effects, they also reduce the direct heating effect on the battery, lowering overall efficiency.
In Figure 4, the battery cell temperatures are presented for different induction power levels (150 W, 225 W, 275 W, and 400 W) at constant flow rates (0.22 L/min, 0.3 L/min, and 0.5 L/min) under −15 °C conditions. The results observed in Figure 3 are confirmed here, but with a controlled comparison by keeping the flow rate constant. This allows for a clearer assessment of the effect of induction power on battery heating. At a flow rate of 0.22 L/min, the heating rate is maximized, particularly at 400 W, where the battery attains 25 °C within 383 s. However, temperature fluctuations are observed, confirming the occurrence of nucleate boiling. These fluctuations indicate a temporary loss of thermal contact due to vapor bubble formation, resulting in momentary reductions in heating efficiency before stabilization. At a flow rate of 0.3 L/min, heating remains effective while mitigating the instability observed at lower flow rates. Under 400 W power input, the battery reaches 25 °C in 417 s, reflecting a slight increase in heating duration compared to 0.22 L/min but with a more uniform temperature rise. This finding suggests that 0.3 L/min provides an optimal balance between rapid heating and thermal stability. Conversely, at a flow rate of 0.5 L/min, heating time further increases, with 25 °C being reached in 463 s at 400 W, indicating a trade-off between stability and heating efficiency. The absence of temperature fluctuations suggests that nucleate boiling effects are minimized due to increased fluid circulation. However, the overall heating efficiency decreases as a portion of the heat is carried away by the faster-moving liquid.
In Figure 5, the liquid inlet and outlet temperatures are presented for different induction power levels (150 W, 225 W, 275 W, and 400 W) at varying flow rates (0.22 L/min, 0.3 L/min, and 0.5 L/min) under −15 °C conditions. When the flow rate is 0.22 L/min, the temperature difference between the liquid inlet and outlet reaches its highest value across all power levels, indicating greater heat retention within the circulating fluid. However, at elevated power levels, particularly at 275 W and 400 W, nucleate boiling effects become dominant, resulting in irregular temperature variations. These fluctuations suggest that localized vaporization within the copper tubing momentarily diminishes heat transfer efficiency before liquid recirculation restores thermal stability. In contrast, a flow rate of 0.3 L/min leads to a moderate temperature difference between the inlet and outlet, ensuring more stable heat transfer. This finding implies that 0.3 L/min facilitates a more balanced heat exchange by minimizing excessive thermal losses while preventing nucleate boiling. At the highest flow rate of 0.5 L/min, the temperature difference between the inlet and outlet is the smallest among all power levels. While the increased flow rate enhances convective heat transfer, it also accelerates heat removal, preventing effective thermal energy transfer to the battery.
In Figure 6a, the heat transfer to the liquid is analyzed under different flow rates (0.22 L/min, 0.3 L/min, and 0.5 L/min) and induction power levels (150 W, 225 W, 275 W, and 400 W) at −15 °C conditions. The results indicate that heat transfer increases with higher induction power across all flow rates (except 0.5 L/min case from 275 W to 400 W), but the rate of increase varies depending on the fluid circulation characteristics. When the flow rate is set to 0.22 L/min, the highest heat transfer value is recorded at 400 W, reaching approximately 148.5 W. However, at this low flow rate, fluctuations in heat transfer are evident, primarily due to nucleate boiling effects. The formation of localized vapor at 400 W results in unstable heat absorption, temporarily diminishing heat transfer efficiency before the system stabilizes. In comparison, a flow rate of 0.3 L/min enhances heat transfer capacity, achieving 131.7 W at 400 W, which represents the highest observed value across all conditions. This flow rate facilitates a more balanced heat exchange, ensuring efficient heat absorption while mitigating the instability detected at 0.22 L/min. At 0.5 L/min, heat transfer values are generally lower as the increased convective heat removal leads to greater dissipation of thermal energy before it can be effectively transferred. The reduced residence time of the liquid in the heating region limits the amount of heat it can absorb before being carried away. Also, in the case of 0.5 L/min and 400 W, the material and geometric properties of the system may cause it to reach its maximum heat transfer capacity after a certain energy level. In this condition, when the pipe and fluid reach a certain maximum temperature difference, the capacity of the system may be full and it may not be able to transfer more heat effectively.
In the heat transfer coefficient graph (Figure 6b), an increase in the flow rate generally leads to a higher heat transfer coefficient due to improved convective heat transfer. The maximum h value, approximately 5244.2 W/m2·K, is observed at 400 W and 0.3 L/min, indicating the enhanced heat transfer capabilities at higher power and medium flow rates. Conversely, the minimum value of around 2929.9 W/m2·K occurs at 150 W and 0.3 L/min, highlighting the reduced convective interaction at low power and intermediate flow rates. The Nusselt number graph (Figure 6c) reveals parallel behavior with heat transfer coefficient graph. While higher power levels and flow rates often correlate with increased Nu values, the highest Nu number, approximately 80.8, is recorded at 400 W and 0.3 L/min as initially expected. This indicates that the interaction between the flow rate and power level is complex, and an intermediate flow rate can sometimes yield higher turbulence and more effective convective heat transfer compared to the maximum flow rate.
The observed heat transfer coefficients and Nusselt numbers are higher than expected for a fully developed laminar flow, primarily due to the effects of induction heating. The localized overheating of the induction-heated tube leads to the formation of microbubbles within the working fluid. These bubbles persist as the fluid moves through the system, disrupting the thermal boundary layer and enhancing convective heat transfer, even in an overall laminar flow regime. Additionally, the spiral arrangement of the copper tubing around the battery increases the effective heat transfer area and may introduce mild flow disturbances. Furthermore, temperature-dependent variations in fluid properties, particularly changes in viscosity and density, contribute to deviations from classical heat transfer correlations for laminar flow. These combined effects explain the observed enhancement in heat transfer performance.
In Figure 7a, the heating rate (°C/s) is presented for different flow rates (0.22 L/min, 0.3 L/min, and 0.5 L/min) under various induction power levels (150 W, 225 W, 275 W, and 400 W) at −15 °C conditions. The results indicate that higher induction power significantly increases the heating rate. Meanwhile, the flow rate plays a crucial role in determining heating efficiency. At 150 W, the heating rates remain relatively low across all flow rates. The highest heating rate is observed at 0.22 L/min (0.024 °C/s), followed by 0.3 L/min (0.025 °C/s), and 0.5 L/min (0.025 °C/s). The similarity in values suggests that at low power, the impact of flow rate on heating performance is minimal. At a power input of 225 W, the differences between flow rates become more pronounced, highlighting variations in heat transfer efficiency and thermal stability. The heating rate at 0.22 L/min reaches 0.054 °C/s, while at 0.3 L/min, it is 0.051 °C/s, and at 0.5 L/min, it is 0.046 °C/s. This confirms that lower flow rates allow for faster temperature increases as the liquid remains in contact with the heat source for a longer duration, leading to more effective heat transfer. At 275 W, the heating rate increases significantly, reaching 0.074 °C/s at 0.22 L/min, while at 0.3 L/min and 0.5 L/min, the values drop to 0.065 °C/s and 0.060 °C/s, respectively. The decreasing trend at higher flow rates indicates that faster liquid circulation removes heat more rapidly, reducing the overall heating effect on the battery. At 400 W, the highest heating rates are recorded, with 0.22 L/min achieving 0.114 °C/s, followed by 0.3 L/min at 0.101 °C/s, and 0.5 L/min at 0.086 °C/s. The trend remains consistent, showing that lower flow rates result in higher heating rates due to prolonged thermal interaction.
In Figure 7b, the heating efficiency (°C/s·W) is presented. Heating efficiency is defined as the ratio of the heating rate to the applied power, indicating how effectively the input power is converted into useful heat for battery warming. With an induction power of 150 W, the heating efficiencies for 0.22 L/min, 0.3 L/min, and 0.5 L/min are nearly identical, recorded at 0.0162 °C/s·W for all three flow rates. This suggests that at low power levels, the effect of flow rate on heating efficiency is minimal. At 225 W, heating efficiency increases slightly, with 0.22 L/min reaching 0.0242 °C/s·W, while 0.3 L/min and 0.5 L/min show lower values of 0.0220 °C/s·W and 0.0203 °C/s·W, respectively. The trend indicates that lower flow rates enhance heating efficiency as heat retention within the liquid is greater. At 275 W, heating efficiency follows a similar pattern, where 0.22 L/min achieves 0.0269 °C/s·W, 0.3 L/min reaches 0.0237 °C/s·W, and 0.5 L/min records 0.0220 °C/s·W. The gap between 0.22 L/min and higher flow rates widens, emphasizing the benefit of prolonged heat interaction at lower flow rates. When the induction power is 400 W, the highest efficiency is observed at 0.22 L/min, reaching 0.0285 °C/s·W, while 0.3 L/min and 0.5 L/min decline to 0.0258 °C/s·W and 0.0216 °C/s·W, respectively.
Table 3 presents the heating times required for the battery to reach 0 °C and 25 °C under different power levels (150 W, 225 W, 275 W, and 400 W) and flow rates (0.22 L/min, 0.3 L/min, and 0.5 L/min) at −15 °C conditions. The calculated heating rates indicate that heating is significantly faster at lower temperatures but slows down as the battery approaches 25 °C. For instance, at 400 W and 0.22 L/min, the heating rate is 0.2727 °C/s up to 0 °C, but it decreases to 0.1044 °C/s when 25 °C is reached. This trend is consistent across all conditions, confirming that heat transfer is more efficient when the temperature gradient between the battery and the surrounding environment is high. The flow rate also has a substantial impact on heating performance. While 0.22 L/min consistently achieves the fastest initial heating, its efficiency declines more sharply as the temperature increases, likely due to nucleate boiling effects causing instability in heat transfer. In contrast, 0.3 L/min provides a more balanced and stable heating process, with a heating rate of 0.2273 °C/s to 0 °C and 0.0959 °C/s to 25 °C at 400 W. This indicates that moderate flow rates maintain a more uniform heating profile, reducing rapid fluctuations and thermal losses. Meanwhile, 0.5 L/min exhibits the slowest heating rates across all power levels, confirming that excessive fluid circulation removes heat before it can effectively raise the battery temperature. The power level plays a dominant role in determining overall heating efficiency. At 150 W, heating is relatively slow, with the battery reaching 0 °C at 0.0442 °C/s (0.22 L/min), which is nearly six times slower than at 400 W (0.2727 °C/s). A similar trend is observed at 225 W and 275 W, where increasing power levels improve heating rates, but the efficiency gain diminishes as the battery warms. At 275 W and 0.22 L/min, the heating rate drops from 0.1974 °C/s to 0 °C to 0.0690 °C/s to 25 °C, highlighting that as the battery reaches higher temperatures, additional energy is required to maintain the same heating rate.
In Figure 8, the internal resistance of the battery is presented under different induction power levels (150 W, 225 W, 275 W, and 400 W) and flow rates (0.22 L/min, 0.3 L/min, and 0.5 L/min) at −15 °C conditions. Internal resistance is a critical parameter affecting battery performance as high resistance reduces power output and efficiency, particularly in cold environments. The results indicate a clear decreasing trend in internal resistance as the battery temperature increases. With an induction power of 150 W, the internal resistance remains relatively high across all flow rates due to the slower heating process, which delays the reduction in resistance. At 0.22 L/min, the resistance starts high but decreases faster compared to 0.3 L/min and 0.5 L/min, confirming that lower flow rates accelerate the initial temperature rise, thereby reducing resistance more quickly. At 225 W and 275 W, the internal resistance decreases more significantly as the heating process becomes more effective. The 0.3 L/min flow rate consistently exhibits the most stable reduction in resistance, balancing fast heating and uniform temperature distribution. When the induction power is 400 W, the most pronounced decrease in internal resistance is observed, with 0.22 L/min showing the fastest drop initially.
The internal resistance values reported in this study account for Ohmic resistance, activation overpotential, and concentration overpotential. However, since the battery was in a rest condition with no current flow, the dominant contribution to the measured resistance is from Ohmic resistance, as activation and concentration overpotential effects are negligible in the absence of charge/discharge cycles.

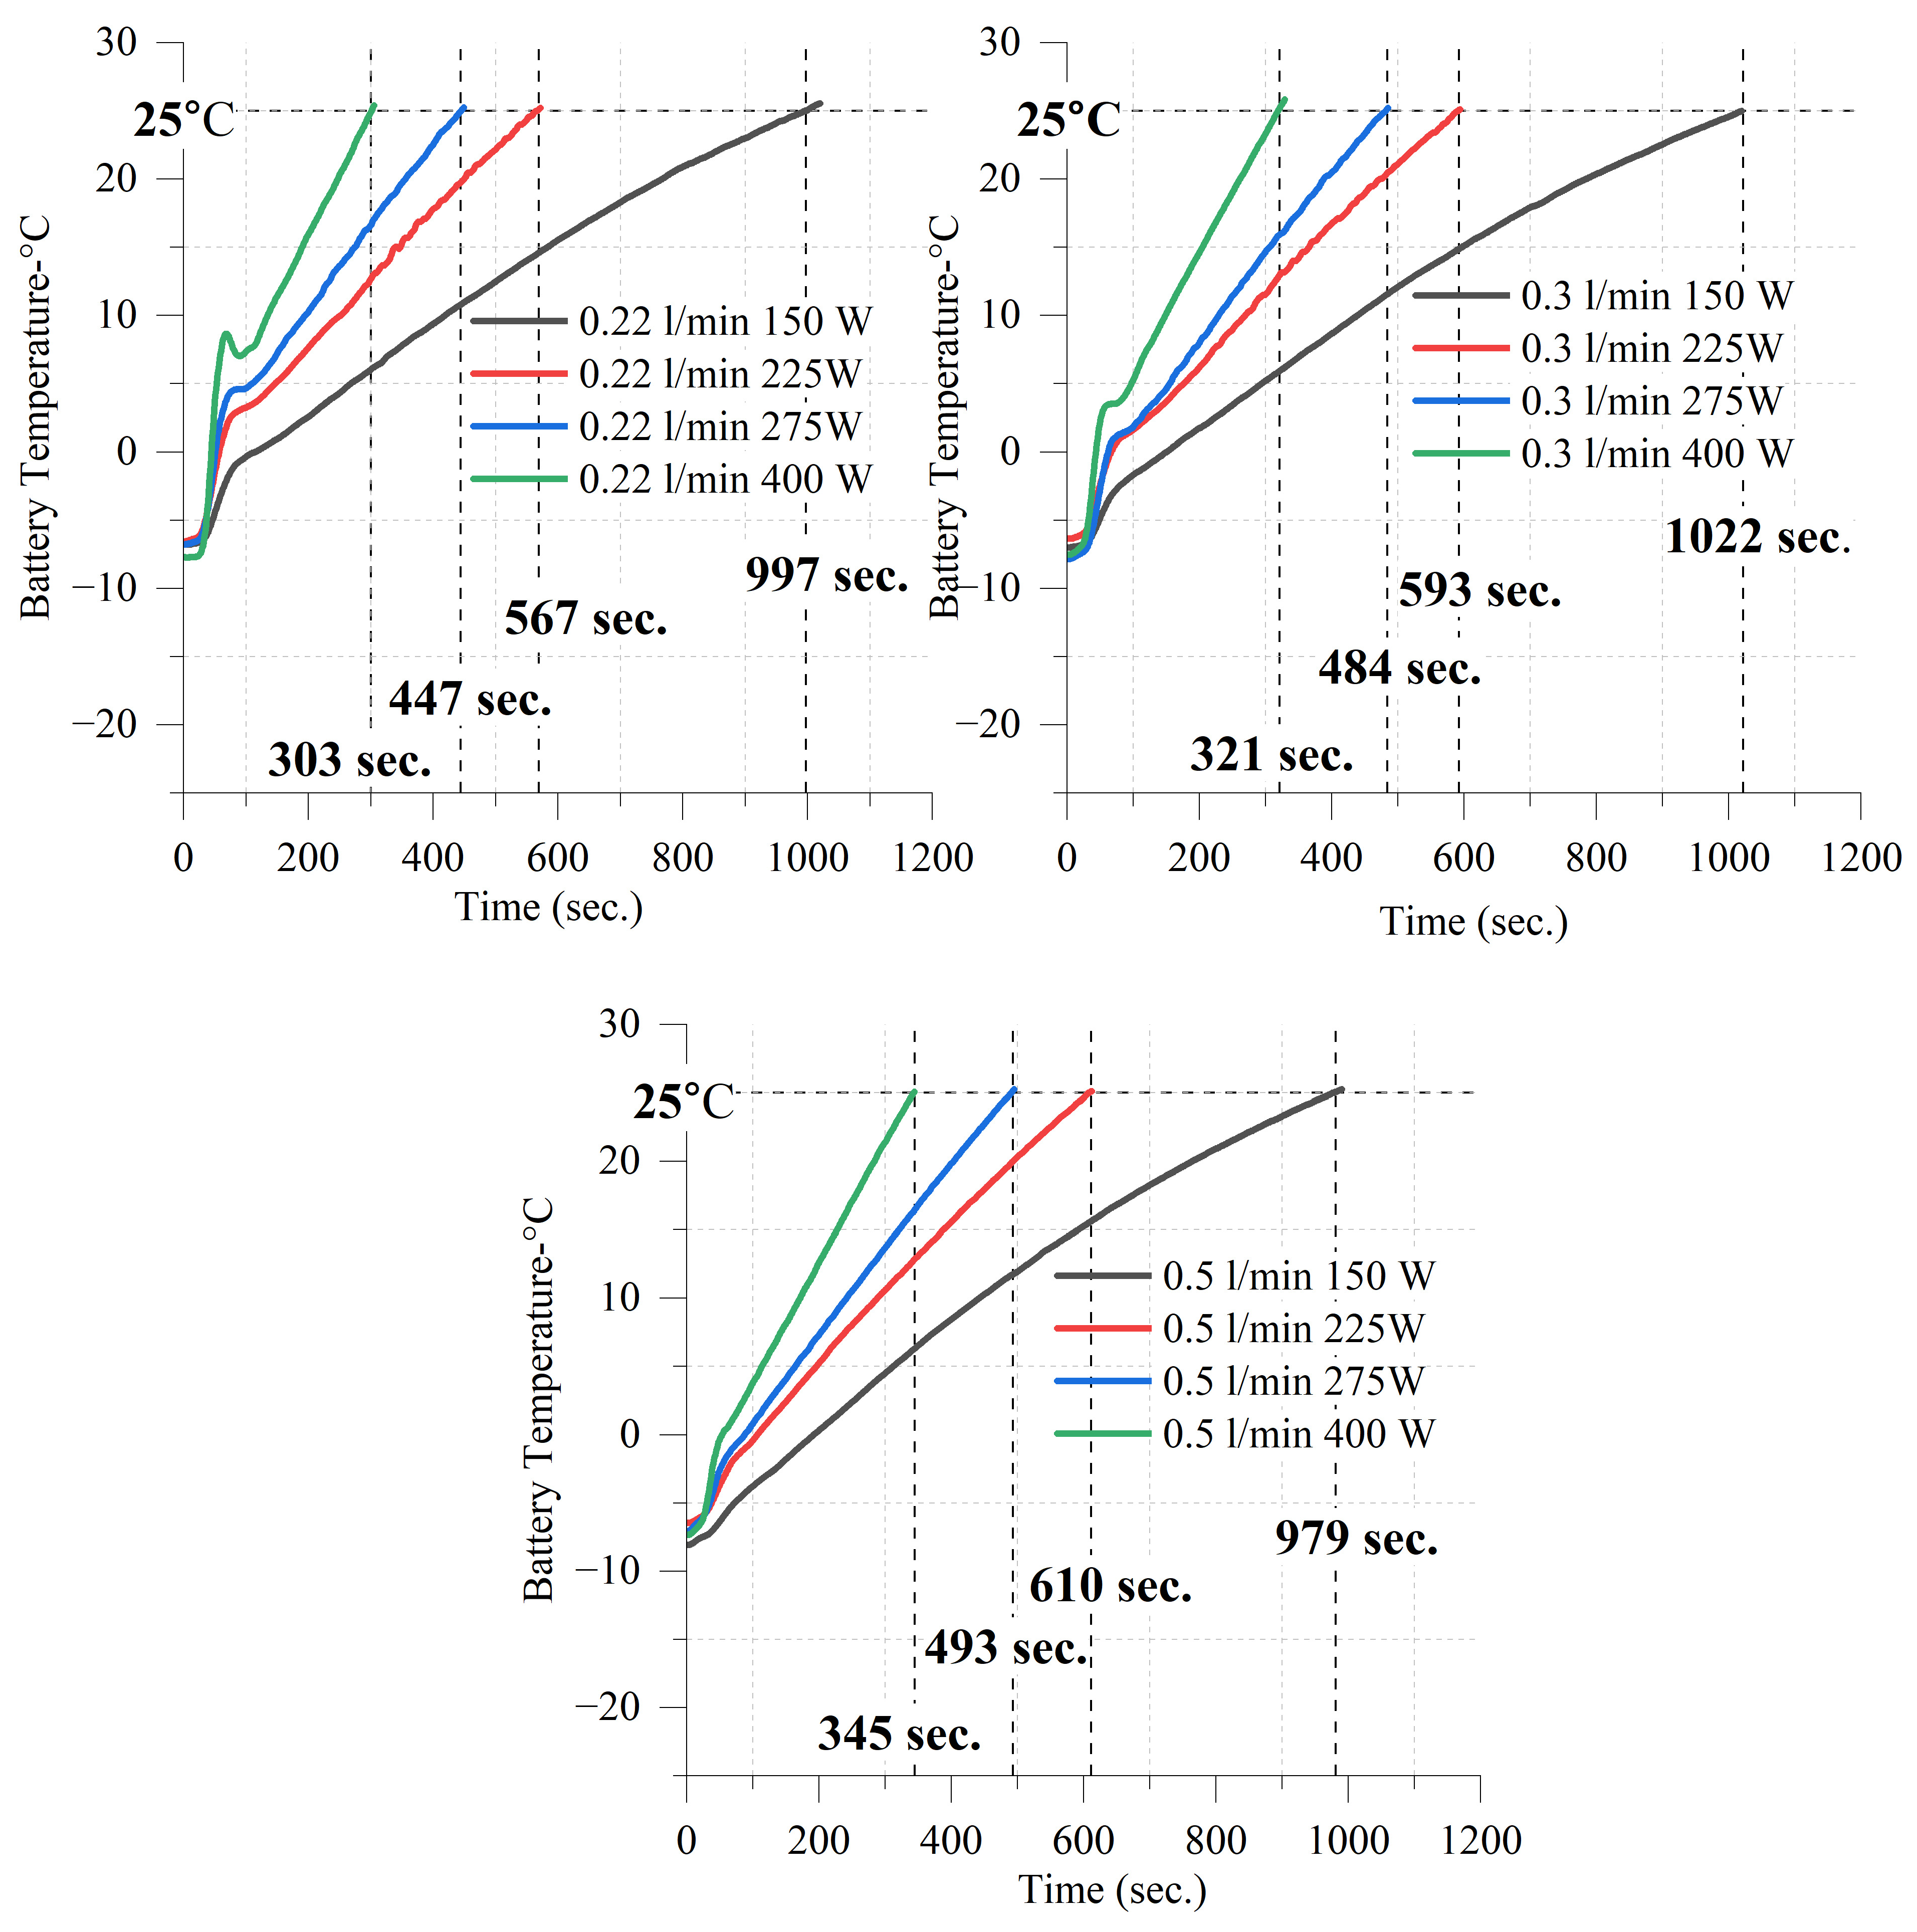
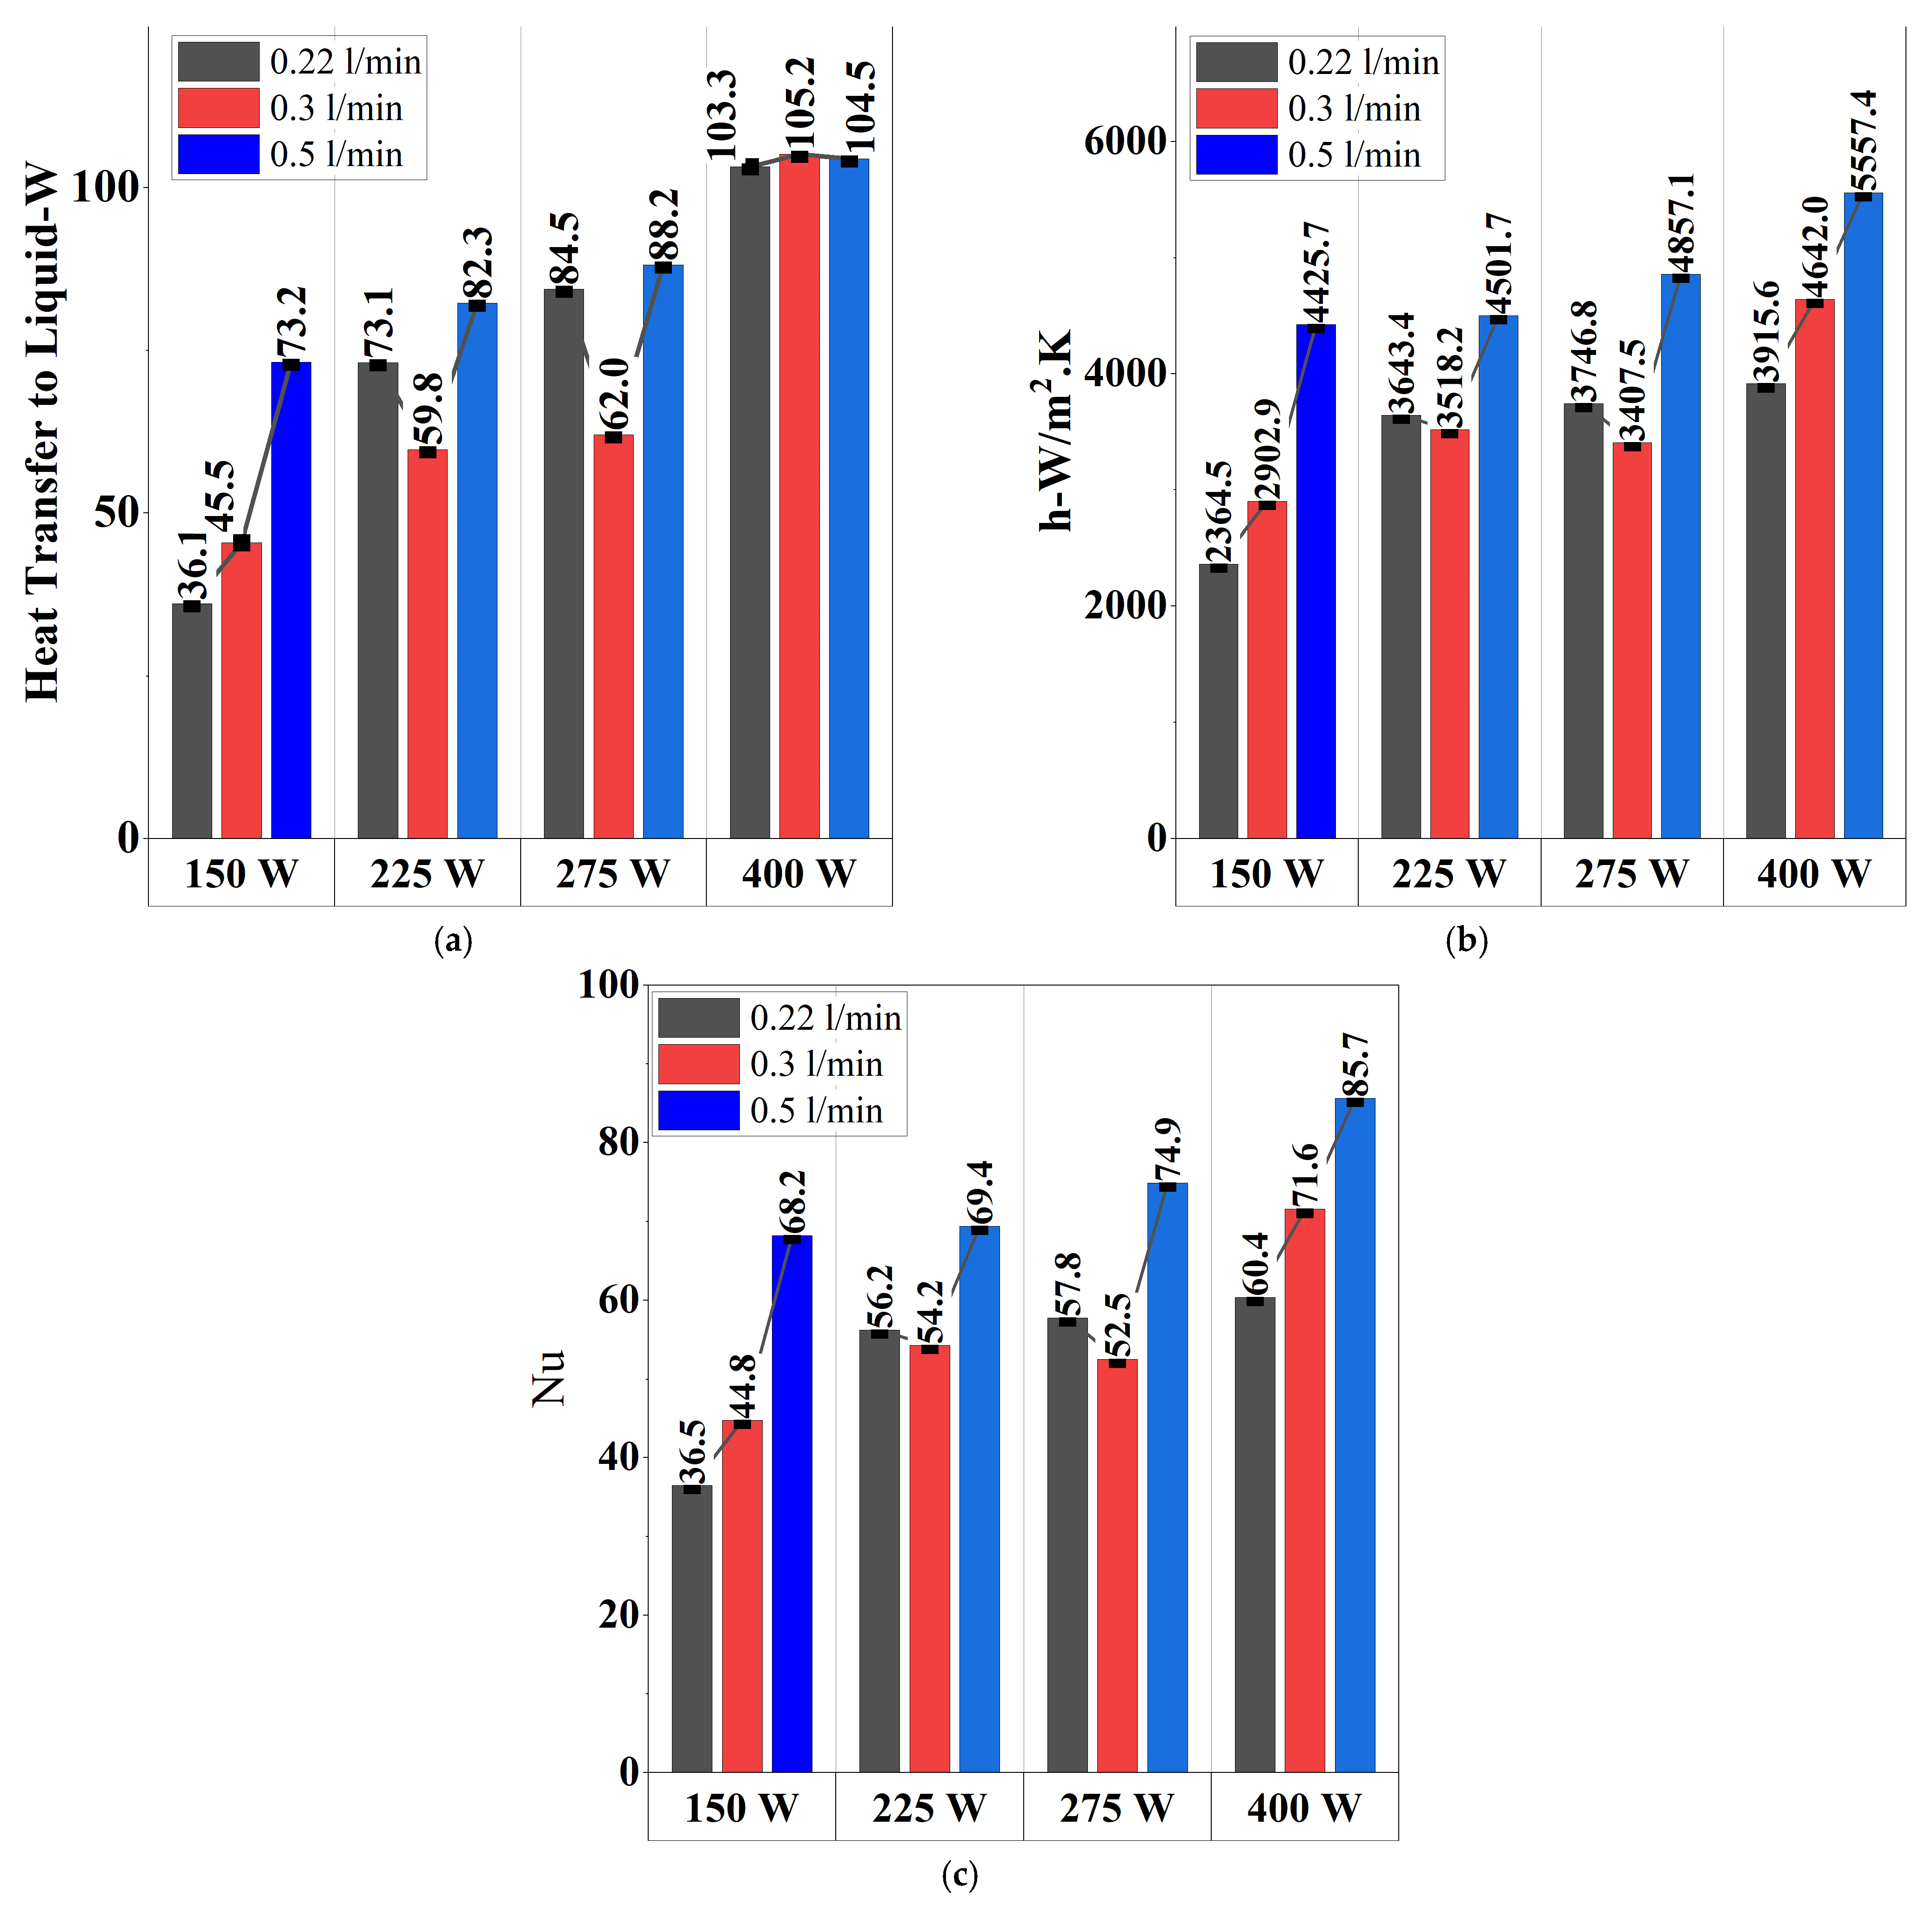
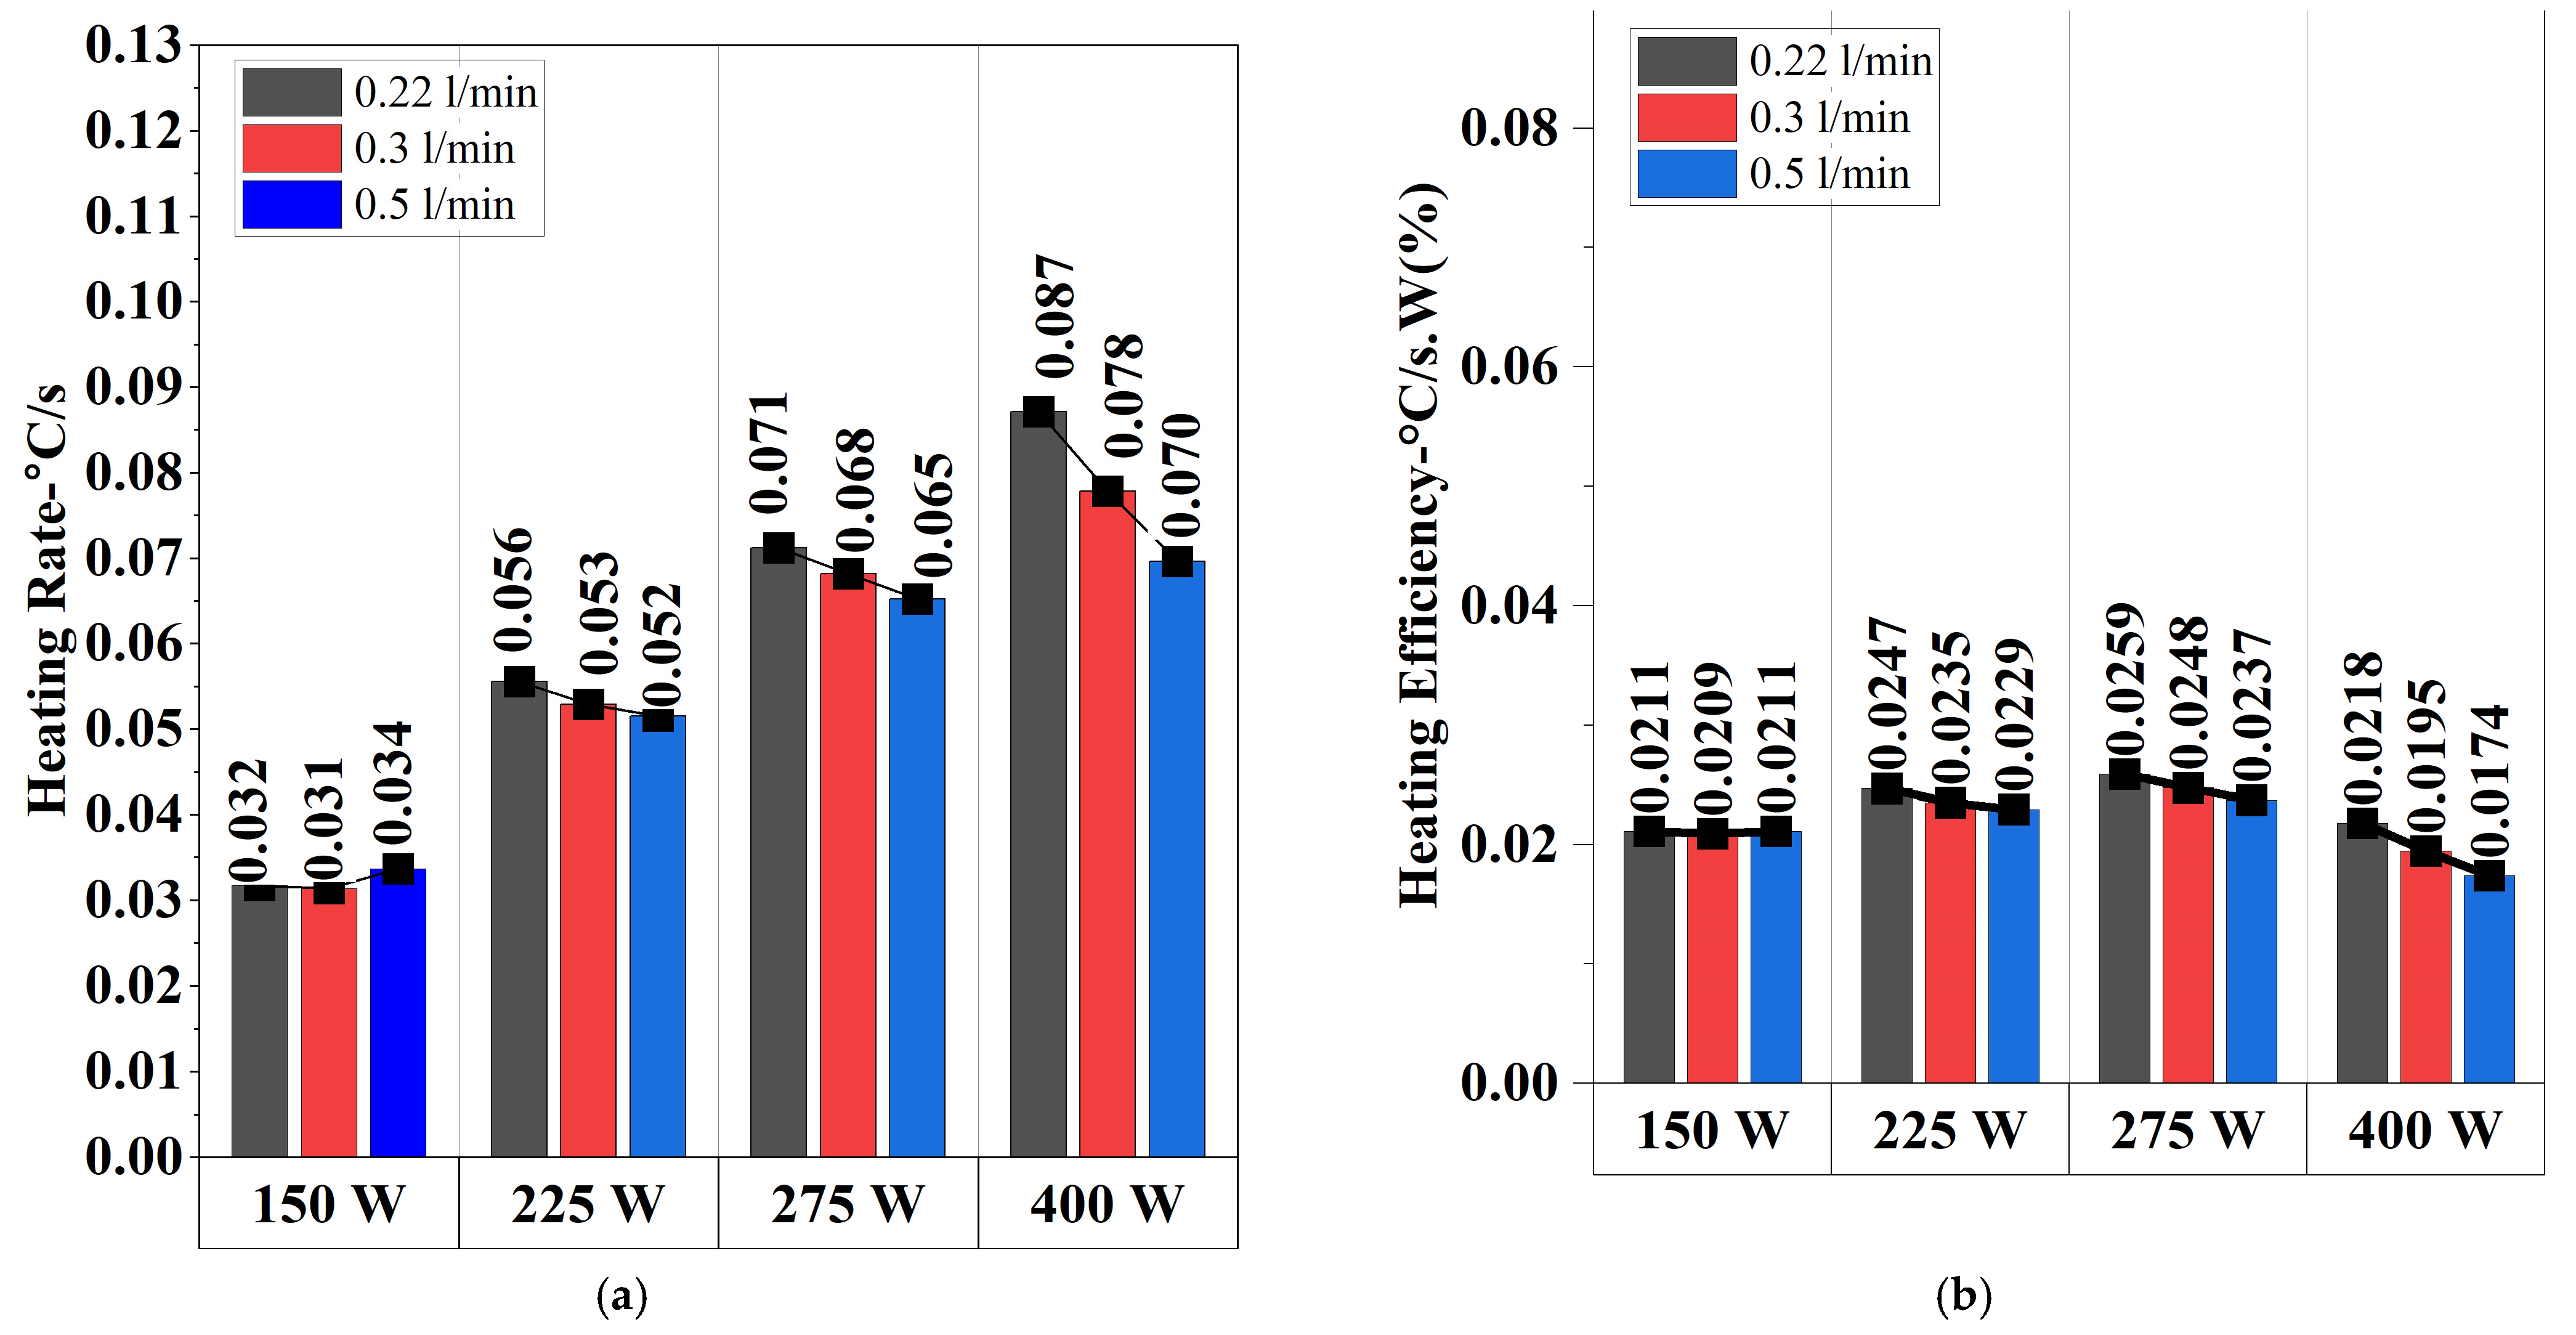
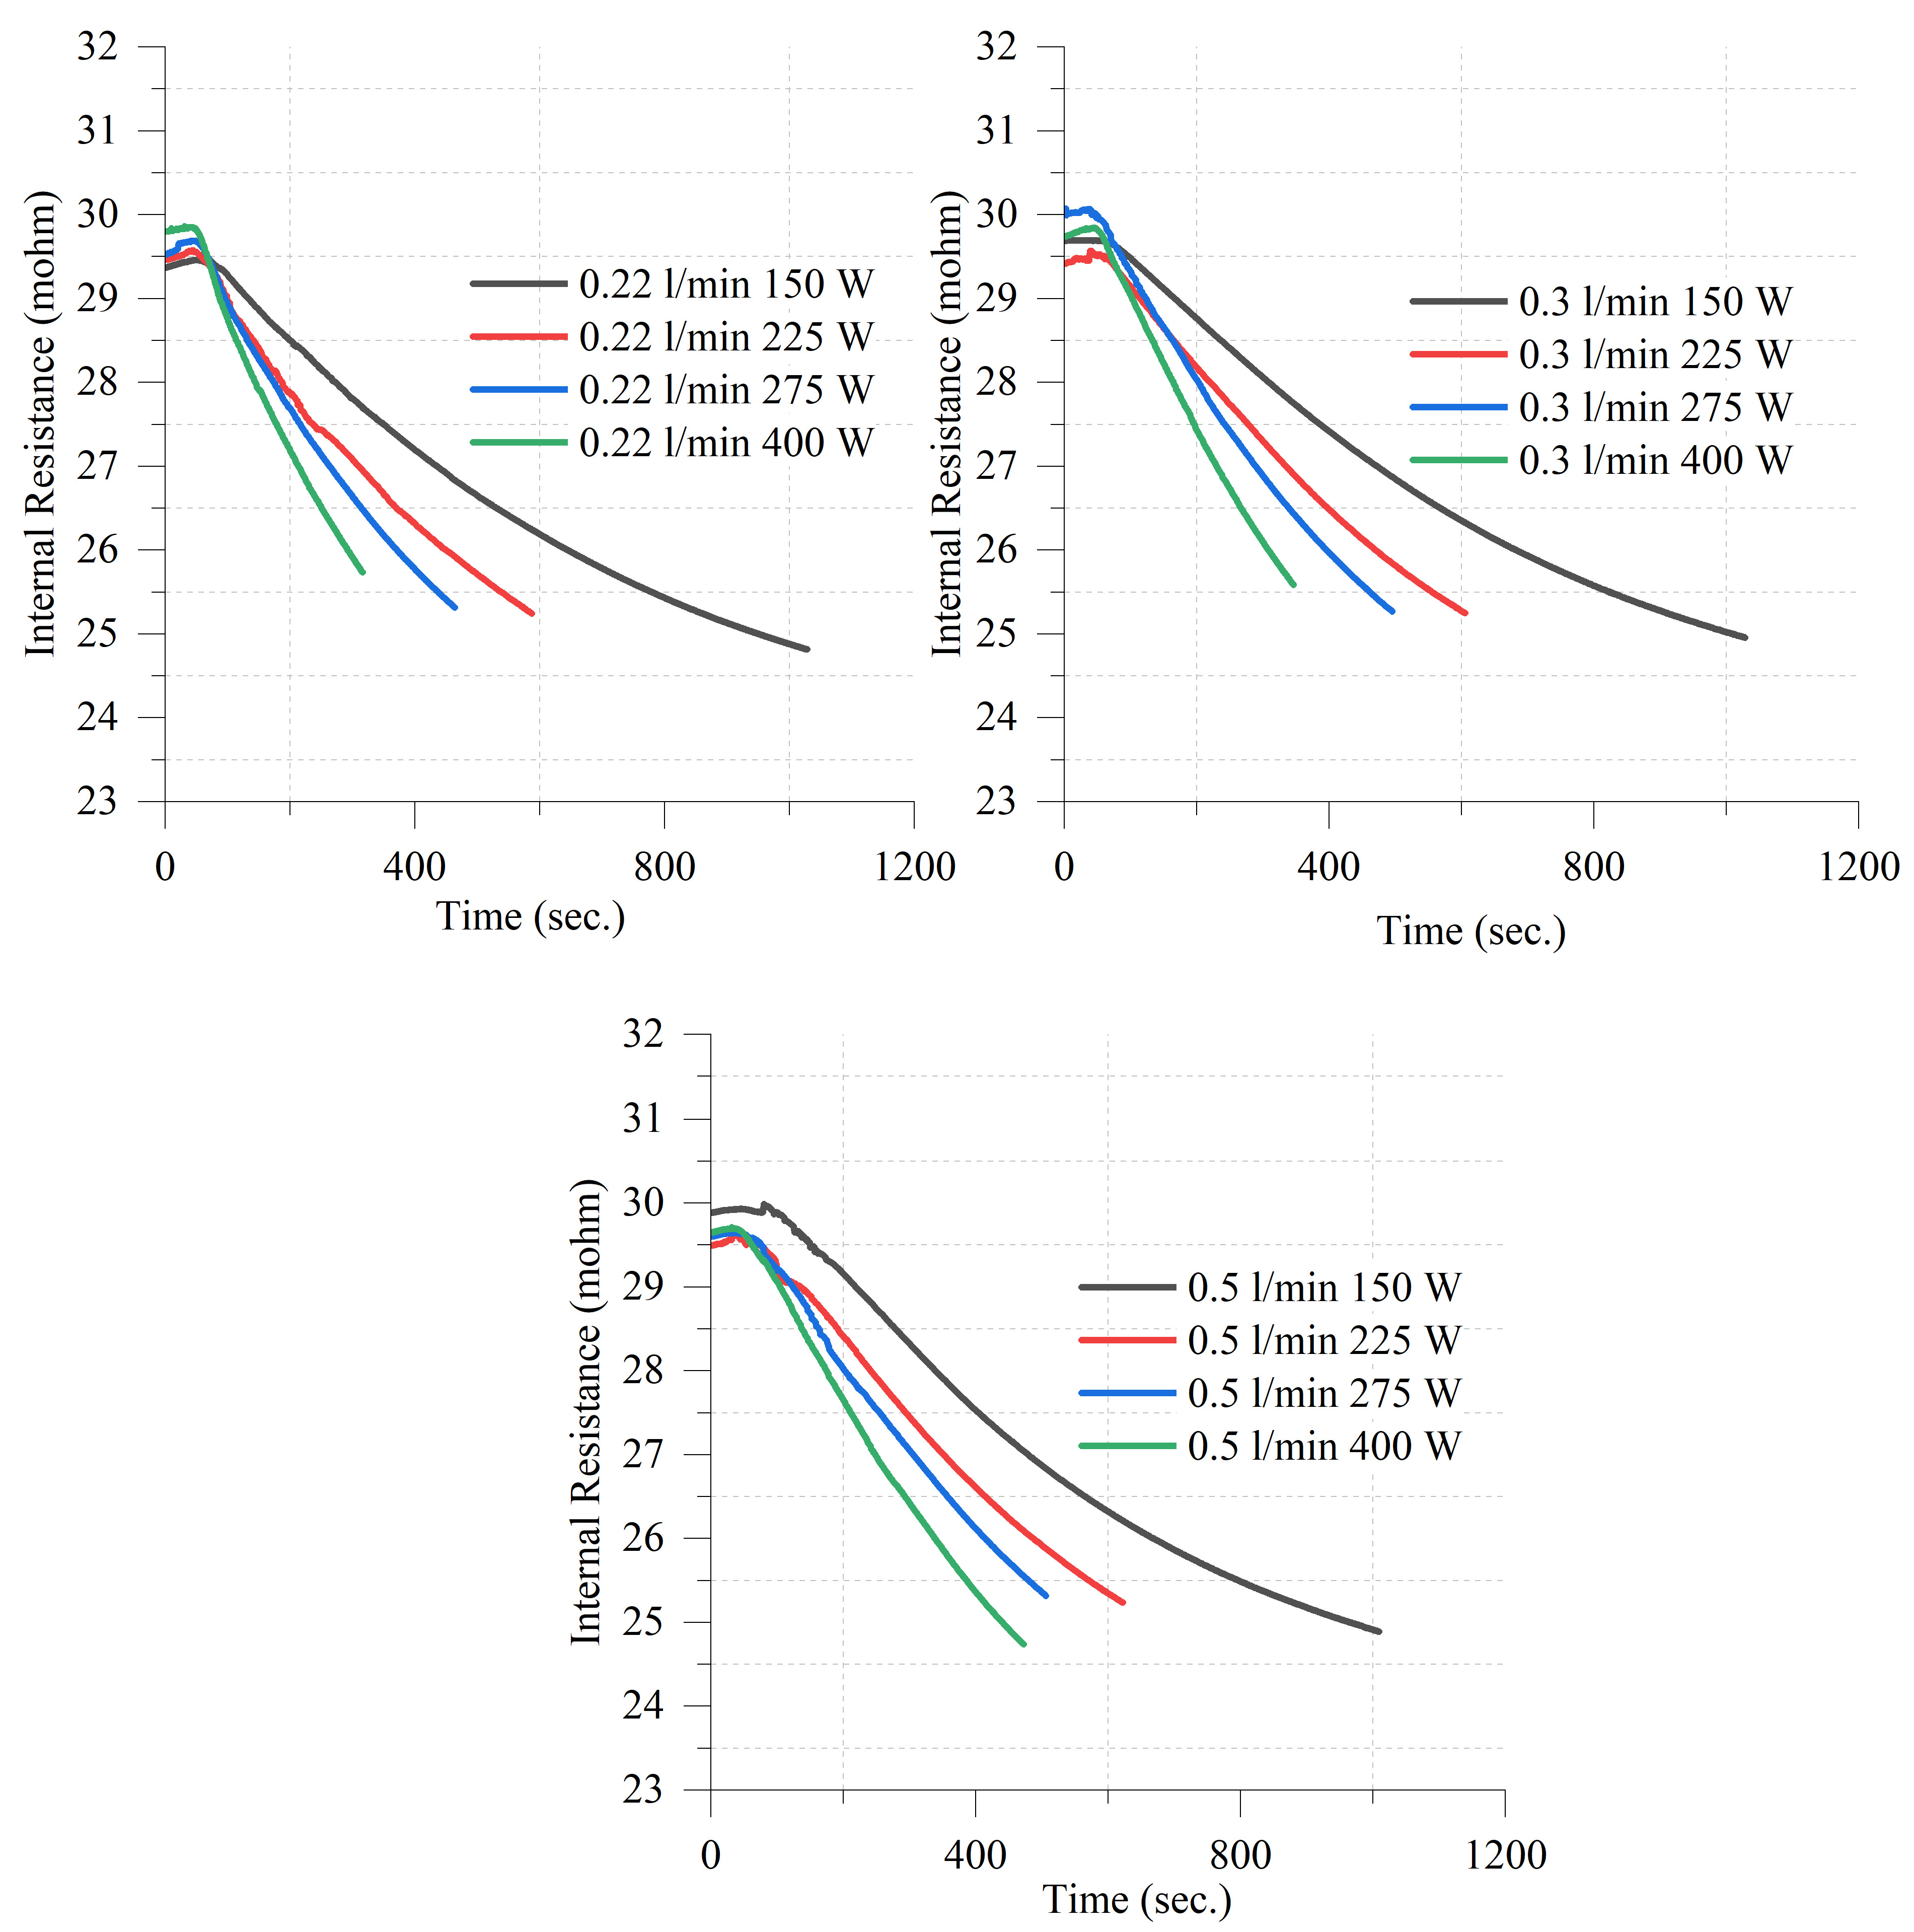
3.2. Evaluation of the Results at −5 °C Conditions

In Figure 9, the battery cell temperatures are presented for different flow rates (0.22 L/min, 0.3 L/min, and 0.5 L/min) under constant induction power levels (150 W, 225 W, 275 W, and 400 W) at −5 °C conditions. Compared to the results at −15 °C (Figure 3), the overall heating performance is improved due to the higher initial ambient temperature, leading to shorter heating times and more stable thermal behavior. The results indicate that higher induction power accelerates the heating process, with 400 W achieving the fastest temperature rise across all flow rates. When the flow rate was 0.22 L/min, the most rapid heating is observed, but temperature fluctuations become more evident at higher power levels, suggesting the presence of localized nucleate boiling effects. While these effects were more severe at −15 °C, they are still noticeable at −5 °C, confirming that low flow rates may cause non-uniform heat distribution. At 0.3 L/min, the temperature rise remains efficient while avoiding the instability seen at 0.22 L/min. The battery reaches 25 °C more consistently and with fewer fluctuations, making this flow rate the most balanced in terms of speed and uniformity. Meanwhile, at 0.5 L/min, the heating process is more gradual, with the slowest temperature increase across all power levels. This trend is consistent with previous findings, where higher flow rates reduce the risk of overheating but result in longer heating durations due to increased convective losses.
In Figure 10, the battery temperature evolution over time is analyzed under different flow rates (0.22 L/min, 0.3 L/min, and 0.5 L/min) and induction power levels (150 W, 225 W, 275 W, and 400 W) at −5 °C ambient conditions. Compared to the results at −15 °C, a noticeable improvement in heating performance is observed, with the battery reaching target temperatures more quickly across all conditions. This is due to the smaller initial temperature difference between the heating fluid and the battery, which enhances heat transfer efficiency and reduces energy losses. At higher power levels (275 W, 400 W), the heating process is significantly accelerated, with the battery reaching 25 °C in a much shorter time compared to −15 °C conditions. However, at 400 W and 0.22 L/min, temperature fluctuations due to localized boiling effects are still present, although they are less severe than in extreme-cold conditions. The impact of the flow rate on the heating performance remains consistent with trends observed at −15 °C. With a flow rate of 0.22 L/min, the fastest temperature rise is achieved, but instability in heating is observed at high power levels, suggesting that nucleate boiling effects are still present but less intense than at −15 °C. At 0.3 L/min, the heating process remains fast while providing greater stability, making it the most balanced option. When the flow rate is 0.5 L/min, the temperature rise is the slowest, as higher fluid circulation removes heat more quickly, limiting direct energy transfer to the battery.
In Figure 11, the liquid inlet and outlet temperatures over time are analyzed under different flow rates (0.22 L/min, 0.3 L/min, and 0.5 L/min) and induction power levels (150 W, 225 W, 275 W, and 400 W) at −5 °C conditions. The results indicate that lower flow rates, particularly 0.22 L/min, lead to a faster increase in inlet temperature due to prolonged thermal interaction. However, at 225 W and higher, nucleate boiling regions (NBRs) appear at this flow rate, characterized by fluctuations in temperature. These fluctuations suggest the formation of vapor bubbles, which intermittently reduce heat transfer efficiency before stabilizing. Compared to the results at −15 °C, the nucleate boiling effects are still present but less severe, indicating that boiling is more problematic at extreme-cold conditions where heat absorption is less efficient. When the flow rate is 0.3 L/min, the inlet temperature rise remains efficient while maintaining stability, confirming that this flow rate offers an optimal balance between heating speed and uniform heat distribution. Unlike 0.22 L/min, where boiling-induced fluctuations are observed, 0.3 L/min provides a more consistent heat transfer process, minimizing temperature spikes and ensuring efficient energy absorption. Meanwhile, at 0.5 L/min, the inlet temperature rise is the slowest across all power levels as the increased convective flow removes heat more quickly before it can fully transfer to the fluid. This behavior confirms that higher flow rates prevent localized overheating but extend the overall heating duration, leading to lower efficiency. The outlet temperature profiles follow a more stable pattern across all conditions, indicating that as the fluid circulates, the heat transfer process stabilizes, reducing localized overheating effects. When compared to −15 °C conditions, the heating process at −5 °C is notably more stable and efficient, with a faster temperature rise and reduced nucleate boiling effects. The smaller temperature gradient between the heating fluid and the environment results in improved thermal conductivity and lower heat losses, accelerating the heating process. However, the fundamental trend remains unchanged, where 0.22 L/min achieves the fastest heating but introduces instability, 0.3 L/min provides the best trade-off between speed and stability, and 0.5 L/min ensures uniform heating at the cost of longer heating durations.
In Figure 12a, the heat transfer to the liquid is analyzed for different power levels and flow rates, showing that higher induction power leads to greater heat transfer. At lower power levels (150 W and 225 W), heat transfer varies significantly with flow rate, where 0.5 L/min exhibits the highest values, indicating better convective heat absorption. However, at higher power levels (275 W and 400 W), the differences between flow rates become less pronounced, suggesting that as power increases, the effect of flow rate on heat transfer diminishes due to the system reaching its thermal transfer capacity.
It is observed that the heat transfer coefficient increases with both higher flow rates and increased induction power (Figure 12b). The highest heat transfer coefficient, approximately 5557.4 W/m2·K, is recorded at 400 W and 0.5 L/min, indicating that the combination of high power and high flow rate enhances convective heat transfer. The lowest value, 2364.5 W/m2·K, occurs at 150 W and 0.22 L/min, reflecting reduced heat transfer performance under low-power and low-flow conditions. This trend is consistent with fundamental heat transfer principles, as an increased flow velocity improves convective heat transfer by reducing the thermal boundary layer. The Nusselt number graph (Figure 12c) follows a similar pattern, with Nu increasing alongside higher power and flow rates. The maximum Nu value of 85.7 is observed at 400 W and 0.5 L/min, confirming the strong dependence of convective heat transfer efficiency on both power and flow rate. The minimum Nu value, 36.5, is recorded at 150 W and 0.22 L/min, corresponding to the lowest flow rate and power level combination.
Interestingly, the increases in both h and Nu are more pronounced when transitioning from 0.22 L/min to 0.3 L/min than from 0.3 L/min to 0.5 L/min, suggesting diminishing returns in heat transfer improvement at higher flow rates. Additionally, localized turbulence induced by nucleate boiling may contribute to the variations in heat transfer performance, particularly at higher power levels.
In Figure 13a, the heating rate follows a similar trend, increasing with power input while being influenced by flow rate. With an induction power of 150 W, the heating rates remain relatively low, with 0.032 °C/s at 0.22 L/min, 0.031 °C/s at 0.3 L/min, and 0.034 °C/s at 0.5 L/min, suggesting that at lower power levels, the flow rate has minimal impact on heating rate. As the power increases to 225 W and 275 W, the heating rates improve, with 0.22 L/min consistently providing the fastest temperature rise due to prolonged heat interaction. At 400 W, the heating rate reaches 0.087 °C/s at 0.22 L/min, while 0.3 L/min and 0.5 L/min exhibit slightly lower values, at 0.078 °C/s and 0.070 °C/s, respectively. Figure 13b shows the heating efficiency, measured as the ratio of heating rate to power input. At 150 W, the efficiency values are nearly identical across all flow rates (0.0211 °C/s·W), indicating that the flow rate has little effect at lower power levels. As the power increases to 225 W and 275 W, 0.22 L/min achieves the highest efficiency, reaching 0.0247 °C/s·W and 0.0259 °C/s·W, respectively, while 0.3 L/min and 0.5 L/min exhibit slightly lower efficiency values. At 400 W, efficiency declines slightly, with 0.0218 °C/s·W at 0.22 L/min, 0.0195 °C/s·W at 0.3 L/min, and 0.0174 °C/s·W at 0.5 L/min, confirming that as power increases, the system experiences diminishing efficiency returns, likely due to convective heat losses and thermal saturation effects.
Table 4 presents the battery heating times for different flow rates (0.22 L/min, 0.3 L/min, and 0.5 L/min) and induction power levels (150 W, 225 W, 280 W, and 400 W) at −5 °C conditions. The heating rates reveal that heating is faster when reaching 0 °C but slows down significantly as the battery approaches 25 °C. For instance, at 400 W and 0.22 L/min, the heating rate is 0.1064 °C/s when reaching 0 °C, but it declines to 0.0990 °C/s when reaching 25 °C. This trend is consistent across all conditions, indicating that heat transfer is more efficient at lower temperatures, but as the battery warms, additional energy is required to sustain the heating performance due to reduced thermal gradients. Flow rate significantly impacts heating efficiency, with 0.22 L/min achieving the highest heating rates across all power levels. The fastest heating occurs at 400 W, where the battery reaches 0 °C at 0.1064 °C/s and 25 °C at 0.0990 °C/s. However, fluctuations in heating performance due to nucleate boiling effects at high power levels may introduce temperature instabilities. In contrast, 0.3 L/min provides a more balanced approach, maintaining a high heating rate while ensuring greater thermal stability, achieving 0.1087 °C/s to 0 °C and 0.0929 °C/s to 25 °C at 400 W. Meanwhile, 0.5 L/min consistently results in the slowest heating across all conditions, confirming that higher flow rates reduce direct heat absorption by increasing convective losses, leading to a more gradual temperature rise. The effect of the power level is also significant, with higher power levels consistently improving heating performance. At 225 W and 280 W, the heating rates remain high but show a gradual decline in efficiency as the battery warms up, requiring more time to reach the target temperature. At 150 W, the heating rates are the lowest across all conditions, with 0.22 L/min achieving 0.0427 °C/s for 0 °C and 0.0301 °C/s for 25 °C, confirming that low power levels are inefficient for rapid heating applications.
Figure 14 presents the internal resistance variation over time for different induction power levels (150 W, 225 W, 275 W, and 400 W) at constant flow rates (0.22 L/min, 0.3 L/min, and 0.5 L/min) under −5 °C conditions. The results indicate that internal resistance decreases as the battery warms up, with the rate of reduction influenced by both power level and flow rate. With a flow rate of 0.22 L/min, the fastest reduction in internal resistance is observed at 400 W, where resistance declines rapidly within the first few minutes. This is expected, as higher induction power accelerates heating, leading to a faster decrease in internal resistance. However, at lower power levels (150 W and 225 W), the reduction is slower, and resistance remains higher for an extended period, indicating delayed thermal response. At this flow rate, some fluctuations are observed at higher power levels, possibly due to localized nucleate boiling effects, which may introduce instability in heat transfer.

4. Conclusions

This study investigated the performance of an induction-based liquid battery heating system for lithium-ion batteries under extreme-cold conditions (−15 °C and −5 °C). The effects of induction power levels (150 W, 225 W, 275 W, and 400 W) and fluid flow rates (0.22 L/min, 0.3 L/min, and 0.5 L/min) on heat transfer, heating rate, and internal resistance reduction were analyzed. Comparative evaluations between −15 °C and −5 °C conditions were conducted to evaluate how the ambient temperature affects heating efficiency and system stability. The key findings of this study are as follows:
  • Higher induction power resulted in faster heating, with 400 W providing the shortest heating durations across all conditions.
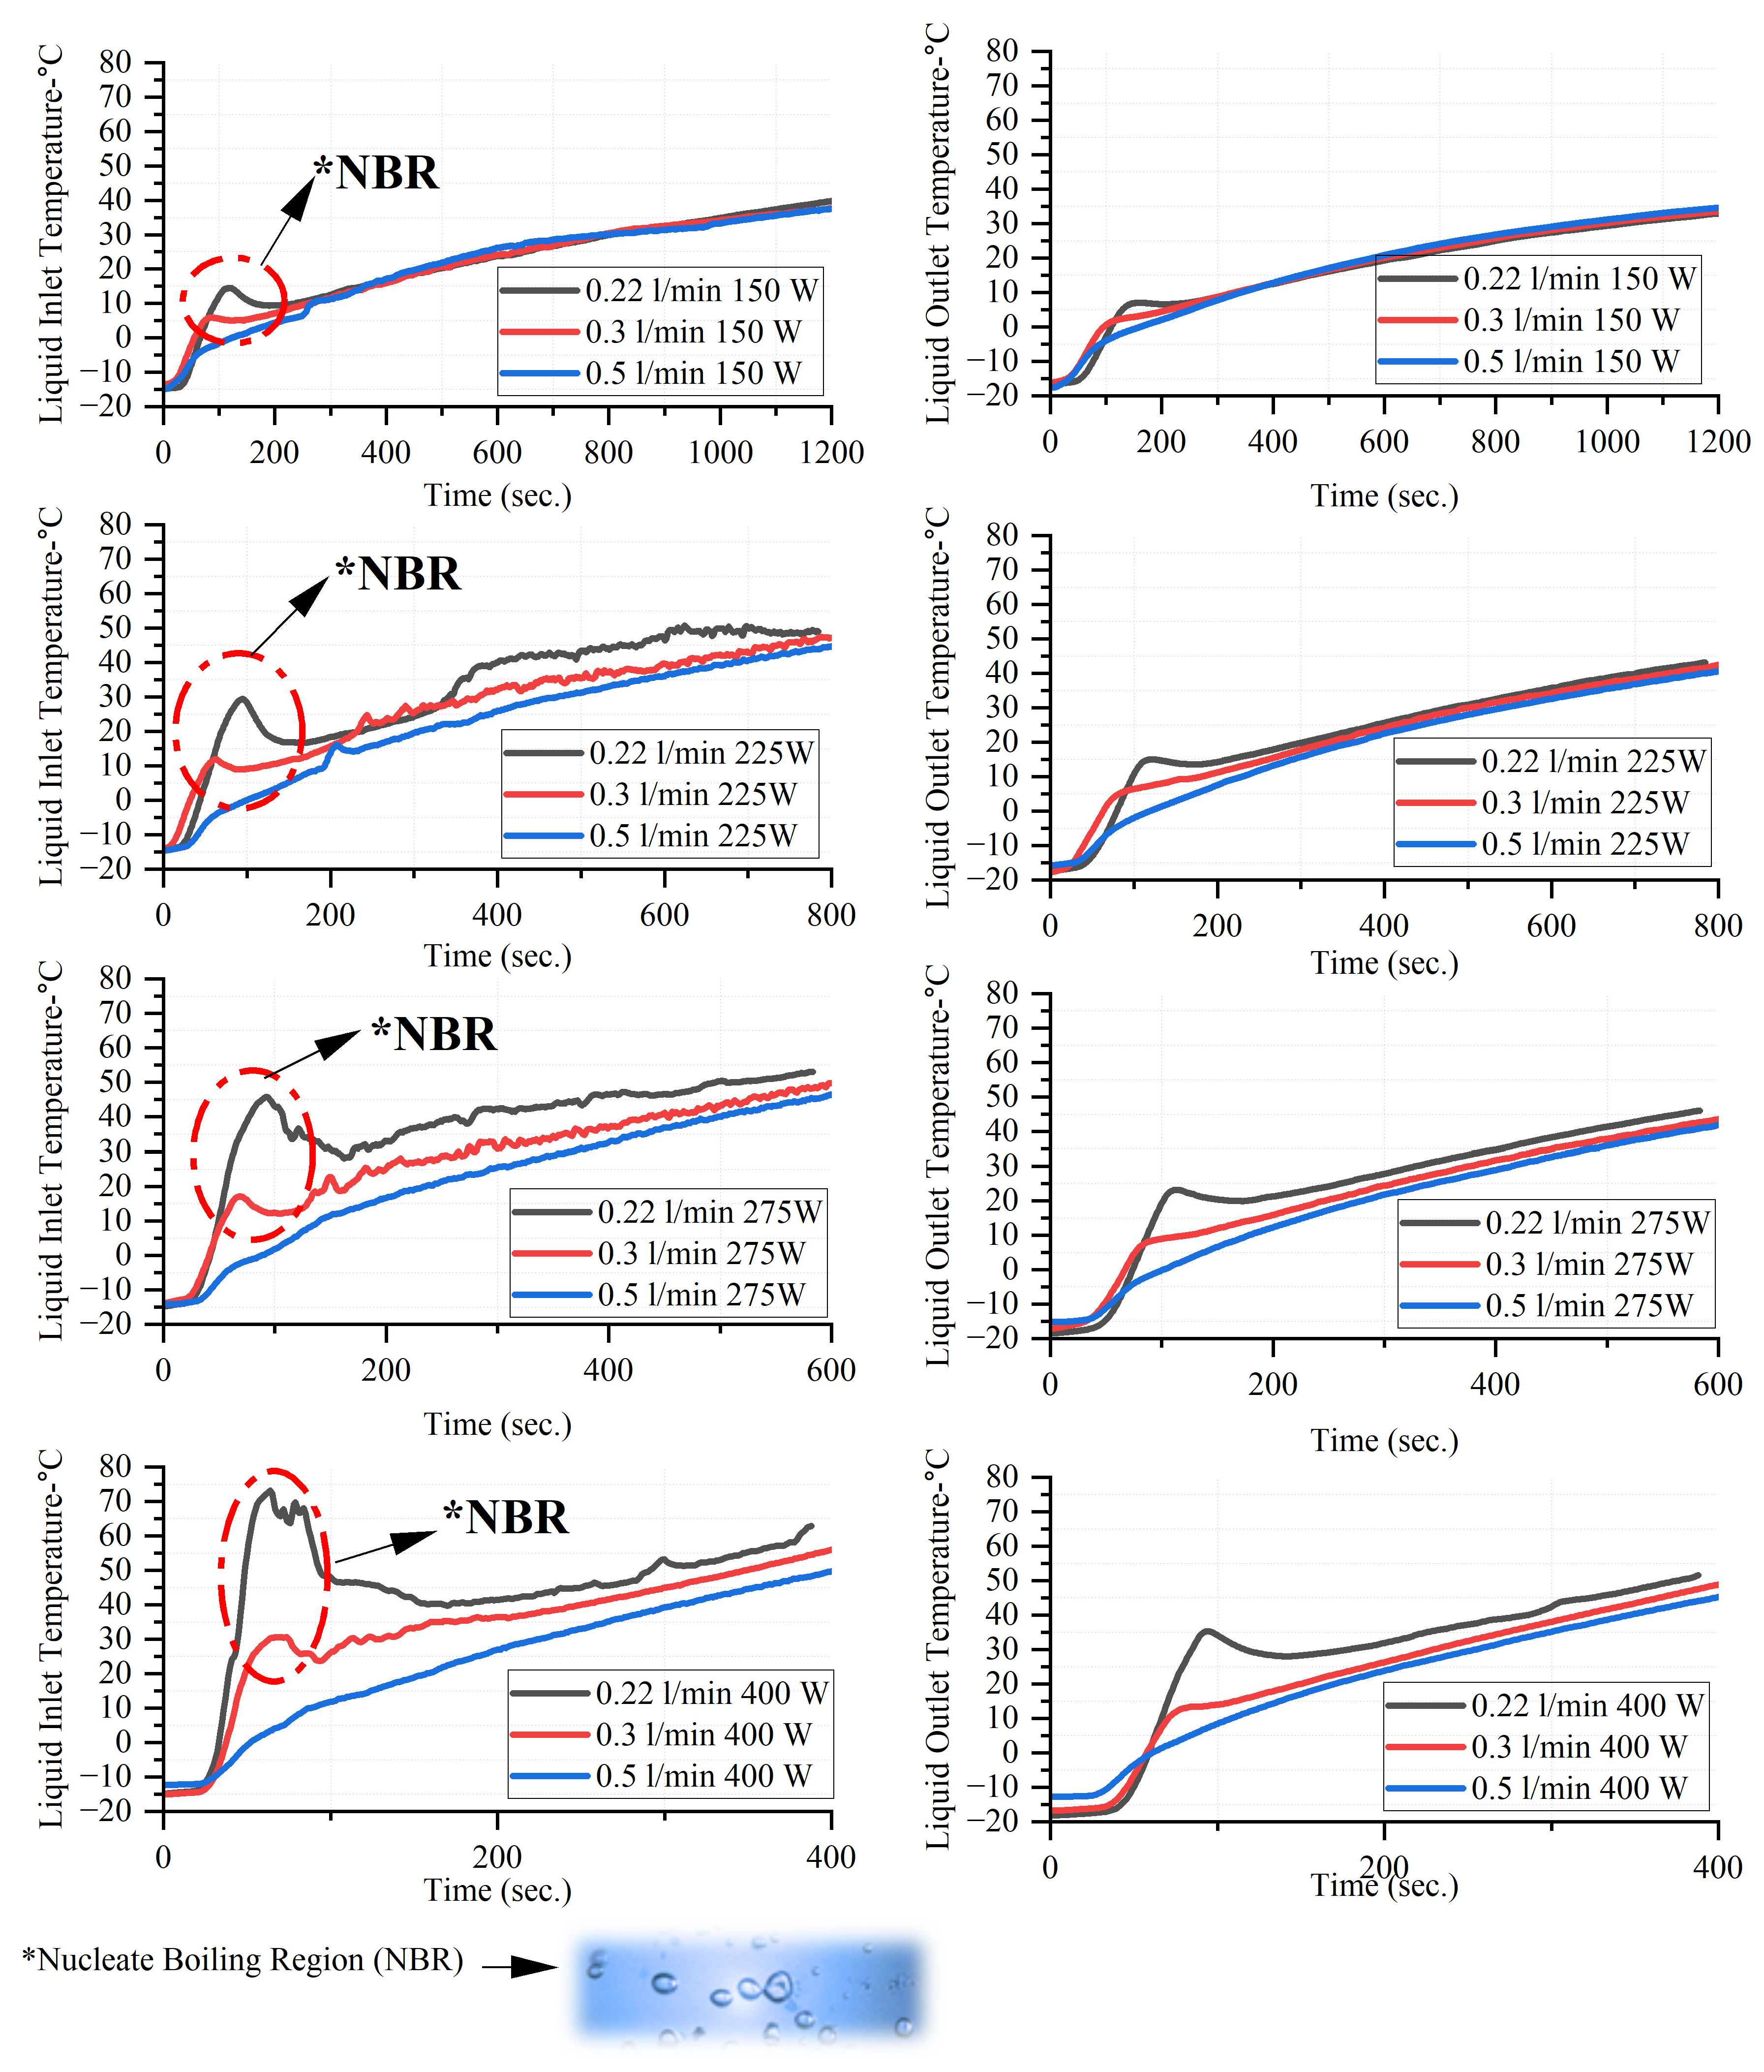
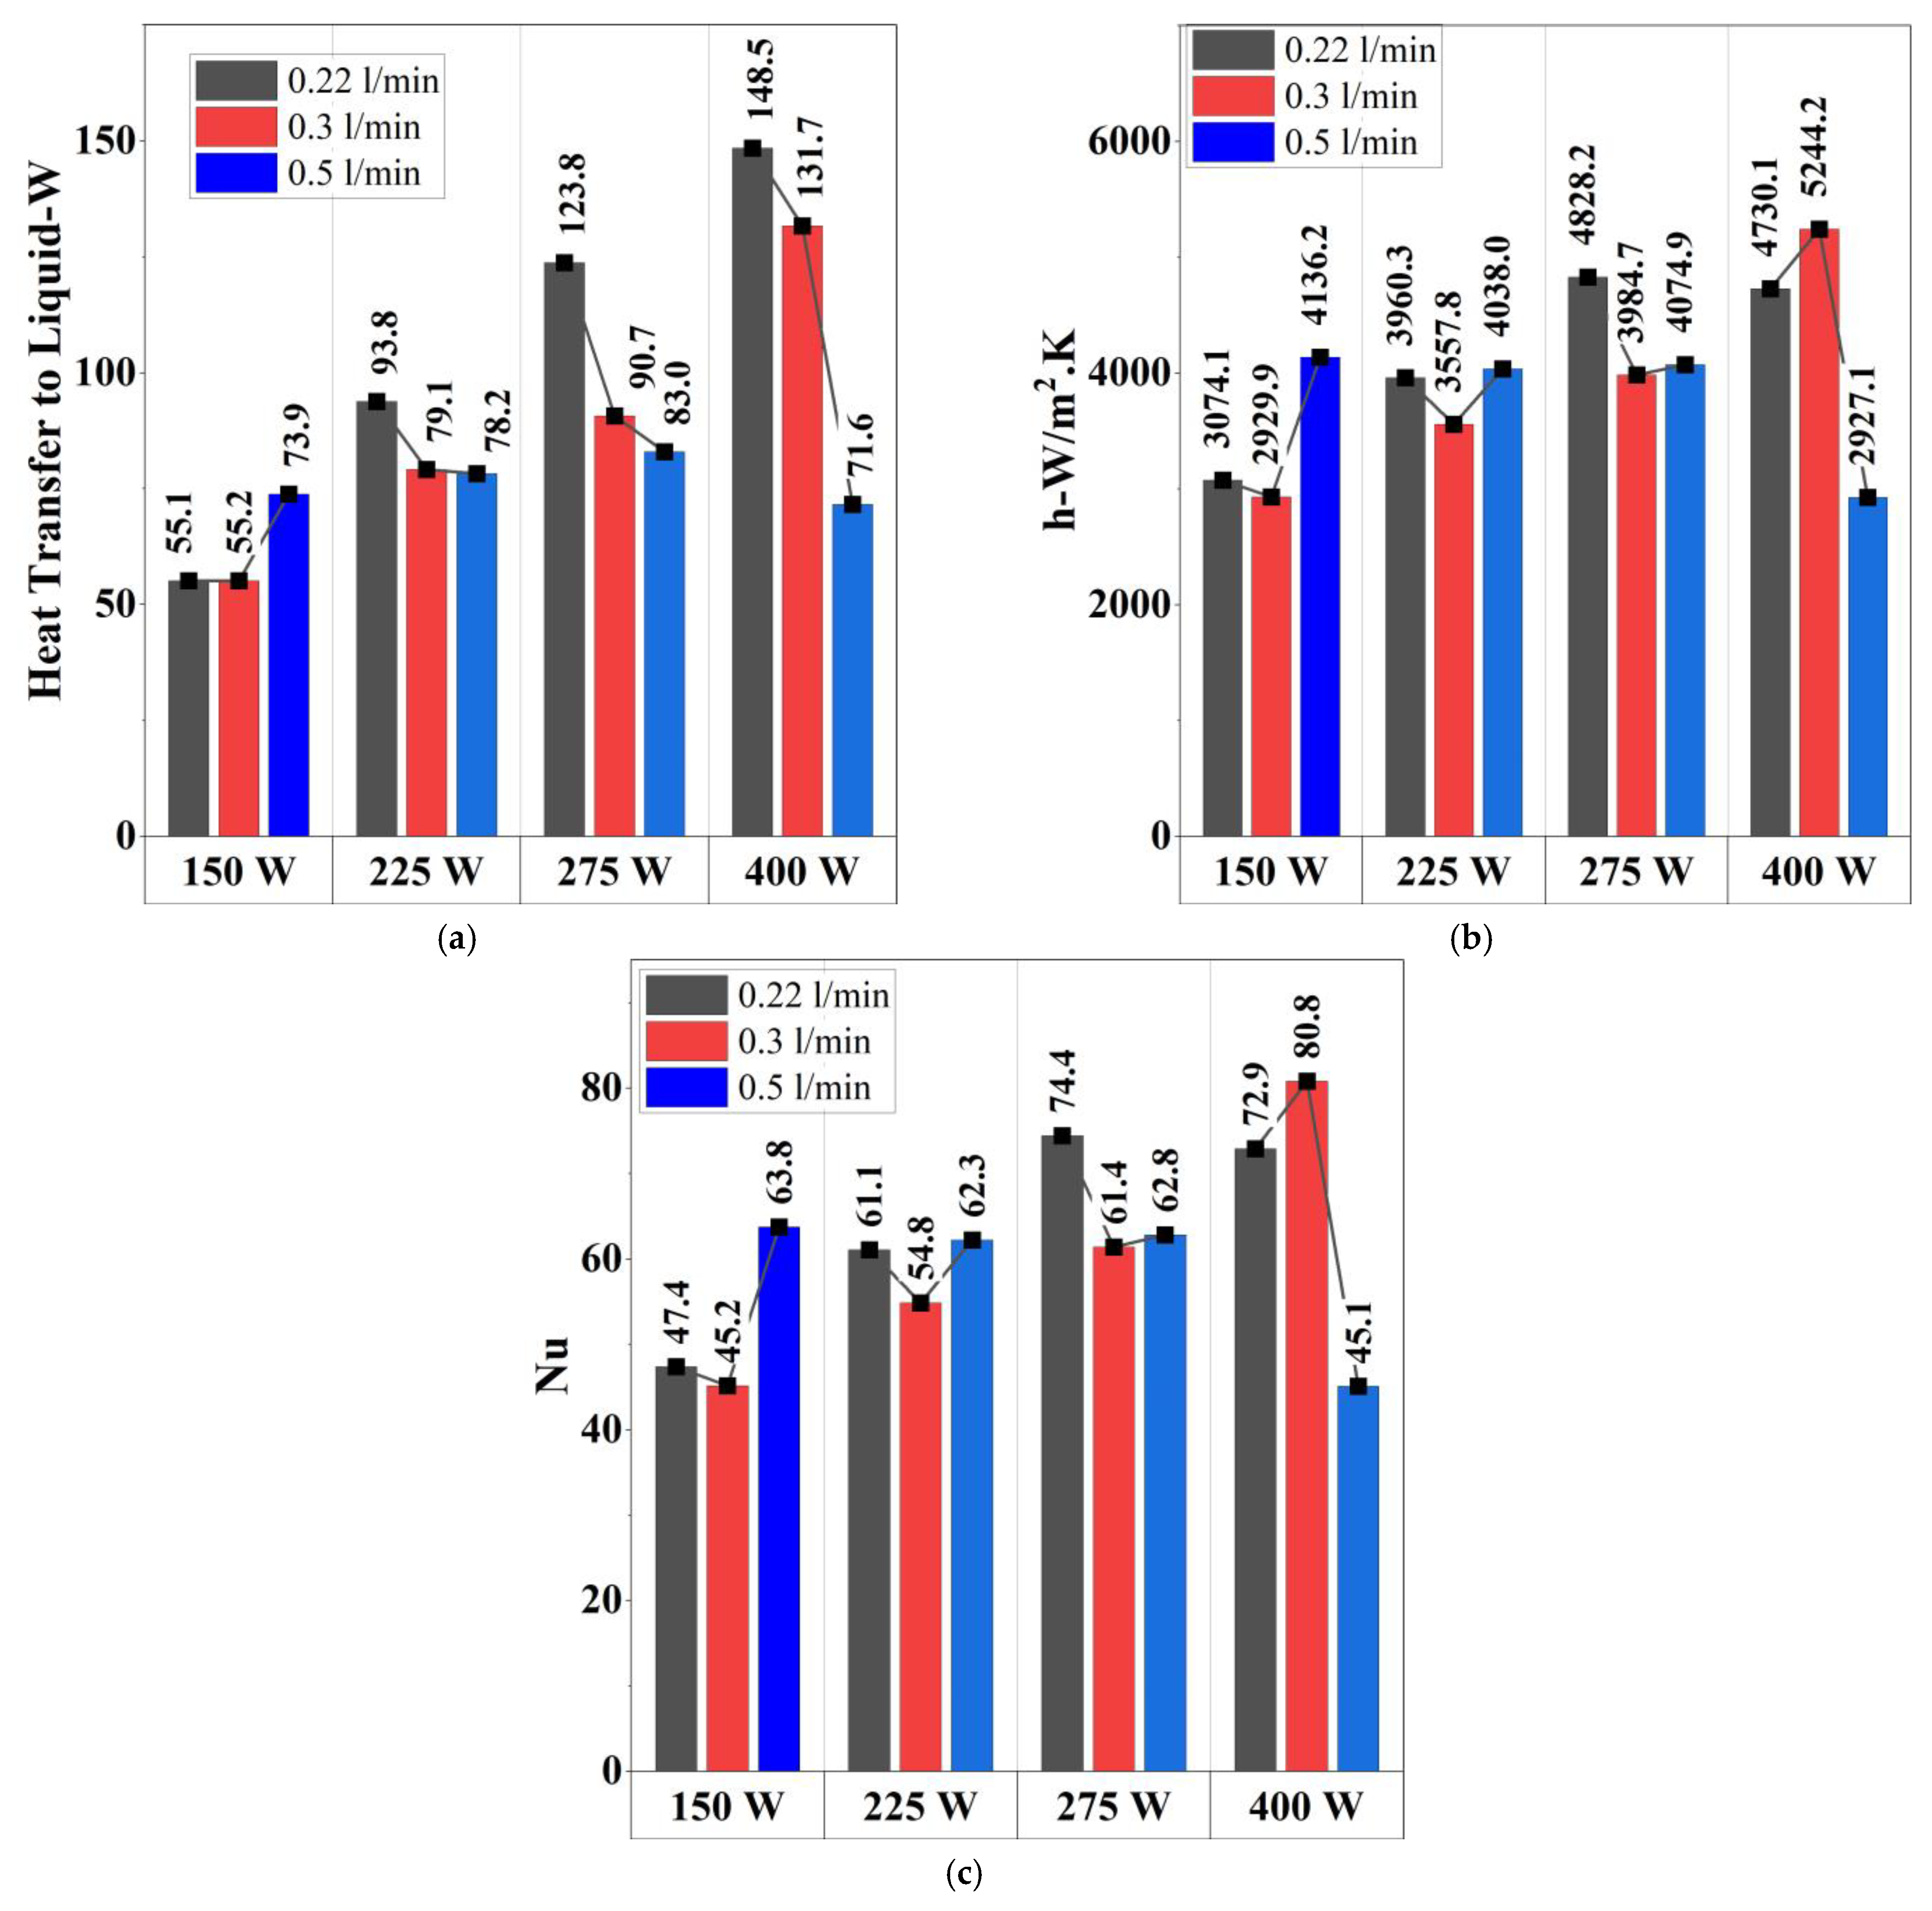
  • The highest heating rates were observed at 0.22 L/min, where longer thermal interaction enhanced heat absorption. However, at higher power levels, localized nucleate boiling effects caused minor temperature fluctuations in this condition.
  • A flow rate of 0.3 L/min provided the most stable and efficient heating, balancing rapid heat absorption and uniform temperature distribution while avoiding boiling-induced fluctuations.
  • Higher flow rates (0.5 L/min) minimized temperature fluctuations but resulted in longer heating times due to increased convective heat dissipation.
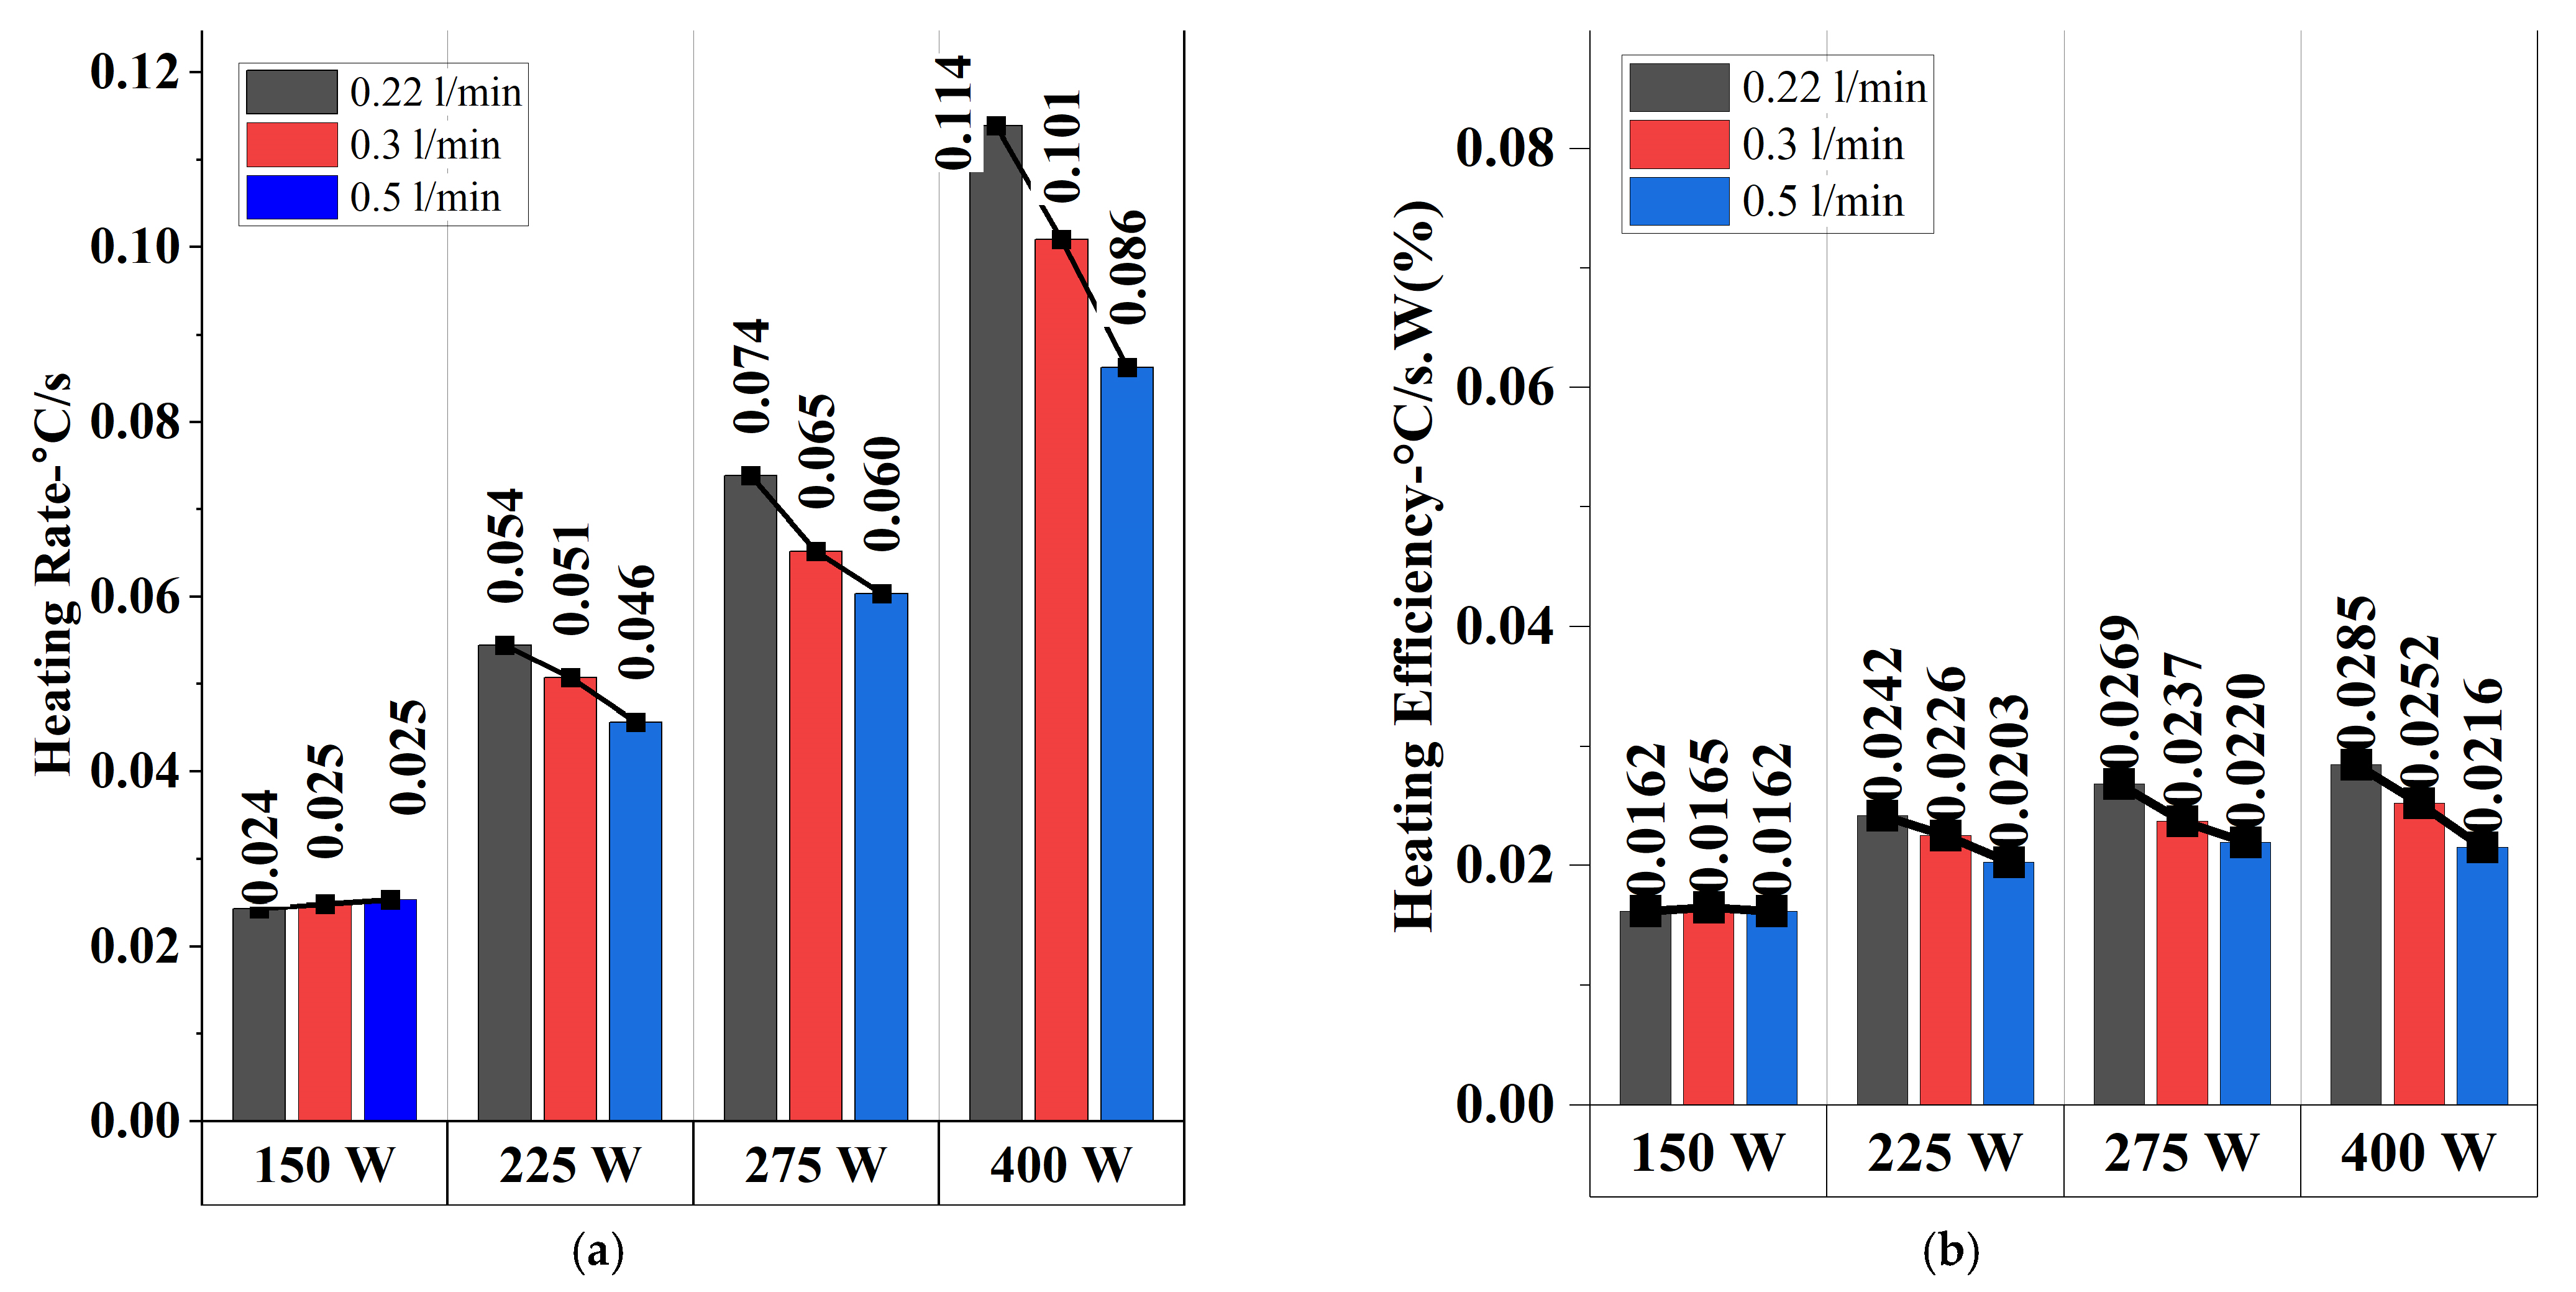
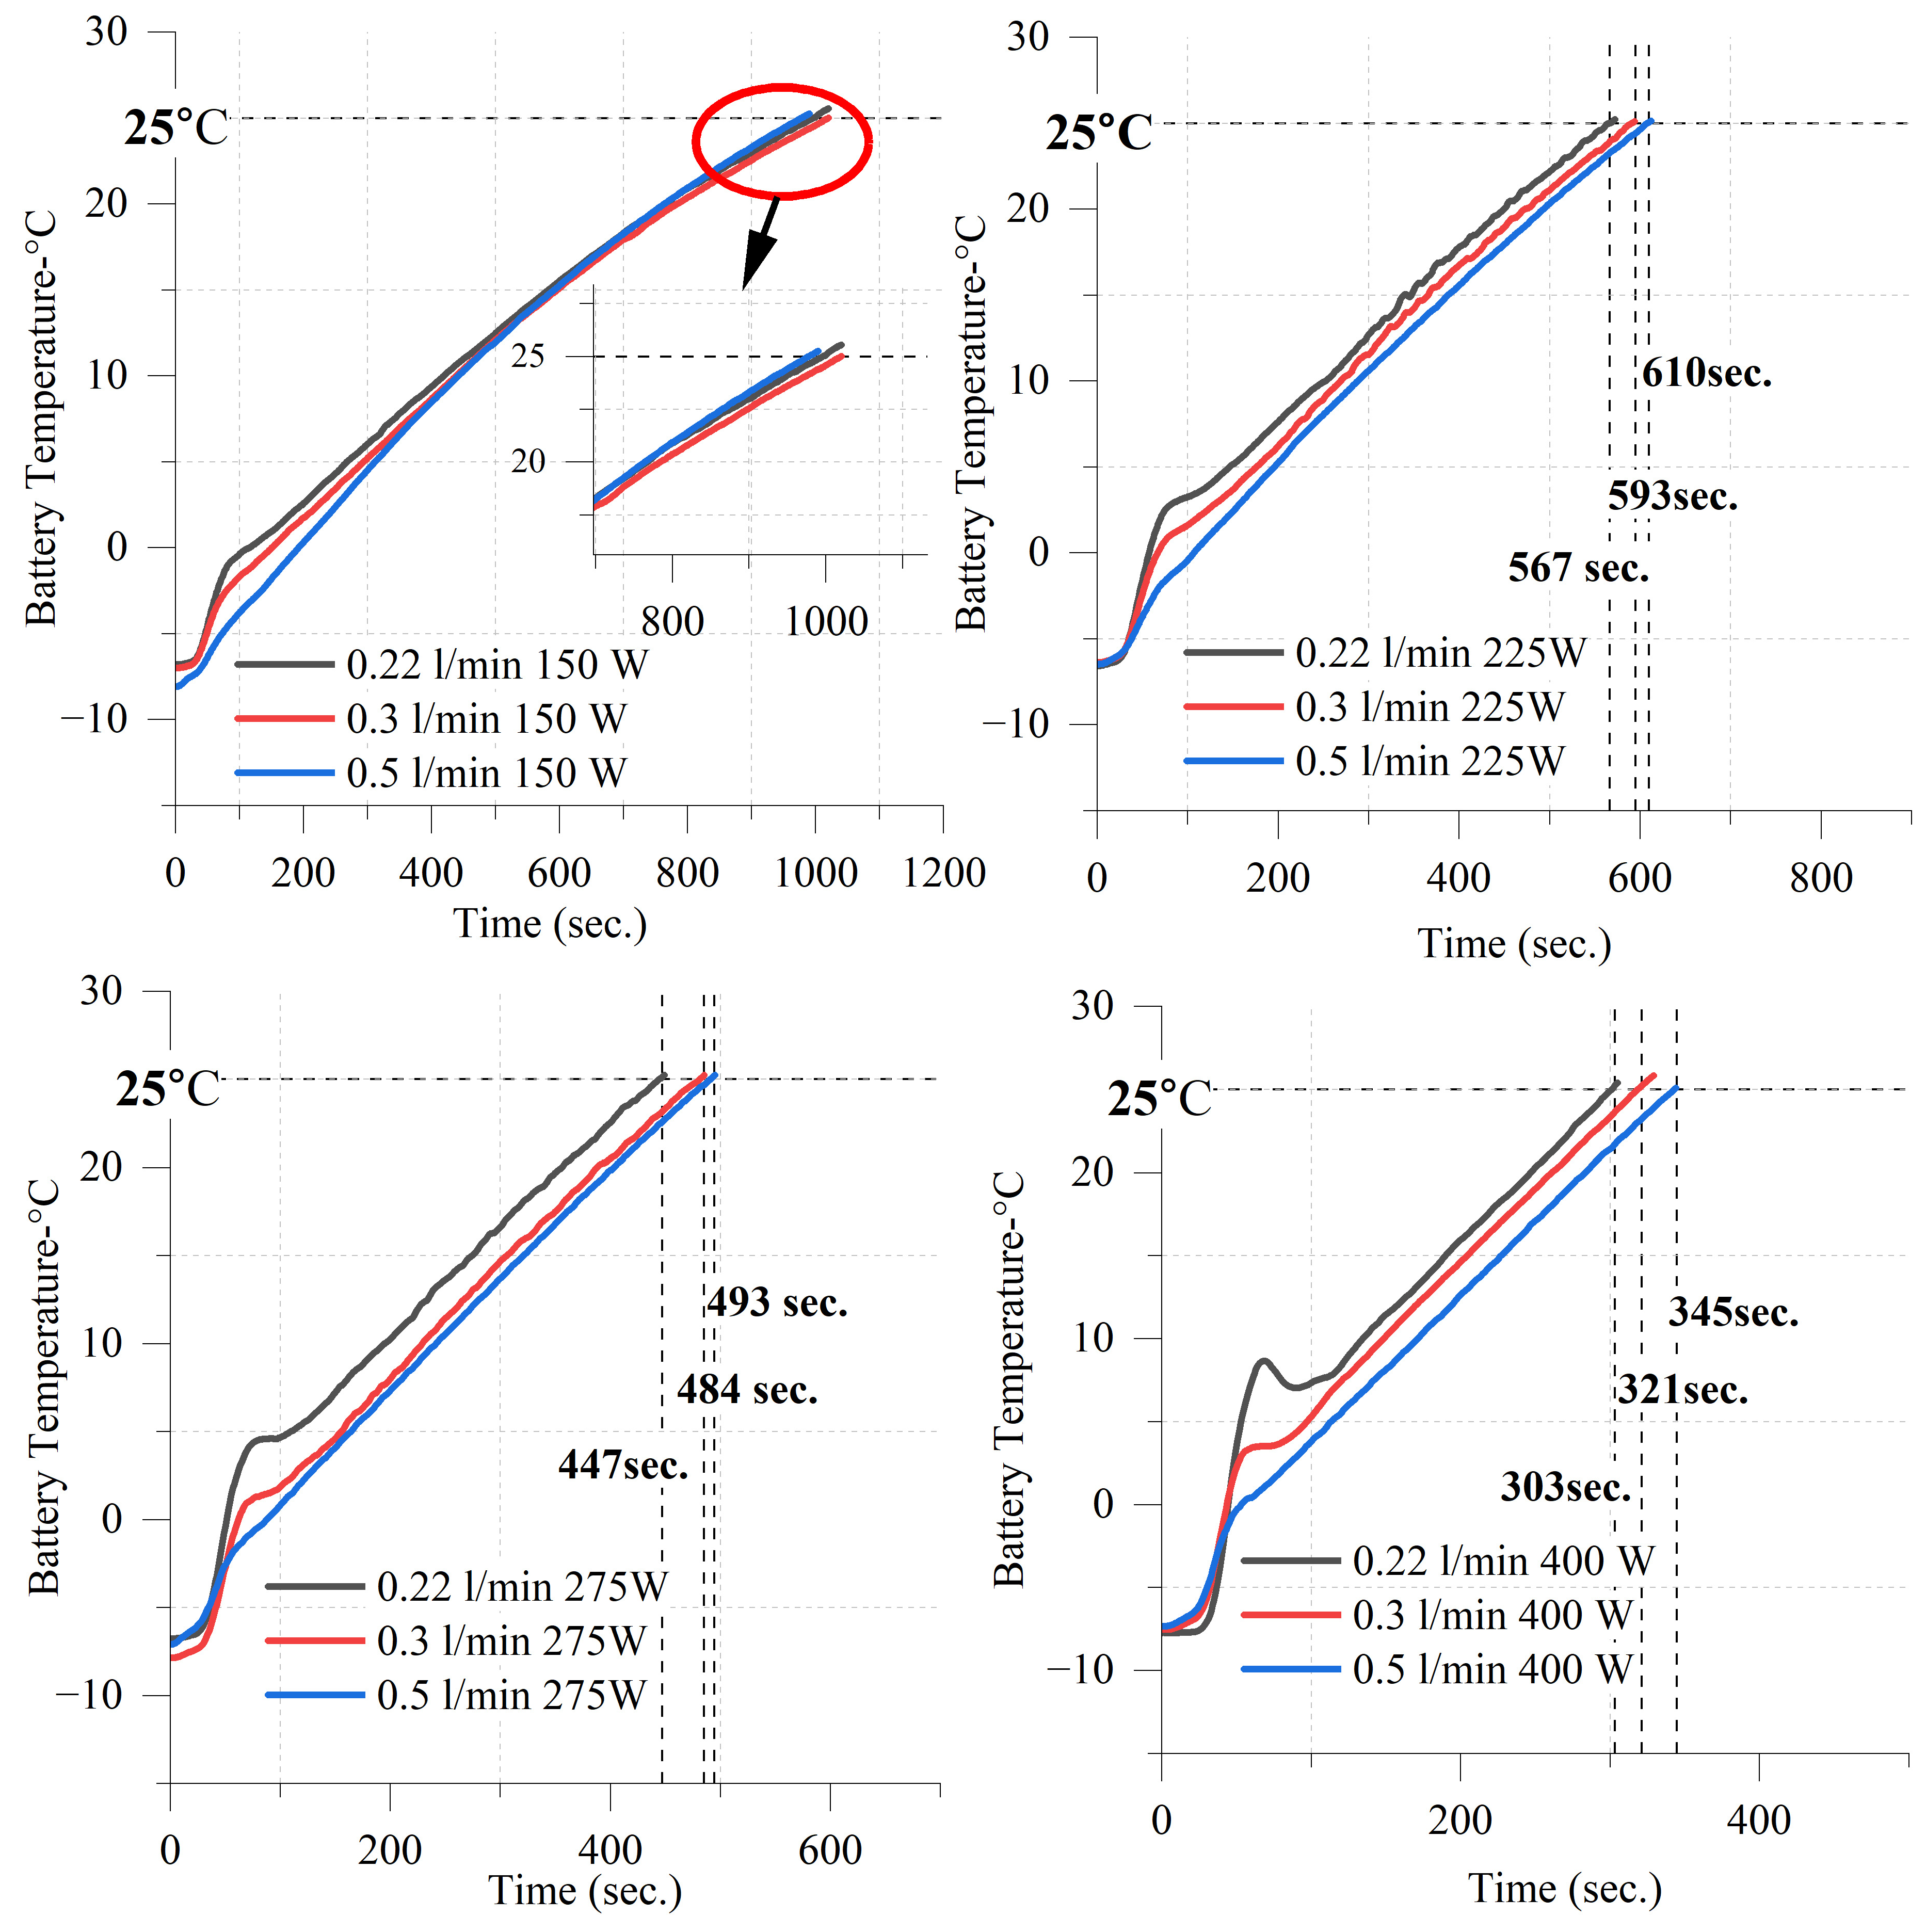
  • At −5 °C, the fastest heating occurred at 400 W and 0.22 L/min, reaching 0 °C in 47 s (0.1064 °C/s) and 25 °C in 303 s (0.0990 °C/s).
  • At −15 °C, the fastest heating was also recorded at 400 W and 0.22 L/min, reaching 0 °C in 55 s (0.2727 °C/s) and 25 °C in 383 s (0.1044 °C/s).
  • The slowest heating occurred at 150 W and 0.5 L/min, where at −5 °C, it required 194 s to reach 0 °C (0.0258 °C/s) and 979 s to reach 25 °C (0.0306 °C/s). Similarly, at −15 °C, 0.5 L/min at 150 W required 149 s to reach 0 °C (0.1007 °C/s) and 463 s to reach 25 °C (0.0864 °C/s).
  • The heating rates declined as the battery temperature increased, demonstrating that thermal resistance rises at higher temperatures.
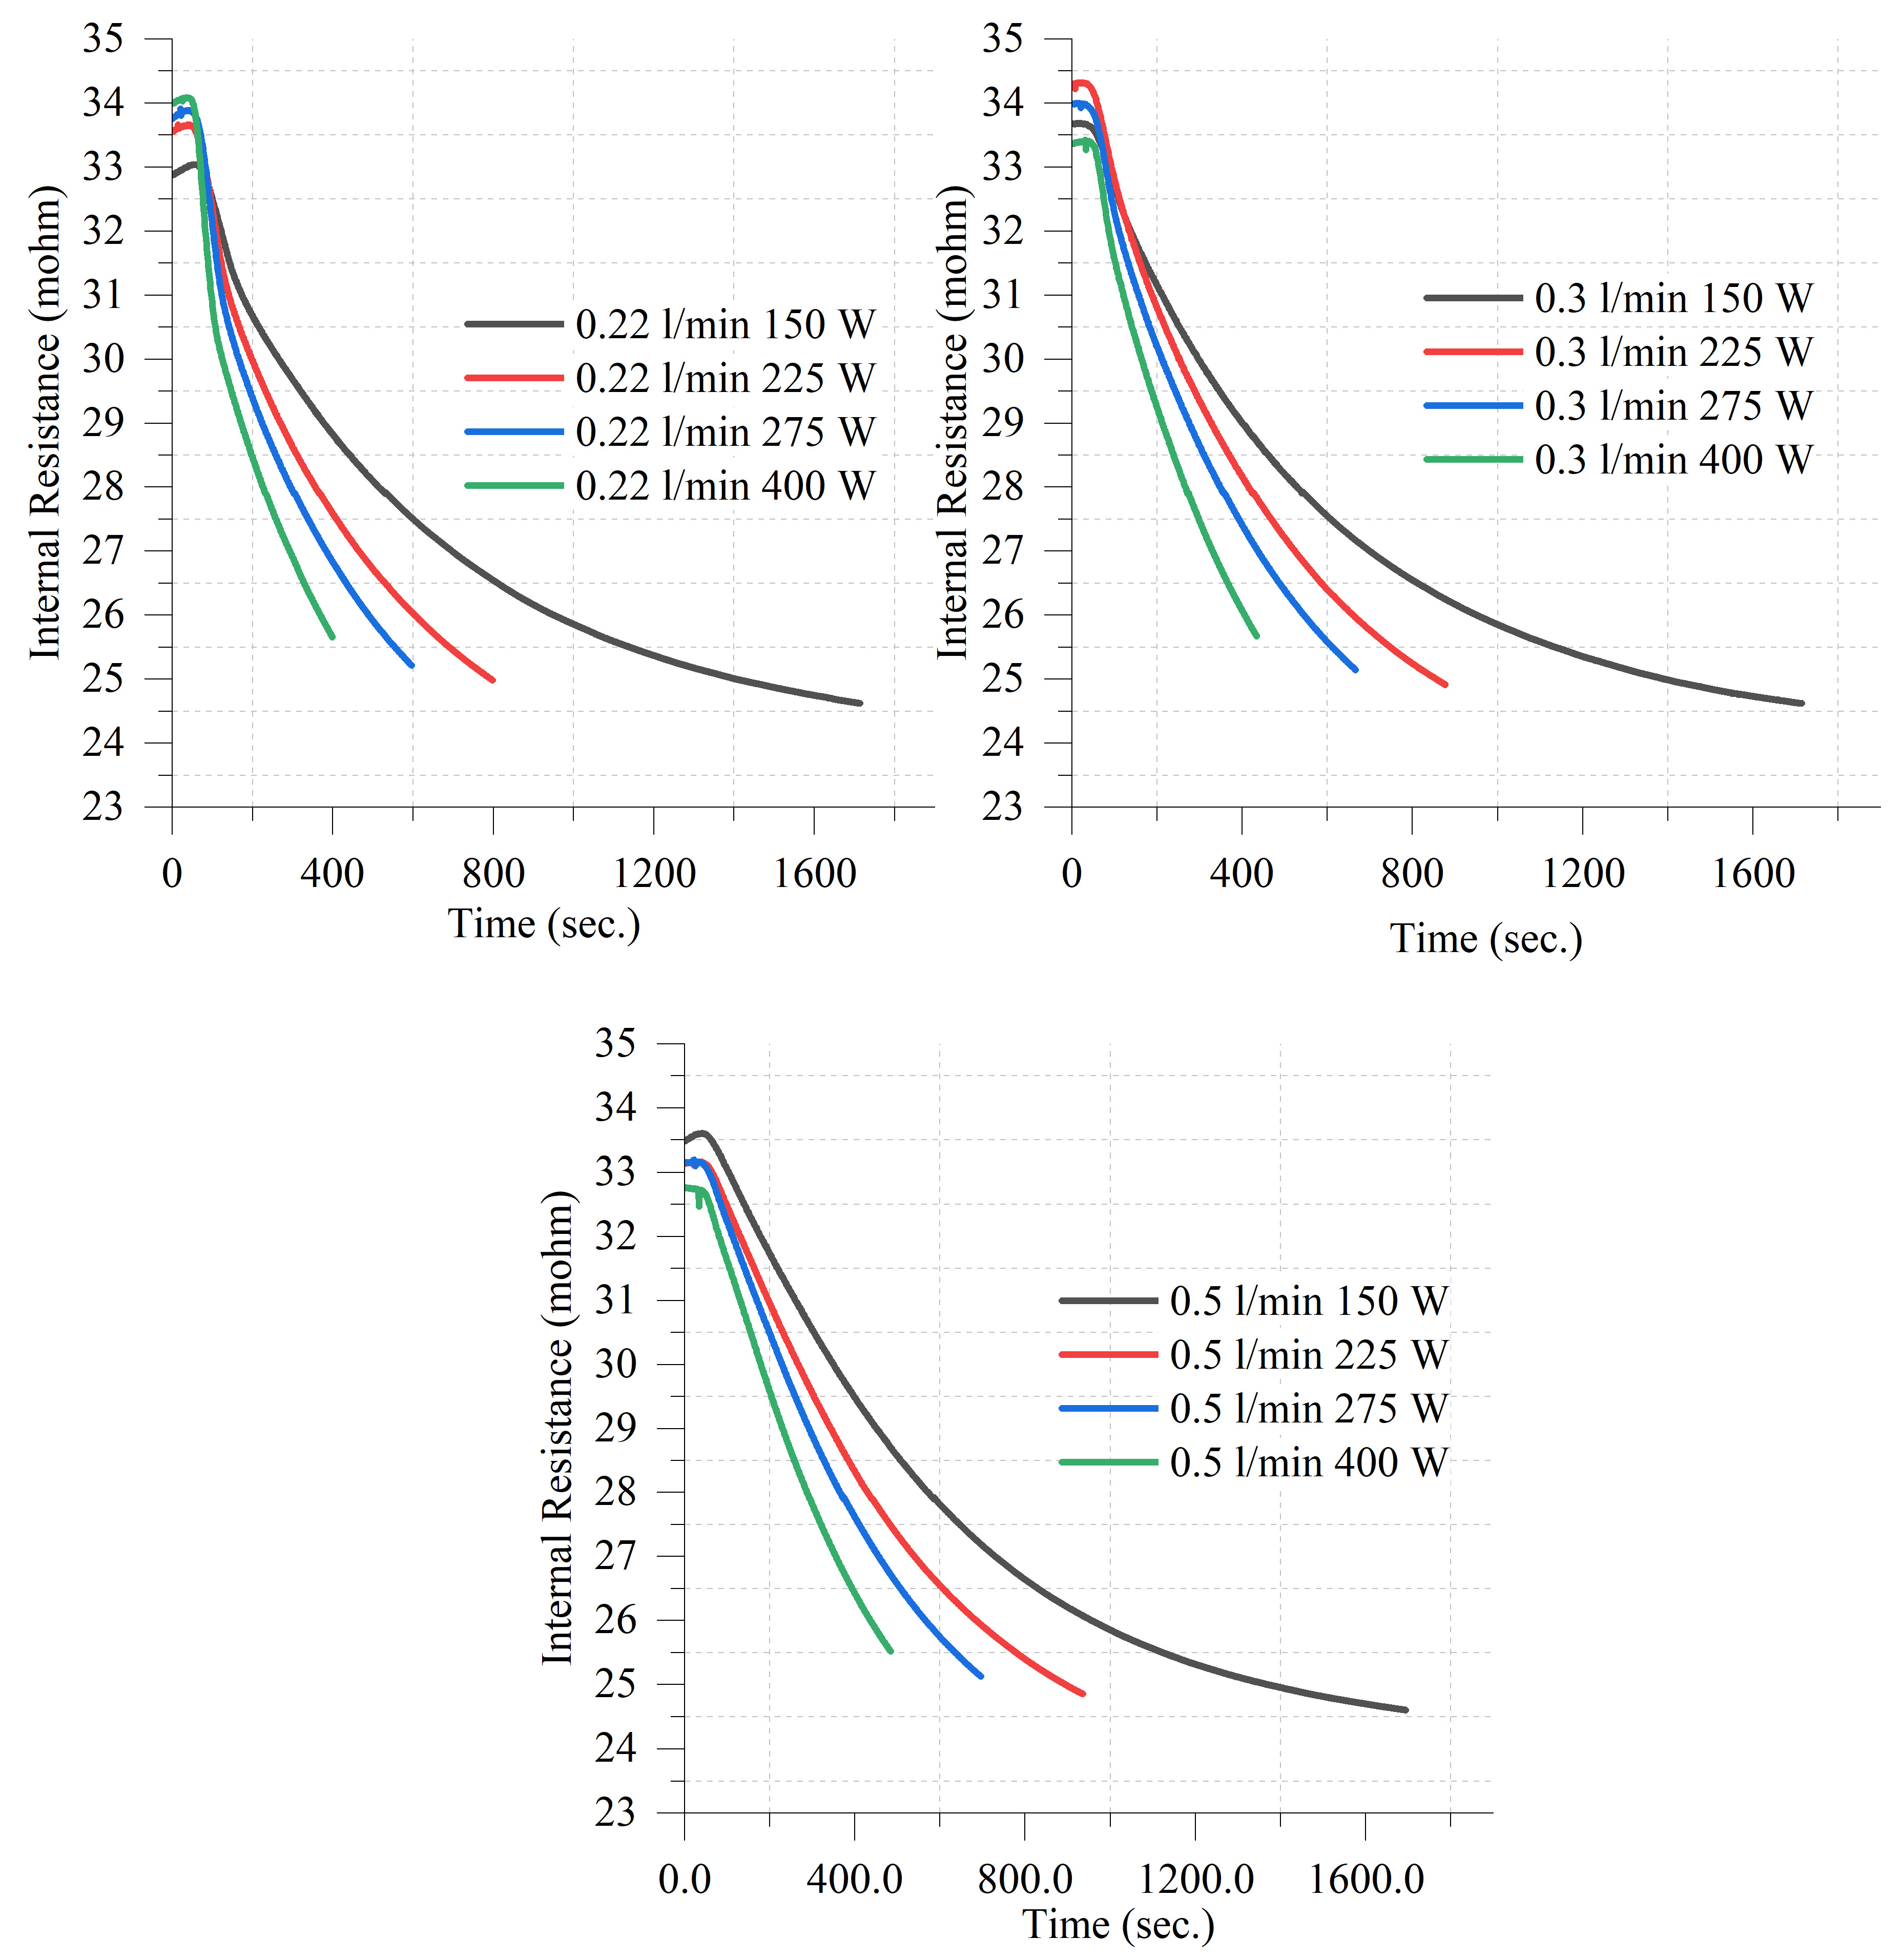
  • Internal resistance decreased as the battery warmed up, validating the importance of preheating for improved battery performance in cold environments.
  • When comparing −5 °C and −15 °C conditions, it was observed that although heating was more energy-efficient at −5 °C, the heating rate to 0 °C was higher at −15 °C due to the larger temperature gradient. For instance, at 400 W and 0.22 L/min, the heating rate to 0 °C was 0.2727 °C/s at −15 °C, whereas it was only 0.1064 °C/s at −5 °C. This suggests that at lower ambient temperatures, the battery heats up more rapidly in the early phase due to the greater temperature difference between the heating fluid and the battery. However, as the battery temperature rises, the rate of heating slows down, and energy efficiency becomes more favorable at −5 °C.
  • Under −15 °C conditions, the fastest heating scenario (0.22 L/min, 400 W) reduced heating time by 344.26% compared to the slowest condition (0.3 L/min, 150 W), while the optimal scenario (0.3 L/min, 400 W) achieved a 308.09% improvement. However, the optimal case exhibited an 8.14% lower heating rate than the fastest condition, emphasizing a balance between rapid heating and thermal stability. In terms of heating efficiency, the optimal condition outperformed the lowest cases (0.22 L/min and 0.5 L/min, 150 W) by 55.56%, while the highest efficiency was observed at 0.22 L/min, 400 W, with a 75.93% improvement over the slowest conditions. Despite this, the optimal scenario’s efficiency remained 11.58% lower than the highest. The results indicate that while the fastest heating and highest efficiency conditions benefit from rapid energy transfer, they also introduce instability due to nucleate boiling. In contrast, the optimal condition ensures a more uniform and stable temperature distribution by mitigating nucleate boiling effects.
  • Under −5 °C conditions, the fastest heating scenario (0.22 L/min, 400 W) achieved a 236.73% improvement in the heating rate compared to the slowest condition (0.3 L/min, 150 W), while the optimal scenario (0.3 L/min, 400 W) showed a 215.99% improvement. However, the heating rate in the optimal scenario was 6.16% lower than the fastest case, highlighting a balance between rapid heating and thermal stability due to nucleate boiling suppression. Although the highest heating efficiency was recorded at 275 W with a 0.22 L/min flow rate, exceeding the optimal condition’s efficiency by 24.71%, its heating rate was significantly lower. This suggests that despite achieving higher efficiency, the slower heating rate performance makes this condition less favorable for applications requiring rapid and uniform temperature increases, reinforcing the suitability of the optimal condition (400 W and 0.3 L/min) as a more practical choice.
  • The optimal condition for effective heating was identified as 400 W and 0.3 L/min, ensuring both rapid heating and thermal stability without the fluctuations observed at 0.22 L/min.
  • The experiments revealed that nucleate boiling occurs when induction power exceeds 275 W at a flow rate of 0.22 L/min, causing intermittent heat transfer disruptions due to vapor bubble formation. This phenomenon leads to local temperature fluctuations and reduced heat transfer efficiency. Such findings are particularly important for battery thermal management systems using induction heating as excessive power input with insufficient flow rates can cause a non-uniform temperature distribution. Therefore, future designs should consider optimizing flow rates based on the applied power level to maintain a stable heating performance without boiling-induced instabilities.
  • The heating profile can be dynamically adjusted to optimize pre-heating performance and minimize the occurrence of nucleate boiling. By initially applying a lower power level and progressively increasing it as the bulk temperature rises, the system can maintain stable heat transfer characteristics. Implementing a feedback control mechanism that monitors real-time temperature variations will enable adaptive power regulation, reducing NBR effects and enhancing heating efficiency in extreme-cold conditions.
Future work should focus on the interaction between flow patterns and induction heating efficiency to identify strategies for minimizing nucleate boiling effects, energy consumption and maximizing heat transfer performance. Furthermore, adaptive control strategies will be developed to dynamically regulate power levels and flow rates based on real-time thermal feedback, enhancing system efficiency. These efforts can be supported considering different ambient temperatures and battery cycling conditions to establish practical applications of this heating system. Also, future works should involve CFD simulations to model the induction heating process in greater detail. These simulations will help optimize key parameters such as the number of copper passes, tube diameter, and coil placement to achieve efficient heating in densely packed battery modules.

Author Contributions

B.S.: Conceptualization, Investigation, Methodology, Writing—Review and editing. A.K.: Investigation, Methodology, Data Curation, Software. All authors have read and agreed to the published version of the manuscript.

Funding

This work has been supported by The Scientific and Technological Research Council of Turkey (TUBITAK, project No. 123M582 and TUBITAK, project No. 224M574).

Data Availability Statement

Data will be made available on request.

Conflicts of Interest

The authors declare no conflicts of interest.

References

  1. IEA. Global EV Outlook 2023, License: CC BY 4.0. Available online: https://www.iea.org/reports/global-ev-outlook-2023 (accessed on 9 March 2025).
  2. Ortiz, Y.; Arévalo, P.; Peña, D.; Jurado, F. Recent Advances in Thermal Management Strategies for Lithium-Ion Batteries: A Comprehensive Review. Batteries 2024, 10, 83. [Google Scholar] [CrossRef]
  3. Li, W.; Zhou, Y.; Zhang, H.; Tang, X. A Review on Battery Thermal Management for New Energy Vehicles. Energies 2023, 16, 4845. [Google Scholar] [CrossRef]
  4. Wang, C.-Y.; Zhang, G.; Ge, S.; Xu, T.; Ji, Y.; Yang, X.-G.; Leng, Y. Lithium-Ion Battery Structure That Self-Heats at Low Temperatures. Nature 2016, 529, 515–518. [Google Scholar] [CrossRef]
  5. News in English. Available online: https://www.newsinenglish.no/2024/01/10/electric-bus-fleet-froze-in-the-cold (accessed on 5 January 2025).
  6. The Independent. Available online: https://www.independent.co.uk/tech/electric-car-snow-cold-weather-tesla-b2481002.html (accessed on 8 January 2025).
  7. Friesen, A.; Horsthemke, F.; Mönnighoff, X.; Brunklaus, G.; Krafft, R.; Börner, M.; Risthaus, T.; Winter, M.; Schappacher, F.M. Impact of Cycling at Low Temperatures on the Safety Behavior of 18650-Type Lithium Ion Cells: Combined Study of Mechanical and Thermal Abuse Testing Accompanied by Post-Mortem Analysis. J. Power Sources 2016, 334, 1–11. [Google Scholar] [CrossRef]
  8. Lin, H.-P.; Chua, D.; Salomon, M.; Shiao, H.-C.; Hendrickson, M.; Plichta, E.; Slane, S. Low-Temperature Behavior of Li-Ion Cells. Electrochem. Solid-State Lett. 2001, 4, A71–A73. [Google Scholar] [CrossRef]
  9. Nagasubramanian, G. Electrical Characteristics of 18650 Li-Ion Cells at Low Temperatures. J. Appl. Electrochem. 2001, 31, 99–104. [Google Scholar] [CrossRef]
  10. Ouyang, M.; Chu, Z.; Lu, L.; Li, J.; Han, X.; Feng, X.; Liu, G. Low Temperature Aging Mechanism Identification and Lithium Deposition in a Large Format Lithium Iron Phosphate Battery for Different Charge Profiles. J. Power Sources 2015, 286, 309–320. [Google Scholar] [CrossRef]
  11. Zhang, C.-W.; Xu, K.-J.; Li, L.-Y.; Yang, M.-Z.; Gao, H.-B.; Chen, S.-R. Study on a Battery Thermal Management System Based on a Thermoelectric Effect. Energies 2018, 11, 279. [Google Scholar] [CrossRef]
  12. Lyu, Y.; Siddique, A.R.M.; Majid, S.H.; Biglarbegian, M.; Gadsden, S.A.; Mahmud, S. Electric Vehicle Battery Thermal Management System with Thermoelectric Cooling. Energy Rep. 2019, 5, 822–827. [Google Scholar] [CrossRef]
  13. Lucía, O.; Maussion, P.; Dede, E.J.; Burdío, J.M. Induction Heating Technology and Its Applications: Past Developments, Current Technology, and Future Challenges. IEEE Trans. Ind. Electron. 2014, 61, 2509–2520. [Google Scholar] [CrossRef]
  14. Wu, X.; Chen, Z.; Wang, Z. Analysis of Low Temperature Preheating Effect Based on Battery Temperature-Rise Model. Energies 2017, 10, 1121. [Google Scholar] [CrossRef]
  15. Zhang, C.; Jin, X.; Li, J. PTC Self-Heating Experiments and Thermal Modeling of Lithium-Ion Battery Pack in Electric Vehicles. Energies 2017, 10, 572. [Google Scholar] [CrossRef]
  16. Zhu, T.; Min, H.; Yu, Y.; Zhao, Z.; Xu, T.; Chen, Y.; Li, X.; Zhang, C. An Optimized Energy Management Strategy for Preheating Vehicle-Mounted Li-Ion Batteries at Subzero Temperatures. Energies 2017, 10, 243. [Google Scholar] [CrossRef]
  17. Kamble, P. Battery Thermal Management System. Int. J. Eng. Res. 2020, 9, 216–220. [Google Scholar] [CrossRef]
  18. Ji, Y.; Wang, C.Y. Heating Strategies for Li-Ion Batteries Operated from Subzero Temperatures. Electrochim. Acta 2013, 107, 664–674. [Google Scholar] [CrossRef]
  19. Raza, W.; Ko, G.S.; Park, Y.C. Induction Heater Based Battery Thermal Management System for Electric Vehicles. Energies 2020, 13, 5711. [Google Scholar] [CrossRef]
  20. Wang, B.; Yan, M. Research on the Improvement of Lithium-Ion Battery Performance at Low Temperatures Based on Electromagnetic Induction Heating Technology. Energies 2023, 16, 7780. [Google Scholar] [CrossRef]
  21. Wang, L. Design of Electric Air-Heated Box for Batteries in Electric Vehicles. Chin. J. Power Sources 2013, 37, 1184–1187. [Google Scholar]
  22. Luo, M.; Song, J.; Ling, Z.; Zhang, Z.; Fang, X. Phase Change Material Coat for Battery Thermal Management with Integrated Rapid Heating and Cooling Functions from −40 °C to 50 °C. Mater. Today Energy 2021, 20, 100652. [Google Scholar] [CrossRef]
  23. Song, W.; Bai, F.; Chen, M.; Lin, S.; Feng, Z.; Li, Y. Thermal Management of Standby Battery for Outdoor Base Station Based on the Semiconductor Thermoelectric Device and Phase Change Materials. Appl. Therm. Eng. 2018, 137, 203–217. [Google Scholar] [CrossRef]
  24. Jaffal, H.M.; Mahmoud, N.S.; Imran, A.A.; Hasan, A. Performance Enhancement of a Novel Serpentine Channel Cooled Plate Used for Cooling of Li-Ion Battery Module. Int. J. Therm. Sci. 2023, 184, 107955. [Google Scholar] [CrossRef]
  25. Wang, J.; Lv, D.; Sha, H.; Lai, C.; Zeng, J.; Gao, T.; Yang, H.; Wu, H.; Jiang, Y. Numerical Investigation on the Thermal Performance of a Battery Pack by Adding Ribs in Cooling Channels. Energies 2024, 17, 4451. [Google Scholar] [CrossRef]
Figure 1. Experimental arrangement for battery performance testing under climate-controlled conditions.
Batteries 11 00105 g001
Figure 2. Illustration of the induction-liquid based battery heating system: (a) schematic view, (b) real view inside the climate chamber.
Batteries 11 00105 g002
Figure 3. Battery cell temperatures at different flow rates for constant induction powers; 150 W, 225 W, 275 W, 400 W at −15 °C conditions.
Batteries 11 00105 g003
Figure 4. Battery cell temperatures at different induction powers for constant flow rates; 0.22 L/min, 0.3 L/min, 0.5 L/min at −15 °C conditions.
Batteries 11 00105 g004
Figure 5. Liquid inlet and outlet temperatures at different flow rates for different induction powers at −15 °C conditions.
Batteries 11 00105 g005
Figure 6. Heat transfer to liquid (a), heat transfer coefficient (b) and Nu number (c) at different flow rates for different induction powers at −15 °C conditions.
Batteries 11 00105 g006
Figure 7. Heating rate (a) and heating efficiency (b) up to the value of 25 °C at different flow rates for different induction powers at −15 °C conditions.
Batteries 11 00105 g007
Figure 8. Internal resistance values at different induction powers for constant flow rates; 0.22 L/min, 0.3 L/min, 0.5 L/min at −15 °C conditions.
Batteries 11 00105 g008
Figure 9. Battery cell temperatures at different flow rates for constant induction powers; 150 W, 225 W, 275 W, 400 W at −5 °C conditions.
Batteries 11 00105 g009
Figure 10. Battery cell temperatures at different induction powers for constant flow rates; 0.22 L/min, 0.3 L/min, 0.5 L/min at −5 °C conditions.
Batteries 11 00105 g010
Figure 11. Liquid inlet and outlet temperatures at different flow rates for different induction powers at −5 °C conditions.
Batteries 11 00105 g011
Figure 12. Heat transfer to liquid (a), heat transfer coefficient (b) and Nu number (c) at different flow rates for different induction powers at −5 °C conditions.
Batteries 11 00105 g012
Figure 13. Heating rate (a) and heating efficiency (b) up to 25 °C at different flow rates for different induction powers at −5 °C conditions.
Batteries 11 00105 g013
Figure 14. Internal resistance values at different induction powers for constant flow rates; 0.22 L/min, 0.3 L/min, 0.5 L/min at −5 °C conditions.
Batteries 11 00105 g014
Table 1. Summary of battery-heating methods and their key findings.
StudyMethodKey Findings
Wu et al. [14]Self-heating in Li-ion batteriesAt 2C discharge, temp rose from −10 °C to 5 °C in 280 s, consuming <15% of capacity; at 1C, heating took >1080 s, consuming ~30%.
Zhang et al. [15]External power and PTC self-heatingExternal power heating achieved 0.629 °C/min; PTC self-heating: 0.459 °C/min at SOC 100%, 0.270 °C/min at SOC 60%.
Zhu et al. [16]PTC heaters integrated with liquid heatingPreheating needs to decrease due to self-heating during operation.
Kamble et al. [17]Resistance heating reliabilityReliable across extreme temperatures (−50 °C to +50 °C).
Ji et al. [18]Comparison of various heating strategiesConvective heating was fastest; mutual pulse heating minimized capacity loss; AC heating ensured uniform temperature distribution.
Raza et al. [19]Induction heating systemFast heating at −20 °C with 6 kW heater; max heat transfer rate 0.0661 °C/s.
Wang and Yan [20]Induction heating systemIncreased temp from −30 °C to +20 °C in <6 min; reduced internal resistance; doubled usable energy and power.
Lifang [21]Electric air-heated box11 heating wires raised air temp from 20 °C to 90 °C in 8 min; heated battery pack from −15 °C to 0 °C in 21 min.
Luo et al. [22]Hybrid Joule heating and PCMHybrid system maintained stable battery temp, improved safety.
Song et al. [23]Thermoelectric + PCM systemThermoelectric devices + PCM enhanced temp uniformity, extended battery life in cold climates.
Table 2. Matrix of experimental parameters.
CaseAmbient
Temperature (°C)
Flow Rate (L/min)Induction Heating
Power (W)
1−15.00.22150.0
2−15.00.22225.0
3−15.00.22275.0
4−15.00.22400.0
5−15.00.3150.0
6−15.00.3225.0
7−15.00.3275.0
8−15.00.3400.0
9−15.00.5150.0
10−15.00.5225.0
11−15.00.5275.0
12−15.00.5400.0
13−5.00.22150.0
14−5.00.22225.0
15−5.00.22275.0
16−5.00.22400.0
17−5.00.3150.0
18−5.00.3225.0
19−5.00.3275.0
20−5.00.3400.0
21−5.00.5150.0
22−5.00.5225.0
23−5.00.5275.0
24−5.00.5400.0
Table 3. Battery temperature reaching times for different experiments at −15 °C conditions.
ConditionsBattery Temperatures and Reaching Times (s)Heating Rate to (°C/s)
−10 °C−5 °C0 °C5 °C10 °C15 °C20 °C25 °C0 °C25 °C
0.22 L/min—150 W78116339507693916122716960.04420.0236
0.3 L/min—150 W71220364522703923122016990.04120.0235
0.5 L/min—150 W133265404550716920119216550.03710.0242
0.22 L/min—225 W5975972964065206387780.15460.0514
0.3 L/min—225 W481402513514545666988390.05980.0477
0.5 L/min—225 W811822833794846047378950.05300.0447
0.22 L/min—280 W586676953093974825800.19740.0690
0.3 L/min—280 W53681972813644525486510.07610.0614
0.5 L/min—280 W671532323123974815786850.06470.0584
0.22 L/min—400 W46515559652653253830.27270.1044
0.3 L/min—400 W4653661862423013604170.22730.0959
0.5 L/min—400 W42941492072693303954630.10070.0864
Table 4. Battery temperature-reaching times and heating rates for different conditions at −5 °C experiments.
ConditionsBattery Temperatures and Reaching Times (s)Heating Rate to (°C/s)
0 °C5 °C10 °C15 °C20 °C25 °C0 °C25 °C
0.22 L/min—150 W1172704215857699970.04270.0301
0.3 L/min—150 W15229644159878510220.03290.0294
0.5 L/min—150 W1943144445947669790.02580.0306
0.22 L/min—225 W601492543414525670.08330.0529
0.3 L/min—225 W691782713684745930.07250.0506
0.5 L/min—225 W1091982903904966100.04590.0492
0.22 L/min—280 W531111972763584470.09430.0671
0.3 L/min—280 W641572313083904840.07810.0620
0.5 L/min—280 W901662443234064930.05560.0609
0.22 L/min—400 W47551371922493030.10640.0990
0.3 L/min—400 W46991512072633210.10870.0929
0.5 L/min—400 W561161742292863450.08930.0870
Disclaimer/Publisher’s Note: The statements, opinions and data contained in all publications are solely those of the individual author(s) and contributor(s) and not of MDPI and/or the editor(s). MDPI and/or the editor(s) disclaim responsibility for any injury to people or property resulting from any ideas, methods, instructions or products referred to in the content.

