1. Introduction
Lithium-ion batteries (LIBs) have revolutionized modern life, especially in portable devices and electric cars. Their ability to store energy relies on reversible electrochemical reactions occurring between the active materials stored in two composite electrodes separated by an ionically conductive layer.
Among the active materials for LIB cathodes, nickel-manganese-cobalt and nickel-cobalt-aluminum cathodes dominate in various applications. They have a layered structure reminiscent of the α-NaFeO
2 type that is assigned to the R3
−m space group [
1,
2]. Lithium transition metal oxides (LiMO
2), in which M represents metals such as nickel (Ni),cobalt (Co), manganese (Mn), and aluminum (Al), can be synthesized with either polycrystalline (PC) or single-crystalline (SC) morphology. Various compositions have been explored over the years, with a recent focus on Ni-rich materials.
Enhancing the performance and energy density of lithium-ion batteries can be achieved by increasing the nickel content in NMC cathode materials, a commonly adopted strategy. Ni-rich formulations like NMC811 offer higher specific capacities and improved rate capabilities, making them attractive for battery applications [
3,
4]. However, the increase in Ni content can lead to challenges such as decreased thermal stability, which may result in safety concerns due to potential reactions causing oxygen release at elevated temperatures [
3]. This poses a challenge to the synthesis process as nickel can be accommodated in lithium slabs. The ratio between the diffraction peaks [003] and [104] provides valuable insight into the Ni content of Li slabs. The undesirable cation mixing leads to poorer electrochemical properties. Considerable efforts have been made to optimize the synthesis and the associated morphological and structural properties. Research efforts have focused on identifying optimal parameters to minimize the impact of high nickel content on the electrochemical properties of Ni-rich NMC materials.
The polycrystalline (PC) cathode, which consists of nanoscale primary particles, shortens the Li
+ diffusion path and thus enables a suitable power density [
5,
6]. However, the aggregated secondary particles lead to cracking due to anisotropic volume changes during the electrochemical processes [
7,
8,
9], exposing new surfaces to the electrolyte, increasing unwanted reactions, and shortening the battery life [
10,
11,
12]. This degradation becomes more pronounced with increased nickel content in NMC, restricting its applicability in high-energy-density lithium batteries.
An effective strategy for mitigating grain boundary fractures and enhancing the structural stability of nickel-rich NMC materials involves the adoption of micrometer-scale single-crystalline particles. Cathodes based on SC particles with reduced grain boundaries and resistance to micro-cracking during lithiation and delithiation exhibit improved stability, making them a compelling choice for cathodes [
13,
14,
15,
16]. The critical crystal size required to maintain the structural integrity of single-crystalline particles is approximately 3.5 μm [
13]. These inherent properties lead to different performance results depending on the nickel content. The stability of cathodes with Ni ≤ 60% was demonstrated by the Dahn group [
17,
18,
19,
20]. However, cathodes with SC particles with a higher nickel content (Ni > 80%) and higher limiting voltages (more than 4.3 V vs. Li
+/Li) often demonstrate reduced cycling performance compared to their polycrystalline NMC counterparts [
10,
21,
22].
In this study, we perform a comparative analysis of two different synthesis methods with materials based on the stoichiometry of NMC811 with two different morphologies, polycrystalline and single crystalline. We obtained a series of samples exhibiting various degrees of crystallinity by varying the synthesis parameters. Furthermore, we systematically incorporated aluminum dopants into these materials using two different techniques: either during the co-precipitation phase or during the calcination process. This targeted incorporation of aluminum dopants aims to investigate their influence on NMC cathode materials’ structure, surface morphology, and electrochemical behavior. Our report provides a systematic comparison showing how variations in synthesis conditions, morphology, structure, and composition affect the capacity retention of the NMC811 materials.
2. Experimental
2.1. Synthesis of Materials
In this study, two different synthetic routes are used for the synthesis of NMC cathode materials: Hydroxide co-precipitation followed by solid-state calcination for polycrystalline (PC) NMC811materials and a molten salt calcination approach for single-crystalline (SC) NMC811 materials. In addition, aluminum doping is systematically introduced at different stages of these processes.
For the co-precipitation synthesis, we used an aqueous solution containing NiSO4, CoSO4, and MnSO4 at a molar ratio of Ni:Co:Mn = 8:1:1, with the total cation concentration maintained at 2.0 mol dm−3. The precursors were placed in a customized continuous stirred tank reactor (CSTR) with a volume of 250 mL. The synthesis was carried out under an N2 atmosphere.
Concurrent with the precursor addition, NaOH solution at a concentration of 2.0 mol dm−3 was introduced into the reactor vessel, along with NH4OH solution at equivalent molarity, the latter serving as a chelating agent. First, all solutions introduced were boiled for 15 min to ensure degassing. Subsequently, 100 mL of deionized water (DI) was added before the co-precipitation process was initiated.
The pH values of the composite solutions were strictly monitored and regulated to maintain a pH range between 10 and 11, depending on the different requirements of the process. The formation of the secondary particles was regulated with a magnetic stirrer at a constant temperature of 60 °C and 800 rpm (revolutions per minute). The feeding step is set for one hour, after which the solution is stirred continuously for 12 h. Subsequently, the solution containing the NMC precursor with a stoichiometric ratio among Ni:Mn:Co (8:1:1) was subjected to vacuum filtration, several washing steps, and subsequently dried under vacuum at 80 °C for 12 h. Then, the precursor was stored at low oxygen and moisture content.
In the post-calcination phase, the precursor was first mixed with various lithium salts and spun for 15 min at a speed of 200 rpm using three 10 mm diameter balls. To prepare the PC material, the NMC precursor is blended with lithium hydroxide in a molar ratio of 1 to 1.05. In the case of the SC material, the NMC precursor is mixed with LiOH and LiNO3 in different ratios.
The calcination process consists of two steps that are tailored to the microstructure of the end product. The initial step in preparing the PC material involves heating at a temperature of 500 °C for 5 h, with a heating rate maintained at 5 °C/min, which is supported by oxygen gas flow in a tube furnace. The subsequent step is carried out at 750 °C for 12 h, with a heating rate maintained at 3 °C/min and a cooling rate of 5 °C/min down to 200 °C. There is no break between the calcination steps.
In the case of the SC material, two different methods of molten salts are used. In the first method, a mixture of an NMC precursor was first obtained by the co-precipitation method at pH = 10. Then, LiOH and LiNO3 in a molar ratio of 1:0.42:0.63 are used, which is referred to as SC1. After mixing, the mixture is calcined at 500 °C for 5 h at a rate of 5 °C/min, followed by further calcination at 750 °C for 12 h at a rate of 3 °C/min. It is then cooled to 200 °C at a rate of 5 °C/min in an O2-rich atmosphere. The second method for the SC materials utilizes the same mixture of NMC precursor obtained by precipitation at pH = 10 with an excess of LiOH and LiNO3 in a ratio of 1:3.42:5.58, referred to as SC9. After mixing, this composition is calcined at 500 °C for 5 h at a rate of 5 °C/min, then the temperature is raised to 850 °C for 15 h at the same rate before cooling to 200 °C at a rate of 5 °C/min. Due to the reactive nature of precursors and lithium salts, all components were weighted in aglovebox with an argon atmosphere.
For doping during the calcination phase, denoted as PC solid or SC solid, aluminum hydroxide (Al(OH)3) was added in stoichiometric amounts of 1–2 mol% to the mixture of the NMC precursor and the lithium salts. The process was carried out under controlled conditions with all other parameters kept constant to ensure consistency and reproducibility of the results.
Doping during the co-precipitation phase, denoted as PC co-p or SC co-p, was achieved by integrating aluminum sulfate (Al2(SO4)3) in stoichiometric proportions of 1–2 mol% with other transition metal salts. Similar to thesolid-state doping process, care was taken to keep all other parameters constant throughout the process.
The full list of samples used in this study can be found in
Table 1. Most samples were prepared using an NMC precursor precipitated at a pH of 10. Two precursors precipitated at a higher pH are labeled as PC10.5 and PC11, indicating that precipitation occurred at pH 10.5 and 11, respectively.
2.2. Characterization Methods
A Zeiss Supra 35 VP scanning electron microscope (SEM) (Carl Zeiss, Oberkochen, Germany) was utilized for imaging. Additionally, the system was equipped with an energy-dispersive X-ray (EDX) spectrometer (Oxford Instruments, Abingdon, UK, model Inca 400) to facilitate elemental analysis. The microscope was operated at a voltage of 5 kV for SEM procedures and 20 kV for EDX analyses.
X-ray powder diffraction (XRD) patterns were collected using a PANalytical X’Pert PRO MPD diffractometer (Pananalytical, Horsholm, Denmark) with Cu Kα1 radiation (λ = 1.54056 Å) over a 2θ range of 5° to 80° with a step size of 0.034°.
Inductively coupled plasma mass spectrometry (ICP-MS) was employed to determine the elemental ratios of Ni, Mn, Co, and Al in the selected samples. Samples were dissolved in diluted nitric acid. Subsequently, the samples were analyzed using ICP-MS. The measurements were performed with an Agilent 7500ce Series ICP-MS, which is equipped with an octopole collision cell. Prior to analysis, the samples were diluted tenfold in a glass flask containing 1.0 mL of the sample solution, 0.1 mL of concentrated nitric acid (65%, Merck, Darmstadt, Germany), and 0.05 mL of an internal standard solution (10 mg L−1 Y, Sc, Ge, Gd, Merck, Darmstadt, Germany). The final volume was adjusted to 10.0 mL using Milli-Q ultrapure water (Millipore, Bedford, MA, USA).
The distribution and morphology of NMC811 nanocrystals were investigated using a Cs-corrected scanning transmission electron microscope (STEM; JEOL JEM-ARM200CF) equipped with a cold FEG source operating at 80 kV, a JEOL Centurio 100 mm2 EDXS detector, and JEOL STEM detectors (JEOL, Tokyo, Japan). High-resolution imaging was performed in high-angle annular dark-field (STEM-HAADF) and bright-field (STEM-BF) modes.
Pouch cell testing was used to investigate the electrochemical performance of the synthesized NMC materials at room temperature. All cell assembly was conducted within an argon-filled glovebox maintained at less than 1 ppm H2O and O2. The cathode was prepared by mixing the active material, polyvinylidene fluoride (PVDF), and carbon black in a weight ratio of 8:1:1. For this purpose, 250 mg of the cathode powder was mixed with 31.25 mg of carbon black (Sigma-Aldrich, St. Louis, MO, USA) and PVDF solution (Mw~534,000, Sigma-Aldrich) in 781 μL 4 wt% NMP (1-methyl-2-pyrrolidinone, anhydrous, 99.5%, Sigma-Aldrich). This mixture was homogenized with three 10 mm diameter balls in a ball mill at 200 rpm for 15 min. The slurry was then applied to carbon-coated aluminum foil and subjected to vacuum drying at 80 °C overnight. The dried electrodes were punched into 12 mm diameter discs and then pressed under a pressure of 1 ton. A 99.9% pure metallic lithium foil (Sigma-Aldrich) served as the counter electrode.
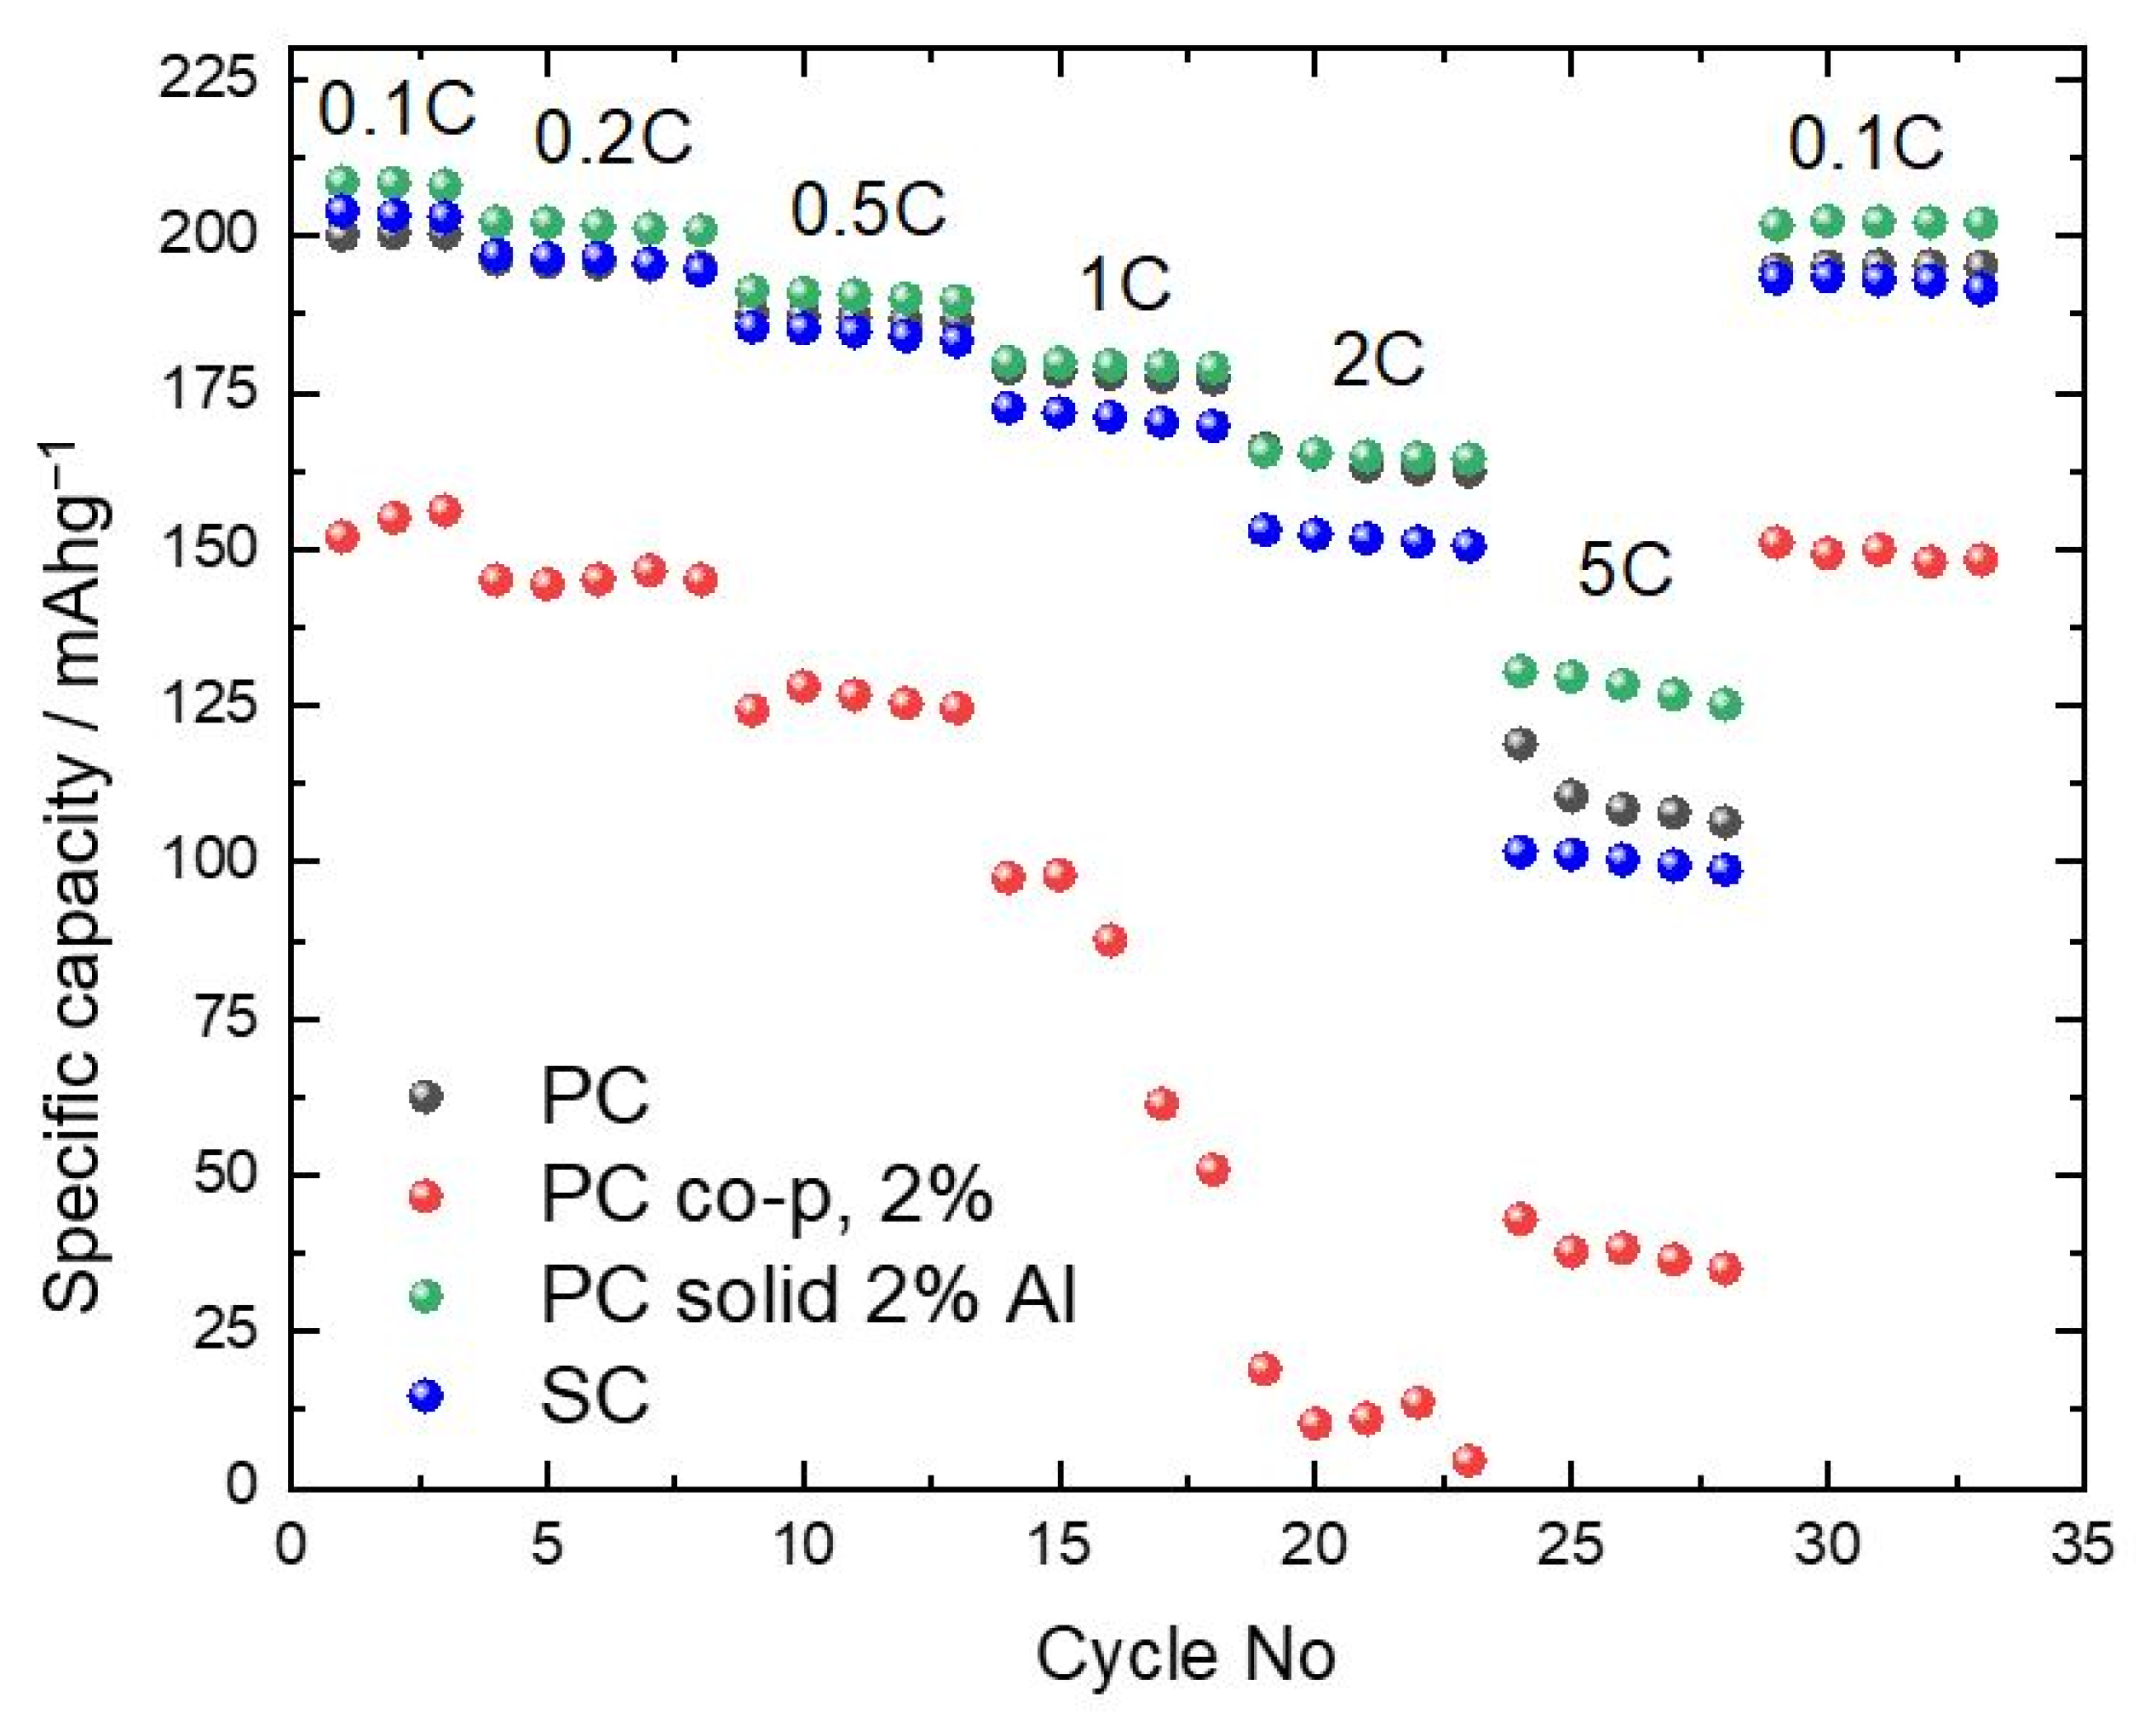
To evaluate the capacity and rate performance of the materials, half-cells were constructed and tested. The electrolyte used was 1.0 M LiPF6 in EC:DEC (1:1, 99.9%, max. 20 ppm H2O, Solvionic, Toulouse, France). Electrochemical measurements were performed at room temperature between 3.0 and 4.3 V vs. Li⁺/Li using a VMP3 potentiostat. The cells were cycled at increasing C-rates: 0.1C (3 cycles), 0.2C, 0.5C, 1C, 2C, 5C (5 cycles), and then 0.1C again (5 cycles). The main objective of this technique is to evaluate the scalability and charge-discharge efficiency of materials under diverse loading conditions.
3. Results and Discussion
Using XRD, the structural properties of the samples were investigated. The diffraction patterns (
Figure 1) of the samples prepared in this study reveal peaks consistent with a structure crystallized in the R-3m space group. The comparison of the XRD spectra shown in
Figure 1a is based on the normalized patterns, and the original measurements are shown in the
Supplementary Materials File (Figure S1). These patterns are characterized by sharp, well-defined peaks that indicate the high crystallinity of the synthesized powders. For the materials doped by solid-state methods, we observed a sharpening and intensification of the peaks at [106] and [110] (
Figure 1b). The presence of small amounts of Al-containing impurity phases, introduced as dopants, likely explains these observations. Nevertheless, the clear distinction of the characteristic [006]/[102] and [108]/[110] peaks shows that the layered structure of all the materials made has a consistently high hexagonal order. Different doping procedures influence the incorporation of Al in the NMC and its structural and electrochemical properties. In the PC material, solid-phase doping (2% Al) maintains a well-ordered structure. Conversely, co-precipitation doping introduces structural defects. This indicates that the process of doping should be performed with care, and enables only surface incorporation of aluminum.
The SEM analysis (
Figure 2) further reveals the different morphologies of the NMC cathodes synthesized by following two different synthesis strategies (PC or SC). Regardless of the synthesis method, the samples show predominantly irregular agglomerations of primary particles that coalesce to form secondary particles in the 3 to 10 µm range. However, there are clear differences between the SC and PC methods. The SC method, which is characterized by higher calcination temperatures, leads to larger primary particles (0.5 to 3 µm), in contrast to the smaller primary particles (0.1 to 0.5 µm) observed in PC samples (
Figure 2). The two representative samples shown in
Figure 2 also demonstrate that the PC sample displays a highly porous, sponge-like morphology (
Figure 2a) while the SC1 sample exhibits well-defined, dense polyhedral particles ranging from 1 to 3 μm in size (
Figure 2b). More details about the differences in the microstructure between materials are provided in the
Supplementary File (Figure S2).
The SC and PC materials do not exhibit a homogeneous spherical shape as previously reported. This suggests that the magnetic stirrer may not have provided sufficient shear force to produce uniformly spherical particles, which could affect the uniformity of the resulting particles.
ICP analysis (
Table 2) shows the chemical composition of the selected samples. It was found that the elemental proportions of nickel, cobalt, and manganese in the cathode materials are closely matched to the theoretical stoichiometric ratio of 8:1:1. This observation indicates that different preparation methods and post-treatment conditions do not influence the stoichiometric composition between lithium, nickel, cobalt, and manganese. The addition of aluminum sulfate during the co-precipitation process led to slight deviations in the elemental composition, while the addition of aluminum sulfate to the precipitated NMC precursor led to larger deviations compared to the expected stoichiometry, which is most likely due to the inhomogeneous distribution of the aluminum precursor among the NMC precursors. The values presented in
Table 2 represent the averages of three independent measurements.
Galvanostatic cycling tests at various C-rates and controlled potential limits evaluated the electrochemical properties of all samples.The electrochemical properties of all samples were evaluated by a series of galvanostatic cycling tests conducted under controlled potential limits and different C-rates. Care was taken to ensure that the conditions for electrode preparation, electrode loading, electrolyte quantity, cell assembly, and electrochemical testing remained the same. These tests aimed to determine the differences between the parameters varied in this study. In this work, we present only four representative samples, i.e., apolycrystalline sample (PC), a single-crystalline sample (SC1), and two doped polycrystalline samples prepared with a different strategy of doping (PC solid 2% and PC co-p 2%).
The results of the electrochemical tests showed that the first discharge capacity exceeded 200 mAh/g at C-rate = 0.1C for both non-doped samples and the sample that was doped after precipitation (PC solid 2%). The sample prepared with a doping procedure during the precipitation (PC co-p 2%) shows lower capacities at all C-rates, which can be correlated to the incorporation of trivalent aluminum into the lattice. This sample also shows the offset of the peaks (I103/I104) ratio, as can be observed in
Figure 1. The difference between the PC and SC samples is within the experimental error in the whole range of current densities used in this study. That indicates the possibility of using larger particles in the properly designed cathode composite. Variations in pH between 10 and 11 during the preparation of the NMC precursor led to a significant difference in the capacity achieved at higher C rates, while the capacities at 0.1C are within the experimental error (
Figure S3a). Comparative evaluations between non-doped SC and PC materials show inadequate performance of sample SC9 (
Figure S3b). This was synthesized with a large excess of lithium compared to SC1, where the excess stoichiometry of lithium during the calcination step was similar to the PC sample. For all three samples, we used NMC precursors precipitated at pH = 10. The comparison between the SC1 and PC samples is not in agreement with the literature [
10,
21,
22], which states that SCs with a nickel content of more than 80% and high cut-off voltages (>4.3 V vs. Li
+/Li) exhibit poorer cycling performance compared to their polycrystalline counterparts.
Furthermore, the process of doping by co-precipitation did not lead to an improvement in capacity or cyclability. There was a significant reduction in capacity by 16% and 24% for cathodes doped with 1% and 2% aluminum, respectively (
Figure S3c). This could be due to the altered solubility parameters introduced by adding aluminum sulfate, which required more sophisticated synthesis conditions. The introduction of Al doping by adding an Al precursor after NMC precipitation coincidentally improves the electrochemical ability of the samples. Finally,
Figure S3d shows the results of different synthesis approaches and modifications applied to single-crystal (SC) NMC cathodes. The results show that the molten salt synthesis method, which requires washing after calcination, is challenging, as shown by the performance of sample SC1 compared to SC9. Furthermore, neither the introduction of dopants during the co-precipitation process nor the incorporation of dopants during solid-state calcination led to improved electrochemical performance. These results suggest that the SC-NMC cathode operates via a unique mechanism.In PC-NMC, dopants like aluminum stabilize grain boundaries to mitigate intergranular cracking and electrolyte infiltration. However, SC-NMC’s monolithic structure eliminates these grain boundaries, making such strategies irrelevant. For example, Al doping in PC-NMC reduces crack propagation by reinforcing grain boundaries, but in SC-NMC, the absence of these interfaces negates this benefit, leading to negligible improvements in cyclability [
23,
24].To summarize, the influence of Al doping on the electrochemical performance depends on the morphology. For PC cathodes, solid phase doping (2% Al) improves capacity retention. However, doping by co-precipitation degrades the capacitance with a loss of 24%. For SC cathodes, neither doping strategy improves performance in this study. This shows that the modification techniques commonly used for the polycrystalline counterpart are not suitable for direct application to the SC cathode.
To investigate the structure at the microscopic level and their behavior regarding electrical characteristics after synthesis, selected samples were analyzed by TEM: PC, PC solid 2%, PC co-p 2%, and SC1, which were chosen based on their electrochemical performance (as indicated in
Figure 3). The analysis employed both bright-field STEM and high-resolution imaging and provided significant insight into the crystallinity, particle size distribution, and electronic structure of these samples.
Bright-field STEM images (
Figure 4) at lower and atomic resolution revealed clear differences in the microstructure of the analyzed samples. The PC and PC solid 2% samples exhibited similar crystallite sizes and maintained high crystallinity across multiple regions. The high-resolution images confirmed that aluminum doping in PC solid 2% did not drastically alter the overall crystalline structure compared to undoped PC, though subtle lattice distortions at the atomic level were observed, indicating minor structural perturbations. On the other hand, analysis of the SC1 sample revealed crystal formations that were notably bigger—more than double the dimensions found in the polycrystalline specimens, which is characteristic of materials with single-crystal structures. This was accompanied by a high degree of crystallinity, with no amorphous phases detected.
However, the structural integrity of the PC co-p 2% sample was notably different. TEM analysis revealed the presence of an amorphous phase surrounding the crystalline regions, a feature not observed in the other samples. Furthermore, high-resolution STEM imaging of PC co-p 2% exposed a considerable degree of disorder, with alternating crystalline and amorphous regions within the same particle, suggesting that the co-precipitation method, when combined with aluminum doping, disrupts the material’s structural coherence.
STEM-EDS analysis showed similar atomic composition values for PC and SC1 samples, with only minor deviations. However, PC solid 2% demonstrated a notable increase in Ni content, approximately 5 atomic % higher than the other samples, along with slight increases in Mn and Co concentrations. Note that the PC co-p 2% sample showed the presence of impurities, such as sulfur (S) and silicon (Si). The origin of these impurities is not clear. We speculate that the S impurity is attributed to residual sulfate ions from the transition metal sulfate precursors used in coprecipitation, and the Si impurity probably originates from the ceramic alumina saggar trays during high-temperature calcination. These impurities are likely a byproduct of the co-precipitation process, and their presence may contribute to the structural disorder observed in the TEM images (
Table 3).
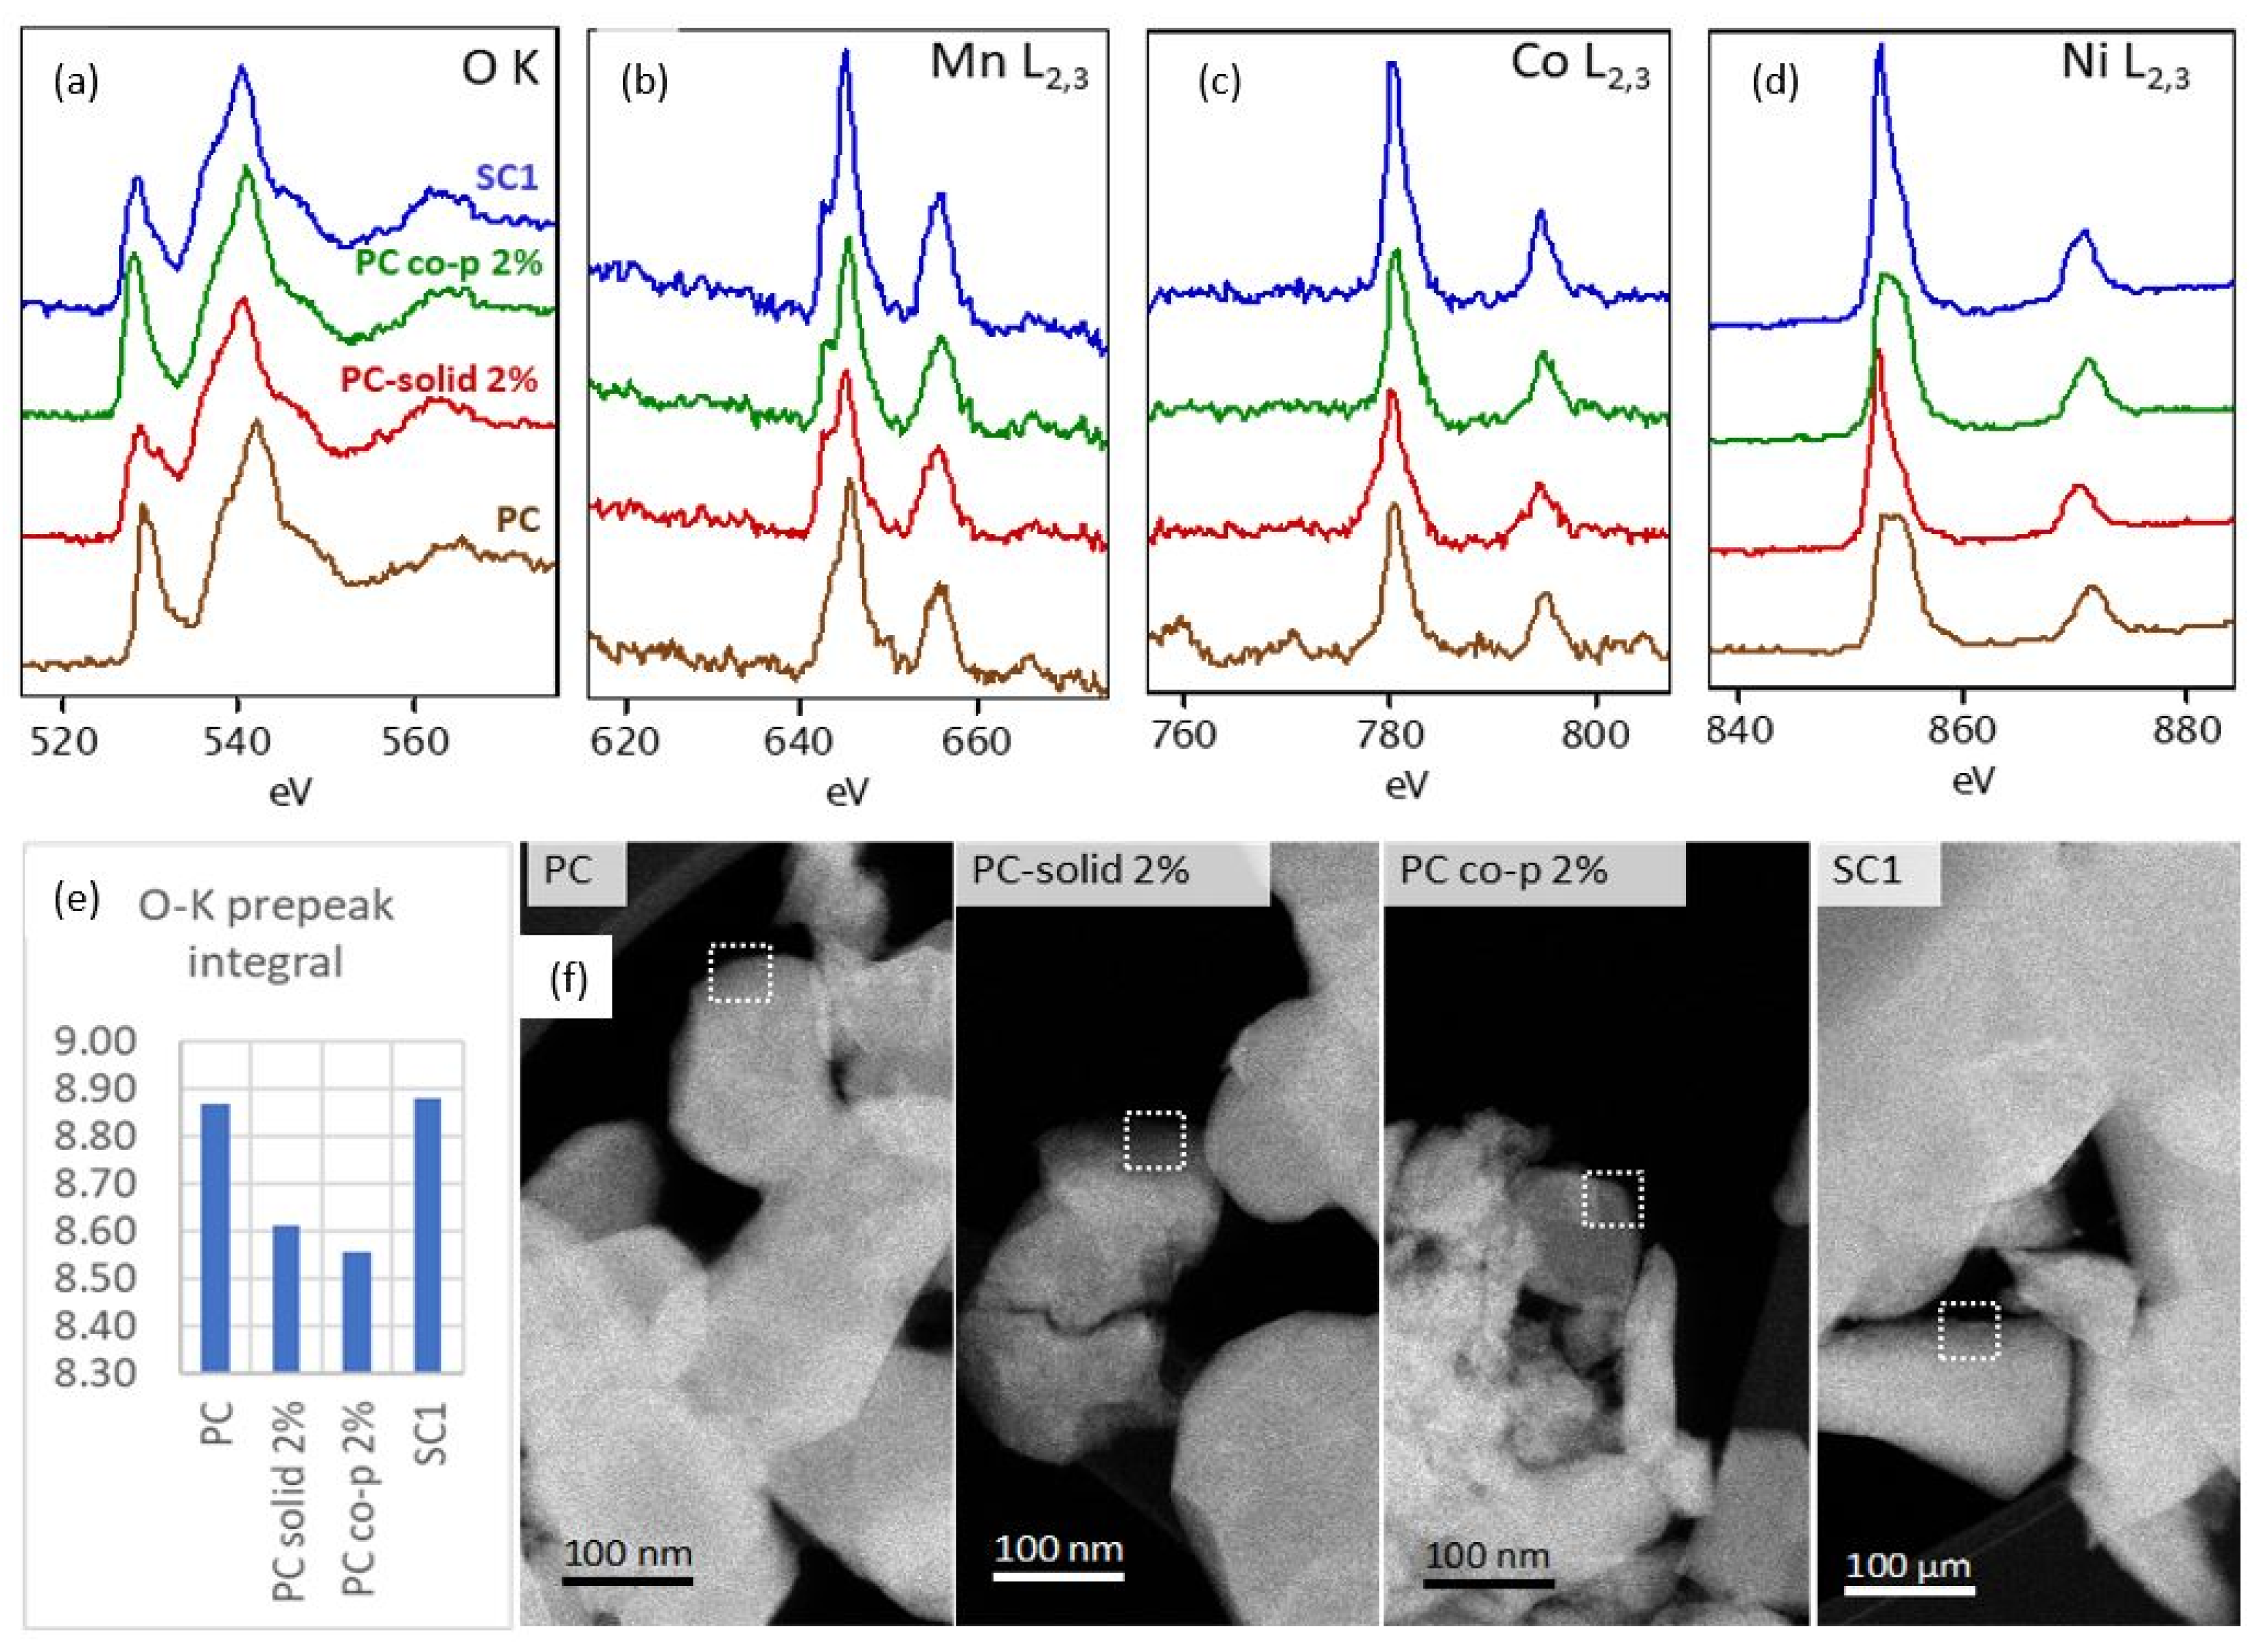
We employed scanning transmission electron microscopy combined with electron energy loss spectroscopy (STEM-EELS) to examine the electronic structure differences between samples on the thin edges of crystalline particles.
Figure 5 illustrates the detailed structures of the O Kedge and the Mn, Co, and Ni L
2,3 edges. In lithium metal oxides possessing an R-3m layered structure, the O K edge spectrum shows two distinct peaks. The spectrum begins with a pre-edge signal appearing in the 527–530 eV region and a main peak at 538.5–540 eV. The pre-edge peak is attributed to the transition of electrons from the 1s core state to unoccupied 2p states that are hybridized with 3d states in the transition metals (TMs) [
25]. The main peak originates from electron transitions from the 1s state to hybridized O 2p and metal 4sp states [
26]. The decreased intensity of this peak might indicate the modification of unoccupied states of TM-3 d and TM–TM bonding lengths [
27].
As depicted in
Figure 5a, the shapes of the O K edge fine structure for the PC co-p 2% and PC samples are notably similar, both displaying a pronounced pre-edge peak. However, the SC1 sample shows a broadening and slight diminution of this pre-peak, with even further broadening observed in the PC-solid 2% sample. The O K pre-peak integral, calculated from the spectra (
Figure 5e), reveals that the undoped PC and SC1 samples exhibit higher pre-peak intensities compared to both aluminum-doped samples (PC-solid 2% and PC co-p 2%).
In terms of the transition metal L
2,3 edges, the splitting of these edges is caused by the degeneracy of the 2p states into 2p
1/2 and 2p
3/2 levels and is a result of spin-orbit coupling [
28]. Across all four samples, the fine structures of the Mn and Co L
2,3 edges appear quite similar, with no observable chemical shift (
Figure 5b,c). However, in the case of the Ni L
2,3 edges, distinct variations are observed between the PC and PC co-p 2% samples. The L
3 edge in these two samples displays subtle differences in shape and an evident shift toward higher energy losses (
Figure 5d). This might indicate the presence of chemically unstable Ni
3⁺ and Ni
4⁺ at or near the surface [
29], where EELS analysis was performed. This goes along with the O pre-peak changes observed in these two samples. Further analysis of the would be required to conclusively interpret the observed Ni L
3 edge variations.


 ,
, 


