Abstract
Rapid and accurate prediction of the maximum remaining life of lithium-ion batteries is a critical technical challenge for enhancing battery management system reliability and enabling the efficient secondary utilization of retired batteries. Traditional approaches that rely on full charge–discharge cycles or complex electrochemical models often suffer from long detection time and limited adaptability, making them unsuitable for fast testing scenarios. To address these limitations, this study proposes a novel capacity prediction method that integrates charging segment feature extraction with a back-propagation neural network (BPNN) co-optimized using the genetic algorithm (GA) and dung beetle optimizer (DBO). Leveraging the public CALCE datasets, key degradation-related features were extracted from partial charging segments to serve as inputs to the prediction framework. The hybrid GA_DBO algorithm is employed to jointly optimize the BPNN’s weights, learning rate, and activation thresholds. A comparative analysis is conducted across various charging durations (900 s, 1800 s, and 2700 s) to evaluate performance under different input lengths. Results reveal that the model using 1800 s charging segment features achieves the best overall accuracy, with a test set mean squared error (MSE) of 0.0001 Ah2, mean absolute error (MAE) of 0.0092 Ah, root mean square error (RMSE) of 0.0122 Ah, and a coefficient of determination (R2) of 99.66%, demonstrating strong robustness and predictive capability. This research overcomes the traditional reliance on full cycles, demonstrating the effectiveness of short charging segments combined with intelligent optimization algorithms. The proposed method offers a high-precision, low-cost solution for online battery health monitoring and rapid sorting of retired batteries, highlighting its significant engineering application potential.
1. Introduction
Against the backdrop of sustained global energy demand growth and increasing environmental concerns, the construction and development of new energy systems have become an inevitable trend [1,2]. Electrochemical energy storage technology, as a key enabler of these systems, has become an indispensable and critical component playing a significant role in achieving efficient energy storage and utilization [3]. Lithium-ion batteries, with their high energy density, can store more electrical energy within limited space and with limited weight, thereby meeting the long-term endurance requirements of various devices. Their relatively environmentally friendly characteristics also align with the principles of sustainable development. Lithium batteries have demonstrated broad application prospects in portable electronic devices, electric vehicles, and large-scale energy storage systems [4,5].
Accurate prediction of the maximum remaining capacity of lithium batteries is a critical factor in assessing their health status and enabling the hierarchical utilization of retired batteries. By monitoring the remaining capacity in real time, the battery management system can adjust charging and discharging strategies accordingly, helping to prevent overcharging and overdischarging, thereby improving the safety and reliability of the battery [6]. Moreover, accurate capacity prediction provides a scientific basis for battery maintenance, replacement, and cascading utilization, ultimately reducing operational costs and improving resource utilization efficiency [7].
Currently, scholars both domestically and internationally are conducting extensive research on predicting the maximum remaining capacity of lithium batteries, proposing various prediction methods that can be broadly categorized into two groups: model-based methods and data-driven methods [8,9]. Model-based approaches typically involve establishing an electrochemical or equivalent circuit model of the battery and predicting the maximum remaining capacity by identifying and updating model parameters [10]. These methods offer deep insight into the battery’s internal physical and chemical processes and can achieve high prediction accuracy. However, the modeling and parameter identification processes are complex and sensitive to individual battery differences and changes in operating condition, which limits their practicality in real-word applications [11].
In contrast, data-driven methods leverage historical operating data and use machine learning, deep learning, and other algorithms to uncover underlying patterns. These approaches establish a mapping between the battery’s remaining capacity and relevant feature, thereby enabling effective capacity prediction without requiring detailed knowledge of the battery’s internal mechanism’s remaining capacity [12]. Owing to their strong adaptability and generalization capabilities, data-driven methods have gained significant attention in recent years Among them, the back-propagation neural network (BPNN) is widely used due to its powerful nonlinear mapping and self-learning abilities. Its simple architecture and ease of implementation have made it a popular tool for predicting the remaining capacity of batteries [13]. However, traditional BPNNs often suffer from slow convergence and a tendency to become trapped in local optima during the training, which affects prediction accuracy and stability. To overcome these limitations, researchers have enhanced BPNN performance using intelligent optimization algorithms such as the genetic algorithm (GA) [14] and dung beetle optimizer (DBO) [15] to optimize the initial weights and thresholds. Nevertheless, these optimization techniques also present drawbacks. The GA, for example, tends to have reduced search efficiency in the later stages, while the DBO may become stuck in local optima during the search process.
In addition, feature extraction is a key factor influencing the prediction performance in estimating the maximum remaining capacity of lithium batteries. Currently, most studies rely on complete charge–discharge curves for feature extraction. However, in practical applications, it is often challenging to rapidly obtain such comprehensive data [16,17]. Therefore, a major current challenge is how to effectively extract meaningful features from limited charging segments to enhance both the real-time performance and accuracy of capacity prediction. To address the aforementioned challenges, this study proposes a fast prediction method for the maximum remaining capacity of lithium-ion batteries based on the BPNN, utilizing charging segment features and GA_DBO collaborative optimization. Unlike traditional approaches that rely on complete charge–discharge curves for feature extraction, the proposed method focuses on extracting key features from partial charging segments.
To overcome the limitations associated with conventional BPNN training such as slow convergence and susceptibility to local optima, a hybrid optimization strategy combining GA and DBO is employed. This collaborative optimization is used to simultaneously fine-tune the network structure, learning rate, and thresholds of the BPNN. By analyzing data such as voltage, current, and time from the charging segments, the model extracts critical features that effectively reflect battery aging and remaining capacity. This approach not only reduces the data collection and processing burden but also enables accurate prediction of the maximum remaining capacity within a short time frame, demonstrating high prediction accuracy and strong generalization capability. The proposed method provides robust algorithmic support and a reliable theoretical foundation for the safe operation of battery management systems, rapid evaluation of retired batteries, and the advancement of hierarchical battery utilization.
2. Description of Datasets and Definition
2.1. A Brief Account of CALCE Datasets and Experiment
The experimental datasets used in this study were obtained from the publicly available battery degradation database provided by the Center for Advanced Life Cycle Engineering (CALCE) [18,19], which has been widely utilized in academic research. All models in this article were programmed in Python and implemented based on the Tensorflow and Keras open-source deep learning framework. The operating platform hardware configuration includes the NVIDIA GeForce RTX 2080Ti GPU and the AMD Ryzen 5-1600 Six-Core processor @ 3.20 GHZ CPUs. This section introduces four CALCE datasets and details the feature extraction process applied to them. Specifically, lithium-ion battery test data with identification codes CS2_35, CS2_36, CS2_37, and CS2_38 were selected as the research subjects [19]. The specifications of these battery cells are summarized in Table 1.

Table 1.
Information about CS2_35–CS2_38 lithium battery data.
This study selected lithium batteries from the Advanced Life Cycle Engineering Center, including CS2_35, CS2_36, CS2_37, and CS2_38, which were cycled 910 times, 949 times, 1015 times, and 1049 times, respectively. The appearance of the lithium batteries is shown in Figure 1.
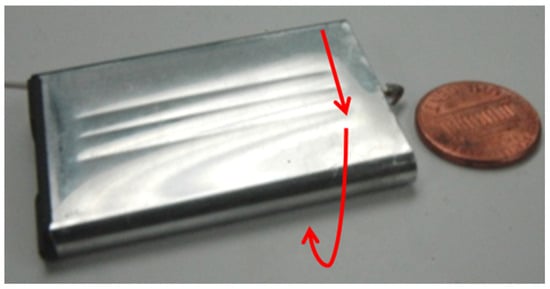
Figure 1.
Schematic diagram of the CS2 battery test setup (adapted from the CALCE Battery Research Group webpage) [19]. Note: Jellyroll configuration wrapped around the “length” axis, indicated by red arrows.
Data corresponding to step_index values 1, 3, 5–6, and 8–9 (likely representing rest periods and internal resistance measurements) can be excluded if only current, voltage, charging capacity, and discharging capacity are of interest. After this filtering, the charging and discharging process can be more clearly described, as illustrated in Figure 2.
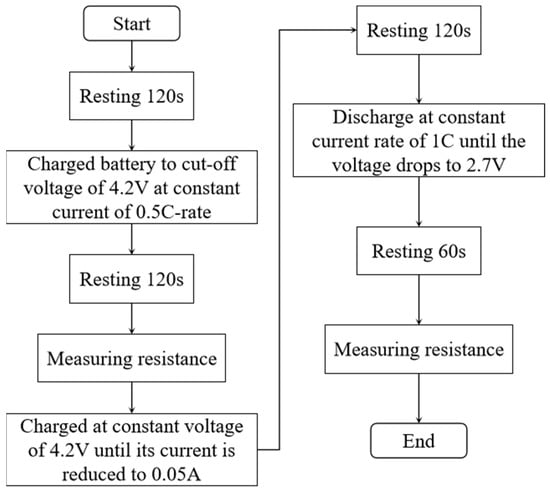
Figure 2.
The charging and discharging process of battery CS2_35 to CS2_38.
The internal behavior of lithium-ion batteries can be characterized as a highly nonlinear system. Due to the influence of multiple factors such as ambient temperature, current rate, and depth of charge/discharge, the variation patterns of their nonlinear characteristics are difficult to model and analyze accurately. Figure 3 presents the typical current–capacity curves of four batteries (CS2_35, CS2_36, CS2_37, and CS2_38) during constant current charging at a 0.5 C rate.
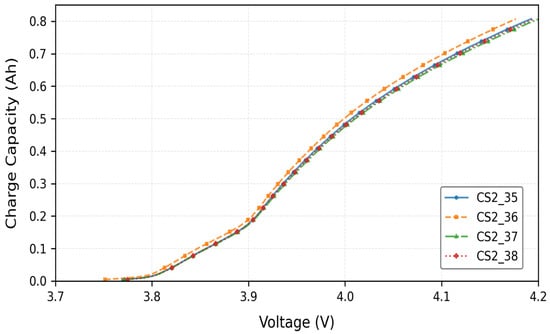
Figure 3.
Typical current–capacity curves during constant current charging phase.
In data-driven approaches, the selection of key features that effectively characterize the maximum remaining capacity of lithium-ion batteries is crucial. Direct measurement of battery capacity and internal resistance is often challenging. However, physical parameters such as current and voltage—readily obtainable through sensors—exhibit strong correlations with battery aging. Therefore, this study leverages these measurable parameters to extract health indicators that accurately reflect the degradation state of the battery.
As shown in Figure 4, the constant current (CC) charging time versus cycle number curve demonstrates a clear decreasing trend in charging time with increasing charge–discharge cycles. All four cells were tested under identical conditions, and the trend is consistent across cells.
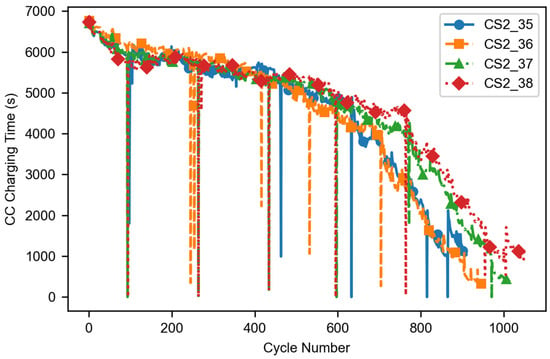
Figure 4.
Typical curves of CC charging time versus cycle number for lithium-ion batteries.
As shown in Figure 5, the curve illustrates the variation of lithium battery internal resistance as function of charge–discharge cycles. The analysis reveals that the internal resistance of lithium batteries gradually increases with the number of charge cycles. This trend is in line with the pattern of decreasing battery life. When the cycle count exceeds 700, the performance of the four tested batteries diverges considerably. In particular, for the CS2_38 battery, substantial fluctuations in internal resistance were observed from 30 to 160 cycles, potentially attributable to measurement errors or the inherent instability of the battery′s internal resistance, but the overall upward trend aligns with aging. This phenomenon appears to be closely related to the intrinsic characteristics of the battery but did not affect the experimental outcomes.
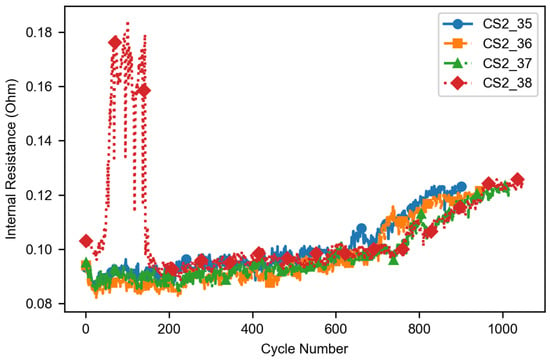
Figure 5.
Typical curve of battery internal resistance changing with the number of cycles.
As illustrated in Figure 6, the curve represents the variation in discharge capacity as a function of the number of charge–discharge cycles. The discharge capacity shows a progressive degradation trend as the number of cycles increases. The degradation process is accompanied by capacity regeneration phenomena, indicating that the battery possesses a certain degree of recovery capacity. This behavior can be attributed to reversible chemical or physical processes occurring within the battery. These figures collectively support the rationale for using early-stage charging features to predict remaining capacity.
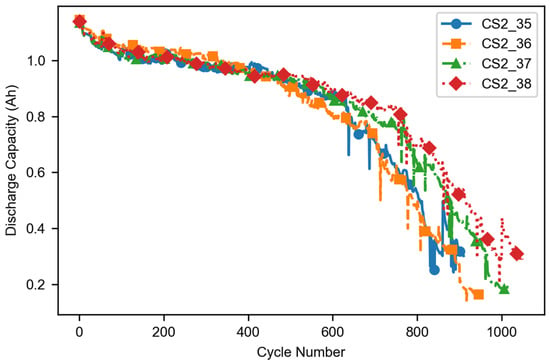
Figure 6.
Typical curve of discharge capacity variation with the number of cycles.
2.2. Definition of Maximum Remaining Capacity
The most important thing to do when predicting the maximum remaining capacity of lithium batteries is to model and analyze the battery capacity decay curve during constant current discharge [6,8]. The maximum remaining capacity refers to the amount of electricity a lithium battery contains in its unused state after being fully charged in the current cycle, equivalent to the maximum discharge capacity that the battery still has in the current cycle, representing the theoretical capacity limit of the battery in the current cycle [10]. This value is influenced by various factors such as the battery’s charging and discharging history, temperature, and self-discharge and is generally lower than the battery’s initial rated capacity.
2.3. Increment Capacity
The principle of the incremental capacity (IC) curve is to take the first derivative of the terminal voltage capacity (V-Q) curve of the battery under constant current charging or discharging conditions to obtain the terminal voltage capacity change rate (V-dQ/dV) curve [20]. The V-dQ/dV curve describes the amount of electricity charged or discharged by a battery at a unit voltage [20]. In order to quickly predict the maximum remaining capacity of lithium batteries, this study selected data from the constant current charging stage for analysis. When the terminal voltage curve of the battery exhibits a voltage plateau, the amount of electricity released by the battery increases linearly over the duration of the voltage plateau, while the battery terminal voltage changes very little, resulting in a dQ/dV peak on the IC curve. The flatter the battery voltage plateau, the larger the dQ/dV peak. To solve the first derivative of the IC curve, the V-Q curve must first be fitted using a function, which inevitably introduces fitting errors. To reduce errors and obtain reliable, smooth IC curves, the linear interpolation method is used to replace the small voltage variation dV in the differentiation by a fixed voltage interval ∆V. The charge change ∆Q at each ∆ V interval is calculated. When V approaches 0, the capacity increment can be approximated by Formula (1) [21].
where IC represents capacity increment; Q is the charging capacity; I is the charging current; T is time; V is the battery voltage.
It is important to note that this finite difference approximation is valid only when the voltage window is sufficiently small to assume a linear relationship between Q and V within the interval. A larger may obscure fine details in the IC curve and reduce the accuracy of the estimation.
By using Formula (1), the capacity increment can be calculated, and the terminal voltage capacity change rate (V-dQ/dV), also known as the incremental capacity (IC) curve, can be derived. Due to the discreteness and noise in the experimental data during IC curve computation, a Savitzky–Golay filter was used to smooth the curve. Figure 7a,b display the V-dQ/dV curves obtained through interpolation and smoothing, respectively.
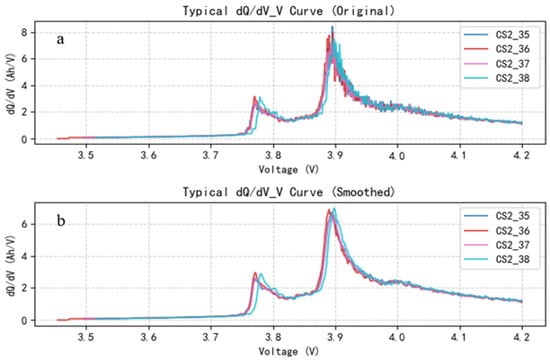
Figure 7.
Comparison before and after preprocessing of typical dQ/dV_V curve. (a) The variation curve of the original typical dQ/dV with voltage; (b) The variation curve of the smoothed typical dQ/dV with voltage.
As shown in Figure 7, the incremental capacity (dQ/dV) versus voltage curves of all four batteries exhibit a bimodal pattern. A local maximum is observed within the 3.7–3.8 V range, followed by a global peak near 3.9 V, after which the curve gradually declines. Beyond 4 V, the dQ/dV curve becomes relatively flat, indicating a reduced capacity increment and diminished charge acceptance as the voltage nears the cut-off threshold [21]. This behavior suggests intensified polarization effects and decreased utilization of active materials during the high-voltage charging phase.
The curve of dQ/dV versus time during the constant current charging phase is shown in Figure 8. Studies have shown that, during constant current charging, dQ/dV exhibits a distinct a bimodal pattern: the first peak typically appears from 400–600 s and the second peak from 1400–1800 s. This temporal behavior aligns with the dQ/dV voltage curve and reflects the monotonic increase in voltage over time during the constant current charging process [20]. Notably, the maximum remaining capacity of lithium batteries is positively correlated with the timing of these peaks. Batteries with higher remaining capacity tend to exhibit later peak occurrences. Leveraging this characteristic, this study selected three key time points (900 s, 1800 s, and 2700 s) during the constant current charging phase as input parameters for constructing a BPNN-based prediction model. This feature extraction method strategy effectively captures the key variations in electrochemical behavior associated with battery aging, enabling an accurate prediction of the maximum remaining capacity.
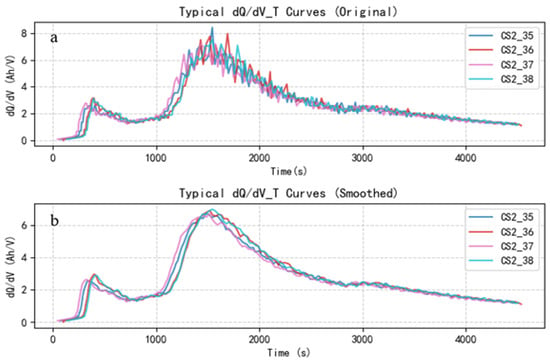
Figure 8.
Comparison before and after preprocessing of typical dQ/dV_T curve. (a) The variation curve of the original typical dQ/dV with time; (b) The variation curve of the smoothed typical dQ/dV with time.
3. Theory and Models
3.1. Dung Beetle Optimizer
The dung beetle optimizer (DBO) is a novel swarm intelligence optimization algorithm proposed by Xue et al. in 2023 [15]. Its core concept is inspired by the distinctive behaviors of dung beetles in nature, such as rolling balls, dancing, fighting, and reproduction. The DBO algorithm shares some similarities with traditional swarm intelligence algorithms in terms of optimization mechanisms, and it also introduced several unique features. For instance, its path selection strategy during manure ball rolling enhances local exploitation efficiency, while the integration of foraging and navigation behaviors enables a dynamic balance of global exploration and local search. As a result, the DBO algorithm not only offers fast convergence speed but also demonstrates high solution accuracy, a strong ability to escape local optima, and excellent robustness [22]. The DBO algorithm encodes the parameters to be optimized as information about the position of individual beetles in the search space. The fitness function is used to assess the quality of the individual′s position, and, based on the beetle′s trajectory adjustment when rolling dung balls in the natural environment, direction selection during foraging, and group cooperation in reproductive behavior, position updating strategies and corresponding search rules are designed to guide the beetle population so that it continually approaches the optimal solution zone in the search space and eventually finds the optimal solution [23].
3.2. Genetic Algorithm
The genetic algorithm (GA) is a classical intelligent optimization algorithm inspired by the principles of natural selection and genetic evolution. It inherits key characteristics of biological evolution, such as global search capability, population diversity maintenance, and probabilistic parallel exploration [13,14,24]. The optimization process in the GA is carried out through a series of genetic operators, including selection, crossover, mutation, fitness evaluation, elite retention, etc. The main principle is to encode the feasible solutions of the optimization problem into chromosomes (individuals) and transform the objective function into a fitness function. Through iterative application of genetic operations such as simulating natural selection (via fitness evaluation and selection), crossover (information exchange), and mutation (local perturbation), the algorithm evolves the population over successive generations. Inferior individuals are gradually eliminated while high-quality individuals are preserved, enabling the population to converge toward the global optimal solution over time [24].
3.3. Construction of BPNN Model for GA_DBO Collaborative Optimization
The DBO simulates the rolling, breeding, and foraging behavior of dung beetles, enabling balanced global exploration and local exploitation. This helps mitigate the common issue of BPNNs becoming trapped in local optima due to poor initial parameter setting, thereby significantly enhancing prediction accuracy. However, it is prone to falling into local optima in the final stage of optimization [25,26]. The GA’s selection, crossover, and mutation operations efficiently explore the solution space, extend the search field, and provide strong optimization capability to get rid of local extremes and perform global search and population optimization. At the same time, the GA has a fast convergence speed, can quickly lock in the optimal solution and shorten learning time, and has outstanding advantages in solving complex high-dimensional problems. In addition, the GA has strong robustness to noise and outliers and can adapt to the uncertainty of data in practical applications. Compared with traditional methods, the GA_DBO-optimized BP neural network has better generalization ability, noise resistance, and small sample learning ability. It can accurately fit the nonlinear characteristics of lithium battery capacity decay and can be used for predicting the maximum remaining capacity under different working conditions and aging modes.
The main steps for optimizing a BPNN using a collaborative GA and DBO approach are as follows.
Step 1: Define the initial structure of the BPNN. The input is the network consisting of features extracted and the constant current charging segment and the output is the maximum remaining capacity of the lithium-ion battery.
Step 2: Initialize algorithm parameters. This includes the population size n = 30, maximum number of iterations M = 100, and GA parameter crossover probability Pc = 0.8 and mutation probability Pm = 0.2. Define the search for the number of hidden layer nodes [Lmin, Lmax] = [5, 100]. Initialize DBO-specific parameters including the dynamic inertia weight ω1 decreasing linearly from 0.9 to 0.2, dance step size factor of 0.1, learning rate search range [0.0001, 0.1], and regularization parameter range [0.00001, 0.1].
Step 3: Evaluate individual fitness. Compute the fitness according to Formula (2). The minimum fitness value in the population is assigned as the initial global best fitness Gbest, and the corresponding position is recorded. Simultaneously, the fitness of each individual is stored as its personal best fitness Pbesti, along with the associated position. The mean squared error (MSE) is used as the fitness function f (x), expressed in Equation (2).
where and are the measured and predicted values of the maximum remaining capacity, respectively, and n is the number of samples participating in model training in the dataset.
Step 4: Optimize the hidden layer structure using the GA. Begin the iteration process by applying the GA to optimize the number of hidden neurons in the BPNN. Randomly generate an initial population , where represents the number of hidden layer neurons, selected from the range [5, 100]. For each individual, compute the fitness value using a fixed learning rate and initial regularization parameter value. Select 3 individuals each time through the tournament, retain the fitness value, and choose the best individual (with the smallest MSE). For the two selected parent individuals and , crossgenerate offspring according to Formula (2). Add Gaussian perturbations to the offspring and round them to a certain probability to mutate individuals and enhance diversity.
Record the global optimal fitness and the individual optimal fitness .
Step 5: Optimize the learning rate and regularization parameter using the DBO. Initialize the DBO population for each hidden layer structure , with each individual set to , and set the default value for the first individual to (0.001, 0.0001). Calculate the fitness value. Update and according to the DBO behavior rules including rolling balls, dancing, fighting, and breeding.
Simulate rolling behavior according to Formula (4) to achieve global exploration and update the positions of some individuals.
where is the inertia weight, and are random numbers, and is a random individual.
Simulate dance behavior according to Formula (5), add local parameter perturbations, enhance population diversity, and prevent premature convergence.
where represents a random direction, represents the adaptive step size, and represents the width of the parameter search space.
Step 6: Update the population, recalculate and update the global best position and individual optimal. If the current optimal fitness is better than , update . After reaching the maximum number of iterations, output the optimal number of hidden layer neurons.
Step 7: If the maximum number of iterations M is reached or the fitness converges, stop the optimization; otherwise, return to Step 3.
Step 8: Output the optimal number of hidden layer nodes , learning rate , and regularization parameter . Use these optimized hyperparameters to train and evaluate the BPNN model. Table 2 shows the hyperparameters obtained using GA, DBO, and GA_DBO collaborative optimization.

Table 2.
Hyperparameters Optimized by Different Algorithms.
3.4. Performance Evaluation Indicators
All lithium battery charging and discharging data (CS2_35 to CS2_38) are processed on a computer running the Windows 10 operating system environment, equipped with 16 GB of memory and an Intel Core i7-8700 quad-core processor (with a clock speed of 4.2 GHz). The following metrics are selected as evaluation criteria: mean square error (MSE), mean absolute error (MAE), root mean square error (RMSE), and coefficient of determination (R2). When the MSE, MAE, and RMSE values are closer to 0 and the R2 value is closer to 1, the predictive model performs better [27]. The calculation formulas for each evaluation criterion are detailed in Equations (6)–(9).
where is the measurement value of the ith sample; is the predicted value of the ith sample; is the average of measurement values; n is the number of samples.
4. Results and Discussion
To further evaluate the effectiveness of the model prediction, a series of comparative experiments were conducted. We compared the performance of BPNN models constructed using charging segment features of varying time duration. The models were then optimized to identify the optimal configuration based on time-segment feature extraction, enabling rapid prediction of the maximum remaining capacity of lithium batteries.
4.1. Maximum Remaining Capacity Prediction Performance of BPNN Models Based on Varied Charging Time Segments
Based on four sets of battery data from CALCE, key feature parameters characterizing the maximum remaining capacity of the battery were extracted from charging segment data across three different time durations (900 s, 1800 s, and 2700 s). A BPNN-based prediction model was constructed. The training set prediction performance of the BPNN model based on charging time segments of different time lengths was compared, as shown in Table 3.

Table 3.
Maximum Remaining Capacity Prediction Performance of BPNN Models Based on Varied Charging Time Segments.
As demonstrated by the experimental data analysis of CS2_35, CS2_36, CS2_37, and CS2_38 in Table 3, the length of charging time segments significantly affects the prediction performance (MSE, MAE, RMSE, and R2) of BPNN models. The BPNN model utilizing 2700 s charging segments exhibits optimal performance.
For instance, the CS2_35 dataset reveals that prediction accuracy improves substantially with longer charging segments: extending from 900 s to 2700 s yields a 52.94% reduction in MSE, 47.72% reduction in MAE, 32.30% reduction in RMSE, and a 24.51% improvement in R2. However, while further extension from 1800 s to 2700 s provides average accuracy improvements of 28.95% (MSE), 35.08% (MAE), and 20.32% (RMSE) with a 1.5% enhancement in R2, it incurs a 50% increase in testing time.
Analysis of the dQ/dV curves in Figure 8 reveals two characteristic peak intervals from 400–600 s and 1400–1800 s. Experimental results confirm that 1800 s charging segments capture the principal feature information, showing high consistency with 2700 s segments. While 2700 s segments yield slightly better accuracy, the improvement is marginal (e.g., R2 increases by only ~1.5% from 1800 s to 2700 s) but requires 50% more testing time. Given that the 1800 s segment already captures the key IC curve peaks (400–600 s and 1400–1800 s) and achieves high accuracy (average R2 > 95%), it offers a better balance between prediction performance and practicality. Consequently, this study selects the BPNN model constructed with 1800 s charging segments, achieving both satisfactory prediction accuracy and significantly improved testing efficiency.
4.2. Maximum Remaining Capacity Prediction Performance of BPNN Models Based on Different Enhanced BPNNs
To improve the prediction performance of maximum remaining capacity in lithium-ion batteries based on 1800 s charging segments, this study implemented three optimization approaches, the DBO, GA, and a hybrid DBO_GA algorithm. Using 1800 s charging segment features as inputs, the optimized BPNN models were applied to predict the maximum remaining capacity for four battery datasets (CS2_35, CS2_36, CS2_37, and CS2_38). The prediction performance results are shown in Table 4.

Table 4.
Prediction performance of different models based on 1800 s charging segment for maximum remaining capacity.
Experimental results in Table 4 demonstrate that all three optimization algorithms (GA, DBO, and their hybrid GA_DBO) effectively enhance the prediction accuracy of the BPNN model. The GA_DBO_BPNN hybrid model using 1800 s charging segment features achieves the best performance, showing significant improvements over the original BPNN: a 77.19% reduction in MSE, 63.42% decrease in MAE, and 54.02% lower RMSE. Moreover, the coefficient of determination R2 increases by 2.4 percentage points, confirming the synergistic advantages of the hybrid optimization algorithm in feature extraction and model accuracy enhancement.
To visually compare the predictive performance of different models, this study used a standard data partitioning method to randomly divide four sets of lithium battery experimental data, including CS2_35, CS2_36, CS2_37, and CS2_38, into a training set, validation set, and test set in an 8:1:1 ratio.
Figure 9a–d show the prediction performance curves of the models for test datasets, where the blue dots represent measured values and other different colored dots represent predicted values from different methods. By comparison, it can be found that the optimized model prediction curve shows higher consistency with the measured data, especially in the critical stage of battery capacity decay, demonstrating more accurate fitting performance.
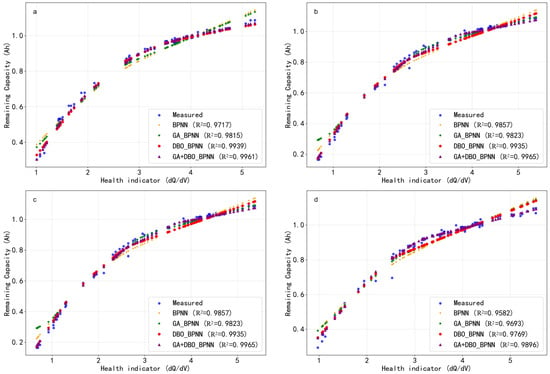
Figure 9.
The maximum remaining capacity fitting effect of test set based on 4 different optimization models. (a) battery CS2_35; (b) battery CS2_36; (c) battery CS2_37; (d) battery CS2_38.
The experimental results show that the BPNN model based on the collaborative optimization of the DBO and GA exhibits the best predictive performance. Through comprehensive analysis of the quantitative indicators in Table 4 and the fitting curve in Figure 9, it was found that, on the test set, the model improved the R2 indicator by an average of about 2.2%, reaching a maximum of 99.66. Meanwhile the MSE decreased by a maximum of 84.62%, decreasing to 0.002 Ah2. The fusion method proposed in this study significantly reduces the dependence on the entire charge–discharge cycle test data while maintaining prediction accuracy, reducing the traditional lithium battery maximum remaining capacity detection time from 3 h to 1800 s (30 min).
While this study demonstrates the effectiveness of our method on LiCoO2 batteries from the CALCE dataset, its generalizability to other chemistries (e.g., LFP, NMC) represents an important direction for future work. Furthermore, the current model is trained on data from complete charge–discharge cycles. Validating its performance under the partial or irregular cycling patterns typical of real-world applications will be a crucial next step toward practical deployment. Finally, although the 30 min testing window is a significant improvement over full-cycle tests, we aim to explore the feasibility of further reducing this duration in subsequent research, seeking the optimal balance between speed and predictive accuracy.
5. Conclusions
This article focuses on the health assessment of lithium batteries and proposes an efficient method for predicting the maximum remaining capacity. The approach leverages charging segment characteristics and a hybrid GA_DBO_BPNN model, significantly improving both prediction speed and accuracy. The main conclusions are as follows.
- (1)
- A novel method is proposed for predicting the maximum remaining capacity of lithium batteries based on key features extracted from charging segments. Compared to traditional methods that rely on complete charge–discharge curves, this method extracts key features of the constant current charging stage, while retaining core information about battery aging, significantly reducing data computation and achieving rapid prediction of the maximum remaining capacity of lithium batteries.
- (2)
- The proposed method reduces capacity detection time from hours to 1800 s. While ensuring prediction accuracy, the detection efficiency is improved by more than 6 times, providing a feasible solution for rapid evaluation of the maximum remaining capacity of lithium batteries.
- (3)
- By jointly applying the GA and DBO to optimize the BPNN model, the initial weights and hyperparameters are effectively adjusted. This helps avoid local optima and accelerates convergence. The co-optimized BPNN achieved an average accuracy improvement of 2.2 percentage points compared to the baseline BPNN, with a maximum R2 of 99.66%, providing a robust and scalable solution for lithium batteries’ capacity prediction.
- (4)
- The proposed approach is suitable for real-time health monitoring in battery management systems. It enables early and accurate detection of capacity grading and cascading utilization of retired lithium batteries, underscoring its engineering relevance and practical significance.
Author Contributions
Y.C. has made contributions to conceptualization, methodology, initial draft writing, review, and editing. R.W., Q.L., P.C. and A.L. have made contributions to software, data organization, and writing—review and editing. P.Z. has made contributions to supervision, project management, funding acquisition, conceptualization, and methodology. Q.T. and Z.S. have contributed to investigations, data management, and resources. All authors have read and agreed to the published version of the manuscript.
Funding
This work was supported by the Foundation of Science and Technology Research in Wuhu (2024 kj018) and the Joint Opening Project of Anhui Engineering Research Center of Vehicle Display Integrated Systems and Joint Discipline Key Laboratory of Touch Display Materials and Devices in Anhui Province (VDIS&TDMD2024C02).
Data Availability Statement
The raw data supporting the conclusions of this article will be made available by the authors, without undue reservation.
Conflicts of Interest
Author Quanhong Tao was employed by the company Anhui Green Energy Technology Institute Co., Ltd. Author Zhendong Shao was employed by the company Anhui Lvwo Energy Technology Co., Ltd. The remaining authors declare that the research was conducted in the absence of any commercial or financial relationships that could be construed as a potential conflict of interest.
References
- Li, J.; Adewuyi, K.; Lotfi, N.; Landers, R.G.; Park, J. A single particle model with chemical/mechanical degradation physics for lithium ion battery State of Health (SOH) estimation. Appl. Energy 2018, 212, 1178–1190. [Google Scholar] [CrossRef]
- Wang, Z.; Zhao, X.; Fu, L.; Zhen, D.; Gu, F.; Ball, A.D. A review on rapid state of health estimation of lithium-ion batteries in electric vehicles. Sustain. Energy Technol. Assess. 2023, 60, 103457. [Google Scholar] [CrossRef]
- Teng, J.; Chen, R.; Lee, P.; Hsu, C. Accurate and Efficient SOH Estimation for Retired Batteries. Energies 2023, 16, 1240. [Google Scholar] [CrossRef]
- Wang, Z.; Feng, G.; Zhen, D.; Gu, F.; Ball, A. A review on online state of charge and state of health estimation for lithium-ion batteries in electric vehicles. Energy Rep. 2021, 7, 5141–5161. [Google Scholar] [CrossRef]
- Liu, Y.; Liu, C.; Liu, Y.; Sun, F.; Qiao, J.; Xu, T. Review on degradation mechanism and health state estimation methods of lithium-ion batteries. J. Traffic Transp. Eng. 2023, 10, 578–610. [Google Scholar] [CrossRef]
- Lin, C.; Tuo, X.; Wu, L.; Zhang, G.; Zeng, X. Accurate Capacity Prediction and Evaluation with Advanced SSA-CNN-BiLSTM Framework for Lithium-Ion Batteries. Batteries 2024, 10, 71. [Google Scholar] [CrossRef]
- Tao, S.; Guo, R.; Lee, J.; Moura, S.; Casals, L.C.; Jiang, S.; Shi, J.; Harris, S.; Zhang, T.; Chung, C.Y.; et al. Immediate remaining capacity estimation of heterogeneous second-life lithium-ion batteries via deep generative transfer learning. Energy Environ. Sci. 2025, 13, 7413–7426. [Google Scholar] [CrossRef]
- Gao, K.; Sun, J.; Huang, Z.; Liu, C. Capacity prediction of lithium-ion batteries based on ensemble empirical mode decomposition and hybrid machine learning. Ionics 2024, 30, 6915–6932. [Google Scholar] [CrossRef]
- Li, L.; Hou, J. Capacity detection of electric vehicle lithium-ion batteries based on X-ray computed tomography. RSC Adv. 2018, 8, 25325–25333. [Google Scholar] [CrossRef]
- Jafari, S.; Byun, Y.; Ko, S. A Novel Approach for Predicting Remaining Useful Life and Capacity Fade in Lithium-Ion Batteries Using Hybrid Machine Learning. IEEE Access 2023, 11, 131950–131963. [Google Scholar] [CrossRef]
- Zhang, Z.; Yu, W.; Yan, Z.; Zhu, W.; Li, H.; Liu, Q.; Guan, Q.; Tan, N. State of charge estimation of lithium-ion batteries using a fractional-order multi-dimensional Taylor network with adaptive Kalman filter. Energy 2025, 316, 134577. [Google Scholar] [CrossRef]
- Pang, H.; Chen, K.; Geng, Y.; Wu, L.; Wang, F.; Liu, J. Accurate capacity and remaining useful life prediction of lithium-ion batteries based on improved particle swarm optimization and particle filter. Energy 2024, 293, 130555. [Google Scholar] [CrossRef]
- Cheng, X.; Hu, X.; Li, Z.; Geng, C.; Liu, J.; Liu, M.; Zhu, B.; Li, Q.; Chen, Q. Using Genetic Algorithm and Particle Swarm Optimization BP Neural Network Algorithm to Improve Marine Oil Spill Prediction. Water Air Soil Pollut. 2022, 233, 354. [Google Scholar] [CrossRef]
- Song, Y.; Lei, Z.; Lu, X.; Xu, G.; Zhu, J. Optimization of a Lobed Mixer with BP Neural Network and Genetic Algorithm. J. Therm. Sci. 2023, 32, 387–400. [Google Scholar] [CrossRef]
- Xue, J.; Shen, B. Dung beetle optimizer: A new meta-heuristic algorithm for global optimization. J. Supercomput. 2023, 79, 7305–7336. [Google Scholar] [CrossRef]
- Peng, S.; Wang, Y.; Tang, A.; Jiang, Y.; Kan, J.; Pecht, M. State of health estimation joint improved grey wolf optimization algorithm and LSTM using partial discharging health features for lithium-ion batteries. Energy 2025, 315, 134293. [Google Scholar] [CrossRef]
- Peng, S.; Zhu, J.; Wu, T.; Tang, A.; Kan, J.; Pecht, M. SOH early prediction of lithium-ion batteries based on voltage interval selection and features fusion. Energy 2024, 308, 132993. [Google Scholar] [CrossRef]
- Tian, J.; Xiong, R.; Shen, W.; Lu, J.; Yang, X. Deep neural network battery charging curve prediction using 30 points collected in 10 min. Joule 2021, 5, 1521–1534. [Google Scholar] [CrossRef]
- Available online: https://calce.umd.edu/battery-data (accessed on 7 March 2025).
- Spitthoff, L.; Vie, P.J.S.; Wahl, M.S.; Wind, J.; Burheim, O.S. Incremental capacity analysis (dQ/dV) as a tool for analysing the effect of ambient temperature and mechanical clamping on degradation. J. Electroanal. Chem. 2023, 944, 117627. [Google Scholar] [CrossRef]
- Fly, A.; Chen, R. Rate dependency of incremental capacity analysis (dQ/dV) as a diagnostic tool for lithium-ion batteries. J. Energy Storage 2020, 29, 101329. [Google Scholar] [CrossRef]
- Li, Q.; Shi, H.; Zhao, W.; Ma, C. Enhanced Dung Beetle Optimization Algorithm for Practical Engineering Optimization. Mathematics 2024, 12, 1084. [Google Scholar] [CrossRef]
- Wang, X.; Wei, Y.; Guo, Z.; Wang, J.; Yu, H.; Hu, B. A Sinh-Cosh-Enhanced DBO Algorithm Applied to Global Optimization Problems. Biomimetics 2024, 9, 271. [Google Scholar] [CrossRef]
- Wang, L.; Wang, F.; Xu, L.; Li, W.; Tang, J.; Wang, Y. SOC estimation of lead–carbon battery based on GA-MIUKF algorithm. Sci. Rep. 2024, 14, 3347. [Google Scholar] [CrossRef]
- Ye, M.; Zhou, H.; Yang, H.; Hu, B.; Wang, X. Multi-Strategy Improved Dung Beetle Optimization Algorithm and Its Applications. Biomimetics 2024, 9, 291. [Google Scholar] [CrossRef]
- Xia, H.; Chen, L.; Xu, H. Multi-strategy dung beetle optimizer for global optimization and feature selection. Int. J. Mach. Learn. Cybern. 2025, 16, 189–231. [Google Scholar] [CrossRef]
- Cao, Y.; Xu, H.; Song, J.; Yang, Y.; Hu, X.; Wiyao, K.T.; Zhai, Z. Applying spectral fractal dimension index to predict the SPAD value of rice leaves under bacterial blight disease stress. Plant Methods 2022, 18, 67. [Google Scholar] [CrossRef]
Disclaimer/Publisher’s Note: The statements, opinions and data contained in all publications are solely those of the individual author(s) and contributor(s) and not of MDPI and/or the editor(s). MDPI and/or the editor(s) disclaim responsibility for any injury to people or property resulting from any ideas, methods, instructions or products referred to in the content. |
© 2025 by the authors. Licensee MDPI, Basel, Switzerland. This article is an open access article distributed under the terms and conditions of the Creative Commons Attribution (CC BY) license (https://creativecommons.org/licenses/by/4.0/).