Article

Numerical Simulation Study and Stress Prediction of Lithium-Ion Batteries Based on an Electrochemical–Thermal–Mechanical Coupled Model

1
Research Department, Jiangxi Mechanical Science Institute, Nanchang 330002, China
2
School of Automotive and Aviation, Jiangxi Technical College of Manufacturing, Nanchang 330095, China
3
School of Electrical Engineering, Jiangxi University of Water Resources and Electric Power, Nanchang 330099, China
*
Author to whom correspondence should be addressed.
Batteries 2025, 11(10), 360; https://doi.org/10.3390/batteries11100360
Submission received: 29 August 2025 / Revised: 23 September 2025 / Accepted: 25 September 2025 / Published: 29 September 2025

Abstract

In lithium-ion batteries, the fracture of active particles that are under stress is a key cause of battery aging, which leads to a reduction in active materials, an increase in internal resistance, and a decay in battery capacity. A coupled electrochemical–thermal–mechanical model was established to study the concentration and stress distributions of negative electrode particles under different charging rates and ambient temperatures. The results show that during charging, the maximum lithium-ion concentration occurs on the particle surface, while the minimum concentration appears at the particle center. Moreover, as the temperature decreases, the concentration distribution of negative electrode active particles becomes more uneven. Stress analysis indicates that when charging at a rate of 1C and 0 °C, the maximum stress of particles at the negative electrode–separator interface reaches 123.7 MPa, while when charging at 30 °C, the maximum particle stress is 24.3 MPa. The maximum shear stress occurs at the particle center, presenting a tensile stress state, while the minimum shear stress is located on the particle surface, showing a compressive stress state. Finally, to manage the stress of active materials in lithium-ion batteries while charging for health maintenance, this study uses a DNN (Deep Neural Network) to predict the maximum shear stress of particles based on simulation results. The predicted indicators, MAE (Mean Absolute Error) and RMSE (Root Mean Square Error), are 0.034 and 0.046, respectively. This research is helpful for optimizing charging strategies based on the stress of active materials in lithium-ion batteries during charging, inhibiting battery aging and improving safety performance.

1. Introduction

As a crucial energy storage component, lithium-ion batteries have been widely used in new energy vehicles. However, lithium-ion batteries face issues such as safety hazards and aging during operation. The aging of lithium-ion batteries is associated with a variety of factors, including the formation and rupture of the solid electrolyte interphase (SEI) film, lithium plating that leads to a reduction in reversible lithium capacity, and the loss of electrode active materials [1,2]. Among these, lithium plating occurs when the lithium ions in the negative electrode particles reach a saturated state or the overpotential value becomes less than zero [3,4,5,6]. On the other hand, the loss of active materials in lithium-ion batteries is related to diffusion-induced stress. During the charging and discharging process, the intercalation and deintercalation of lithium ions cause the volume expansion and contraction of particles, which in turn leads to the volume strain of the particles and the generation of stress; this process is referred to as diffusion-induced stress [7,8]. At the particle scale, diffusion-induced stress can result in problems such as the damage of active particles and their detachment from the binder.
Verbrugge et al. [9] analyzed the diffusion-induced stress in spherical particles using an analytical solution, and the results showed that smaller particles are less prone to cracking. Zhu et al. [10] investigated the cracking behavior of circular particles under diffusion-induced stress by means of the diffusion finite element method, and their findings were verified by experiments. Korsunsky et al. [11] studied the diffusion-induced stress inside circular particles using a sequential coupling method. Zhao et al. [12] calculated the lithium-ion concentration distribution and stress of LiCoO2 particles at different discharge rates and also computed the energy release rate of particle fracture when pre-cracks exist. Pistorio et al. [13] established an electro-chemo-mechanical model based on the Pseudo Two-Dimensional (P2D) model and calculated the stress intensity factor of active particles during constant-current charging using a modified J-integral. In addition, relevant studies have also been conducted at the electrode scale. Zhu et al. [14] researched the fatigue behavior of the positive electrode active material NMC532 (LiNi0.5Mn0.3Co0.2O2) under charge–discharge cycles; both simulation and experimental results indicated that cracks are more likely to appear at the interface where the active layer is in contact with the electrolyte. Chen et al. [15] carried out a comprehensive study on the plastic behavior of LiNixMnyCozO2 electrodes during cyclic lithiation/delithiation, and the numerical results showed the presence of low-cycle stress fatigue on the cathode surface. Zhang et al. [16] studied the fatigue behavior of electrodes under stress by establishing an electrochemical–thermal–mechanical coupling model, and the results demonstrated that reducing the thickness of the current collector can lead to a decrease in the stress of the active layer.
It can be seen that numerous studies have been conducted on diffusion-induced stress behavior at either the particle scale or the electrode scale. However, few studies have considered the influence of temperature on the concentration distribution and stress distribution of active particles. Nevertheless, the electrochemical reaction process of batteries is affected by temperature: temperature influences the diffusion flux and diffusion rate of particles, and these parameters are closely related to diffusion-induced stress.
In addition, data-driven algorithms have been widely applied in lithium-ion batteries, such as state of charge (SOC) estimation [17,18,19] and temperature prediction [20,21]. Ahn et al. [22] proposed a dual Long Short-Term Memory (LSTM) model for the accurate estimation of the SOC of lithium-ion batteries in electric vehicles. Owing to its ability to simultaneously capture the data–temporal dependence and variability in the battery time series, this model achieves extremely high accuracy, on average 12.02% higher than that of the standard LSTM model. Mustaffa et al. [23] optimized the weights and biases of the DNN model using an optimization algorithm, thereby improving the accuracy of SOC estimation. Ma et al. [24] put forward a novel multi-task DNN framework that integrates a plug-and-play anomaly detection module to realize SOC estimation under unexpected working conditions such as dynamic temperature changes and sensor faults.
Estimating the stress of active particles in lithium-ion batteries during the charging process based on voltage and current data is of great significance for preventing battery aging during charging. We assume that as the temperature decreases, the stresses in the particles increase significantly, and our aim is to confirm this quantitatively. Based on this, this study establishes an electrochemical–thermal–mechanical coupling model. First, we investigate the influence of different temperatures on the concentration distribution and stress distribution of negative electrode particles during the charging process. Then, we explore the concentration and stress distribution of active particles during low-temperature fast charging. Finally, a deep learning algorithm (DNN) is used to estimate the stress of active particles during the charging process.

2. Establishment of Electrochemical–Thermal–Mechanical Coupling Model

2.1. Electrochemical Model

In the electrochemical model of this paper, graphite is used as the anode material and LiMn2O4 (lithium manganate) as the cathode material. The electrochemical equations adopt the classic P2D (Pseudo Two-Dimensional) reaction equations, which have been described in numerous studies [25,26]. These equations include the mass conservation equation, the charge conservation equation, and the Butler–Volmer (B–V) electrochemical reaction equation. The latter is as follows [27]:
i l o c = i 0 ( exp α a F R T η e x p ( α c F R T η ) )
where i 0 is the exchange current density, i l o c is the local current density, α a and α c are the charge transfer coefficients, η is the overpotential, R is the ideal gas constant, and T is the temperature.
In the electrochemical model, some chemical parameters are temperature-dependent. Among these parameters, the diffusion coefficients of the anode and cathode are calculated using the Arrhenius equation, as shown below [28]:
D s _ p o s = 1.0 ×   10 13 e x p ( 31,556 / 8.314 ( 1 / ( T _ r e f ) 1 / ( T ) ) )
D s _ n e g = 3.9 × 10 14 e x p ( 35,000 / 8.314 ( 1 / ( T _ r e f ) 1 / ( T ) ) )
The formulas for the liquid-phase diffusion coefficient and electrical conductivity are given by Equations (4) and (5) [28]:
D l = 10 ( ( 4.43 54 / ( T 0.005 c 229 ) 0.22 × 0.001 c ) 4 )
σ l = 10 4 c 10.5 + 0.074 T 0.0000669 T 2 + 0.668 × 10 3 c 1.78 × 10 5 × c × T + 2.8 × 10 8 c T 2 + 4.94 × 10 7 T 2 8.86 × 10 10 c 2 T 2
where D l is the liquid-phase diffusion coefficient, σ l is the liquid-phase electrical conductivity, and c is the liquid-phase lithium-ion concentration, The electrochemical model parameters are listed in Table 1.

2.2. Thermal Model

During the charging and discharging process of a battery, the energy conservation equation for battery charging and discharging must be followed, and the formula is given by Equation (6). In the equation, Q represents the total heat generation during battery charging and discharging, including polarization heat, reaction heat, and ohmic heat; h denotes the convective heat transfer coefficient between the battery surface and the environment, which is set to 5 W/(m2·K), and the initial temperature is set to 25 °C; As is the outer surface area of the battery; and Ta is the ambient temperature. Specifically, the heat generated by the battery is equal to the sum of the battery’s temperature rise and the heat released to the environment, and the formula is shown in Equation (6) [27].
p C p T t = Q h A s T a T

2.3. Mechanical Model

The stress–strain relationship induced by concentration variations inside the particle can be expressed by the following formula [29]:
ε i j = 1 E 1 + υ σ i j υ σ k k δ i j + c Ω 3 δ i j
In this formula, ε i j is the strain component, where i and j represent the strain directions; E is Young’s modulus; υ is Poisson’s ratio; σ i j is the stress; Ω is the partial molar volume of lithium ions; c is the lithium-ion concentration; and   δ i j is the Kronecker delta.
When lithium ions diffuse inside the particle, their diffusion flux is driven not only by the concentration gradient but also by the hydrostatic stress. The formula is as follows [29]:
J = D s c s c s Ω R T σ h
In this formula, J is the diffusion flux; Ds is the diffusion coefficient, whose value is related to temperature T; R is a constant; σ h is the hydrostatic stress; Ω is the partial molar volume of lithium ions; and c s is the lithium-ion concentration. The boundary condition for the diffusion flux at the particle surface is as follows [29]:
J = i l o c F
Table 1. Electrochemical reaction parameters.
ParameterDefinition/UnitAluminumCathodeSeparatorAnodeCopper
LElectrode thickness/μm211503012018 [16]
rParticle radius/μm 8 [30] 12.5 [30]
Cs,maxMax. Li-ion concentration
In the solid phase/mol·m−3
22,860 [30] 26,390 [30]
Cs,0Initial Li-ion concentration in the solid phase/mol·m−3 3800 21,061
Cl,0Initial Li-ion concentration in the liquid phase/mol·m−3 1000 [29]
εsSolid-phase volume fraction 0.297 [30] 0.471 [30]
εlLiquid-phase volume fraction 0.44 [30] 0.35 [30]
DsSolid-phase diffusion coefficient/m2·s−1 Equation (2) Equation (3)
DlLiquid-phase diffusion coefficient/m2·s−1 Equation (4)
σsSolid-phase conductivity/S·m−1 3.8 [29] 100 [29]
σlLiquid-phase conductivity/S·m−1 Equation (5)
KrefReference reaction rate constant/m·s−1 2 × 10⁻¹¹ [29] 2 × 10⁻¹¹ [29]
EaDActivation energy for diffusion/J·mol−1 35,000 [16] 31,000 [16]
γBruggeman coefficient 1.51.51.5
EaRActivation energy for reaction/J·mol−1
TrefReference temperature/°C 25 [31]
αCharge transfer coefficient 0.5 [29] 0.5 [29]
t+Li-ion transference number 0.363 [30]
FFaraday constant/C·mol−1 96,487
KThermal conductivity/W·(m·K)−12381.481.331.04398
CpSpecific heat capacity/J·(kg·K)−190370019781437385
ρDensity/kg·m−32700150049226608900
F is Faraday’s constant, and i l o c is the local current density. The tangential stress of spherical active particles is often used to calculate the stress of the particles, and its equation is as follows [29]:
σ = E Ω 3 1 ν ( 1 R p 3 * 0 R p C r 2 d r + 1 r 3 0 r C r 2 d r C ( r , t ) )
In the formula, E is the elastic modulus, ν is Poisson’s ratio, Ω is the partial molar volume of the lithium battery, r is the integral variable, and Rpis the particle radius, which is a constant. Parameters of particle mechanical properties are listed in Table 2.

2.4. Coupling Process

In COMSOL Multiphysics 6.0, a coupled electrochemical–thermal–mechanical battery model is established using the 1D Electrochemical Reaction Module, 3D Heat Transfer Module, and 2D Solid Mechanics Module. The coupling process is implemented as follows:
First, the heat generated during the battery’s electrochemical reactions is transferred to the battery in the form of an average heat source, leading to changes in the battery’s temperature. Subsequently, the average temperature from the battery’s 3D (thermal) model is passed to the Electrochemical Module, which induces variations in the temperature-dependent parameters within the Electrochemical Module; this enables the electrochemical–thermal coupling process.
Thereafter, the local current density at the particle surface is calculated via the B–V electrochemical reaction process. The diffusion flux is then computed using Equation (9). Finally, with the diffusion flux and diffusion coefficient known, calculations are performed in the Solid Mechanics Module to obtain the concentration and stress distribution of the active particles, thereby realizing the complete electrochemical–thermal–mechanical coupling process. A schematic diagram of this coupling process is shown in Figure 1.

2.5. DNN Algorithm

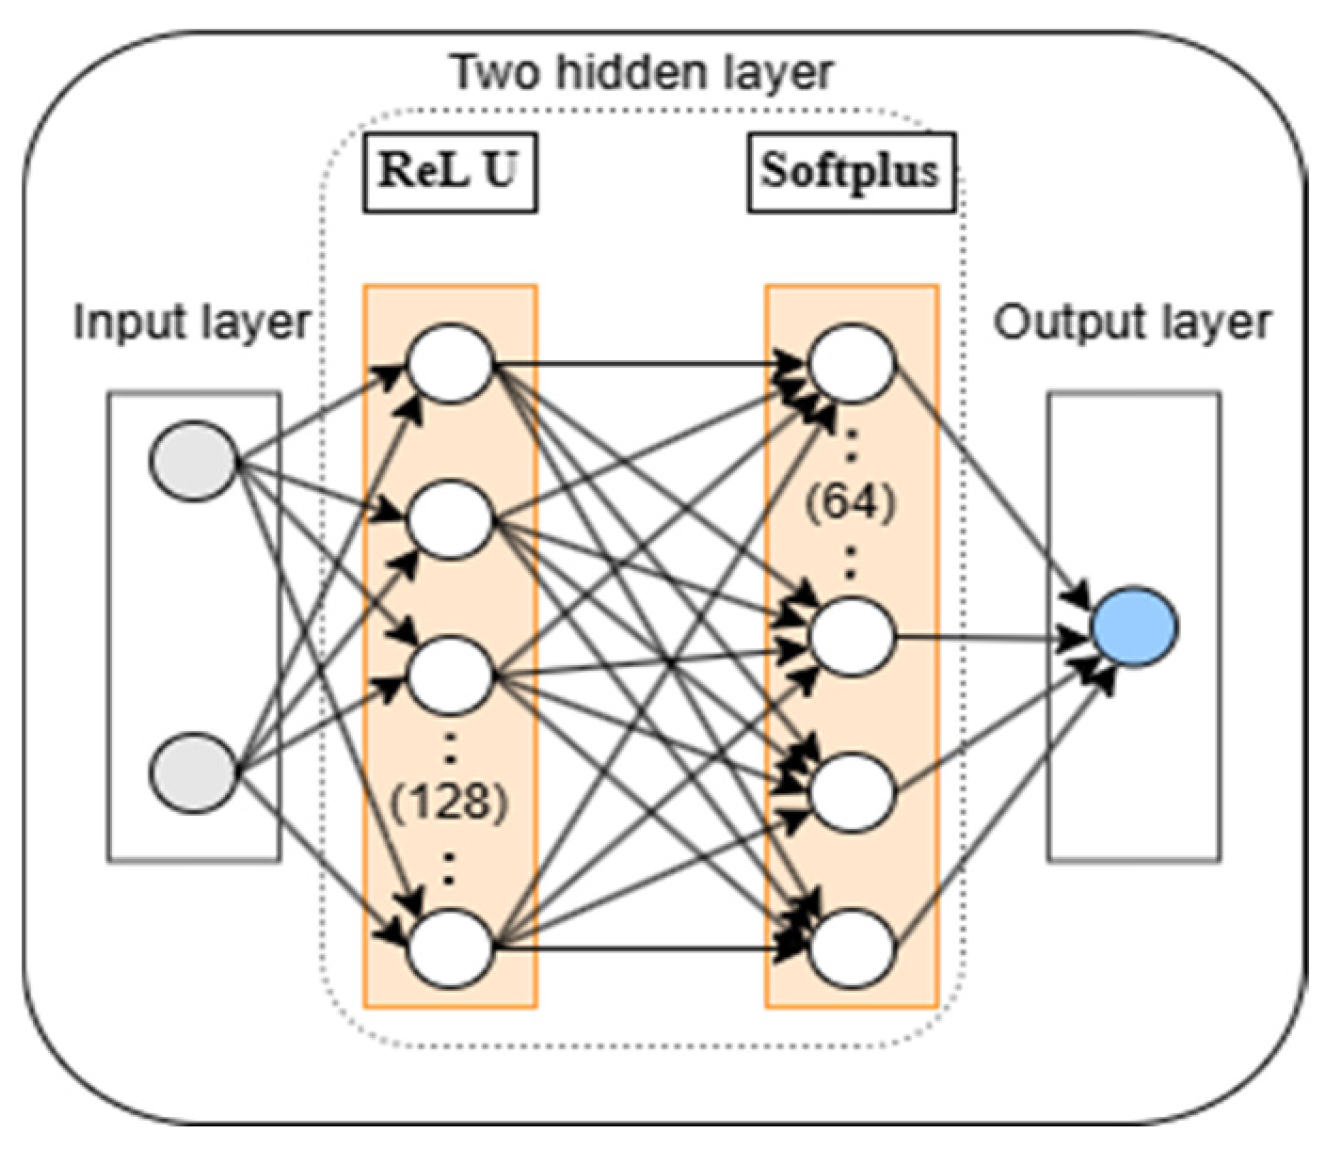
DNN is a type of artificial neural network that contains multiple hidden layers. It is widely applied in fields such as image recognition, speech recognition, and natural language processing. Its core mechanism lies in learning complex feature representations through multi-layer nonlinear transformations, and it relies on backpropagation and gradient descent for training, thus possessing strong feature learning capabilities. Its specific structure is shown in Figure 2. The DNN used in this paper has two hidden layers, where the input features are current and voltage, and the output layer corresponds to the stress of the active material.

3. Results and Discussion

3.1. Research on Battery Discharge Characteristics

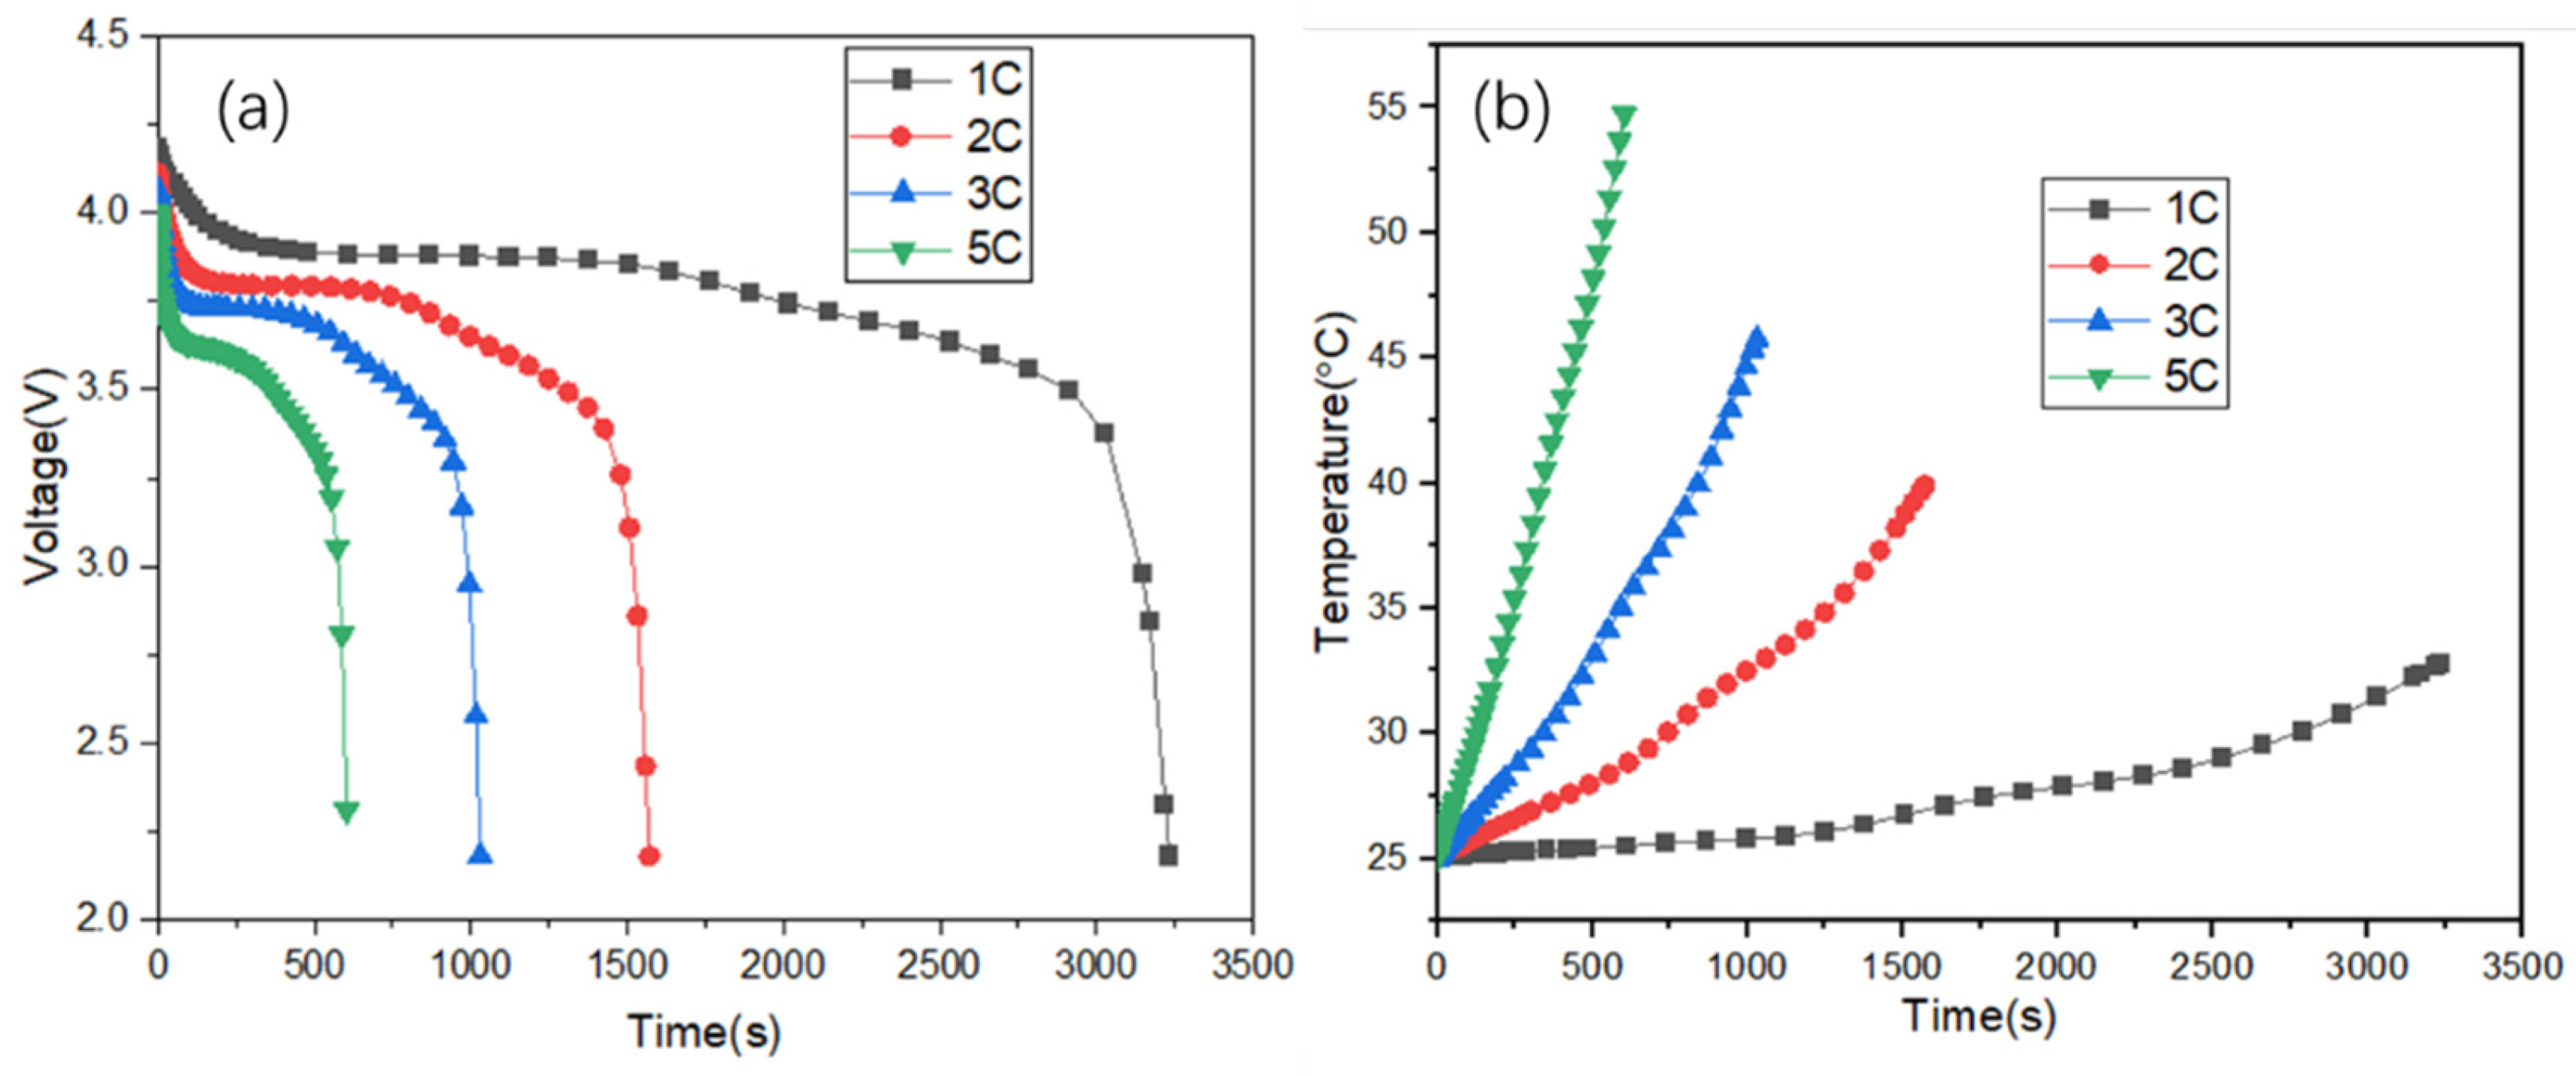
Figure 3a presents the constant-current discharge curves under rates of 1C, 2C, 3C, and 5C, with an initial discharge temperature of 25 °C (ambient temperature). As observed from the curves, the initial battery voltage is 4.2 V; as the discharge time increases, the battery voltage decreases until it reaches 2.2 V (the cut-off voltage for discharge). A positive correlation is evident: the higher the battery discharge rate, the faster the voltage drop rate.
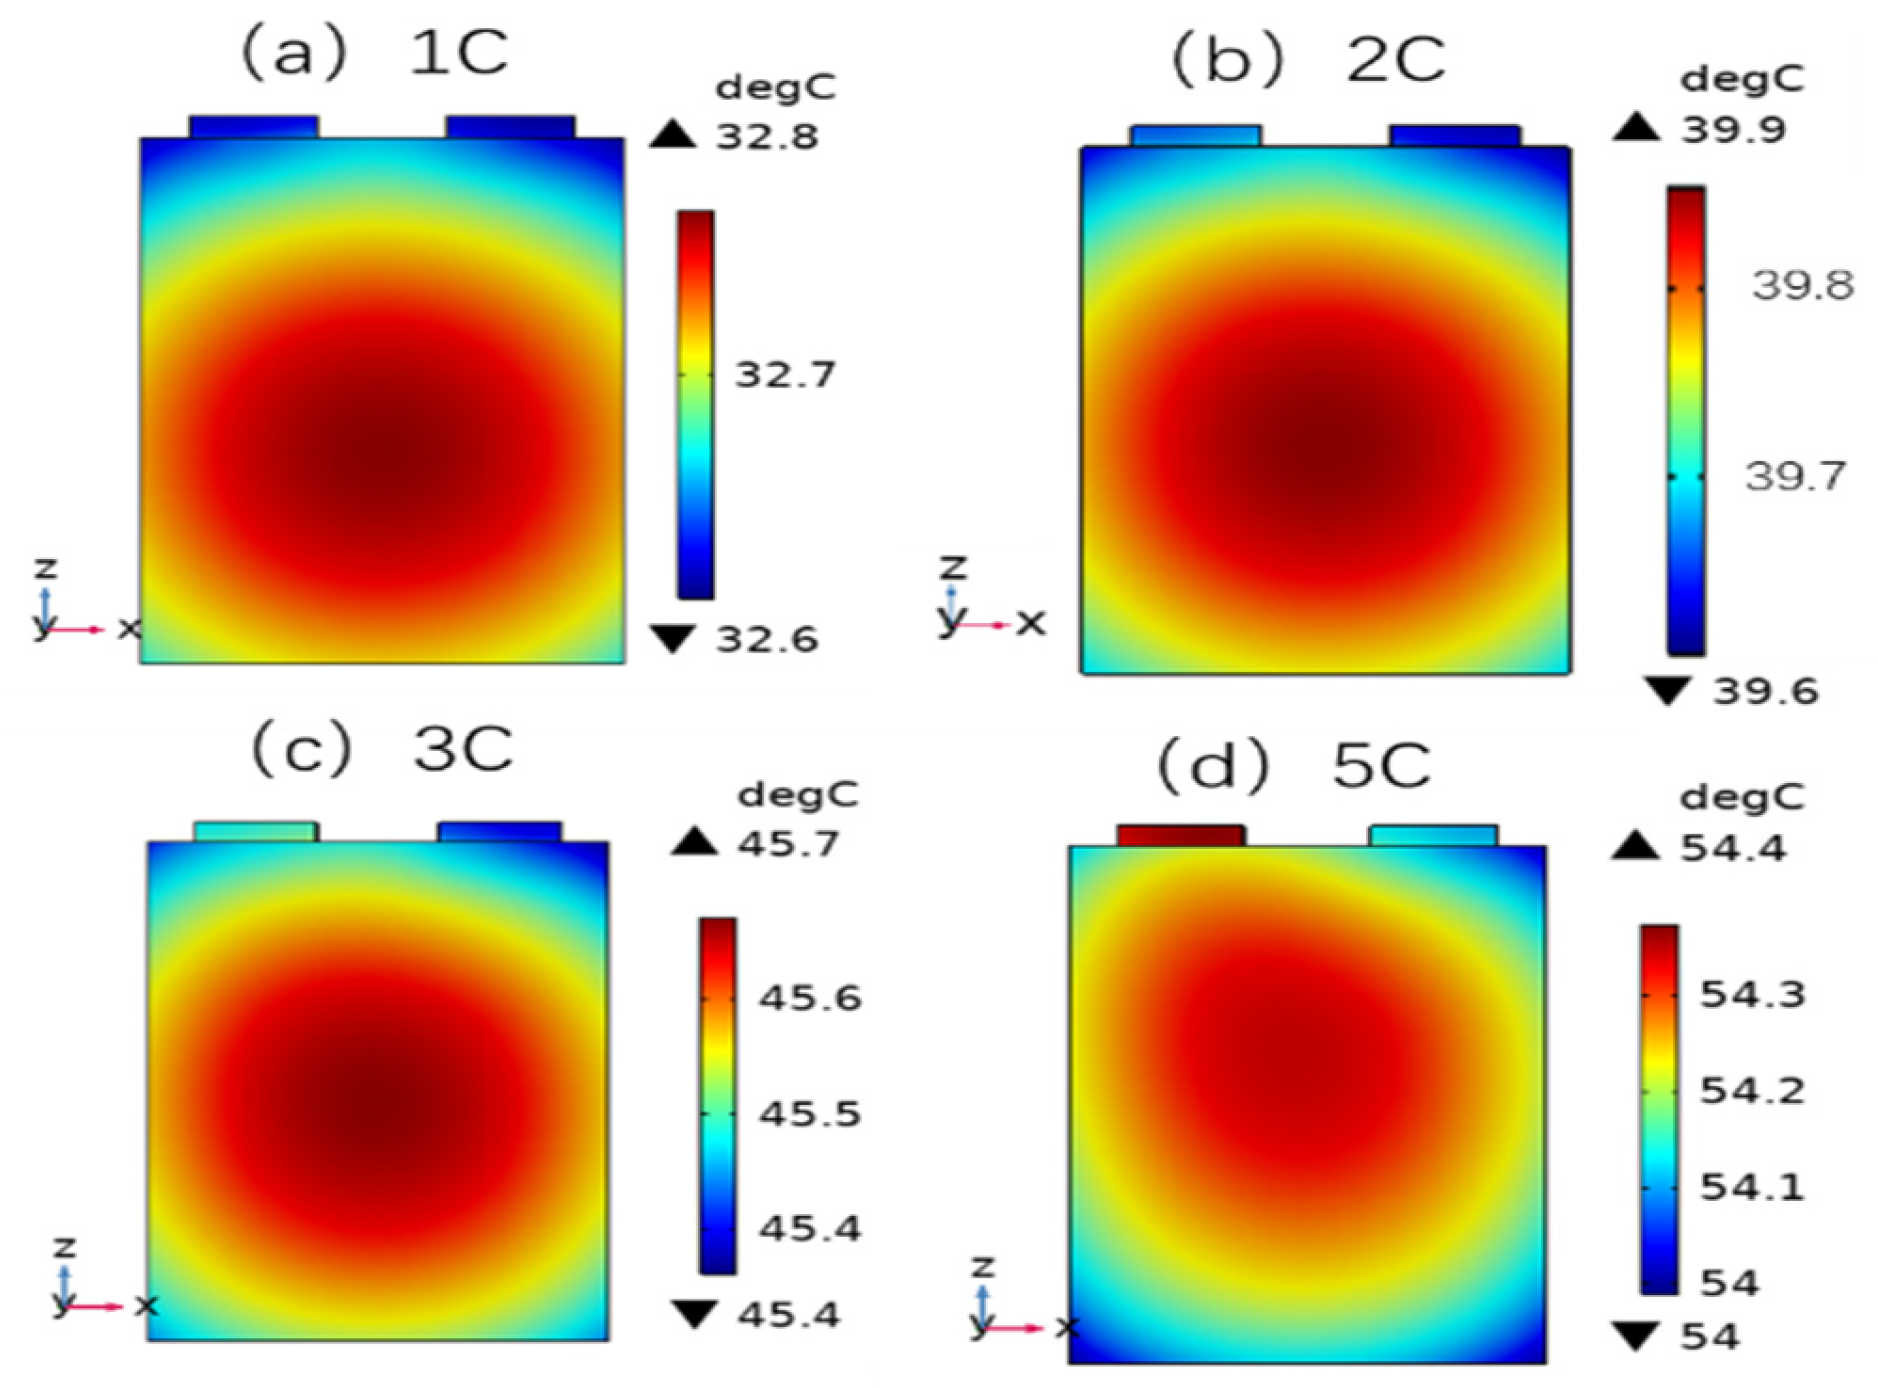
Figure 3b shows the variation curve of the battery’s maximum temperature over time. It can be seen from the curve that the battery temperature gradually increases as discharge proceeds. At the end of discharge under rates of 1C, 2C, 3C, and 5C, the maximum surface temperatures of the battery are 32.8 °C, 39.9 °C, 45.7 °C, and 54.4 °C, respectively. The temperature increases are 7.8 °C, 14.9 °C, 20.7 °C, and 29.4 °C, which closely aligns with the values reported in the literature [35,36]. This indicates that the battery is prone to thermal accumulation under high-rate discharge conditions. Notably, during the 5C discharge process, the battery temperature exceeds 50 °C (the suitable operating temperature for the battery), highlighting the need for battery thermal management.
Figure 4 shows the corresponding temperature contour plots. From the contour plots, it can be observed that under 1C, 2C, and 3C discharge rates, the maximum battery temperature occurs in the central core region of the battery. However, under the 5C discharge rate, the maximum temperature shifts to the battery’s tab region. This phenomenon is attributed to the fact that under high-rate discharge, the Joule heat generated by the battery tab resistance is significantly higher; thus, the tab region exhibits the highest temperature during high-rate discharge.

3.2. Research on Battery Charge Characteristics

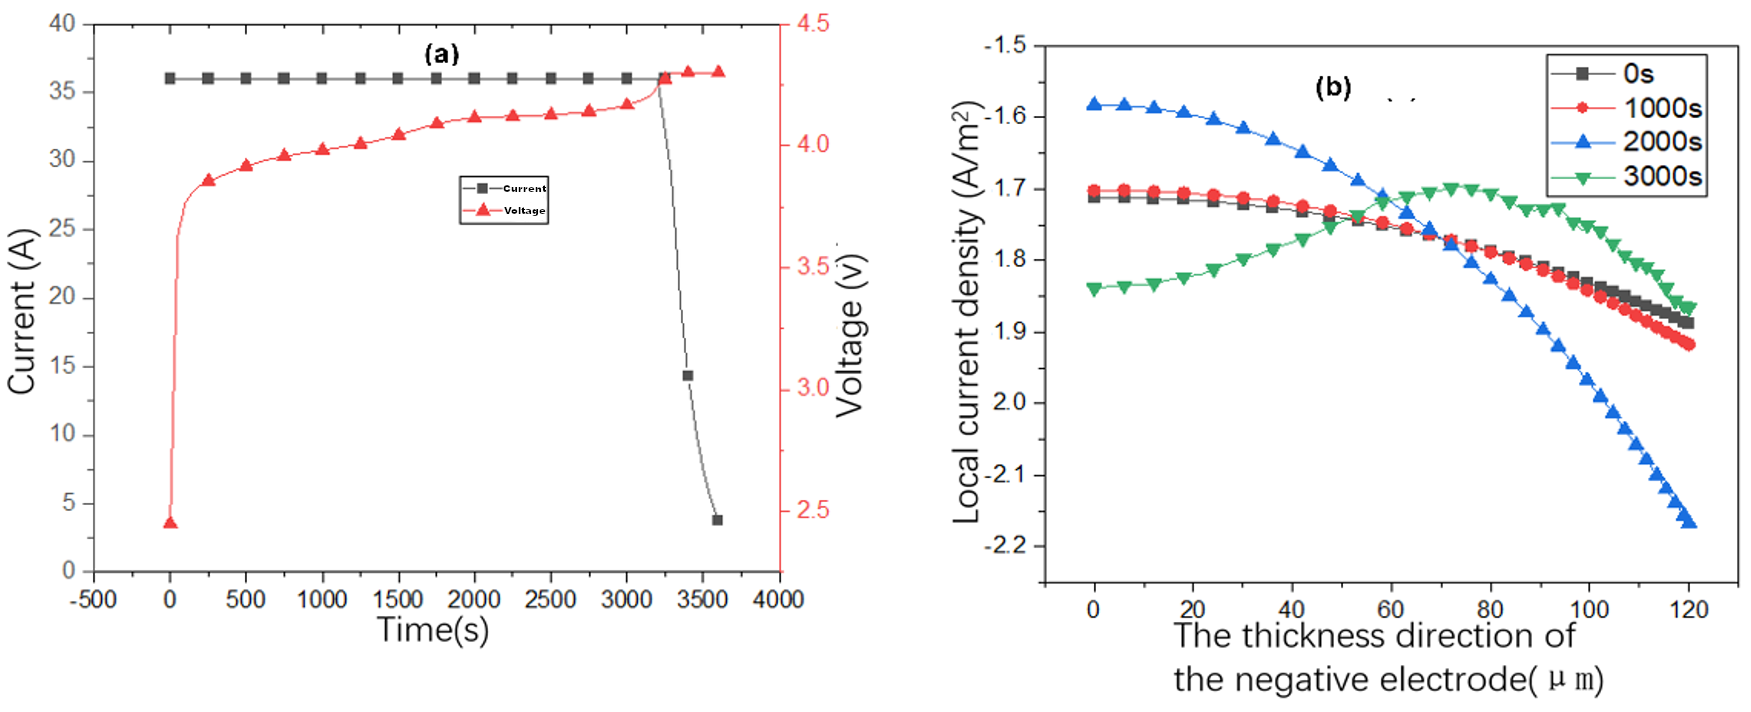
Figure 5a shows the variation curves of voltage and current during the 1C charging process. At the start of charging, the battery undergoes constant-current charging; when the battery voltage reaches 4.3 V, the charging mode switches to constant-voltage charging. During this constant-voltage phase, the battery charging current gradually decreases to 2 A.
Figure 5b presents the current density along the thickness direction of the anode at 0 s, 1000 s, 2000 s, and 3000 s during charging. It can be observed that the local current density is non-uniform along the anode thickness direction. At most time points, the local current density at the anode–separator interface is more negative than that at the anode–current collector interface. This indicates that the anode charging process is not uniform: the state of charge (SOC) of particles at the anode–separator interface reaches saturation earlier than that of particles at the current collector interface. Local lithium supersaturation can lead to stress concentration and lithium plating, accelerating battery aging [3].

3.3. Influence of Different Charging Temperatures on the Concentration and Stress of Active Particles

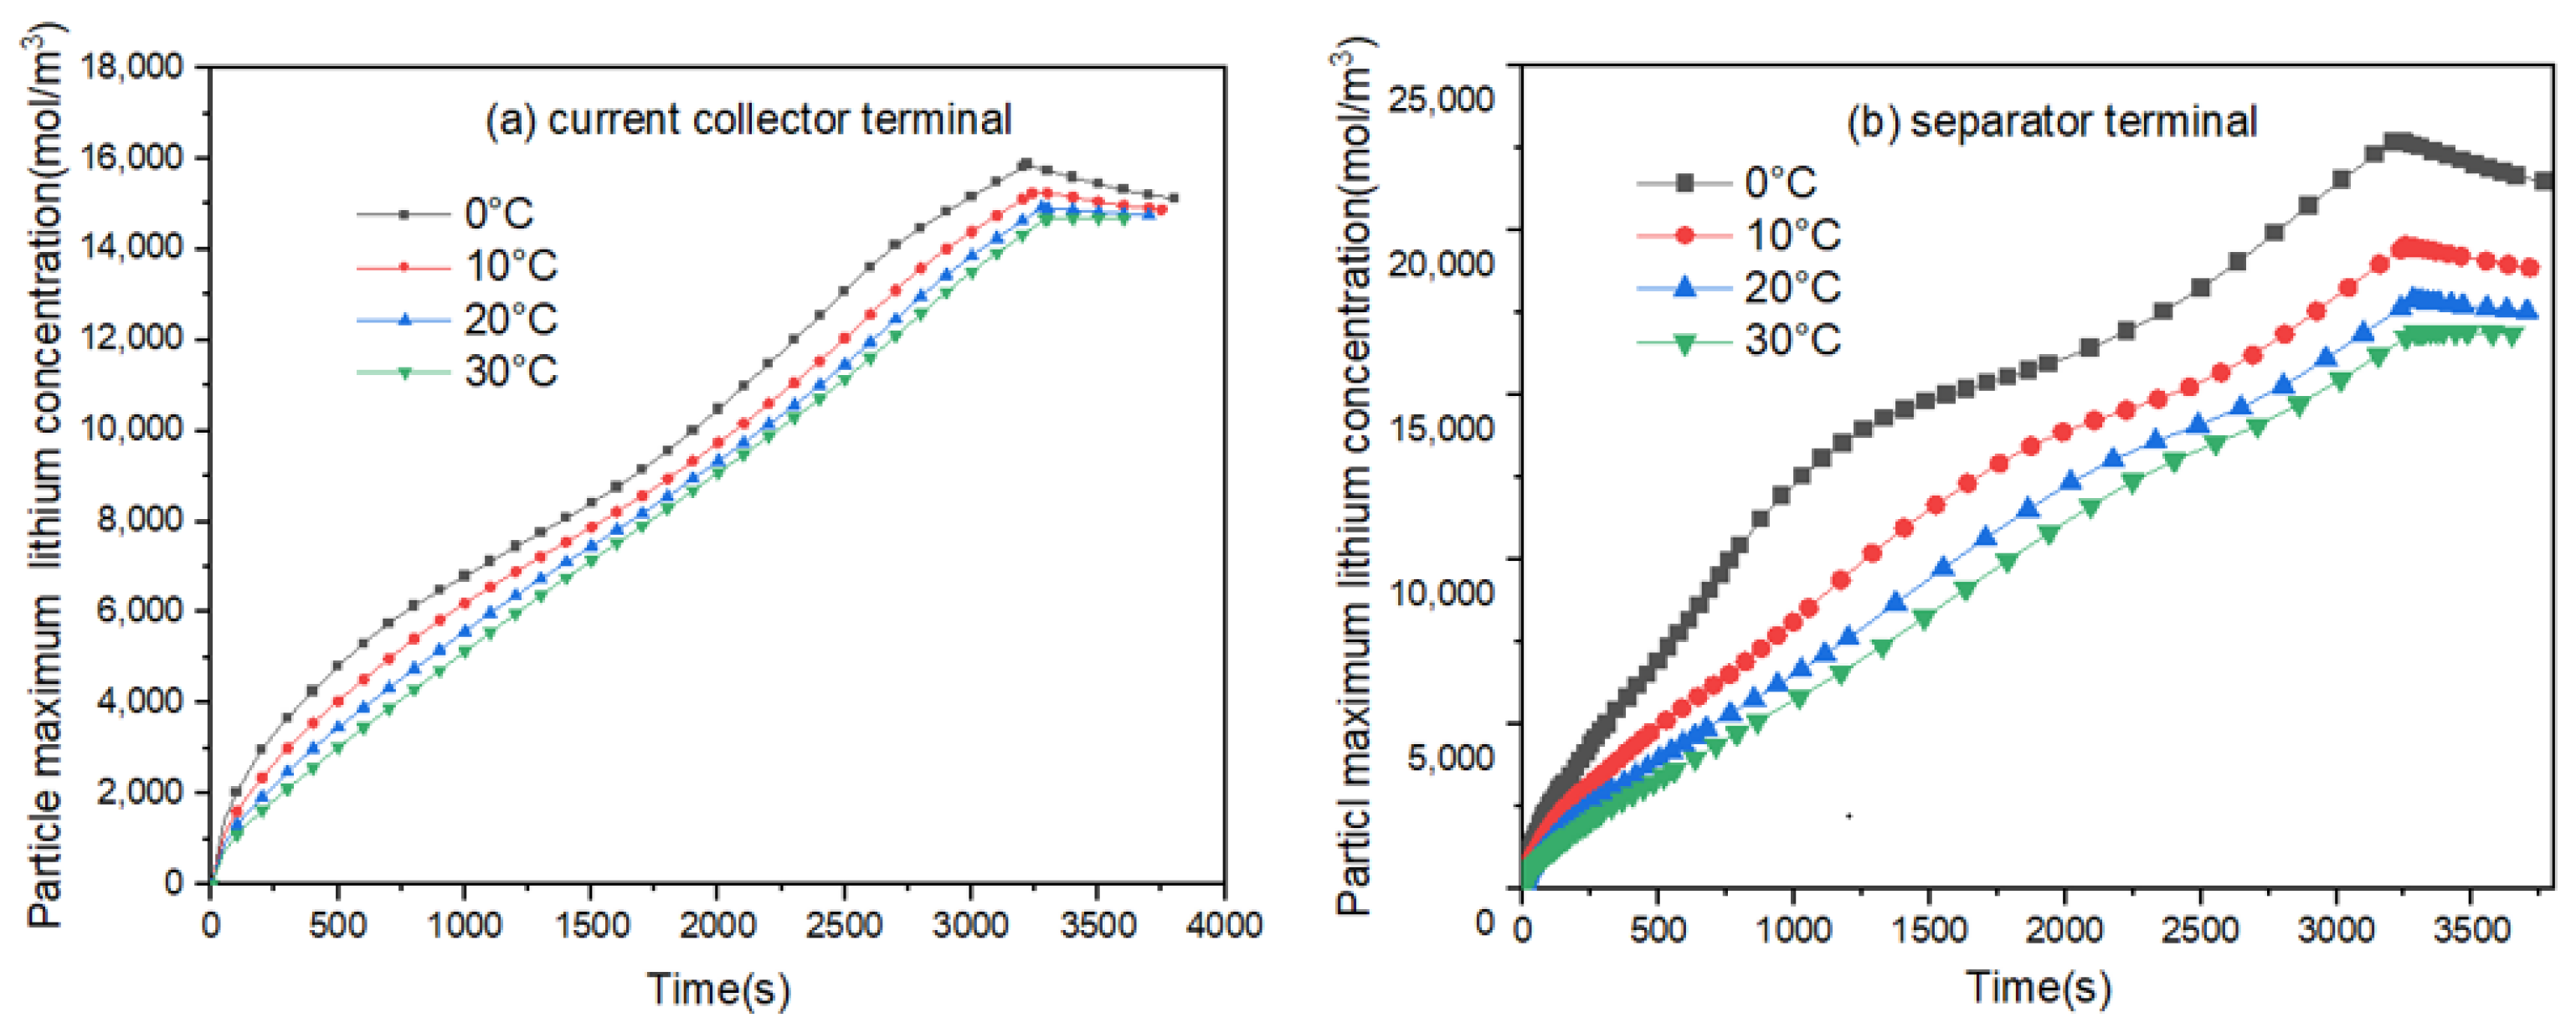
Figure 6a,b shows the concentration variation curves over time during charging at 0 °C, 10 °C, 20 °C, and 30 °C under the 1C rate, corresponding to the current collector side and separator side, respectively. In the initial charging stage, the maximum lithium intercalation concentration in particles on both the current collector side and separator side increases with charging time. However, at approximately 3200 s, the concentration reaches a maximum, after which the curve values decrease slightly. This phenomenon occurs because the battery switches from constant-current charging to constant-voltage charging: the current density decreases, reducing the diffusion flux of lithium ions intercalating into the surface of active particles. Additionally, the self-diffusion of lithium ions driven by the chemical potential gradient further contributes to the reduction in the maximum concentration within the particles.
As observed from the curves, the maximum internal concentration of active particles increases sequentially with decreasing charging temperature. This indicates that during low-temperature charging, local regions inside the particles are more likely to reach lithium-ion saturation.
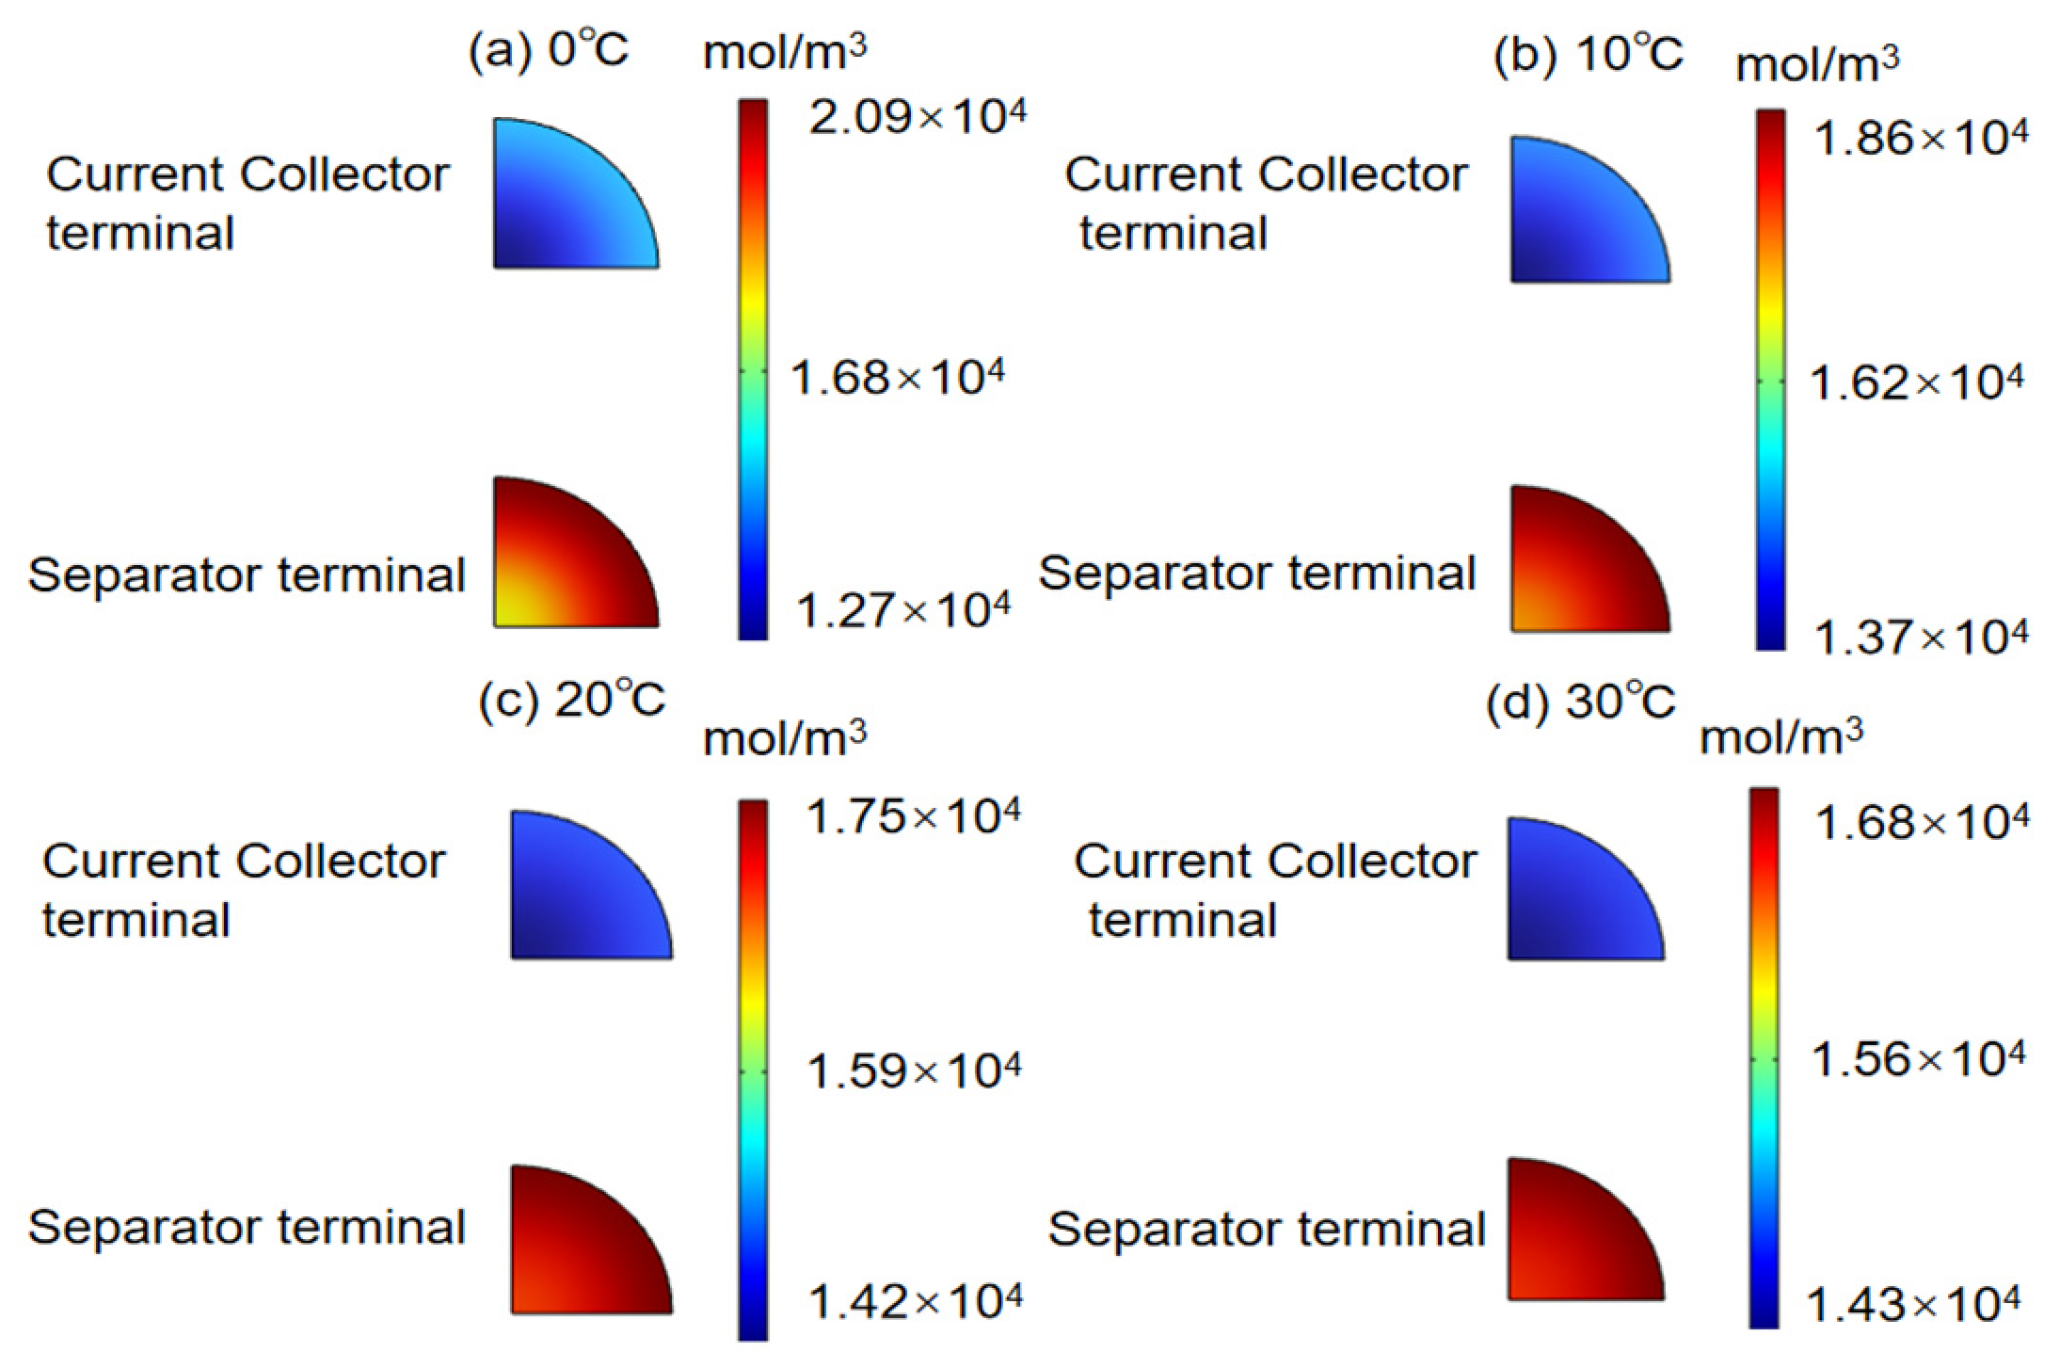
Figure 7 presents the concentration distribution contour plots at the end of charging at 0 °C, 10 °C, 20 °C, and 30 °C. From the contour plots, two key observations can be made:
(i)
The lithium concentration on the surface of particles (both on the current collector side and separator side) is higher than that at the center of the particles.
(ii)
The overall concentration of anode active particles near the separator side is higher than that on the current collector side.
These results demonstrate the inhomogeneity of lithiation in graphite particles during charging: graphite particles closer to the separator side sustain the highest lithium flux, while the lithium flux decreases progressively along the electrode thickness toward the current collector side, resulting in a lower degree of lithiation in particles on the current collector side.
A comparison of the maximum and minimum lithiation concentrations under different temperatures reveals that charging at 0 °C leads to the most inhomogeneous lithiation, with the largest concentration difference being 0.82 × 10⁴ mol/m3 (as shown in Figure 7a). The uniformity of lithiation improves with increasing charging temperature, with a concentration difference of 0.25 × 10⁴ mol/m3 observed at 30 °C (as shown in Figure 7d).
Figure 8 shows the curves of maximum tangential stress versus time for particles at the current collector side and separator side during 1C charging. The stress variation trend is characterized by a rapid increase at the start of charging, a slow change in the middle stage, and a rapid decrease toward the end of charging.
Under charging conditions of 0 °C, 10 °C, 20 °C, and 30 °C, the peak stresses on the anode current collector side are 71.7 MPa, 50.6 MPa, 34.2 MPa, and 22.5 MPa, respectively, while the stresses on the separator side are 123.7 MPa, 72.1 MPa, 40.7 MPa, and 24.3 MPa, respectively. These results indicate that larger circumferential stresses are generated inside the active particles during low-temperature charging.
According to the Arrhenius equation describing the relationship between lithium-ion diffusion coefficient and temperature, a decrease in temperature leads to a reduction in the diffusion rate of lithium ions inside the active particles. This results in an increased concentration gradient within the particles, which in turn causes an increase in circumferential stress as per the stress–concentration relationship (Equation (7)).
Additionally, a comparison of stresses on the anode separator side and current collector side reveals that the peak stress on the separator side is higher than that on the current collector side during charging. This suggests that anode particles are more prone to fatigue failure at the separator interface, particularly during charging in low-temperature environments. The results align with those in [13,15].
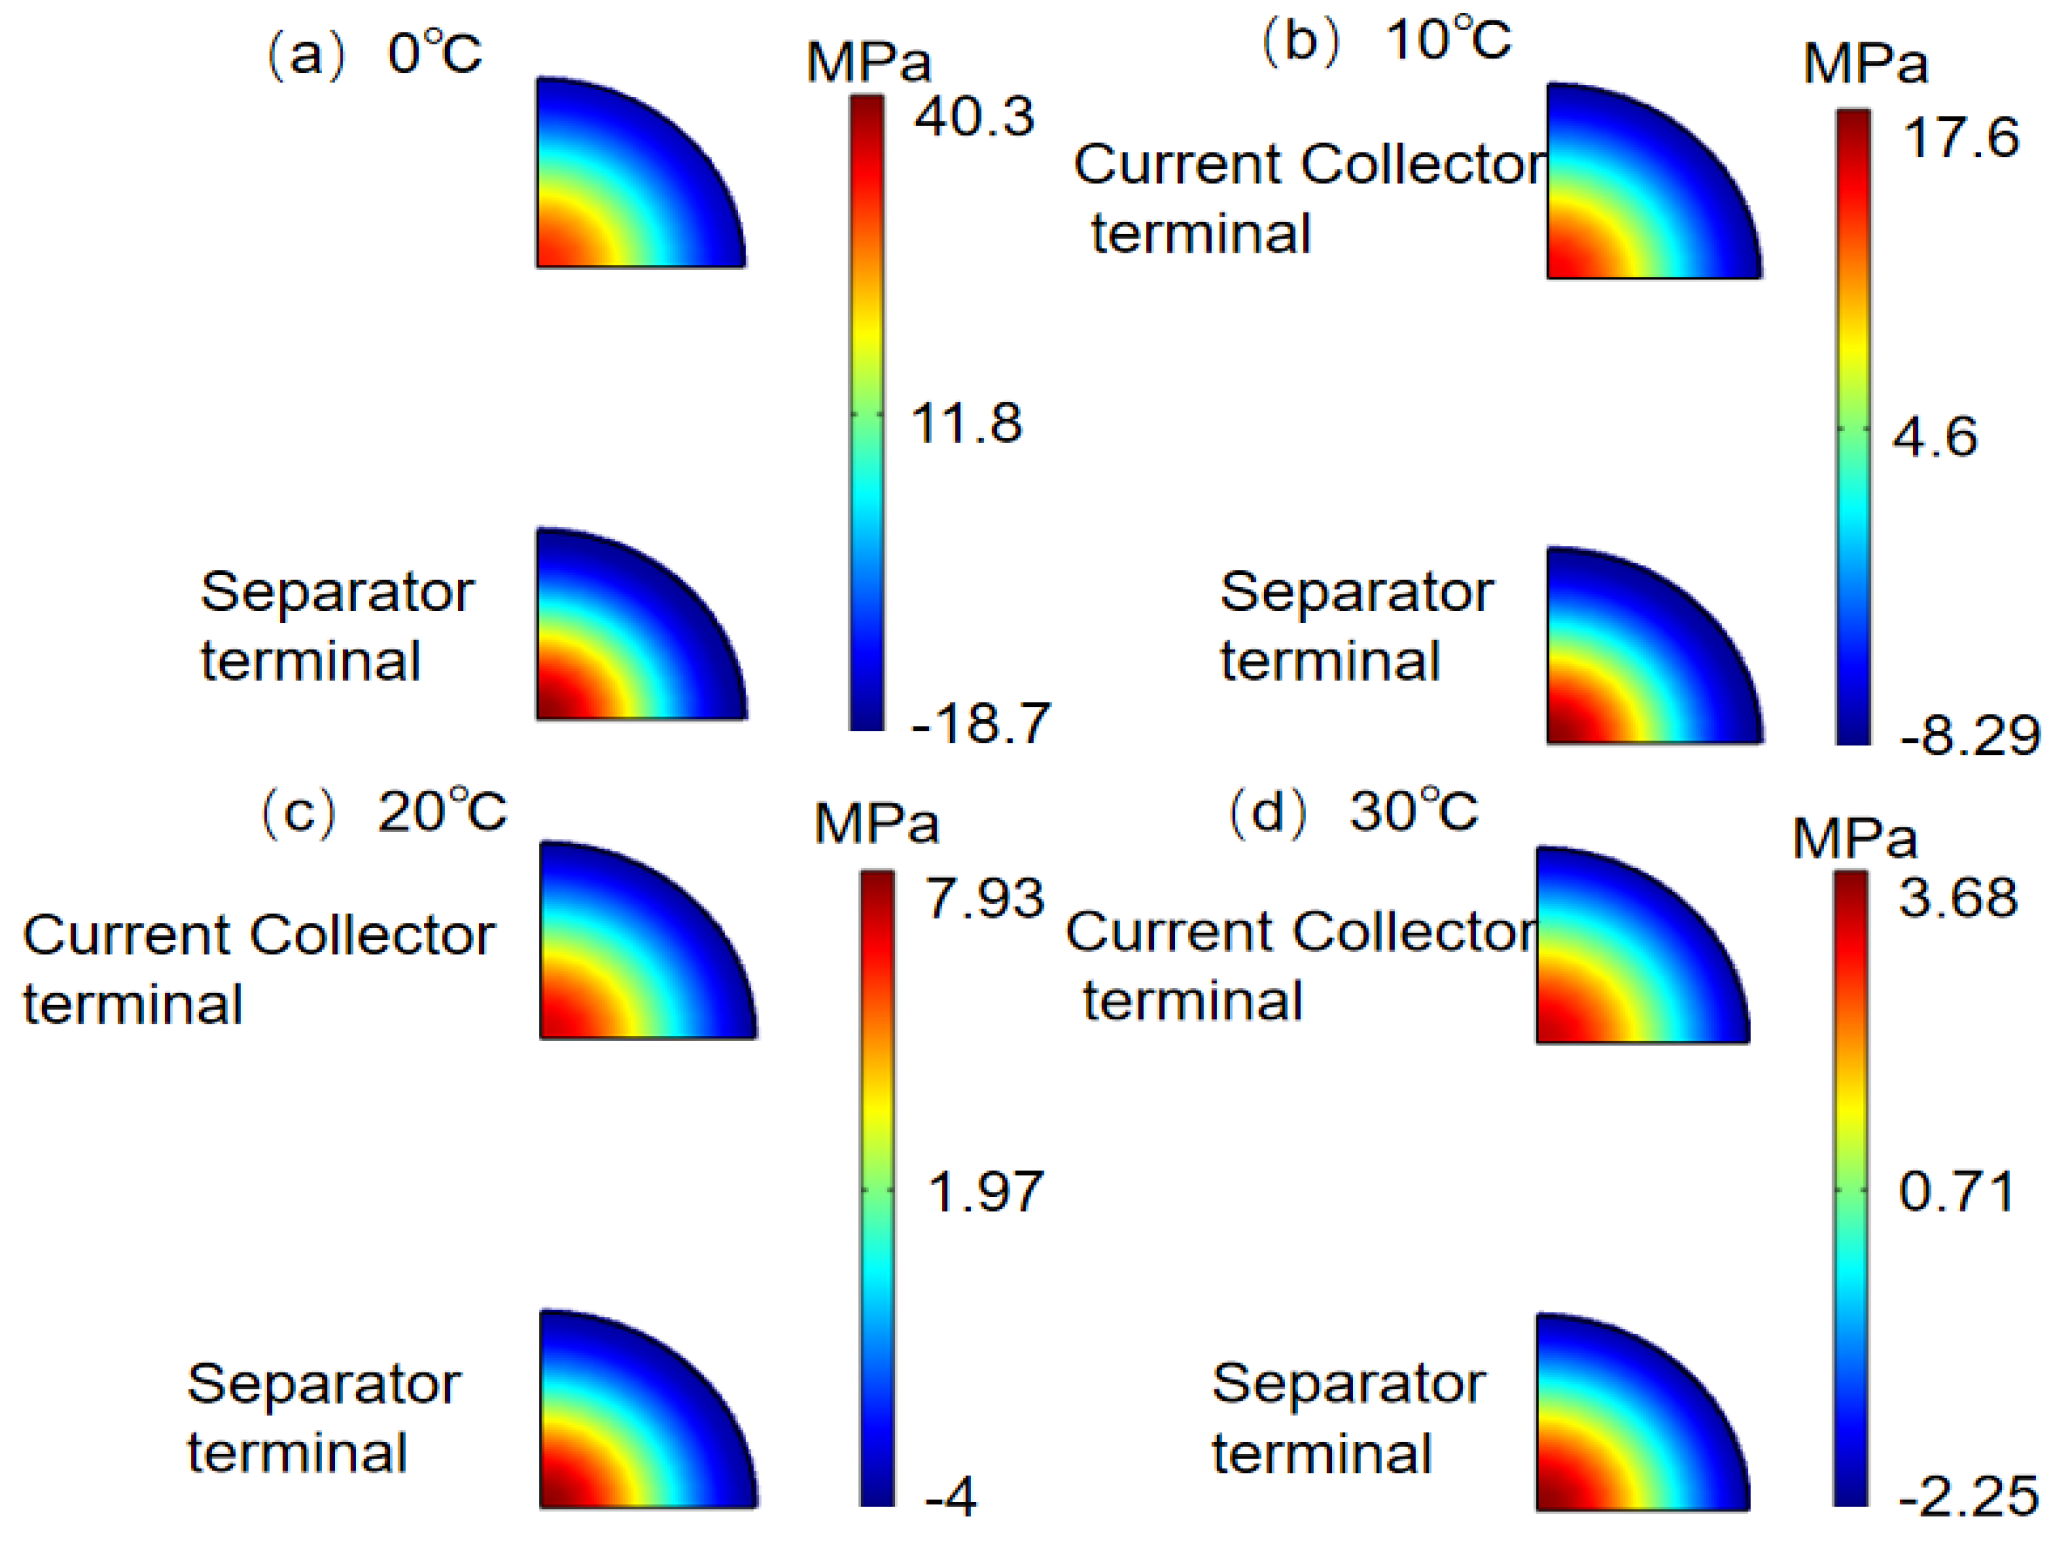
Figure 9 presents the stress distribution contour plots at the end of charging. From the contour plots, it can be observed that the maximum circumferential stress occurs at the central core of the particles and is positive, indicating that the particle core is subjected to tensile stress. In contrast, the minimum circumferential stress appears at the particle surface and is negative, meaning the particle surface experiences compressive stress.
A comparison of particle stresses between the current collector side and separator side (from the contour plots) shows that particles on the battery separator side exhibit higher stress. These observations collectively suggest that particles are most prone to cracking on the separator side, particularly in their central regions. This conclusion is consistent with the findings in the literature [14].

3.4. Influence of Different Charging Rates on Solubility, Stress, and Lithium Plating of Active Particles

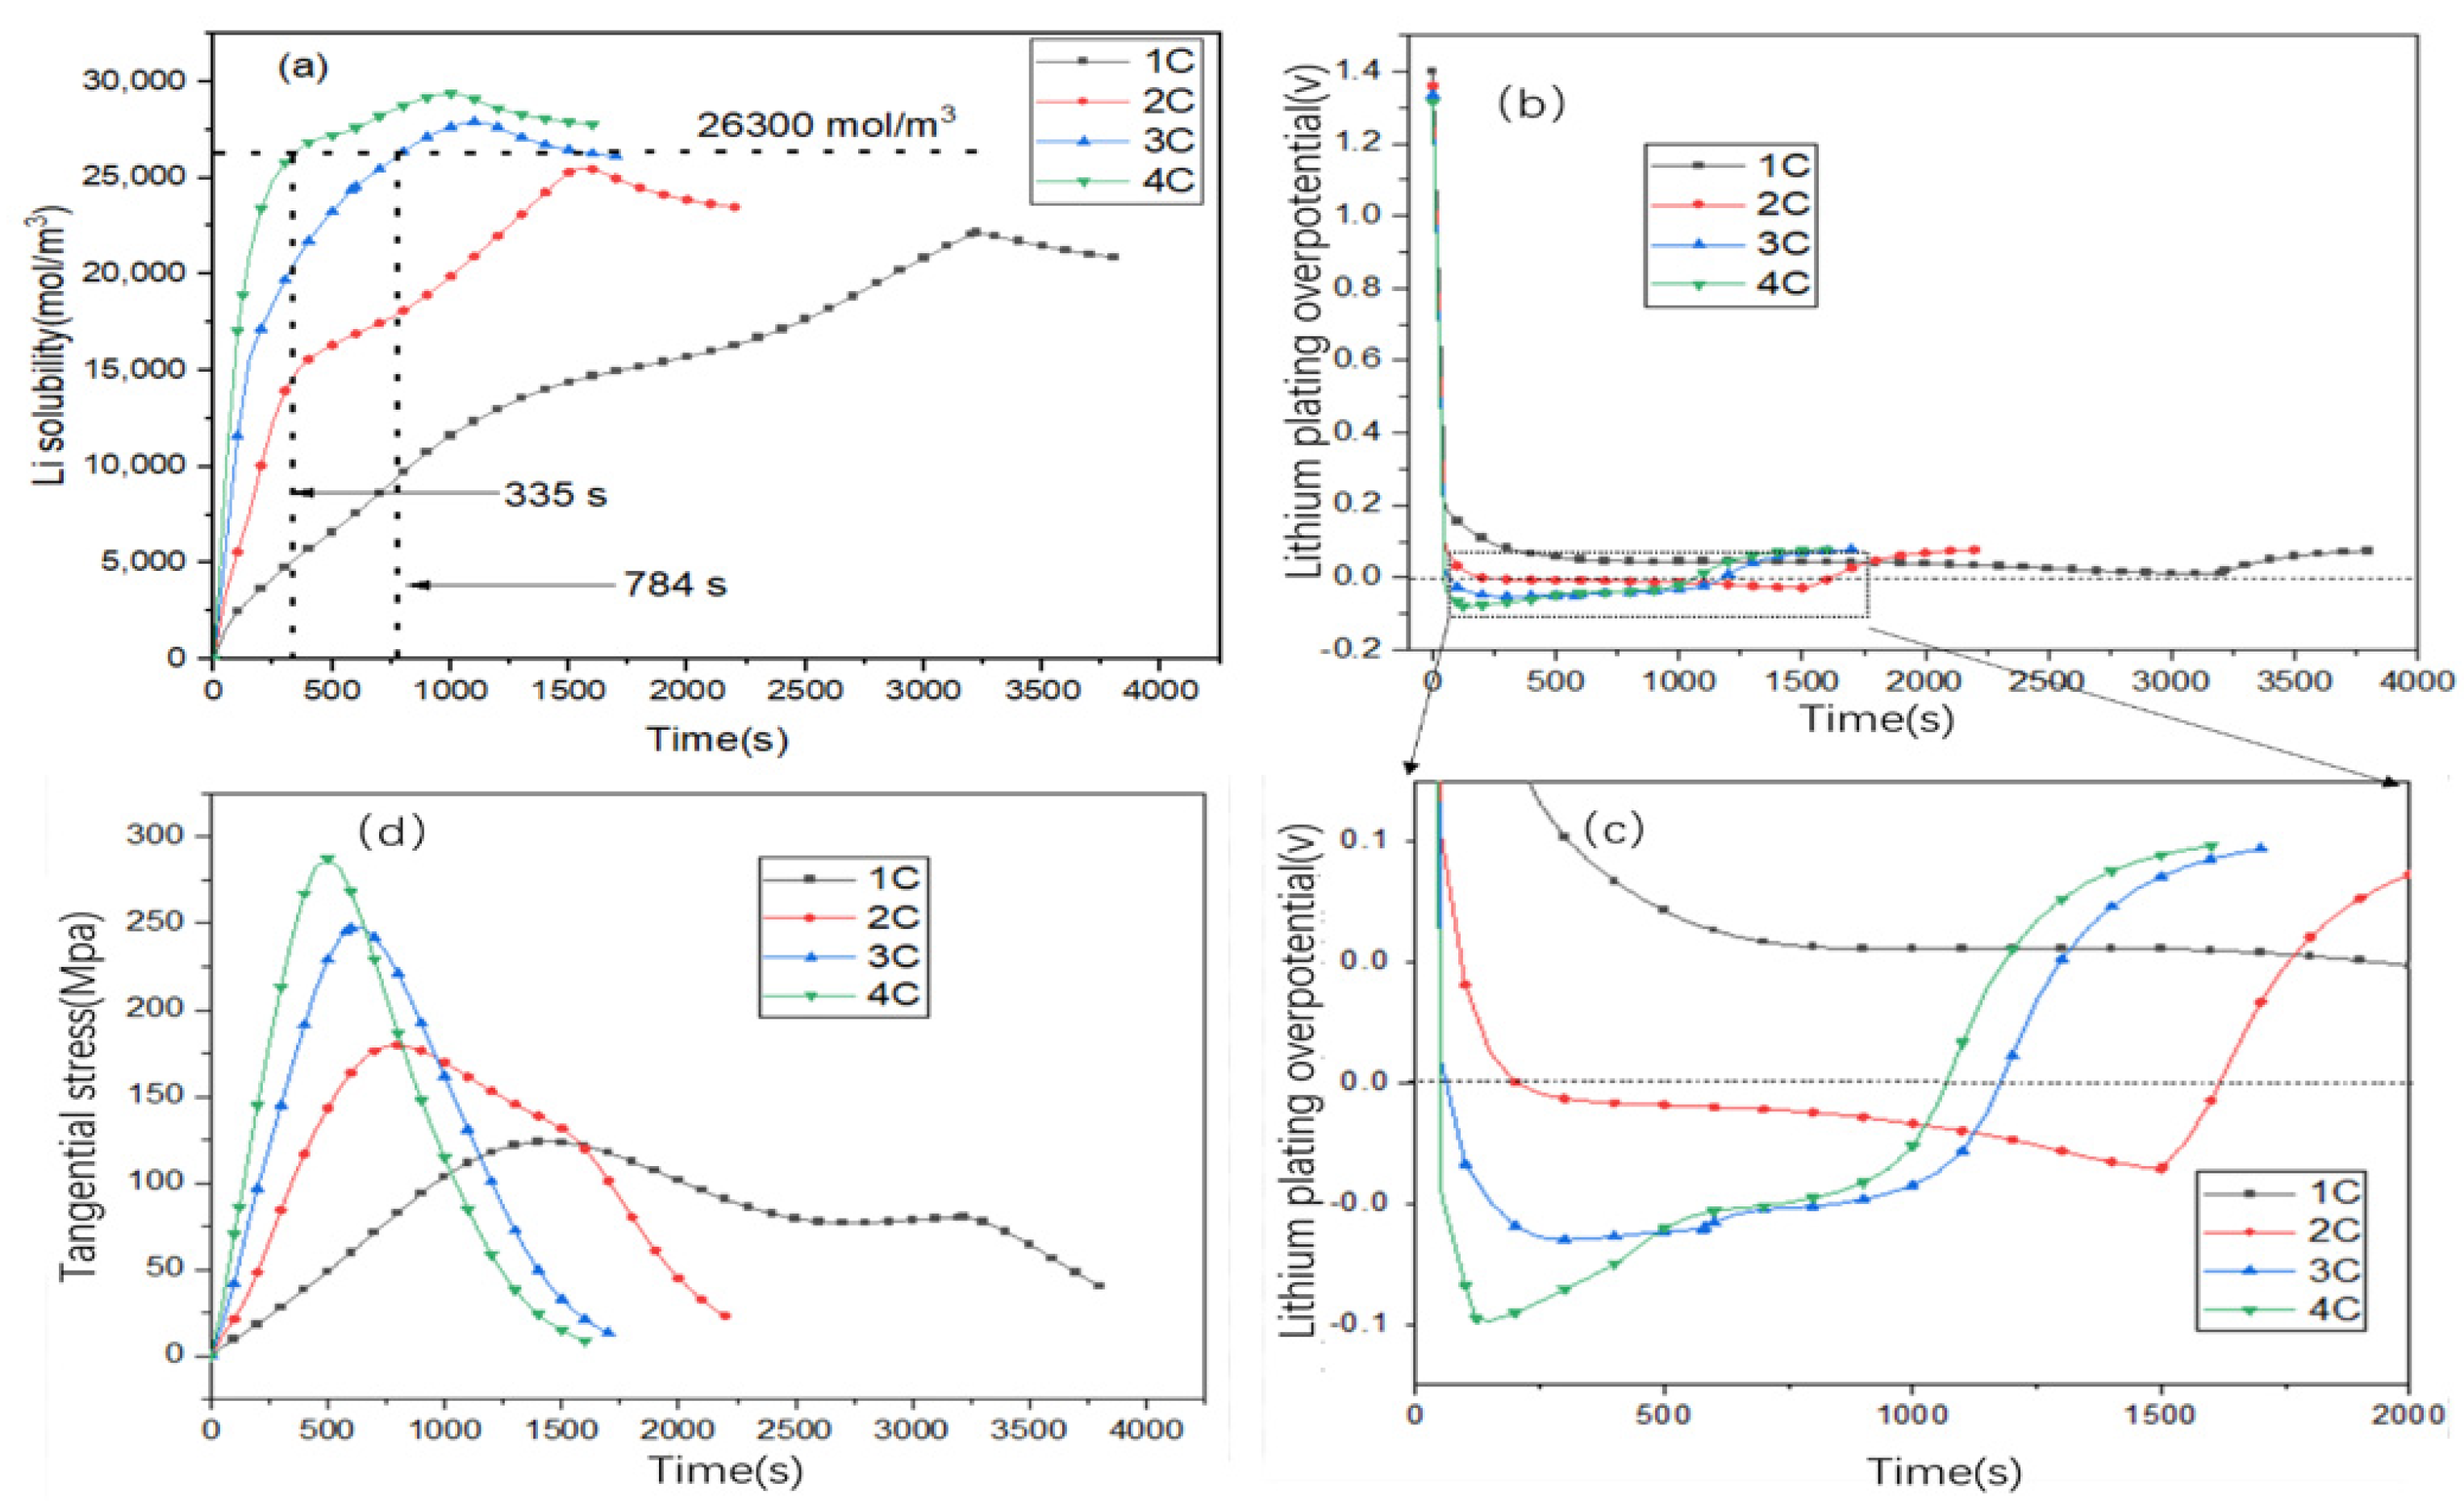
From the above analysis, it can be observed that the active particles at the anode–separator interface exhibit the highest concentration and stress. Therefore, the following focuses primarily on these particles. The maximum concentration of particles at the anode–separator interface is shown in Figure 10a: during the constant-current charging stage, the particle concentration increases; during the constant-voltage stage, the maximum concentration of active particles gradually decreases. Notably, under the 3C and 4C charging rates, the maximum concentration of anode particles exceeds 26,300 mol/m3 at 784 s and 335 s, respectively. This indicates that the particles on the anode surface have reached saturation.
According to the lithium plating criterion, metallic lithium plating occurs when particles reach lithium intercalation saturation or when the interfacial overpotential drops below 0 V. The overpotential equation is as follows [3]:
η L i = φ s φ e U L i U S E I
In this equation, φ s   and φ e represent the solid- and liquid-phase potential, respectively; ULi is the equilibrium potential of the lithium plating reaction, whose value is generally considered to be zero; and U S E I is the voltage drop across the solid electrolyte interphase (SEI) film. Since the effect of the SEI film is not considered in this study, U S E I is neglected. Thus, the value of this overpotential is as follows [3]:
η L i = φ s φ e
According to Equation (12), if the value of the overpotential is less than zero, it indicates the occurrence of lithium plating. From the overpotential curve in Figure 10b, it can be observed that lithium plating initiates at 48 s and 61 s under 3C and 4C charging rates, respectively. When comparing this timing with the moment when the concentration curve exceeds the maximum saturation concentration, it is evident that the overpotential criterion is more sensitive for determining lithium plating.
Figure 10d shows the lithium-ion stress curves under 1C, 2C, 3C, and 4C charging rates at an ambient temperature of 0 °C. As the charging rate increases, the internal stress of the active particles increases. However, once the stress reaches its maximum value, it gradually decreases. This stress reduction is attributed to the decrease in the lithium-ion concentration gradient, which leads to a corresponding decrease in stress (consistent with the stress–concentration relationship established earlier).

3.5. Potential Relationships Between Different Factors and Degradation Mechanism

As shown in Figure 11, at low temperatures, the electrochemical reaction rate of the battery slows down, and the solid-phase diffusion coefficient decreases, leading to a reduction in the diffusion rate of lithium ions inside the solid-phase particles. This increases the solubility gradient within the particles, thereby increasing particle stress. On the other hand, under high-rate charging, the local current density on the surface of active particles increases and the diffusion flux rises. Lithium ions cannot diffuse into the particle interior in a timely manner, causing them to accumulate on the surface of active particles at the negative electrode separator end. When the surface solubility of the particles exceeds the saturation solubility or the surface overpotential is less than zero, lithium will deposit on the surface of negative active particles (separator end).

3.6. Stress Estimation

The DNN algorithm was employed to predict lithium-ion stress during the charging process. The DNN network structure consists of one input layer, two hidden layers, and one output layer, with the hidden layer sizes set to 128 × 64. The hyperparameters of the DNN are presented in Table 3.
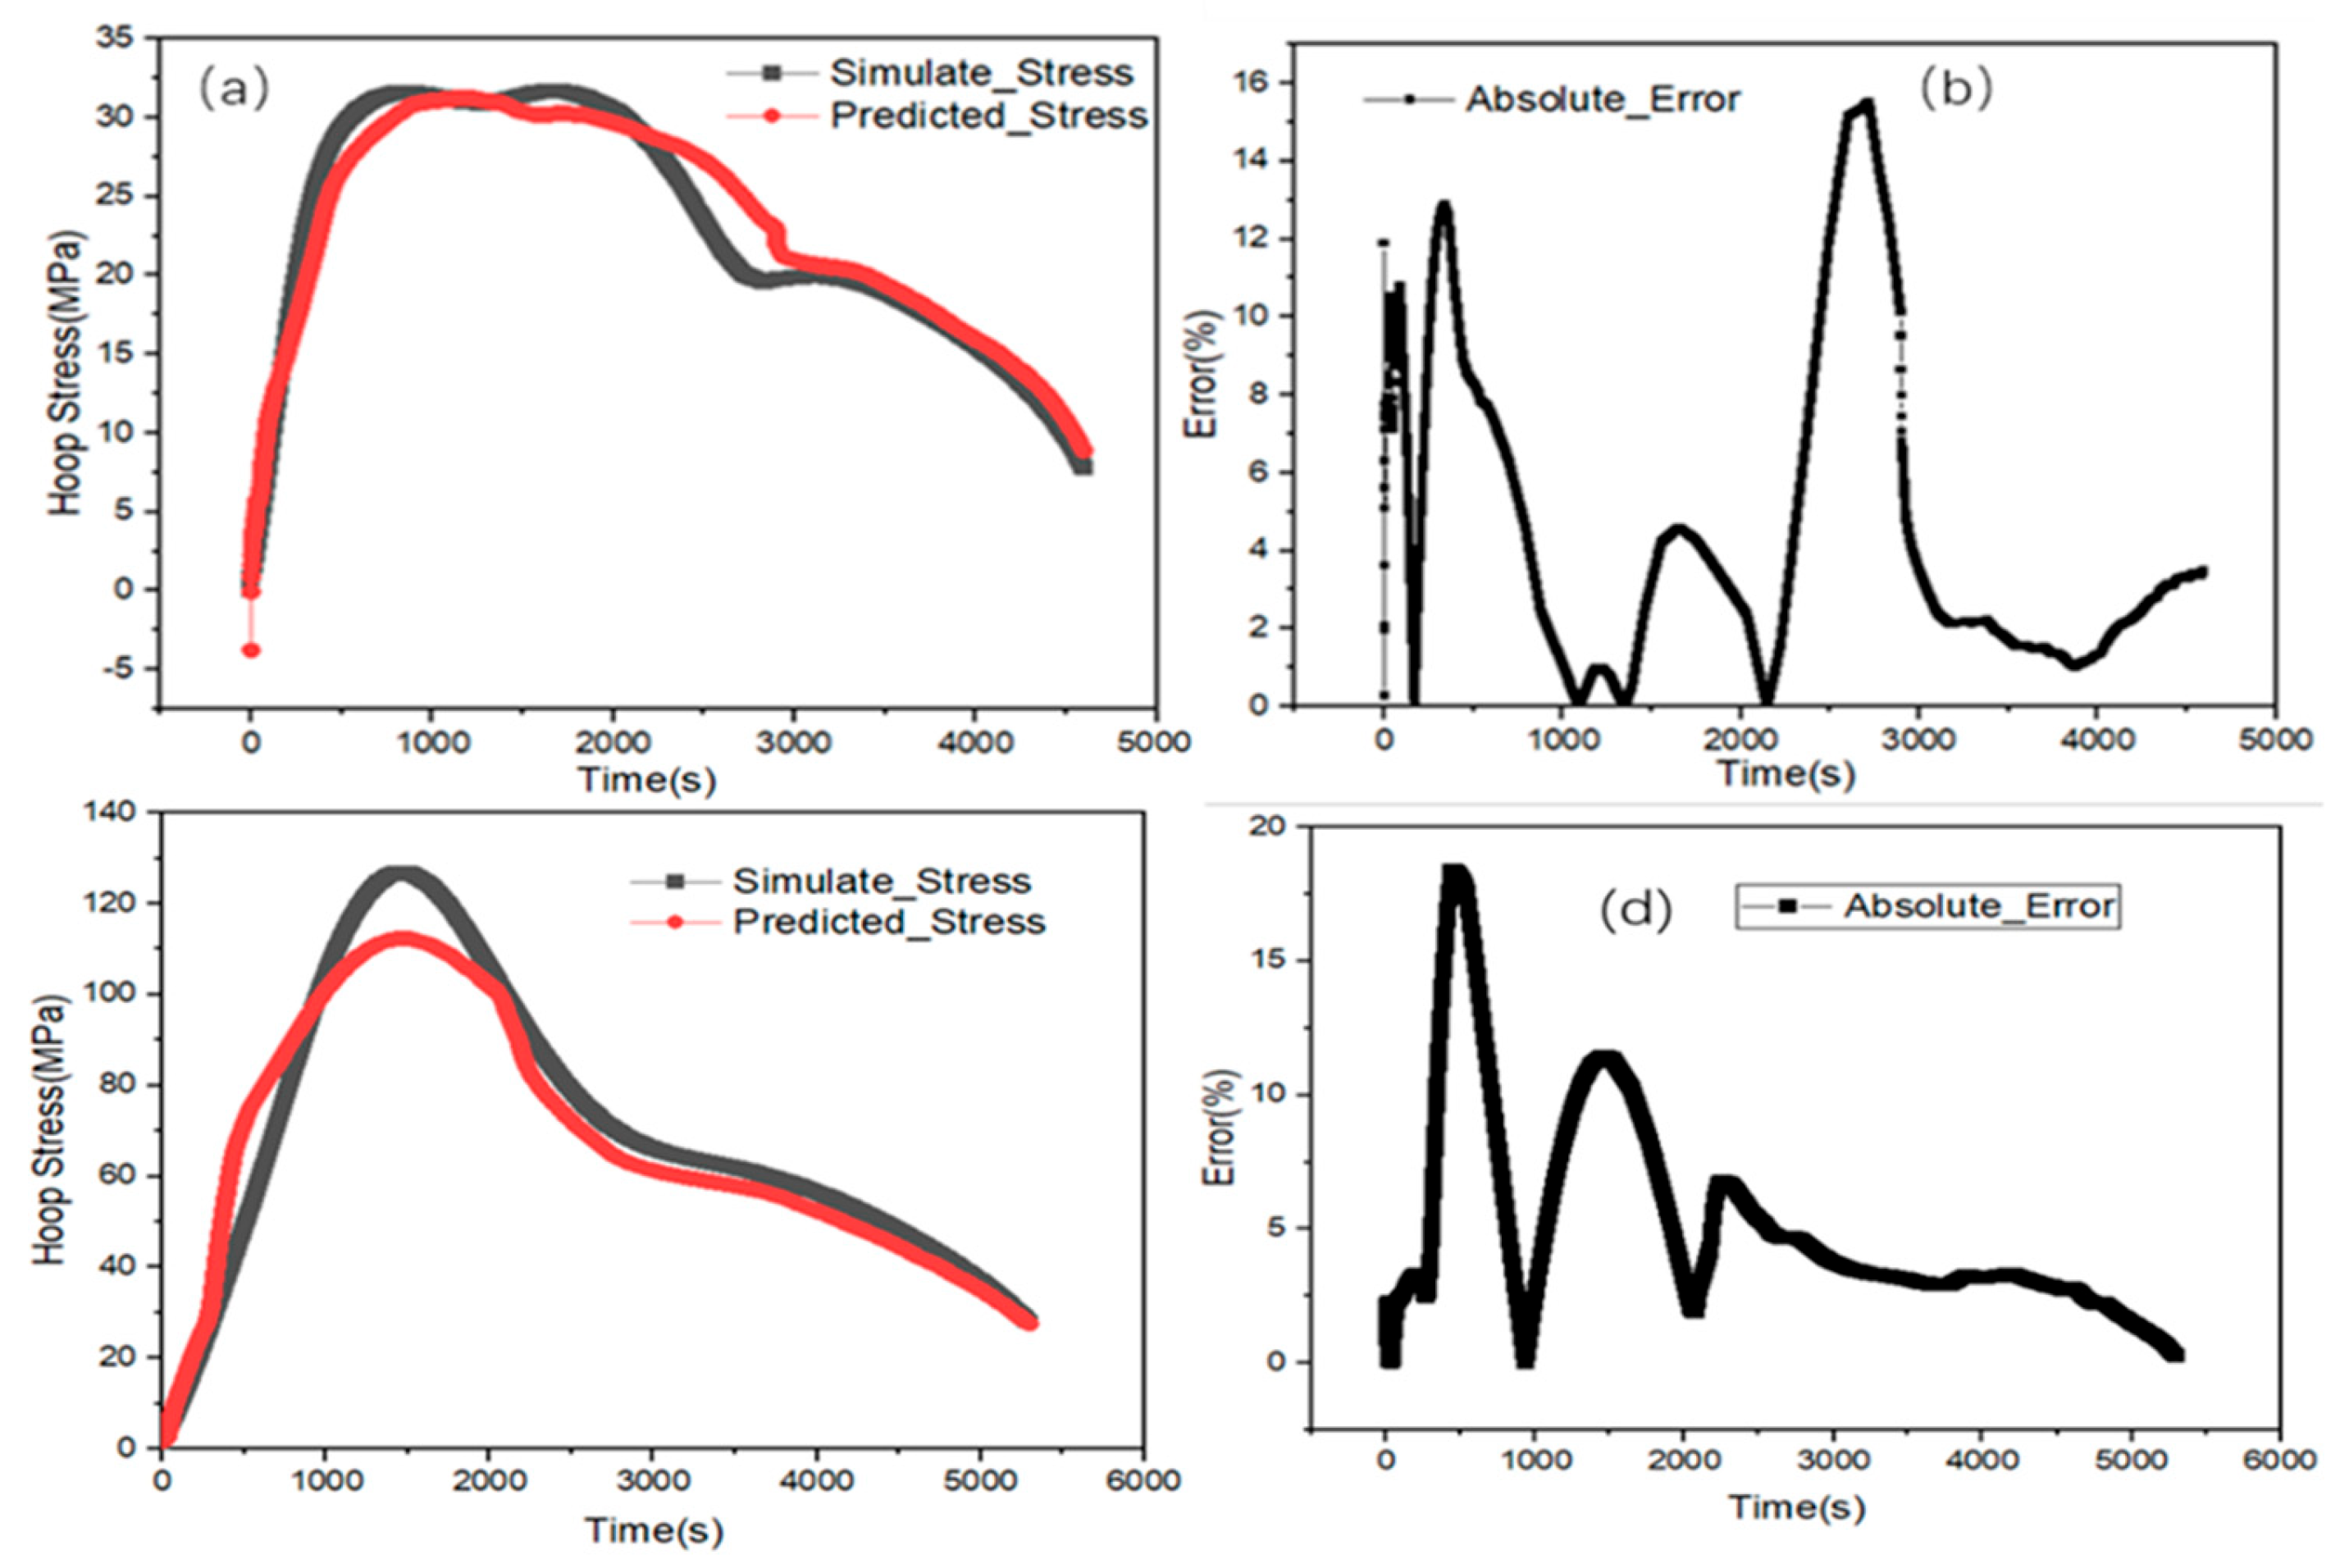
The training dataset for the DNN included charging data under operating conditions of −10 °C, 10 °C, 20 °C, and 30 °C, with voltage and current as the input features. The training data for voltage ranges from 2.5 V to 4.2 V, the temperature range is from −10 °C to 30 °C, and the current is held constant at 36 A. The DNN was then used to predict active particle stress under charging conditions of a rate of 1C and at 25 °C and 0 °C. Figure 12 shows the prediction results for active particles in lithium-ion batteries.
From the 25 °C prediction results (Figure 12a,b), it can be observed that the DNN algorithm achieves good prediction performance for active particle stress at the start and end stages of charging. However, during the middle stage of charging, the prediction results exhibit a larger error, with the maximum error approaching 16%. The normalized evaluation metrics yield a Mean Absolute Error (MAE) of 0.034 and a Root Mean Square Error (RMSE) of 0.046, indicating good consistency between the predicted results and the simulation results.
The prediction results at 0 °C are shown in Figure 12c,d. As seen from the error curve in Figure 12d, a relatively large error of 17% occurs during the middle charging stage, while the errors at the start and end stages of charging are small.
In addition, the DNN algorithm exhibits fast operation: the total training and testing time is 38 s, whereas the multi-physics coupled simulation requires 305 s. This demonstrates that using the DNN algorithm for stress prediction can save computation time and achieve the goal of rapid prediction.

4. Conclusions

A coupled electrochemical–thermal–mechanical model was established to study the concentration and stress distributions of negative electrode active particles under different temperatures and charging rates. The DNN algorithm was used to predict stress during charging, and the following conclusions are drawn:
  • During the charging process, the intercalation of lithium ions along the thickness direction of the negative electrode shows an uneven distribution. The lithium-ion concentration in the negative electrode particles near the separator is higher than that in the particles near the current collector. This is because the local current density at the separator terminal is higher, while the current density at the current collector terminal is lower.
  • The stress of active particles increases with the increase in charging rate and decreases with the increase in charging temperature. When charging at a rate of 1C and 0 °C, the maximum stress of the particles at the negative electrode–separator interface reaches 123.7 MPa, while when charging at 30 °C, the maximum particle stress is 24.3 MPa. Cloud image analysis shows that the stress at the particle center is tensile stress, while the stress on the surface is compressive stress, indicating that cracks may initiate from the center of the particles.
  • The DNN algorithm is used to predict the stress of active particles during charging, with MAE and RMSE values of 0.034 and 0.046, respectively. The prediction results are in good agreement with the simulation results.
This study combines finite element simulation with deep learning algorithms to quantitatively validate the stress within active material particles during low-temperature charging using a numerical model. It is recommended to heat the battery to above 10 °C at low temperatures or to slow down the charging rate during low-temperature charging. This is helpful for optimizing the charging strategy of lithium-ion batteries and provides guidance for anti-aging design of batteries. However, the model was appropriately simplified for the simulation, neglecting influences such as that of the SEI film thickness on particle stress. Incorporating a simulation of SEI growth and validating it experimentally could be a direction for future work.

Author Contributions

Methodology, J.C.; Validation, Y.Z.; Formal analysis, J.C.; Data curation, Y.Z. All authors have read and agreed to the published version of the manuscript.

Funding

This research was funded by: (1) Research on Battery Thermal Management and Anti-collision Based on Composite PhaseChange Materials [No. GJJ2201505]; (2) Research on CP3 Three-dimensional adjustment based on the measurement of total station without Leveling and its Service Life Precision Repair Method [No. 52068052]; (3) Reform and Exploration of the Talent Training Model of “Co-cultivation by Schools, Industries and Enterprises & Integration of Theory, Virtual Simulation and Practice” for the Major of New Energy Vehicle Technology [No. JXJG-23-74-3]; (4) Study on the Closed-Loop Mechanism of Teaching-Practice-Employment for Talent Training in the New Energy Vehicle Industry Under the Background of Supply-Demand Adaptation [No. 2025ZYB063]; (5) Nanchang Key Laboratory of Mold Surface Treatment and Processing & Manufacturing Technology [No. 2021-NCZDSY-003].

Data Availability Statement

The original contributions presented in this study are included in the article. Further inquiries can be directed to the corresponding author.

Conflicts of Interest

The authors declare no conflict of interest.

Nomenclature

AsHeat transfer area, m2
αa, αcTransfer coefficients, dimensionless
cs, clLithium-ion concentrations in solid and liquid phases, respectively, mol/m3
cpSpecific heat capacity at constant pressure, mol/m3
Ds, DlDiffusion coefficients of solid and liquid phases, respectively, m2/s
EActivation energy, J/mol
FActivation energy, C/mol
hConvective heat transfer coefficient, W/(m2·K)
i0Exchange current density, A/m2
jLocal current density, A/m2
kReaction rate constant, m/s
RIdeal gas constant, J/(mol·K)
rRadius of active particles, m
TBattery temperature, K
TaAmbient temperature, K
t+Transference number of lithium ions, dimensionless, 1
tBattery discharge time, s
σs, σlElectrical conductivities of solid and liquid phases, respectively, S/m
Φs, ΦlPotentials of solid and liquid phases, respectively, V
εs, εlVolume fractions of solid and liquid phases, respectively, dimensionless, 1
ρDensity, kg/m3
ηOverpotential, V
EElastic modulus, GPa
νPoisson’s ratio, dimensionless
ΩPartial molar volume, m3(mol)−1

References

  1. Wang, S.; Ren, D.; Xu, C.; Han, X.; Liu, X.; Lu, L.; Ouyang, M. Lithium plating induced volume expansion overshoot of lithium-ion batteries: Experimental analysis and modeling. J. Power Sources 2024, 593, 233946. [Google Scholar] [CrossRef]
  2. Liu, Y.; Mao, Y.; Cao, J.; Wang, H.; Liu, B. Adjustment of swelling stress ranges to control internal short circuit behavior of high-energy lithium metal batteries. Chem. Eng. J. 2025, 517, 164403. [Google Scholar] [CrossRef]
  3. Yu, C.; Huang, S.; Xu, H.; Yan, J.; Rong, K.; Sun, M. Optimal charging of lithium-ion batteries based on lithium precipitation suppression. J. Energy Storage 2024, 82, 110580. [Google Scholar] [CrossRef]
  4. Shin, H.R.; Lee, J.-W. Electrochemistry-based method for determining Li plating-induced degradation of fast-charging Li-ion batteries. Electrochim. Acta 2025, 523, 145959. [Google Scholar] [CrossRef]
  5. Sandherr, J.; Bolsinger, M.; Kleefoot, M.-J.; Knoblauch, V. A combined electrochemical and microscopical analysis on the effect of laser structuring on Li plating of graphite anodes for lithium-ion batteries. J. Energy Storage 2024, 102, 114187. [Google Scholar] [CrossRef]
  6. Chen, Y.; Ding, L.; Zeng, Q.; Dong, Y.; Yue, X.; Si, X.; Zhang, D.; Qu, Q.; Liang, Z.; Hao, W. Investigating the gas generation during Li plating in fast-charging Li-ion batteries. Chin. Chem. Lett. 2025, in press, journal pre-proof. [Google Scholar]
  7. Clerici, D.; Mocera, F.; Somà, A. Analytical Solution for Coupled Diffusion Induced Stress Model for Lithium-Ion Battery. Energies 2020, 13, 1717. [Google Scholar] [CrossRef]
  8. Clerici, D.; Mocera, F. Micro-scale modeling of Lithium-ion battery. IOP Conf. Ser. Mater. Sci. Eng. 2021, 1038, 012007. [Google Scholar] [CrossRef]
  9. Verbrugge, M.W.; Cheng, Y.-T. Stress and Strain-Energy Distributions within Diffusion-Controlled Insertion-Electrode Particles Subjected to Periodic Potential Excitations. J. Electrochem. Soc. 2009, 156, A927–A937. [Google Scholar] [CrossRef]
  10. Zhu, X.; Chen, Y.; Chen, H.; Luan, W. The diffusion induced stress and cracking behaviour of primary particle for Li-ion battery electrode. Int. J. Mech. Sci. 2020, 178, 105608. [Google Scholar] [CrossRef]
  11. Korsunsky, A.M.; Sui, T.; Song, B. Explicit formulae for the internal stress in spherical particles of active material within lithium ion battery cathodes during charging and discharging. Mater. Des. 2015, 69, 247–252. [Google Scholar] [CrossRef]
  12. Zhao, K.; Pharr, M.; Vlassak, J.J.; Suo, Z. Fracture of electrodes in lithium-ion batteries caused by fast charging. J. Appl. Phys. 2010, 108, 073517. [Google Scholar] [CrossRef]
  13. Pistorio, F.; Clerici, D.; Mocera, F.; Somà, A. Coupled electrochemical–mechanical model for fracture analysis in active materials of lithium ion batteries. J. Power Sources 2023, 580, 233378. [Google Scholar] [CrossRef]
  14. Zhu, X.; Xie, Y.; Chen, H.; Luan, W. Numerical analysis of the cyclic mechanical damage of Li-ion battery electrode and experimental validation. Int. J. Fatigue 2021, 142, 105915. [Google Scholar] [CrossRef]
  15. Chen, Y.; Chen, H.; Luan, W. Shakedown, ratcheting and fatigue analysis of cathode coating in lithium-ion battery under steady charging-discharging process. J. Mech. Phys. Solids 2021, 150, 104366. [Google Scholar] [CrossRef]
  16. Zhang, X.; Li, P.; Wang, K.; Zhang, H.; Huang, H. Numerical investigation on the elastoplastic behavior and fatigue life of the current collector of lithium-ion batteries based on the electrochemical-thermal-mechanical coupling model. J. Energy Storage 2023, 68, 107792. [Google Scholar] [CrossRef]
  17. Chen, L.R.; Wei, S.H.; Hsieh, H.Y.; Shen, H.Y.; Wu, C.H. Comparison of battery internal temperature using electrochemical impedance spectroscopy. Int. J. Electrochem. Sci. 2025, 20, 101070. [Google Scholar] [CrossRef]
  18. Zafar, M.H.; Mansoor, M.; Abou Houran, M.; Khan, N.M.; Khan, K.; Moosavi, S.K.R.; Sanfilippo, F. Hybrid deep learning model for efficient state of charge estimation of Li-ion batteries in electric vehicles. Energy 2023, 282, 128317. [Google Scholar] [CrossRef]
  19. Zhou, Z.; Ryan, Z.J.; Sharma, U.; Anh, T.T.; Mehrotra, S.; Greco, A.; West, J.; Prasad, M. Deep Learning Approaches for Battery Capacity and State of Charge Estimation with the NASA B0005 Dataset. Comput. Mater. Contin. 2025, 83, 4795–4813. [Google Scholar] [CrossRef]
  20. Su, T.-W.; Ko, C.-J.; Chen, K.-C. Estimation of battery temperature during drive cycle operation by the time evolution of voltage and current. J. Energy Storage 2024, 91, 112075. [Google Scholar] [CrossRef]
  21. Li, Z.; Yu, H.; Fan, G.; Zhang, J.; Xu, J. Energy-efficient offloading for DNN-based applications in edge-cloud computing: A hybrid chaotic evolutionary approach. J. Parallel Distrib. Comput. 2024, 187, 104850. [Google Scholar] [CrossRef]
  22. Ahn, J.; Lee, Y.; Han, B.; Lee, S.; Kim, Y.; Chung, D.; Jeon, J. A highly effective and robust structure-based LSTM with feature-vector tuning framework for high-accuracy SOC estimation in EV. Energy 2025, 325, 136134. [Google Scholar] [CrossRef]
  23. Mustaffa, Z.; Sulaiman, M.H.; Isuwa, J. State of charge estimation of lithium-ion batteries in an electric vehicle using hybrid metaheuristic—Deep neural networks models. Energy Storage Sav. 2025, 4, 111–122. [Google Scholar] [CrossRef]
  24. Ma, L.; Li, Y.; Zhang, T.; Tian, J.; Guo, Q.; Guo, S.; Hu, C.; Chung, C.Y. Trustworthy battery state of charge estimation enabled by multi-task deep learning. Energy 2025, 326, 136264. [Google Scholar] [CrossRef]
  25. Fuller, T.F.; Doyle, M.; Newman, J. Simulation and Optimization of the Dual Lithium ion Insertion Cell. J. Electrochem. Soc. 1994, 141, 1. [Google Scholar] [CrossRef]
  26. Doyle, M.; Fuller, T.F.; Newman, J. Modeling of Galvanostatic Charge and Discharge of the Lithium Polymer Insertion Cell. J. Electrochem. Soc. 1993, 140, 1526–1533. [Google Scholar] [CrossRef]
  27. Yousefi, E.; Ramasamy, D.; Kadirgama, K.; Talele, V.; Najafi, H.; Olyaei, M.; Miljkovic, N.; Panchal, S. Electrochemical-thermal modeling of phase change material battery thermal management systems: Investigating mesh types for accurate simulations. Int. J. Heat Mass Transf. 2025, 247, 127107. [Google Scholar] [CrossRef]
  28. Bahiraei, F.; Ghalkhani, M.; Fartaj, A.; Nazri, G.-A. A pseudo 3D electrochemical-thermal modeling and analysis of a lithium-ion battery for electric vehicle thermal management applications. Appl. Therm. Eng. 2017, 125, 904–918. [Google Scholar] [CrossRef]
  29. Ali, Y.; Iqbal, N.; Lee, S. Role of SEI layer growth in fracture probability in lithium-ion battery electrodes. Int. J. Energy Res. 2021, 45, 5293–5308. [Google Scholar] [CrossRef]
  30. Zhao, R.; Liu, J.; Gu, J. The effects of electrode thickness on the electrochemical and thermal characteristics of lithium ion battery. Appl. Energy 2015, 139, 220–229. [Google Scholar] [CrossRef]
  31. An, Z.; Jia, L.; Wei, L.; Dang, C.; Peng, Q. Investigation on lithium-ion battery electrochemical and thermal characteristic based on electrochemical-thermal coupled model. Appl. Therm. Eng. 2018, 137, 792–807. [Google Scholar] [CrossRef]
  32. Christensen, J.; Newman, J. Stress generation and fracture in lithium insertion materials. J. Solid State Electrochem. 2006, 10, 293–319. [Google Scholar] [CrossRef]
  33. Iqbal, N.; Ali, Y.; Lee, S. Analysis of mechanical failure at the interface between graphite particles and polyvinylidene fluoride binder in lithium-ion batteries. J. Power Sources 2020, 457, 228019. [Google Scholar] [CrossRef]
  34. Iqbal, N.; Lee, S. Mechanical Failure Analysis of Graphite Anode Particles with PVDF Binders in Li-Ion Batteries. J. Electrochem. Soc. 2018, 165, A1961–A1970. [Google Scholar] [CrossRef]
  35. Xu, M.; Zhang, Z.; Wang, X.; Jia, L.; Yang, L. Two-dimensional electrochemical–thermal coupled modeling of cylindrical LiFePO4 batteries. J. Power Sources 2014, 256, 233–243. [Google Scholar] [CrossRef]
  36. Bahiraei, F.; Fartaj, A.; Nazri, G.-A. Electrochemical-thermal Modeling to Evaluate Active Thermal Management of a Lithium-ion Battery Module. Electrochim. Acta 2017, 254, 59–71. [Google Scholar] [CrossRef]
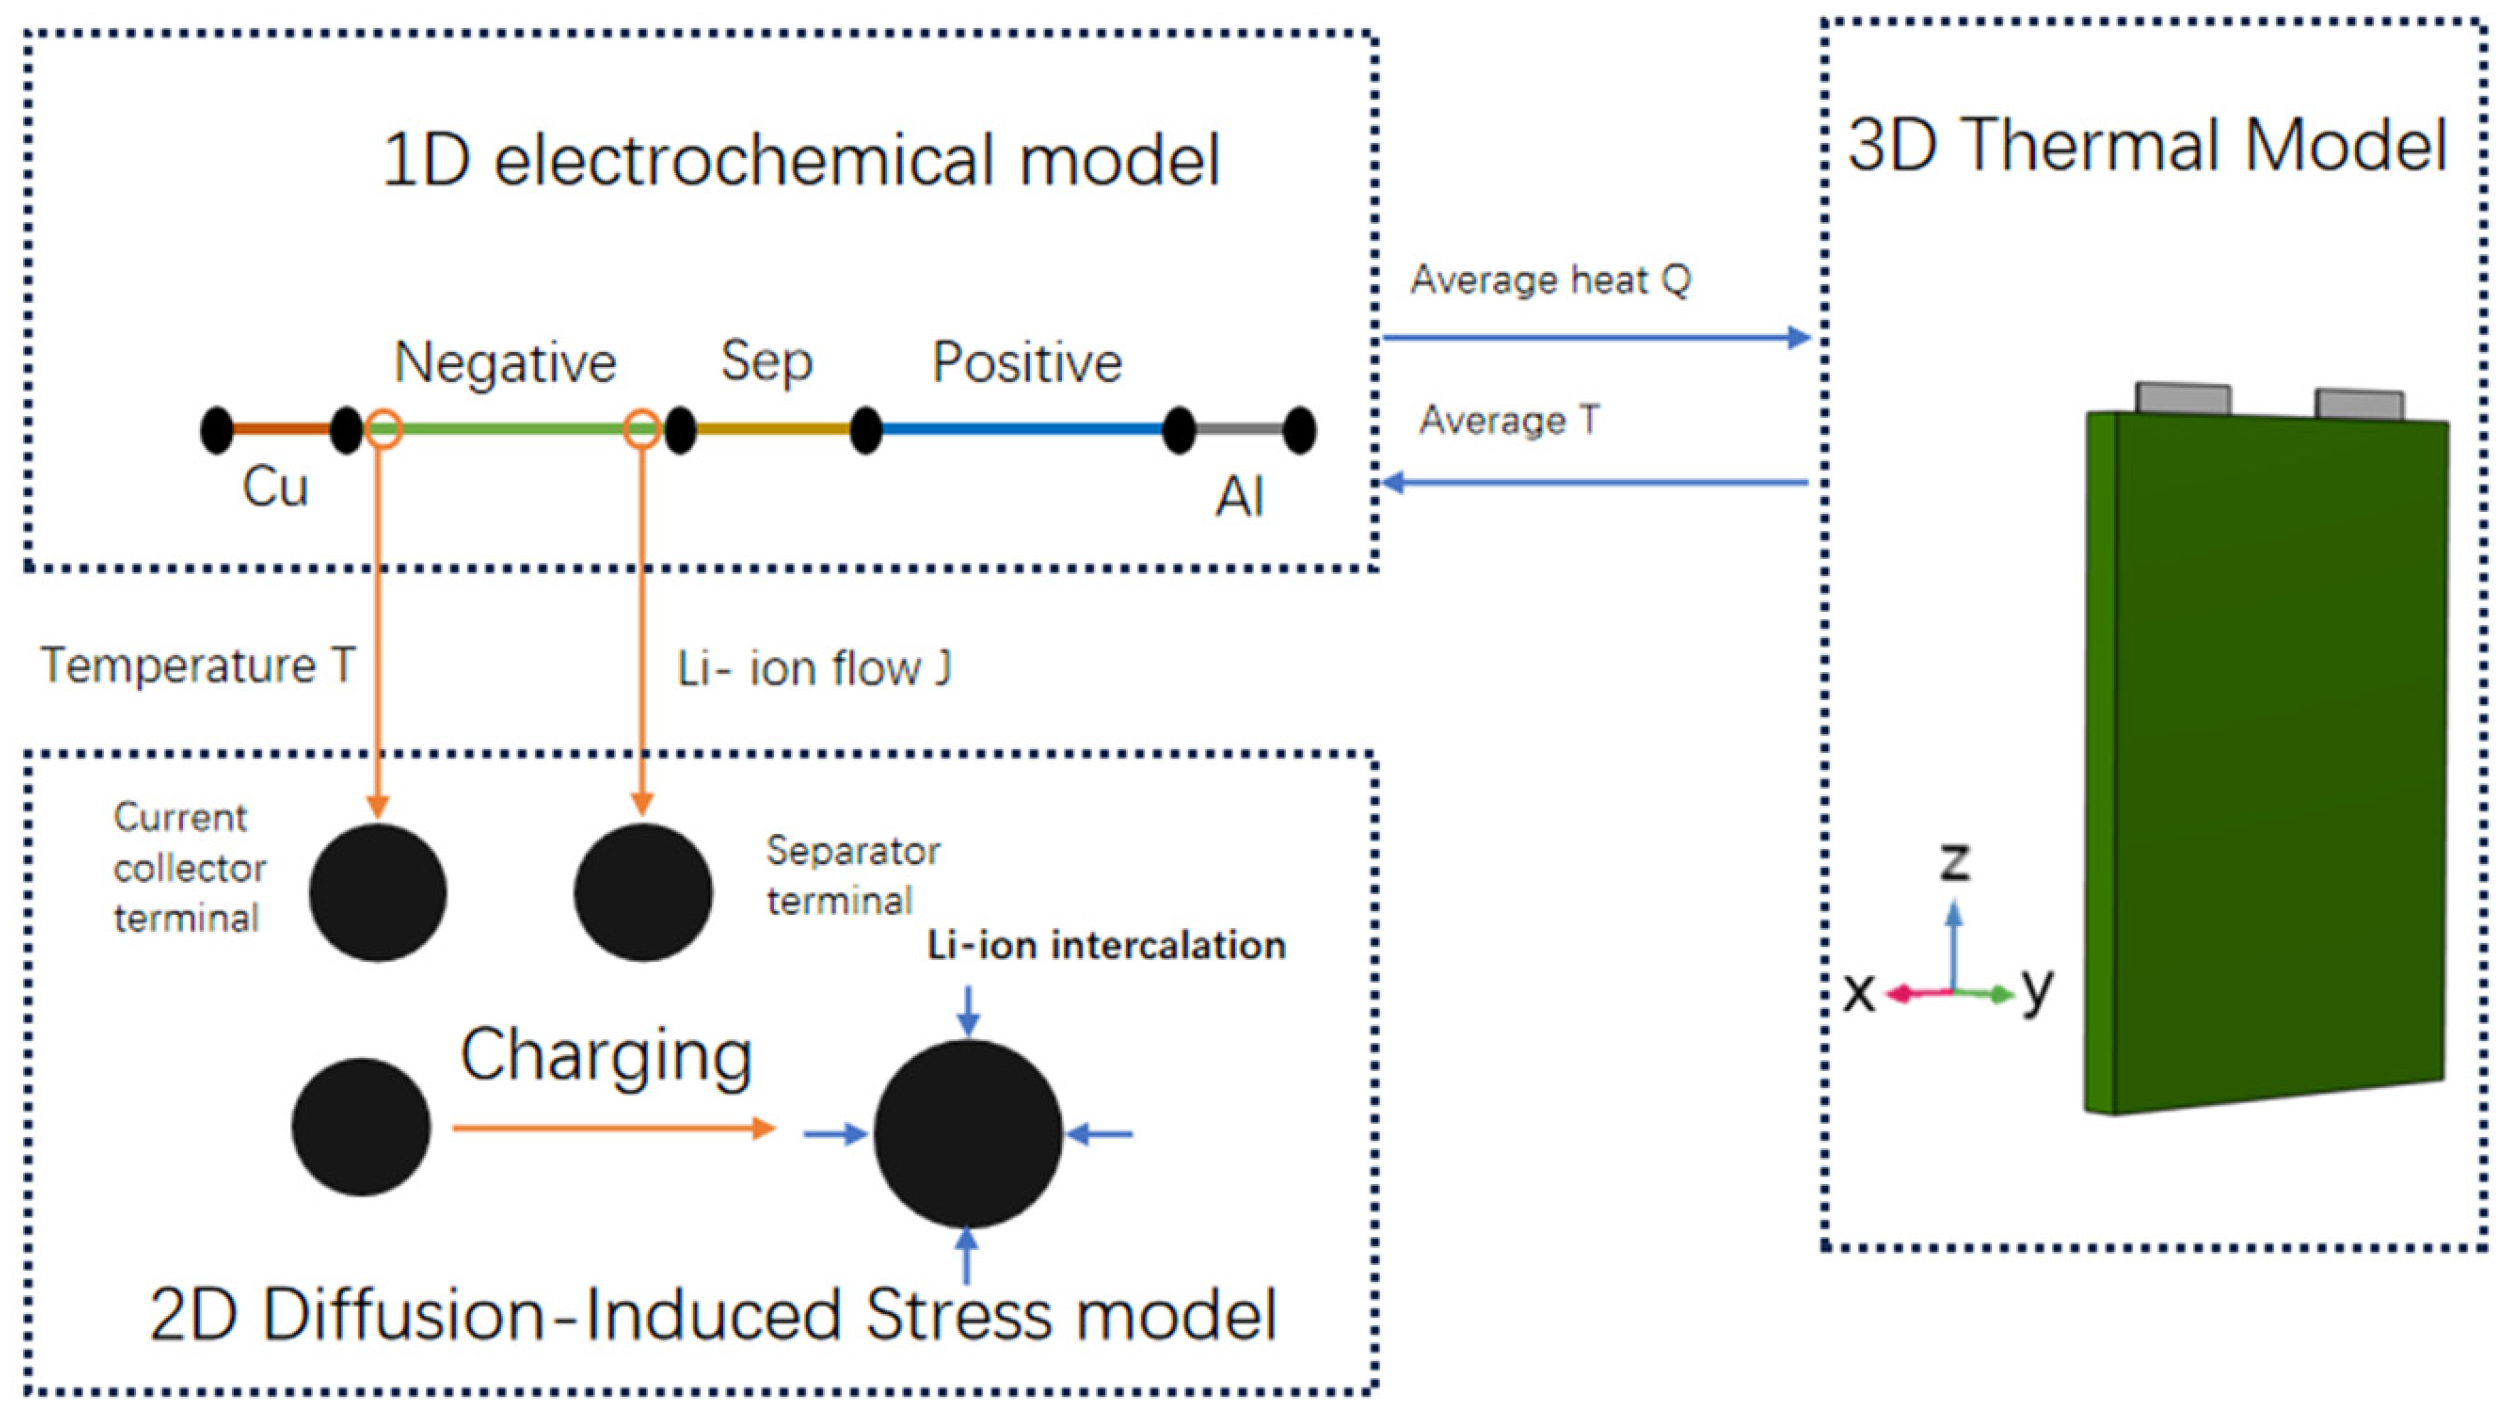
Figure 1. Schematic diagram of battery electrochemical–thermal–mechanical coupling process.
Batteries 11 00360 g001
Figure 2. Structure of the DNN algorithm.
Batteries 11 00360 g002
Figure 3. Discharge curves of batteries during 1C, 2C, 3C, and 5C processes.
Batteries 11 00360 g003
Figure 4. Temperature cloud map of the battery after discharge at 1C, 2C, 3C, and 5C.
Batteries 11 00360 g004
Figure 5. (a) Voltage current curve of the battery under 1C charging condition; (b) current density distribution along the negative electrode thickness direction.
Batteries 11 00360 g005
Figure 6. Maximum lithium solubility of active particles under different temperature charging conditions: (a) lithium solubility of particles at the collector terminal; (b) lithium solubility of particles at the separator terminal.
Batteries 11 00360 g006
Figure 7. Cloud map of solubility distribution at the end of charging at different temperatures: (a) 0 °C; (b) 10 °C; (c) 20 °C; (d) 30 °C.
Batteries 11 00360 g007
Figure 8. Time-dependent curve of maximum tangential stress at the end of charging at different temperatures: (a) particles at the collector terminal; (b) particles at the separate terminal.
Batteries 11 00360 g008
Figure 9. Cloud map of particle stress distribution at the end of charging at different temperatures: (a) 0 °C; (b) 10 °C; (c) 20 °C; (d) 30 °C.
Batteries 11 00360 g009
Figure 10. Battery characteristic curves under different charging rates: (a) lithium concentration of negative electrode particles at the separator terminal; (b) overpotential curve; (c) localized magnification; (d) stress curve.
Batteries 11 00360 g010
Figure 11. Potential relationship phase diagram of various factors inside the battery during low temperatures and a fast charging process.
Batteries 11 00360 g011
Figure 12. The DNN algorithm predicts the stress of active materials during the charging process: (a) comparison between predicted curves and simulated values at 25 °C; (b) absolute error curve at 25 °C; (c) comparison between predicted curves and simulated values at 0 °C; (d) absolute error curve at 0 °C.
Batteries 11 00360 g012
Table 2. Parameters of particle mechanical properties.
ParameterDefinitionAnode
E Elastic modulus/GPa15 [32,33]
ν Poisson’s ratio0.3 [32,33]
Ω Partial molar volume/m3·mol−13.64 × 10−6 [34]
Table 3. Key hyperparameters of the DNN model.
HyperparameterValue
Number of epochs80
Batch size16
Learning rate0.001
OptimizerAdam
Dropout0.2
Disclaimer/Publisher’s Note: The statements, opinions and data contained in all publications are solely those of the individual author(s) and contributor(s) and not of MDPI and/or the editor(s). MDPI and/or the editor(s) disclaim responsibility for any injury to people or property resulting from any ideas, methods, instructions or products referred to in the content.