Abstract
In this paper, the deconvolution of Electrochemical Impedance Spectroscopy (EIS) data into the Distribution of Relaxation Times (DRTs) is employed to provide a detailed examination of degradation mechanisms in lithium-ion batteries. Using an nth RC model with Gaussian functions, this study achieves enhanced separation of overlapping electrochemical processes where Gaussian functions yield smoother transitions and clearer peak identification than conventional piecewise linear functions. The advantages of employing Tikhonov Regularization (TR) with Gaussian functions over Maximum Entropy (ME) and FFT methods are highlighted as this approach provides superior noise resilience, unbiased analysis, and enhanced resolution of critical features. This approach is applied to LIB cell data to identify characteristic peaks of the DRT plot and evaluate their correlation with battery degradation. By observing how these peaks evolve through cycles of battery aging, insights into specific aging mechanisms and performance decline are obtained. This study combines experimental measurements with DRT peak analysis to characterize the impedance distribution within LIBs which enables accelerated detection of degradation pathways and enhances the predictive accuracy for battery life and reliability. This analysis contributes to a refined understanding of LIB degradation behavior, supporting the development of advanced battery management systems designed to improve safety, optimize battery performance, and extend the operational lifespan of LIBs for various applications.
1. Introduction
The widespread adoption of electric vehicles (EVs) has driven extensive research into lithium-ion batteries (LIBs), which serve as the primary power source for these vehicles. Battery degradation is a focal point in this research due to its significant implications. As LIBs age, capacity degradation and increased internal resistance diminish both the driving range and power capacity of EVs, leading to suboptimal driving experiences [1,2]. Additionally, various side reactions occur within LIBs during aging, causing internal structural damage and raising the risk of thermal runaway, ultimately resulting in potential safety hazards [3,4]. Understanding the aging mechanisms and degradation models is crucial for estimating battery health based on historical data, optimizing current operating conditions, and predicting future performance.
Battery aging analysis encompasses various levels of investigation, including factors influencing degradation, internal side reactions, degradation modes, and external effects [5,6]. The most intuitive external characteristics of battery degradation are capacity fade and power fades [7,8]. At present, most papers still focus on these two points to conduct battery aging investigations and modeling. It should be noted that power fade is usually more difficult to investigate, so internal resistance is often analyzed instead [9]. Regarding degradation modes, battery aging mechanisms are often categorized as Loss of Lithium Ion (LLI) and loss of anode/cathode active materials for battery management and online diagnosis [10,11]. The charging and discharging processes of batteries are closely tied to lithium-ion intercalation and deintercalation on the active materials of the anode and cathode [12,13,14]. Consequently, battery capacity is directly influenced by the quantity of active materials and the availability of lithium ions, similar to how the capacity of a tank depends on its size and the amount of water it can hold. The primary degradation mechanisms of LIBs involve the loss of anode/cathode active materials and the LLI, analogous to water loss from the tank [15]. Additionally, the loss of electrolytes, including additives, is significant, with excessive loss potentially leading to capacity decline as batteries age.
Electrochemical Impedance Spectroscopy (EIS) is a valuable tool for studying material behavior over time, such as in corrosion, supercapacitors, and fuel cells [16,17,18]. EIS enables separate and sensitive analysis of each electrochemical reaction process without causing disruptions or damage [19]. EIS spectra offer valuable insights into LIB degradation [20]. However, analyzing EIS typically involves complex non-linear least squares fitting, which relies on the Equivalent Circuit Model (ECM). Finding suitable circuits for complex electrochemical phenomena poses challenges. Researchers are actively seeking alternative approaches to interpret EIS data. One promising method is the Distribution of Relaxation Time (DRT), which transforms data from the frequency (f) domain to the time (τ) domain. DRTs reveal peaks on either the time or frequency axis, indicating underlying electrochemical processes. The key advantage of DRTs is their model-free representation, requiring minimal system information. Various methods, such as Tikhonov Regularization (TR) [21,22], Maximum Entropy (ME) [23], and Fast Fourier Transform (FFT) [24,25], have been employed to convert impedance data to DRT. TR, for instance, involves adjusting regularization parameters for accurate DRTs, although different values can result in varying peak numbers, potentially obscuring true electrochemical phenomena. Despite this, TR does not require smoothing parameters or window functions, simplifying its application.
This research aims to enhance the analysis of the DRT for effectively separating overlapping time scales in EIS and providing clearer graphical interpretations [26,27]. Previous studies have primarily focused on capacity fade and impedance growth, but they often lack a sufficient analysis of DRT evolution in relation to cyclic aging and degradation mechanisms [28,29]. By utilizing an nth RC model with Gaussian functions, this study offers a detailed investigation into the behavior of characteristic DRT peaks and their correlation with battery aging. This approach fills gaps in existing methodologies, providing a more precise understanding of LIB degradation pathways and contributing to the development of advanced strategies for optimizing battery performance and management [30]. By directly correlating DRT peaks with specific battery degradation mechanisms, it offers novel insights into aging phenomena like SEI growth and electrode degradation. Practical validation with 18650 NMC lithium-ion batteries highlights its relevance for real-world battery diagnostics and performance monitoring.
The structure of this paper is as follows: Section 2 explains the application of the DRT method in interpreting EIS data, followed by a detailed explanation of deriving the DRT methods. The formulation of DRT equations based on Gaussian functions and regularization for the nth-order RC model is presented. Section 3 covers the acquisition of EIS data from experimental measurements, including frequency, real, and imaginary impedance components. Section 4 examines the correlation between the EIS Nyquist plot and the DRT plot, along with the interpretation of each peak in the DRT plots. It also explores the evolution of the EIS spectrum and DRT plots using data from 18650 batteries. The analysis highlights the identification of aging and degradation mechanisms by focusing on frequency-specific peaks in the DRT plots, particularly in the intermediate and low-frequency regions. The concluding section synthesizes the findings, summarizing insights and proposing future research directions.
2. Transformation of EIS Data into Distribution of Relaxation Time
2.1. Workflow of DRT Method
The analysis of the DRT method is structured into three main components, data preprocessing, discretization functions, and DRT calculation, as illustrated in Figure 1. Initially, EIS data Z(ω) is obtained through periodic checkup tests, which will be elaborated upon in Section 3. The data Z(ω) is classified based on the characteristics of its components. Following this categorization, the DRT of the electrochemical system is obtained through deconvolution. An integral aspect of this process involves discretizing the electrochemical impedance into a linear superposition function G(τ) using the weight function X(m) and the radial base function.
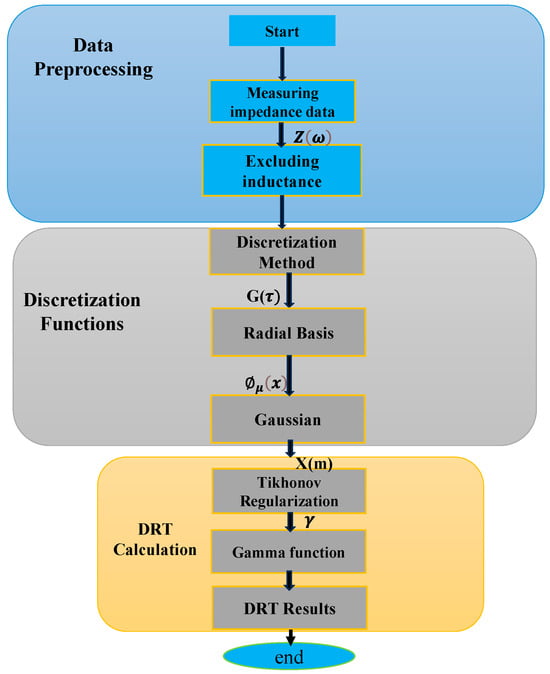
Figure 1.
Flowchart of DRT calculation for measured EIS data.
It is important to note the inherent challenge posed by this process, requiring the regularization method to address the ill-posed nature of finding Φ(x). By employing ridge regression regularization, the weight function X(m) is determined through quadratic programming to minimize the objective function, which represents the system matrix prior to optimization. Furthermore, the selection of the radial base function plays a critical role in minimizing approximation errors, as it integrates Gaussian functions across the frequency domain. The weight function X(m) is then applied to the corresponding TR and linearly combined to produce the reconstructed DRT. A comprehensive breakdown of the detailed procedural steps and methodology is provided in the subsequent sections.
2.2. Derivation of DRT Method
In electrochemical research, the DRT method is a valuable tool for understanding relaxation processes in complex systems. This method excels at analyzing impedance across different frequencies, allowing researchers to determine the DRTs within electrochemical systems using specialized techniques [31]. The foundation of the DRT method lies in the concept that a complex frequency impedance spectrum can be represented as a composite of multiple distinct time constants, as illustrated in Figure 2, and the ECM of LIB with DRT peaks is shown in Figure 3.
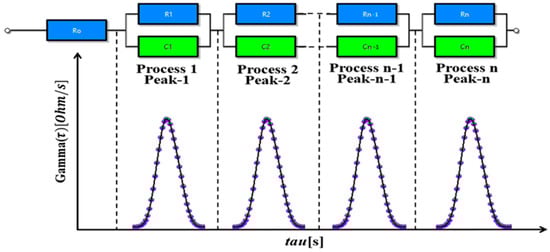
Figure 2.
DRT peaks and general nth order R-C circuit model.
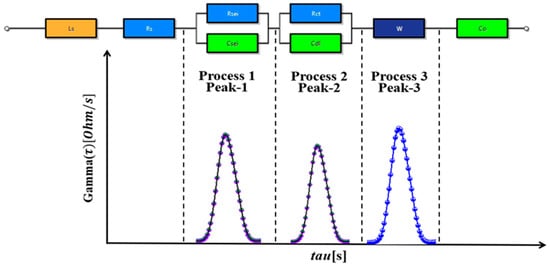
Figure 3.
DRT peaks and an ECM of Li-ion batteries.
The impedance of an electrochemical system can therefore be expressed by (1)
where is the ohmic resistance and it is the impedance at very high frequencies where the capacitive effects become negligible, is a function that describes the DRTs within the system, ω is the angular frequency at which the impedance is measured, τ = RC represents the relaxation time where R and C note the effective resistance and capacitance, respectively. The DRT is obtained by analyzing Figure 2, treating the impedance as a distribution of time constants.
where
Equation (2) illustrates the relationship between impedance data and frequency distribution. Here, represents the ohmic resistance, 1/(1 + jωτ) denotes the DRT kernel, and γ(lnτ) = ≥ 0 represents the distribution function of relaxation time.
Now using (2) and separating real and imaginary parts of impedance then equations will become
DRT analysis aims to estimate the spectrum γ(lnτ), which is an ill-posed problem, meaning it lacks unique solutions. To tackle this, discretization is applied to form a linear system of equations. Equations (3) and (4) are in continuous form but can be converted into a discrete form using , and N is the total number of frequency points. The resulting discrete forms are represented by (5) and (6), respectively.
Now expanding these equations up to n angular frequency points and the impedance of series nth RC elements can be represented by the equation set as (7) and (8) for real and imaginary parts.
Two primary discretization methods for DRT analysis are the piecewise linear and Radial Basis Function (RBF) approaches. Among these, the RBF Gaussian method offers significant advantages due to its ability to approximate data with smooth and continuous Gaussian-shaped functions. This method ensures seamless transitions between adjacent relaxation processes, providing a more accurate resolution of overlapping peaks compared to the abrupt transitions inherent in the piecewise linear approach. Additionally, the RBF Gaussian method allows for greater control over the smoothness and resolution through parameters such as the Full Width at Half Maximum (FWHM) coefficient or shape factor, making it adaptable to complex datasets. The selection of Gaussian parameters, such as shape factor (μ) and FWHM, is crucial for resolving overlapping electrochemical processes in DRT analysis. A smaller μ improves resolution but increases noise sensitivity, while a larger μ smooths transitions but may oversimplify processes. Proper tuning ensures accurate separation of processes, while regularization techniques like Tikhonov mitigate noise and instability. By minimizing numerical artifacts and reducing noise amplification, this method delivers a more reliable interpretation of the relaxation time distribution. These attributes make the RBF Gaussian approach particularly suited to analyzing the intricate electrochemical behaviors of LIBs, as it captures subtle degradation mechanisms with high precision. In contrast, the piecewise linear method, while simpler, may oversimplify the data, potentially leading to inaccurate characterization of relaxation processes. Thus, the RBF Gaussian method emerges as the superior choice for DRT analysis, especially in studies focused on understanding battery aging and performance dynamics [32].
TR stabilizes DRT reconstruction by adding a term to the objective function, promoting smoother solutions. For RBF Gaussian discretization
where x = |ln −|, is the relaxation time of the th collocation points and μ is the shape factor of the RBFs.
The matrices and represent the real and imaginary components of impedance data while and represent the vectors containing the real and imaginary parts of the measured impedance data. When and matrices are combined, they yield matrix A, and the combination of and matrices result in matrix b. Consequently, in matrix notation, the overarching equation is expressed as Ax = b, where A belongs to Rm×n, x belongs to Rn, and b belongs to Rm. Matrix A comprises m rows and n columns, while x is a matrix with n elements, and b is a matrix with m elements.
From (13) and minimizing the solution equation will become as
The minimization of above equation has unique solution for any value of the regularization parameter . The equation will be
The higher λ value causes a stronger penalty to the sum of squares for fitting, which results in a smoother DRT profile. On the other hand, the smaller λ value causes the oscillation of the DRT profile.
The MEM is commonly used to transform EIS data into DRT due to its ability to produce smooth and stable solutions. However, MEM has significant disadvantages illustrated in Figure 4. One major drawback is its tendency to overly smooth the DRT plot, which can merge distinct electrochemical processes, such as charge transfer and diffusion, into a single feature. This smoothing effect makes it challenging to differentiate individual processes and analyze their relaxation times accurately.
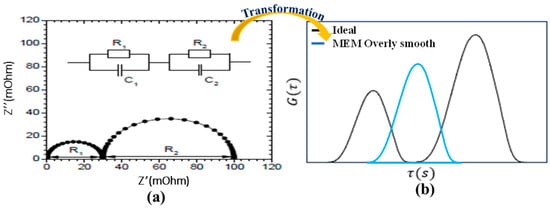
Figure 4.
Transformation of EIS data using MEM. (a) Equivalent Semicircles (b) Transformed Peaks.
Additionally, MEM relies on prior assumptions that introduce bias into the results. This bias, combined with the loss of critical details in the DRT, limits MEM’s suitability for battery diagnostics, where precise identification of fine structures is essential.
The FFT is also a widely used algorithm for transforming time domain data into the frequency domain due to its computational efficiency. However, FFT has significant drawbacks, particularly in noisy environments, as illustrated in Figure 5.
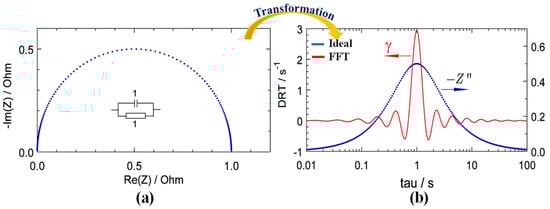
Figure 5.
Transformation of EIS data using the FFT method. (a) Equivalent Semicircle (b) Transformed Peak.
FFT is highly sensitive to noise, where even small disturbances in the time-domain signal can distort frequency components, leading to multiple peaks in the results. For instance, Figure 5 shows multiple peaks in the FFT output, despite only one semicircle being present in the Nyquist plot. This makes it difficult to analyze true relaxation processes accurately.
Tikhonov Regularization (TR) is robust and stable as compared to methods such as ME and FFT. However, it also has practical challenges including the selection of optimal regularization parameters, sensitivity to noise, computational intensity, and reliance on smooth distribution assumptions. Despite its advantages, TR may face limitations in handling non-smooth cases and real-time applications.
3. Battery Aging Test Method
This section describes the aging test of a cylindrical 18650 LIB. The cylindrical battery cell used in the measurement has specifications provided in Table 1. The battery cell underwent aging through repeated charging and discharging cycles to generate EIS AC impedance spectra measured every five cycles. Changes in impedance parameters during the aging period were extracted using the measurement results and ECMs followed by curve fitting. The battery aging was conducted using HYSCLAB B.O.D Incubator equipment, maintaining a temperature of 25 °C. The charge and discharge tests as well as the EIS tests were conducted using WonATech WEIS-500. Cycle tests were performed with constant current charging at 0.5C and constant current discharging at 0.5C. Figure 6 illustrates the battery testing conditions and the evaluation of Nyquist plots, with a one-hour rest period after each charging and discharging cycle. EIS tests were conducted every five cycles, and impedance spectra were measured using a 60 mV perturbation in the frequency range of 0.1–1 kHz with the battery at a state of charge (SOC) of 100%. The cycle test was conducted up to 1035 cycles, during which the battery capacity decayed from 100% to 75%. This marked the point at which the battery could no longer function effectively, indicating it had reached the end of its usable life. The failure occurred due to an unknown reason, highlighting the need for further investigation into the underlying degradation mechanisms as illustrated in Figure 6 capacity graph. The selection of 18650 batteries was based on their widespread use in electric vehicles and consumer electronics, making them ideal for studying degradation mechanisms and ensuring the practical relevance of the analysis.

Table 1.
Specification of the 18650 battery used for the aging test.
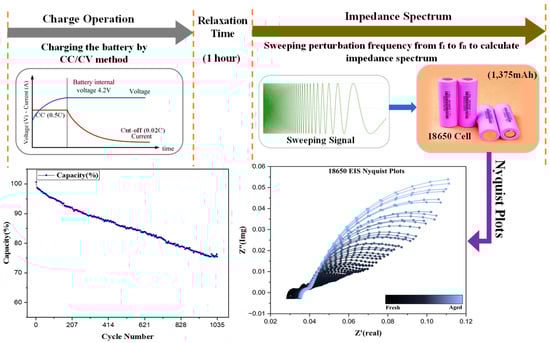
Figure 6.
Battery testing conditions and evaluation of Nyquist plots.
4. Results and Analysis
4.1. Correlation Between EIS Nyquist Plots and DRT Plots
EIS Nyquist plot is a graphical representation where the real part of impedance (Z′) is plotted on the x-axis, and the imaginary part (Z″) on the y-axis, offering insights into the electrical properties of a LIB, such as resistance, capacitance, charge transfer kinetics, and Warburg impedance. Each data point on the Nyquist plot corresponds to the impedance of the LIB at a specific frequency, with different regions of the plot providing information about various electrochemical processes as illustrated in Figure 7, such as the high-frequency region reflecting ohmic resistance and the lower frequency region indicating diffusion impedance.
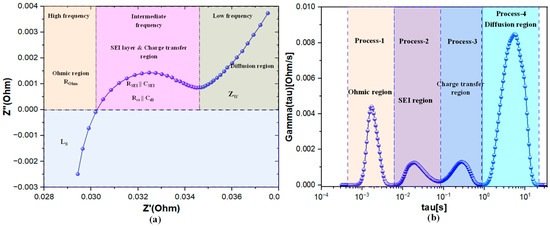
Figure 7.
Transformation of an EIS plot to DRT plot for a 18650 cell (a) Nyquist plot of a 18650 cell (b) corresponding DRT plot transformed from the EIS plot.
In contrast, DRT analysis offers a model-free approach to interpreting EIS data by directly examining the DRTs within the system. DRT identifies and quantifies individual relaxation processes, with each peak in the DRT spectrum corresponding to a distinct electrochemical process, as shown in Figure 7b. This method provides clearer and more interpretable insights into the behavior of LIBs compared to the traditional approach of fitting EIS Nyquist plots to an ECM. The relationship between EIS Nyquist plots and DRT plots is visually represented in Figure 7, where DRT peaks correspond to different features in the Nyquist plot, helping to connect and interpret the electrochemical processes more effectively.
EIS is a powerful tool for analyzing the internal processes of LIBs. However, in traditional Nyquist plots, overlapping semicircles often obscure individual electrochemical processes, making it challenging to differentiate and analyze the underlying mechanisms. To address this limitation, the DRT method is employed, transforming EIS data into a format where each electrochemical process is represented as a distinct peak. This transformation enables the clear separation and identification of individual processes such as the ohmic region, Solid Electrolyte Interphase (SEI) layer, charge transfer process, and diffusion process, providing deeper insights into the internal behavior of LIBs.
4.2. Detection of the Battery Status Using DRT Plot
Nyquist plots of the 18650 cell obtained from EIS measurements are presented in Figure 8a,b. Impedance spectrums were recorded for this cell after a specified number of cycles until the capacity decayed to 75%, marking the onset of failure. The spectrum is divided into four frequency ranges: ultra-high frequency, high frequency, intermediate frequency, and low frequency. The semicircle at the intermediate frequency is associated with charge transfer, while the low-frequency region corresponds to diffusion processes, both closely related to battery degradation during cycling. In contrast, the ultra-high and high-frequency regions are associated with ohmic resistance and the SEI region, respectively, which are less affected by cycling. In Figure 8a,b, overlapping semicircles make it challenging to distinguish individual electrochemical processes. Ideally, each process would correspond to a distinct semicircle, but in practice, they often overlap. Additionally, the height and width of the semicircles increase with cycling, reflecting changes in the impedance spectrum. However, due to similarities in the electrochemical processes, these semicircles overlap, complicating the derivation of individual relaxation times and amplitudes.
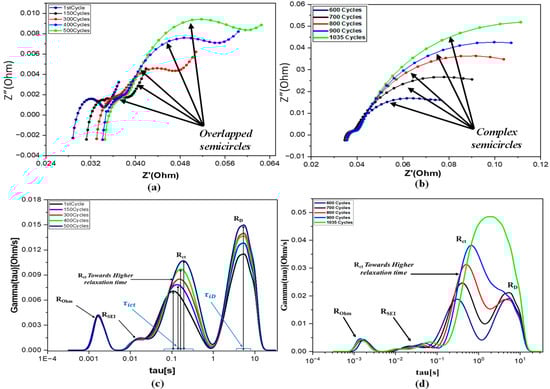
Figure 8.
(a,b) Nyquist plots of the 18650 cell over the life cycle (c,d) DRT plots of the 18650 cell over the life cycle.
There is an ongoing need in battery research for methods that combine frequency-domain and time-domain analysis to interpret EIS for understanding battery characteristics and diagnosing issues [33]. DRT analysis addresses this need by enabling a clearer breakdown and understanding of each process compared to frequency-domain analysis alone. A broader range of frequencies provides detailed insights into internal processes within the battery. The higher-frequency region reveals faster processes such as chemical reactions, while the lower-frequency region highlights slower processes like diffusion of ions. Time-domain analysis also provides a clearer view of each electrochemical process, enhancing the understanding of battery behavior.
In Figure 8c,d, the DRT plot for the 18650 battery is shown up to 1035 cycles. Four peaks are observed in the DRT plot. The rightmost peak, which increases continuously with cycling, is referred to as the diffusion process. It indicates battery aging and is located at a higher relaxation time, corresponding to the lower frequency region [34]. The peak on the left side is known as the contact impedance or ohmic impedance, resulting from the direct physical contact between the active materials and the collectors. This peak shows almost no variation as the battery cycles, which is attributed to the high-quality production and manufacturing process of the anode material in LIBs. The middle two peaks are associated with the SEI layer and charge transfer process. As shown in Figure 8c,d, during the initial cycles, the SEI layer grows rapidly and then stabilizes. The charge transfer impedance increases with cycling and its shift toward higher relaxation times indicates that the process is slowing down. When the peaks of the charge transfer and diffusion processes merge at a single time constant tau, it signifies a critical state of degradation in the battery. The merging of these processes at a single-time constant tau indicates that the battery can no longer sustain electrochemical reactions. This is due to SEI layer formation, lithium plating, and loss of active materials, which increase internal resistance. This increase in impedance with cycling reflects the battery degradation mechanism.
The degradation mechanisms of LIBs can be thoroughly analyzed and better understood with the help of Figure 9 [35], which provides a comprehensive overview of the various processes involved. An increase in ohmic resistance also known as contact resistance in LIBs is linked to reduced electrical conductivity within the battery components, which can arise from mechanisms like electrolyte consumption and electrolyte decomposition. Electrolyte consumption leads to a decrease in the availability of charge carriers (ions), while electrolyte decomposition generates chemical species that might have lower conductivity. These factors collectively contribute to an increase in ohmic resistance, resulting in higher internal resistance and diminished battery performance. Additionally, an increase in the resistance of the SEI layer indicates a degradation process in LIBs [36]. The SEI layer, formed on the electrode surfaces due to electrolyte decomposition, suggests the LLIs within the battery, leading to a reduction in its capacity and performance over time [35].
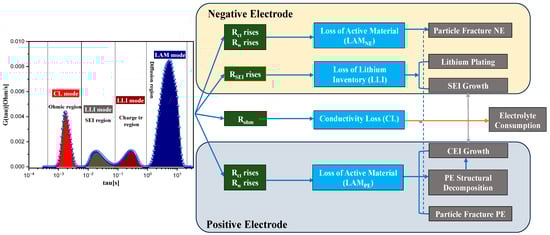
Figure 9.
LIBs degradation mechanisms based on DRT plots.
Moreover, a rise in charge transfer and diffusion processes within LIBs may suggest a decrease in active material within the electrodes, particularly noticeable in the negative electrode (anode) and positive electrode (cathode). This impedance increase often signifies degradation processes that lead to reduced electron and ion transport within the electrodes, which can be attributed to particle fractures and structural changes in the active material as shown in Figure 9. One of the primary causes of such degradation is the phenomenon of graphite exfoliation and island formation in the negative electrode, typically made of graphite [37]. During charging and discharging cycles, the anode undergoes expansion and contraction due to the insertion and extraction of lithium ions, contributing to degradation over time [38]. This degradation can include particle cracking, LAM from the electrode, and changes in the crystal structure, ultimately reducing the capacity to store and release lithium ions.
5. Conclusions
This study demonstrates the deconvolution of EIS data into the DRT using TR with Gaussian functions, providing a more accurate and precise analysis of LIBs degradation mechanisms. By utilizing Gaussian functions, the DRT method effectively separates overlapping electrochemical processes and offers clearer insights into battery aging and performance decline compared to traditional methods. The analysis shows that shifts in electrochemical processes, such as charge transfer and diffusion, correlate with the degradation of LIBs over time. This approach offers a detailed understanding of the degradation mechanisms, including the role of the SEI layer in affecting battery capacity. The DRT method enhances the ability to track and quantify these changes more precisely, offering a clearer picture of battery health. The DRT method offers distinct advantages over traditional EIS analysis by deconvoluting overlapping electrochemical processes in Nyquist plots, providing higher resolution and greater insight into individual mechanisms such as SEI growth, charge transfer, and diffusion. Unlike conventional EIS, which often struggles with interpreting complex impedance spectra, the DRT method isolates and quantifies specific processes, thereby enabling more accurate analysis of battery aging and degradation. TR with Gaussian functions for DRT deconvolution proves to be a powerful tool for improving the accuracy of battery performance predictions. This method supports the development of advanced battery management systems by enabling better monitoring of battery health, optimizing performance, and extending the operational lifespan of LIBs across various applications. By providing a deeper understanding of battery degradation, it contributes to the advancement of more efficient and reliable battery technologies.
Author Contributions
Conceptualization, W.C. and M.S.; methodology, M.S.; software, M.S.; validation, W.C., M.S. and A.S.A.; formal analysis, M.S.; investigation, M.S.; resources, W.C.; data curation, M.S.; writing—original draft preparation, M.S.; writing—review and editing, A.S.A.; visualization, M.S. and A.S.A.; supervision, W.C.; project administration, W.C.; funding acquisition, W.C. All authors have read and agreed to the published version of the manuscript.
Funding
This research received no external funding.
Data Availability Statement
Data is unavailable due to privacy or ethical restrictions.
Conflicts of Interest
The authors declare no conflict of interest.
References
- Abellan, P.; Mehdi, B.L.; Parent, L.R.; Gu, M.; Park, C.; Xu, W.; Zhang, Y.; Arslan, I.; Zhang, J.-G.; Wang, C.-M.; et al. Probing the Degradation Mechanisms in Electrolyte Solutions for Li-ion Batteries by In-Situ Transmission Electron Microscopy. Nano Lett. 2014, 14, 1293–1299. [Google Scholar] [CrossRef] [PubMed]
- Shchurov, N.I.; Dedov, S.I.; Malozyomov, B.V.; Shtang, A.A.; Martyushev, N.V.; Klyuev, R.V.; Andriashin, S.N. Degradation of lithium-ion batteries in an electric transport complex. Energies 2021, 14, 8072. [Google Scholar] [CrossRef]
- Golubkov, A.W.; Fuchs, D.; Wagner, J.; Wiltsche, H.; Stangl, C.; Fauler, G.; Voitic, G.; Thaler, A.; Hacker, V. Thermal-runaway experiments on consumer Li-ion batteries with metal-oxide and olivin-type cathodes. Rsc Adv. 2014, 4, 3633–3642. [Google Scholar] [CrossRef]
- Zaghib, K.; Dontigny, M.; Guerfi, A.; Trottier, J.; Hamel-Paquet, J.; Gariepy, V.; Galoutov, K.; Hovington, P.; Mauger, A.; Groult, H.; et al. An improved high-power battery with increased thermal operating range: C–LiFePO4//C–Li4Ti5O12. J. Power Sources 2012, 216, 192–200. [Google Scholar] [CrossRef]
- Birkl, C.R.; Roberts, M.R.; McTurk, E.; Bruce, P.G.; Howey, D.A. Degradation diagnostics for lithium ion cells. J. Power Sources 2017, 341, 373–386. [Google Scholar] [CrossRef]
- Sohaib, M.; Choi, W. Investigation of the Aging Phenomena in Lithium-Ion Batteries Using Distribution of Relaxation Time Analysis; The Korean Institute of Power Electronics: Seoul, Republic of Korea, 2024. [Google Scholar]
- Bloom, I.; Cole, B.; Sohn, J.; Jones, S.; Polzin, E.; Battaglia, V.; Henriksen, G.; Motloch, C.; Richardson, R.; Unkelhaeuser, T.; et al. An accelerated calendar and cycle life study of Li-ion cells. J. Power Sources 2001, 101, 238–247. [Google Scholar] [CrossRef]
- Wright, R.B.; Christophersen, J.P.; Motloch, C.G.; Belt, J.R.; Ho, C.D.; Battaglia, V.S.; Barnes, J.A.; Duong, T.Q.; Sutula, R.A. Power fade and capacity fade resulting from cycle-life testing of Advanced Technology Development Program lithium-ion batteries. J. Power Sources 2003, 119–121, 865–869. [Google Scholar] [CrossRef]
- Belt, J.; Utgikar, V.; Bloom, I. Calendar and PHEV cycle life aging of high-energy, lithium-ion cells containing blended spinel and layered-oxide cathodes. J. Power Sources 2011, 196, 10213–10221. [Google Scholar] [CrossRef]
- Pop, V.; Bergveld, H.J.; Regtien, P.P.L.; het Veld, J.O.; Danilov, D.; Notten, P.H.L. Battery aging and its influence on the electromotive force. J. Electrochem. Soc. 2007, 154, A744e50. [Google Scholar] [CrossRef]
- Sarasketa-Zabala, E.; Aguesse, F.; Villarreal, I.; Rodriguez-Martinez, L.M.; López, C.M.; Kubiak, P. understanding lithium inventory loss and sudden performance fade in cylindrical cells during cycling with deep-discharge steps. J. Phys. Chem. C 2015, 119, 896–906. [Google Scholar] [CrossRef]
- Wang, X.; Wei, X.; Chen, Q.; Zhu, J.; Dai, H. Lithium-ion battery temperature on-line estimation based on fast impedance calculation. J. Energy Storage 2019, 26, 100952. [Google Scholar] [CrossRef]
- Al Nazer, R.; Cattin, V.; Granjon, P.; Montaru, M.; Ranieri, M. broadband identification of battery electrical impedance for HEVs. IEEE Trans. Veh. Technol. 2013, 62, 2896–2905. [Google Scholar] [CrossRef]
- Gantenbein, S.; Weiss, M.; Ivers-Tiffée, E. Impedance based time-domain modeling of lithium-ion batteries: Part I. J. Power Sources 2018, 379, 317–327. [Google Scholar] [CrossRef]
- Dubarry, M.; Truchot, C.; Liaw, B.Y. Synthesize battery degradation modes via a diagnostic and prognostic model. J. Power Sources 2012, 219, 204–216. [Google Scholar] [CrossRef]
- Encinas-Sánchez, V.; de Miguel, M.T.; Lasanta, M.I.; García-Martín, G.; Pérez, F.J. Electrochemical impedance spectroscopy (EIS): An efficient technique for monitoring corrosion processes in molten salt environments in CSP applications. Sol. Energy Mater. Sol. Cells 2019, 191, 157–163. [Google Scholar] [CrossRef]
- Sakita, A.M.P.; Della Noce, R.; Lavall, R.L. Potential-dependent electrochemical impedance spectroscopy as a powerful tool for evaluating supercapacitor electrode performance. J. Electrochem. Soc. 2021, 168, 080525. [Google Scholar] [CrossRef]
- Han, S.B.; Oh, H.; Lee, W.Y.; Won, J.; Chae, S.; Baek, J. On-line eis measurement for highpower fuel cell systems using simulink real-time. Energies 2021, 14, 6133. [Google Scholar] [CrossRef]
- Magar, H.S.; Hassan, R.Y.A.; Mulchandani, A. Electrochemical impedance spectroscopy (Eis): Principles, construction, and biosensing applications. Sensors 2021, 21, 6578. [Google Scholar] [CrossRef] [PubMed]
- Nara, H.; Yokoshima, T.; Osaka, T. Technology of electrochemical impedance spectroscopy for an energy-sustainable society. Curr. Opin. Electrochem. 2020, 20, 66–77. [Google Scholar] [CrossRef]
- Ivers-Tiffée, E.; Weber, A. Evaluation of electrochemical impedance spectra by the distribution of relaxation times. J. Ceram. Soc. Jpn. 2017, 125, 193–201. [Google Scholar] [CrossRef]
- Weiß, A.; Schindler, S.; Galbiati, S.; Danzer, M.A.; Zeis, R. Distribution of relaxation times analysis of high-temperature PEM fuel cell impedance spectra. Electrochim. Acta 2017, 230, 391–398. [Google Scholar] [CrossRef]
- Hörlin, T. Deconvolution and maximum entropy in impedance spectroscopy of noninductive systems. Solid State Ion. 1998, 107, 241–253. [Google Scholar] [CrossRef]
- Boukamp, B.A. Derivation of a Distribution Function of Relaxation Times for the (fractal) Finite Length Warburg. Electrochim. Acta 2017, 252, 154–163. [Google Scholar] [CrossRef]
- Boukamp, B.A.; Rolle, A. Analysis and application of distribution of relaxation times in solid state ionics. Solid State Ion. 2017, 302, 12–18. [Google Scholar] [CrossRef]
- Qahouq, J.A.A.; Xia, Z. Single-perturbation-cycle online battery impedance spectrum measurement method with closed-loop control of power converter. IEEE Trans. Ind. Electron. 2017, 64, 7019–7029. [Google Scholar] [CrossRef]
- Dam, S.K.; John, V. High-resolution converter for battery impedance spectroscopy. IEEE Trans. Ind. Appl. 2018, 54, 1502–1512. [Google Scholar] [CrossRef]
- Gaberšček, M. Understanding Li-based battery materials via electrochemical impedance spectroscopy. Nat. Commun. 2021, 12, 19–22. [Google Scholar] [CrossRef] [PubMed]
- Shafiei Sabet, P.; Warnecke, A.J.; Meier, F.; Witzenhausen, H.; Martinez-Laserna, E.; Sauer, D.U. Non-invasive yet separate investigation of anode/cathode degradation of lithium-ion batteries (nickel–cobalt–manganese vs. graphite) due to accelerated aging. J. Power Sources 2020, 449, 227369. [Google Scholar] [CrossRef]
- Xiong, R.; Li, L.; Tian, J. Towards a smarter battery management system: A critical review on battery state of health monitoring methods. J. Power Sources 2018, 405, 18–29. [Google Scholar] [CrossRef]
- Li, X.; Ahmadi, M.; Collins, L.; Kalinin, S.V. Deconvolving distribution of relaxation times, resistances and inductance from electrochemical impedance spectroscopy via statistical model selection: Exploiting structural-sparsity regularization and data-driven parameter tuning. Electrochim. Acta 2019, 313, 570–583. [Google Scholar] [CrossRef]
- Huang, J.; Sullivan, N.P.; Zakutayev, A.; O’hayre, R. How reliable is distribution of relaxation times (DRT) analysis? A dual regression-classification perspective on DRT estimation, interpretation, and accuracy. Electrochim. Acta 2023, 443, 141879. [Google Scholar] [CrossRef]
- Zhu, J.; Knapp, M.; Liu, X.; Yan, P.; Dai, H.; Wei, X.; Ehrenberg, H. Low-temperature separating lithium-ion battery interfacial polarization based on distribution of relaxation times (DRT) of impedance. IEEE Trans. Transp. Electrif. 2020, 7, 410–421. [Google Scholar] [CrossRef]
- Sohaib, M.; Choi, W. A Novel Aging Diagnosis Method Using Distribution of Relaxation Time; The Korean Institute of Power Electronics: Seoul, Republic of Korea, 2024. [Google Scholar]
- Huang, S.; Li, K.; He, Z.; Wang, Y.; Li, C.; Li, H.; Yu, H.; Chen, Y.; Chen, L. Rolling strategy for highly efficient preparation of phosphating interface enabled the stable lithium anode. J. Alloys Compd. 2024, 1005, 176193. [Google Scholar] [CrossRef]
- Zhang, Y.; Tang, Q.; Zhang, Y.; Wang, J.; Stimming, U.; Lee, A.A. Identifying degradation patterns of lithium ion batteries from impedance spectroscopy using machine learning. Nat. Commun. 2020, 11, 1706. [Google Scholar] [CrossRef] [PubMed]
- Pender, J.P.; Jha, G.; Youn, D.H.; Ziegler, J.M.; Andoni, I.; Choi, E.J.; Heller, A.; Dunn, B.S.; Weiss, P.S.; Penner, R.M.; et al. Electrode degradation in lithium-ion batteries. ACS Nano 2020, 14, 1243–1295. [Google Scholar] [CrossRef]
- Yang, H.; Zheng, H.; Yu, H.; Qu, B.; Chen, L.; Niu, J.; Chen, Y. Coordinating ionic and electronic conductivity on 3D porous host enabling deep dense lithium deposition toward high-capacity lithium metal anodes. Nanoscale 2022, 14, 13722–13730. [Google Scholar] [CrossRef] [PubMed]
Disclaimer/Publisher’s Note: The statements, opinions and data contained in all publications are solely those of the individual author(s) and contributor(s) and not of MDPI and/or the editor(s). MDPI and/or the editor(s) disclaim responsibility for any injury to people or property resulting from any ideas, methods, instructions or products referred to in the content. |
© 2025 by the authors. Licensee MDPI, Basel, Switzerland. This article is an open access article distributed under the terms and conditions of the Creative Commons Attribution (CC BY) license (https://creativecommons.org/licenses/by/4.0/).