Abstract
Lithium-ion batteries (LIBs) have the lead as the most used power source for electric vehicles and grid storage systems, and a battery thermal management system (BTMS) can ensure the efficient and safe operation of lithium-ion batteries. Epoxy resin board (ERB) offers a wide range of applications in LIBs due to its significant advantages such as high dielectric strength, electrical insulation, good mechanical strength, and stiffness. This study proposes an air-cooled battery module comprised of sixteen prismatic batteries incorporating an ERB layer between the batteries. To compare the performance of the ERB-based air-cooling system, two other air-cooling structures are also assessed in this study. Three-dimensional numerical models for the three cases are established in this paper, and the heat dissipation processes of the battery module under varying discharge rates (1C, 2C, and 5C) are simulated and analyzed to comprehensively evaluate the performance of the different cooling systems. Comparative simulations reveal that incorporating ERB into the battery assembly significantly reduces battery surface temperatures and promotes temperature uniformity across individual batteries and the entire pack at various discharge rates. Notably, under 5C discharge conditions, the ERB-based thermal management system achieves a maximum battery surface temperature increase of 16 °C and a maximum temperature difference of 8 °C between batteries. Additionally, this paper also analyzes the impact of battery arrangement on air-cooling system performance. Therefore, further optimization of the structural design or the integration of supplementary cooling media might be necessary for such demanding conditions.
1. Introduction
Due to their high energy density, long cycle life, minimal self-discharge, low maintenance, and environmental friendliness [1], lithium-ion batteries (LIBs) have revolutionized portable electronics and are poised to transform the energy landscape by powering electric vehicles and grid storage systems [2,3]. The temperature of LIBs significantly impacts their electrochemical performance. The acceptable operating temperature range for lithium-ion batteries is between −20 °C and 60 °C [4], with the optimal operating temperature being between 20 °C and 40 °C [5,6]. The maximum temperature difference between individual batteries within a battery pack should not exceed 5 °C [7,8]. Extreme temperatures or uneven heat distribution within the battery pack can significantly reduce battery performance, lifespan, and safety. To mitigate this, systems like grid storage and electric vehicles–which rely on a large number of LIBs connected in series and parallel–employ a battery thermal management system (BTMS) [9]. This system ensures optimal operating temperatures for the batteries and minimizes temperature differences between them.
BTMS can be categorized, based on their cooling medium, into air cooling, liquid cooling, and phase change material (PCM) cooling [10,11,12,13,14,15]. Air cooling tends to be favored in commercial applications due to its simple structure, low cost, and lightweight design compared to other options. However, it has limitations such as limited cooling capacity and poor temperature uniformity. To address these drawbacks, researchers are actively exploring ways to improve air-cooling technology.
A review of prior research reveals that different optimization techniques can be employed to enhance air-cooling systems. These techniques encompass strategic structural design, optimized battery placement, and the incorporation of supplementary cooling media. Chen et al. [16] presented a design for optimizing cell spacing distribution within a parallel air-cooled BTMS to enhance its cooling efficiency. The numerical results for different cases demonstrated a significant improvement in BTMS cooling efficiency following cell spacing optimization using the developed strategy. Wang et al. [10] proposed a novel method to enhance the cooling performance of BTMS by optimizing airflow distribution within the battery pack using parallel plates. They numerically evaluated the effectiveness of this method by comparing the cooling performance of nine different BTMS designs. Ma et al. [17] studied a novel U-type parallel air-cooled battery module that leveraged silica cooling plates to create efficient cooling channels. This design achieved a significant 10 K reduction in the maximum average battery cell temperature and a substantial 57% decrease in temperature difference across the module (from 4.29 K to 1.84 K) compared to traditional U-type parallel air-cooled modules. Feng et al. [18] utilized numerical simulation to gain a better understanding of the system efficiency of a T-type symmetric air-cooling BTMS and its coupled systems. Their study found that cooling performance and energy consumption reach optimal values for an internal clearance of 3 mm and an inlet air velocity of 6 m·s−1. Yu et al. [19] utilized the finite element method to simulate a lithium-ion battery pack cooled by a central liquid flow channel within an air channel. Laminar nanofluids or water flowed through the central tube. They investigated the impact of varying airflow rate on pack temperature, heat transfer coefficient, and outlet temperatures by using a transient analysis.
In the study of air-cooled systems for lithium-ion batteries, numerical simulation has always been an important method. Researchers use various numerical models to study optimization methods for air-cooled systems. Mahamud et al. [7] numerically analyzed a battery thermal management method using reciprocating air flow for cylindrical LIB. The analysis was conducted using a two-dimensional computational fluid dynamics (CFD) model, a lumped-capacitance thermal model for the battery cells, and a flow network model. Chen et al. [20] investigated the structural optimization of a parallel air-cooled BTMS to enhance the system’s cooling performance. A flow resistance network model was introduced to calculate the velocities in the system’s cooling channels. The numerical results demonstrated that the velocities predicted by the flow resistance network model were in good agreement with those calculated using the CFD method, validating the model’s effectiveness. E et al. [21] utilized the CFD method along with a lumped model of a single cell to investigate the thermal characteristics of a 60-cell 18,650 battery module with standard battery holders. The study focused on exploring the air-cooling performance of the battery module, taking into account the impedance of the battery holders. Li et al. [22] developed a three-dimensional thermo-electrochemical model to simulate the detailed temperature distribution within battery packs. This model was used to compare the cooling effects of both natural and forced air ventilation configurations. Furthermore, an artificial neural network (ANN) model was integrated with the CFD simulation results to optimize the configuration of a specific battery system, simultaneously considering dimensional parameters and operating conditions.
Epoxy resin board (ERB) [23] offers a wide range of applications in LIBs due to its significant advantages [24,25]. ERB boasts high dielectric strength and electrical insulation, making it ideal for use in electrical and electronic applications by preventing electrical leakage and short circuits. Its good mechanical strength, stiffness, and dimensional stability allow ERB to withstand mechanical stress and vibrations, making it suitable for structural components or as support material for electronic devices. ERB also exhibits excellent chemical resistance, maintaining its integrity and performance in harsh environments. Furthermore, its inherent flame retardancy, characterized by low flammability and resistance to combustion, is crucial for applications where fire safety is critical [26]. The study by Chen et al. [27] investigated the effect of ERB on mitigating thermal runaway (TR) propagation in lithium-ion batteries. The findings revealed that ERB can significantly reduce the peak temperature of the battery module, lessen the severity of thermal runaway, and prevent the occurrence of violent jet flames. In parallel-connected battery modules, the average TR propagation time was 198 s per battery with 2 mm of ERB, which is 2.29 times longer than without ERB. With 4 mm of ERB, the average propagation time increased to 5.57 times longer than without ERB. In series-connected battery modules, the average TR propagation time was 2.09 times longer with 2 mm of ERB. The use of 4 mm of ERB completely prevented TR propagation.
The common methods currently used to enhance lithium-ion battery air-cooling systems, as reported in the literature, may increase the system’s cost, weight, or volume, making it unsuitable for certain applications. However, incorporating an ERB layer between the batteries yields significant advantages, as this design not only enhances the module’s mechanical and electrical safety, but the ERB material itself can also act as a heat storage and transfer medium during battery operation. Additionally, the integration of ERB has minimal impact on the overall cost, weight, and volume of the air-cooling system. This study proposes an air-cooled battery module integrated with ERB layers, and to investigate and compare the thermal performance of the module, which consists of sixteen prismatic batteries, three-dimensional coupled CFD models are developed based on three thermal management schemes. The heat dissipation processes of the battery module under various discharge rates (1C, 2C, and 5C) were simulated to evaluate and compare the performance of the different cooling structures. Additionally, the impact of battery arrangement on air-cooling system performance was also discussed.
2. Model Description
The schematic diagram of the battery with the ERB incorporated is depicted in Figure 1. The figure depicts a prismatic battery with a lithium iron phosphate (LiFeO4) cathode and a graphite anode. The nominal capacity of the battery is 25 Ah, and its dimensions are 140 mm × 7.6 mm × 264 mm (length × width × height). ERB measures 140 mm × 3.9 mm × 224 mm (length × width × height).
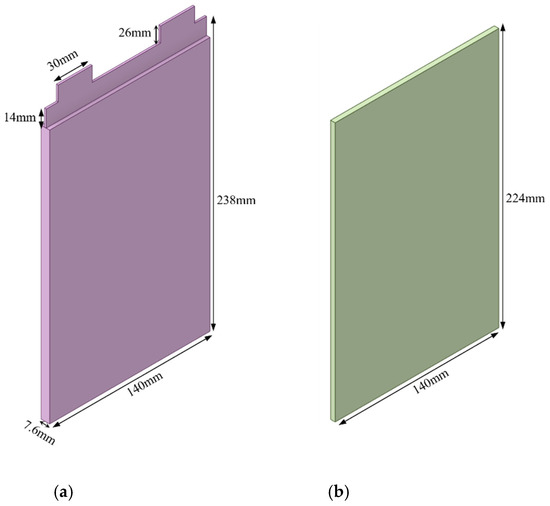
Figure 1.
Schematic of (a) battery (b)ERB.
In this paper, three different air-cooling systems are employed, and their geometric configurations of the BTMS are shown in Figure 2. Each BTMS incorporates sixteen prismatic batteries connected in series, numbered from #1 to #16 successively from the air inlet to the outlet direction. The epoxy resin boards are affixed to the broad faces (YZ plane) of the batteries, and an ERB is then placed directly between the battery underside and the airbox. The dimensions of the airbox are (length × width × height) 420 mm × 300 mm × 280 mm. Air enters the airbox through a single circular opening with a diameter of 60 mm. After exchanging heat with the batteries, the airflow exits through twenty 20 mm diameter circular openings.
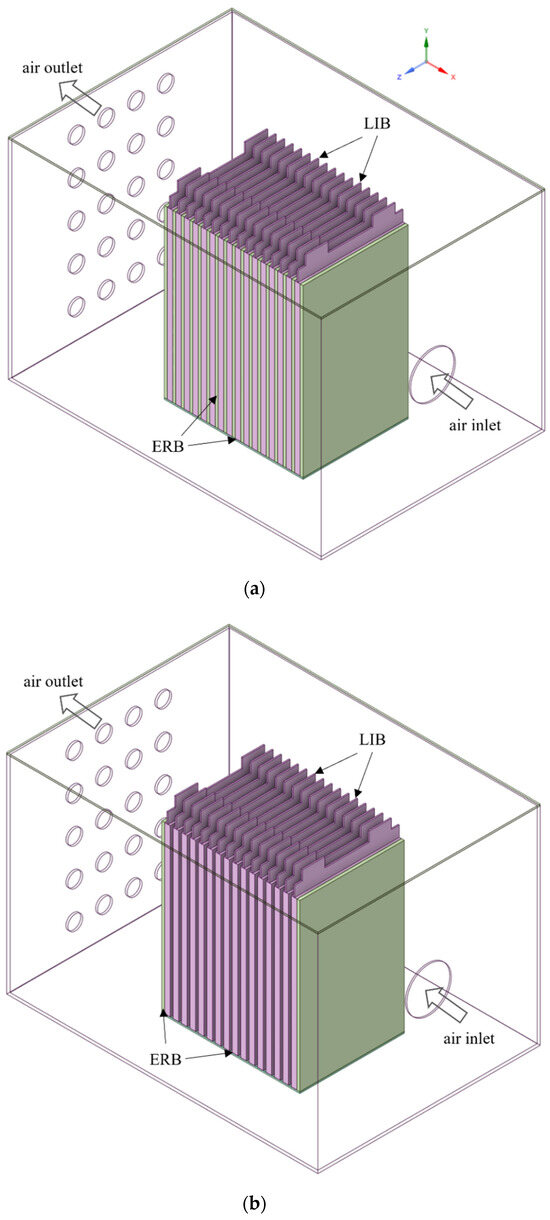
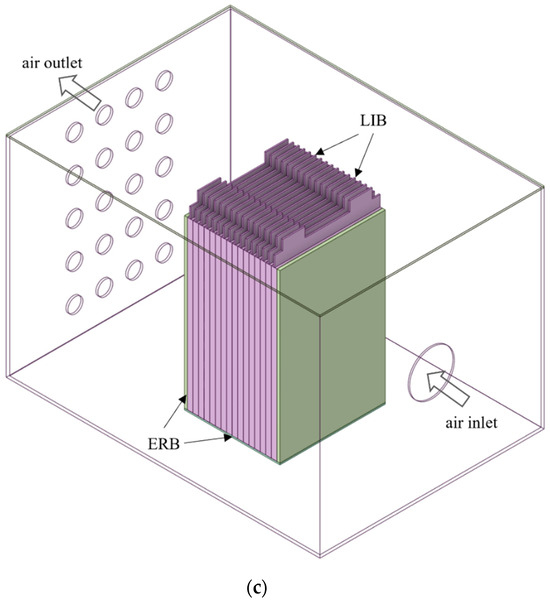
Figure 2.
Diagram of the air-cooling battery module. (a) air/ERB module (Case 1), (b) air module with spacing between batteries (Case 2), (c) air module without spacing between batteries (Case 3).
Figure 2a shows the air/ERB module (Case 1) with the ERBs attached to the broadside surfaces of each battery. For comparison, Figure 2b (Case 2) and Figure 2c (Case 3) depict configurations with ERBs installed only on the external surfaces of batteries #1 and #16. The key distinction between Figure 2b,c lies in the spacing between the batteries. In Figure 2b, the gaps between the batteries form cooling channels with a width that matches the thickness of the ERB. In contrast, Figure 2c shows batteries, which have no gaps between them.
3. Numerical Description
3.1. Model Assumptions and Governing Equations
This study utilizes the CFD methodology to establish a three-dimensional coupled model of flow and heat transfer. This model is employed to calculate the temperature distribution and flow field within the air-cooling module. Three assumptions are made to simplify the formulation and facilitate the analysis: (1) the thermophysical properties of the battery, ERB, and air do not take into account the temperature variations; (2) the battery takes the form of a uniform and isotropic solid with constant thermophysical properties, except in what concerns the spatial variation of the thermal conductivity; and (3) the contribution of radiative heat transfer is negligible in this research.
The governing equations for the airflow are the Reynolds-averaged Navier–Stokes (RANS) equations coupled with the standard k-ε turbulence model; these equations are as follows [28]:
Continuity equation:
Momentum conservation equation:
Turbulent kinetic energy equation:
Turbulent kinetic energy dissipation equation:
where and denote the density and dynamic viscosity of the air, respectively; and p denote the Reynolds-averaged velocity and pressure, respectively, and k, ε, and denote the turbulent kinetic energy, turbulent kinetic energy dissipation, and turbulent dynamic viscosity, respectively.
As the temperature distribution within the computational model is inherently time-dependent, unsteady temperature equations are employed to capture these variations. These equations govern the temperature behavior within the battery, ERB, and air domains, as presented below.
where ρ, , and λ are the density, specific heat capacity, and thermal conductivity, respectively. q is the battery heat generation rate. Subscripts b, e, and a refer to the battery, ERB, and air, respectively.
3.2. Heat Generation of Battery
The heat generation rate of the battery is composed of irreversible and reversible components and, considering its relatively small value, the reversible heat is neglected in this study. The irreversible heat () consists of ohmic heat caused by ohmic loss and polarization heat caused by polarization; when both quantities are expressed in terms of internal resistance, the irreversible heat can be formulated by the following relation [29]:
where I is the current of the battery during discharge, and R is the internal resistance of the battery.
Table 1 presents the parameters required in the simulations.

Table 1.
Material properties.
3.3. Boundary and Initial Conditions
The simulation employs velocity inlet and pressure outlet conditions. Based on the design parameters, the air mass flow rate at the inlet is set to 0.02 kg/s, while the gauge pressure at the outlet is set to 0 Pa. The walls of the airbox are adiabatic in what concerns the surrounding environment. A uniform temperature of 298.15K was used to initialize the entire system, including the air-cooling system and the batteries.
3.4. Numerical Strategy and Model Validation
The implementation of the numerical model of the air-cooling module was based on the framework of the commercial CFD flow solver Fluent®, which uses the finite volume method (FVM) discretization. Often, the second order upwind differencing scheme is used to discretize the advective terms, while the transient terms are discretized by using a fully implicit scheme.
The computational mesh consists of hexahedral elements. Local mesh refinement is employed to create a sufficiently fine mesh in regions of rapid heat generation and release. Grid independence validation was conducted for all models in this paper. To illustrate the verification process, Case 1 is used as an example. Four different meshes are applied to discretize the model. The maximum temperature of the battery surface at the end of the 5C discharge process is presented in Table 2. The results indicate that a grid size of 5.3 × 10⁶ is appropriate, as further increases in the grid result in negligible improvements in the results.

Table 2.
Grid independence verification.
To validate the accuracy of the model, the simulation results are compared with data from the literature. Chen et al. [30] investigated the temperature characteristics of a single pouch battery under different wind speed conditions at a 2.71C discharge rate. The results showed that at a wind speed of 6 m/s, the temperature rise of the battery was approximately 7 °C. Luo et al. [31] proposed a thermal management system that couples a silicon-based cooling plate, an aluminum-based cooling plate, and a forced convection air-cooling system. The results showed that when the air flow speed was 6 m/s, the maximum temperature rise of a module consisting of six pouch cells was 19 °C at a 4C discharge rate. In this study, the battery module exhibits maximum temperature rises of approximately 6 °C and 20 °C at discharge rates of 2C and 5C, respectively. Although there are some differences, the simulation results are generally consistent with the data from the literature in terms of magnitude, indicating the reasonableness of the model.
4. Results and Discussion
In this study, to assess the thermal behavior of the battery module under different discharge rate scenarios, the discharge processes of 1C, 2C, and 5C were simulated for the three cases considered. The simulation results provide the basis to analyze and compare the thermal behavior of the lithium-ion batteries under different operating conditions. The impact of battery arrangement on air-cooling system performance was also discussed.
4.1. Streamlines and Velocity Contours
Figure 3 depicts the flow field distributions for three cases. The streamlines and velocity contours reveal a high-velocity zone at the air inlet, with a maximum velocity of approximately 6.1 m/s. Upon entering the battery module area, a front-mounted ERB diverts the flow path. This deflection results in a recirculation zone at the bottom of the inlet and airflow directed towards the airbox walls in the remaining directions. Consequently, the air velocity on the battery surface is quite low, as it can be noted in Figure 3b that the air velocity between the batteries is also relatively low for Case 2, with a maximum velocity of approximately 0.25 m/s. The upper part of the air channels between batteries #1, #2, #3, and #4 is the region with the highest air velocity, while the middle region of the air channels has the lowest velocity. The streamlines reveal multiple vortex regions in the airflow, especially near the battery module. These vortex regions could lead to localized uneven cooling, potentially affecting the overall thermal management performance.
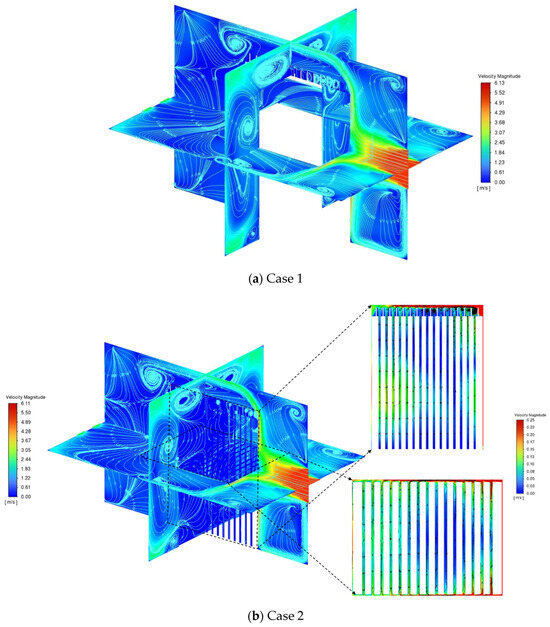
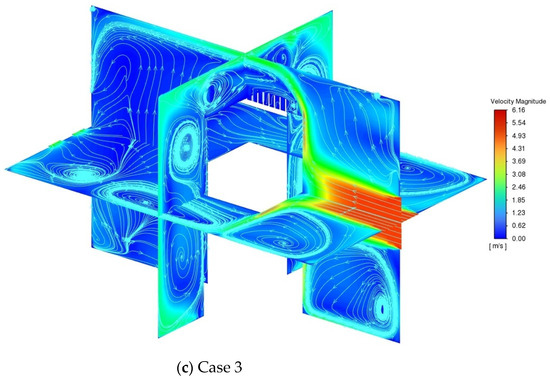
Figure 3.
Characterization of flow field distributions in the three cases.
4.2. Temperature Contours
Figure 4 presents the temperature contours for the batteries under 1C, 2C, and 5C discharge processes (left to right) in the three cases. Overall, as the discharge rate increases, both the minimum and maximum temperatures of the battery also increase. At a discharge rate of 1C, the temperature increase is minor for all three cases, attributed to the battery’s low heat generation. However, as the discharge rate increases, at 2C, the maximum temperature for Case 1 is lower than that of the other two cases, while the minimum temperature for Case 3 is higher than that of the other two cases. Case 1 exhibits both the lowest maximum and minimum temperatures among the three cases, and the maximum temperatures for Cases 2 and 3 are significantly higher than that of Case 1 during the 5C discharge process. The addition of the ERB leads to the partial absorption of the heat generated during battery discharge, in this way, effectively lowering the battery temperature. As for Case 2, due to the low air velocity between the batteries, the amount of heat that can be taken away from the batteries is limited, leading to a maximum temperature comparable to Case 3.

Figure 4.
Characterization of temperature field distributions at different discharge rates for the three cases studied: (a) Case 1, (b) Case 2, and (c) Case 3.
Furthermore, as observed in Figure 4, the temperature distribution of the batteries exhibits significant variations in different cases with discharge rates. The temperature distribution changes in Case 2 are more significant compared to Cases 1 and 3 under different discharge rate conditions. In Case 1, the high-temperature region is concentrated in the central core region of the batteries due to lower heat dissipation conditions compared to those of the outer batteries. In addition, the upper part of the batteries has better heat dissipation conditions than the lower part, resulting in lower temperatures at the top compared to the bottom of the batteries. As the discharge rate increases, the heat rate generated by the batteries is higher than the heat rate dissipated by the cooling system leading to an expansion of the high-temperature region. In contrast to Cases 1 and 3, the temperature distribution of the batteries in Case 2 is also influenced by the air flow between the batteries. The high-temperature region is located in the batteries adjacent to the channels with lower airflows, as seen in Figure 3b. The increase in the high-temperature region is more significant as the discharge rate rises. Due to the direct contact between the batteries, the high-temperature region only presents minor changes throughout the discharge process, and it is located in the core region for Case 3.
4.3. Temperature Characterization of Single Battery
Given the non-uniform distribution of surface temperature on the battery, this study begins by examining the variations in the average temperature of the battery surface. Figure 5 illustrates the evolution of the average surface temperature for sixteen individual batteries under various discharge rate scenarios. Notably, battery #1 consistently exhibits the lowest average surface temperature due to its superior heat dissipation characteristics. Battery #16 exhibits favorable heat dissipation conditions, resulting in an average surface temperature only slightly higher than that of battery #1 in most cases. The velocity contour plot in Figure 3 indicates that battery #1, situated adjacent to the air inlet, exhibits the maximum velocity, while battery #16, positioned near the air outlet, experiences a significantly higher velocity compared to the internal batteries. Consequently, batteries #1 and #16 benefit from superior side cooling. In Case 1, batteries #4 and #10 exhibit the highest average surface temperatures during the 1C and 2C discharge processes, respectively. During the 5C discharge process, battery #3 has the highest average surface temperature. Across different discharge processes in Case 2, battery #3 consistently exhibits the highest temperature, followed by battery #10. Batteries #5, #6, #10, #11, and #12 exhibit the highest average surface temperatures across different discharge processes for Case 3. The average temperature differences between these batteries are small.
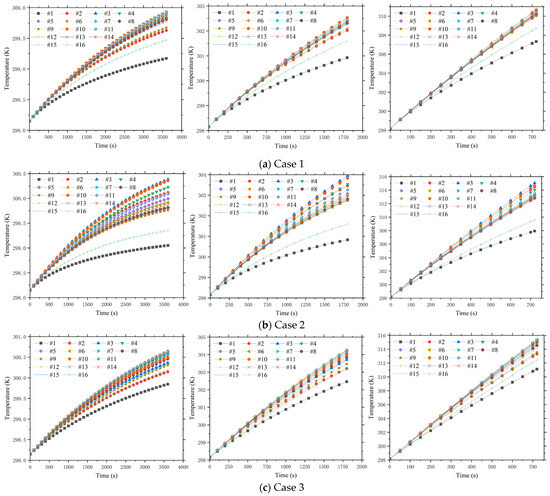
Figure 5.
Average surface temperature evolution of 16 individual batteries for the three cases studied: (a) Case 1, (b) Case 2, and (c) Case 3.
Figure 5 compares the differences in average surface temperature between batteries, but it does not reflect the maximum temperature difference on the individual surface of a single battery. Figure 6 compares the maximum temperature differences on the surfaces of individual batteries at the end of discharge for the three cases.
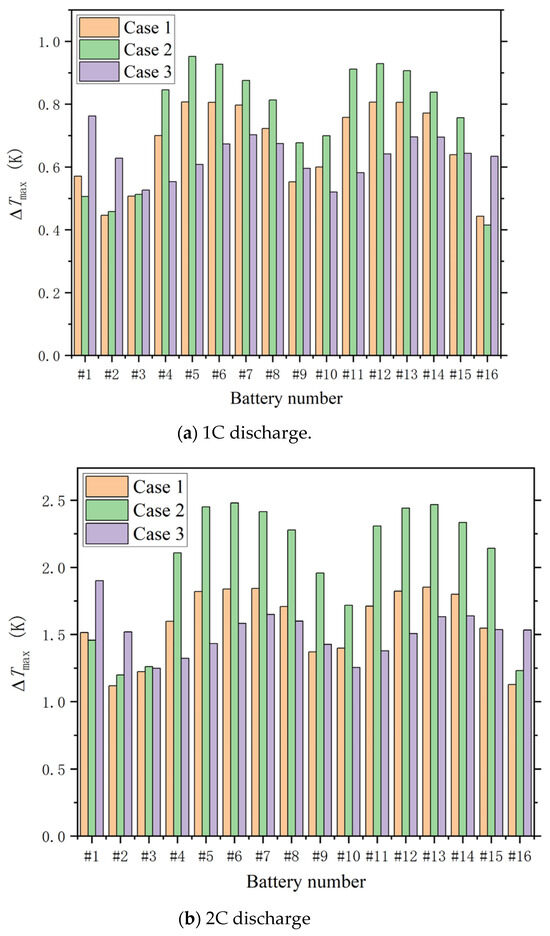
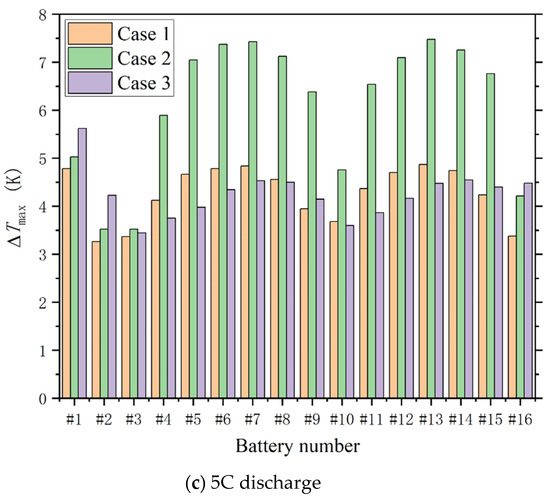
Figure 6.
Comparison of the surface maximum temperature difference of 16 single batteries for the three cases studied: (a) Case 1, (b) Case 2, and (c) Case 3.
The maximum temperature difference on the battery surfaces does not exceed 1 °C at the end of 1C discharge, as seen in Figure 6a. For all three cases, the temperature distribution on the battery surfaces is relatively uniform under low discharge rates; in the 2C discharge process, the maximum temperature difference on the battery surfaces is close to 2.5 °C in Case 2, while the maximum temperature difference in Cases 1 and 3 remains below 2 °C, as seen in Figure 6b. Figure 6c shows that under the 5C discharge rate, the maximum temperature difference on the battery surfaces is about 7.5 °C in Case 2, while the maximum temperature difference is approximately 5 °C and 5.5 °C for Cases 1 and 3, respectively. This observation leads to the conclusion that Case 2 exhibits the largest temperature difference on the battery surfaces across different discharge rates, leading to the most uneven distribution of battery temperatures. The velocity contour and streamline plots in Figure 3 demonstrate that the non-uniform air velocity distribution in Case 2 results in disparate cooling conditions for the internal batteries, leading to the maximum surface temperature difference among individual batteries. Furthermore, Figure 6c indicates that in outer batteries #1, #2, and #16, the temperature difference of Case 3 is the largest at different discharge rates. For the remaining batteries, the temperature difference is the largest in Case 2 under different conditions.
4.4. Temperature Characterization of Battery Module
The temperature difference between batteries within a module can impact battery lifespan, and Figure 7 illustrates the highest temperature, lowest temperature, and maximum temperature difference on the battery surfaces within the battery module during the discharge process. For all the cases, Figure 7 indicates that Case 1 has the lowest maximum and minimum battery temperatures. Case 2 has a maximum temperature that is close to Case 3, and its minimum temperature is higher than Case 3 during both 2C and 5C discharge processes. Additionally, the maximum temperature difference between batteries is less than 5 °C for all three cases under 1C and 2C discharge conditions. The temperature difference is smallest for Case 1 and largest for Case 2. At a discharge rate of 5C, the maximum temperature difference for all three cases exceeds 5 °C. In particular, the maximum temperature difference reaches 12 °C for Case 2. Figure 7 also shows that for Case 1, the addition of an ERB between the batteries not only lowers the minimum temperature of the batteries but also has an equalizing effect. In contrast, for Case 2, although there is an air channel between the batteries, the air channel is very narrow. Due to the low thermal conductivity of air, the temperature difference between the batteries is large; therefore, under high-rate discharge conditions, the thermal management methods adopted for the three cases cannot effectively lower the temperature of the batteries. Consequently, it is necessary to consider coupling with other thermal management methods or optimizing the thermal management structure.
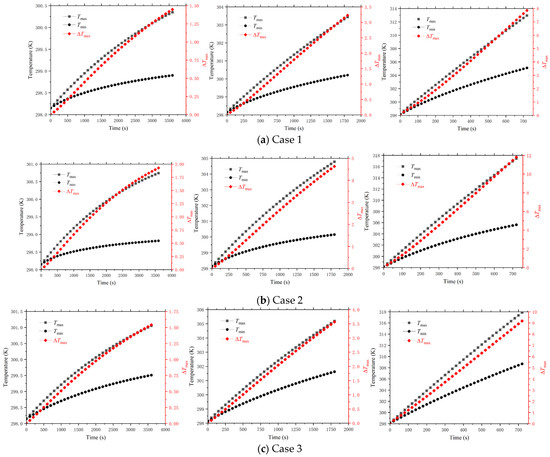
Figure 7.
Temperature characterization of batteries module for the three cases studied: (a) Case 1, (b) Case 2, and (c) Case 3.
4.5. Influence of Battery Arrangement
The batteries are arranged so that air flows perpendicularly across the layers, starting from the first battery and then circulating around the entire battery block in the three cases, as depicted in Figure 2. Additionally, Case 4 is introduced, where the batteries are rotated 90° to demonstrate the effect of direct frontal impact between the cooling air and all the batteries, rather than just the first battery, as shown in Figure 8. A 5C discharge simulation is performed to study the flow and temperature characteristics of the battery module for Case 4.
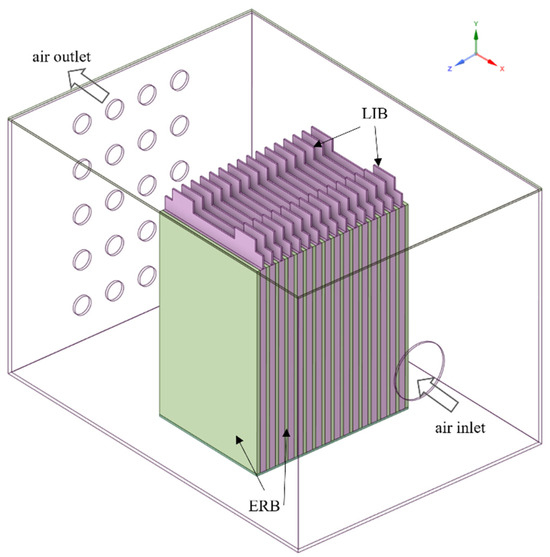
Figure 8.
Diagram of the air-cooling battery module (Case 4).
Figure 9 presents the flow field and temperature distribution from the simulation results at the end of the discharge process for Case 4. As shown in Figure 9a, the streamlines and velocity contours indicate a high-velocity zone near the air inlet, with a peak velocity of approximately 6.1 m/s. The streamlines also reveal several vortex regions in the airflow. Figure 9b illustrates that the maximum temperature is concentrated in the central region of the middle battery, while the battery’s surface maintains a relatively lower temperature profile. This temperature distribution can be attributed to the superior heat dissipation capability of the battery’s outer surface.
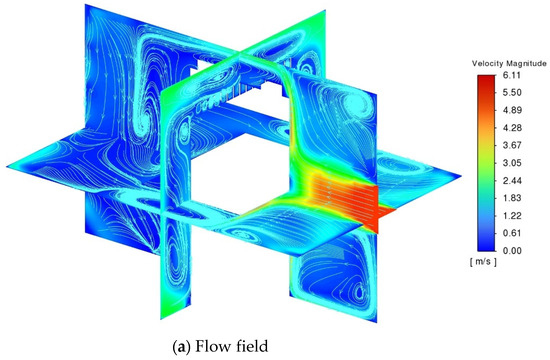
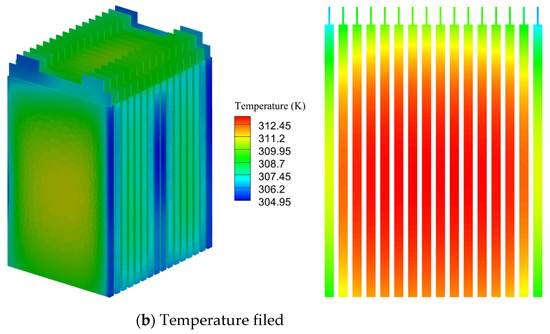
Figure 9.
Characterization of flow field and temperature field distributions for Case 4: (a) Flow field, (b) Temperature field.
The thermal behavior of the individual batteries and the module during the 5C discharge is depicted in Figure 10. As shown in Figure 10a, the average surface temperature of the outermost batteries remains the lowest throughout the discharge process, with the average surface temperatures of the other batteries remaining relatively similar. Figure 10b indicates that by the end of the discharge process, the maximum surface temperature difference across all batteries is relatively large, exceeding 6 °C. Compared to the results of Case 1, this suggests that Case 4 increases the maximum surface temperature difference across the battery surfaces. The non-uniform flow distribution, with higher flow rates near the air inlet and lower flow rates near the outlet, results in disparate heat transfer conditions across the battery surface, contributing to the observed temperature difference. The highest temperature, lowest temperature, and maximum temperature difference within the battery module are similar to those observed in Case 1, as shown in Figure 10c.
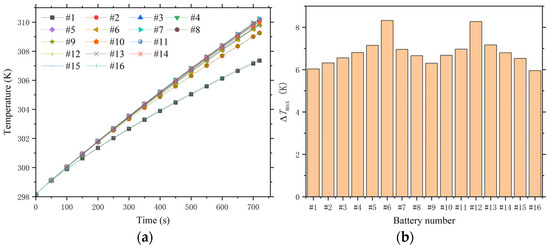
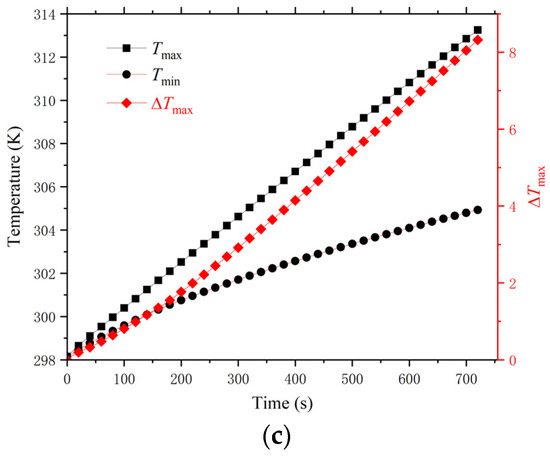
Figure 10.
Characterization of temperature for Case 4: (a) Average surface temperature evolution of 16 individual batteries, (b) Surface maximum temperature difference of 16 single batteries, and (c) Temperature characterization of battery module.
5. Conclusions
The purpose of the study is to evaluate the cooling performance and temperature uniformity for an air-cooled battery module comprised of sixteen prismatic batteries based on ERB. To this aim, the developed three-dimensional models of three battery module air-cooling systems were used to simulate the heat dissipation processes of each system under different discharge rates (1C, 2C and 5C). The results allow the performance comparison of the three different cooling systems. Additionally, the paper analyzes the impact of battery arrangement on the performance of the air-cooling system. The main findings are summarized as follows:
(1) Comparative simulations demonstrate that the incorporation of ERB into the battery assembly effectively reduces battery surface temperatures and enhances temperature uniformity across individual batteries and the entire battery pack at a range of discharge rates. The ERB functions as a heat sink, absorbing heat and preventing excessive temperatures within the battery due to heat accumulation. Additionally, the ERB establishes thermal coupling between the batteries, enhancing the temperature uniformity of the entire module.
(2) According to the simulation results, under 5C discharge conditions, the ERB-based thermal management system resulted in a maximum surface temperature rise of approximately 16 °C for the batteries and a maximum temperature difference of 8 °C between the batteries. It is evident that the air-cooling thermal management method utilizing ERB is not effective in lowering battery temperatures and improving temperature uniformity between batteries under high discharge rates. It is necessary to consider optimizing the structural design or incorporating supplementary cooling media.
(3) Simulation results reveal that modifying the battery arrangement results in a marginal increase in the surface temperature difference of individual batteries, while the overall flow field and temperature distribution remain relatively unchanged. The presence of vortices within the flow field highlights the potential for optimizing the air-cooling system design.
The proposed combination of air and ERB cooling provides a solution for managing heat dissipation in compact battery configurations, especially in applications where thermal management is crucial for ensuring the longevity and safety of prismatic batteries. Future research could explore the integration of advanced cooling technologies, such as phase change materials or liquid cooling, to further enhance thermal performance. Additionally, experimental study and flow channel optimization could provide deeper insights into the applicability of this cooling method in battery thermal management systems.
Author Contributions
D.L.: Literature search, Visualization, Writing—original draft. P.P.: Visualization, Methodology, Writing—original draft. Y.W.: Methodology. Y.Q.: Visualization, Analysis. W.W.: Literature search, Visualization. F.J.: Conceptualization, Supervision, Resources, Writing—review and editing, Funding acquisition. All authors have read and agreed to the published version of the manuscript.
Funding
This research was funded by State Grid Zhejiang Electric Power Co., Ltd. Science and Technology Research grant number B311DS24000H.
Data Availability Statement
The original contributions presented in the study are included in the article, further inquiries can be directed to the corresponding author.
Conflicts of Interest
Author D.L. was employed by the State Grid Zhejiang Electric Power Co., Ltd. Research Institute. The remaining authors declare that the research was conducted in the absence of any commercial or financial relationships that could be construed as a potential conflict of interest.
Nomenclature
| cp | specific heat capacity, J kg−1 K−1 |
| parameters of the k-ε model | |
| I | current, A |
| k | turbulent kinetic energy, m2 s−2 |
| p | pressure, pa |
| Pk | turbulent kinetic energy generation result of mean velocity, W m−3 |
| q | volumetric heat generation rate, W m−3 |
| R | resistance, Ω |
| T | temperature, K |
| t | time, s |
| ui | velocity component, m s−1 |
| velocity vector, m s−1 | |
| xi | coordinate component, m |
| Greek symbols | |
| gradient operator | |
| turbulent kinetic energy dissipation, m2 s−3 | |
| thermal conductivity, W m−1 K−1 | |
| dynamic viscosity, Pa s | |
| turbulent dynamic viscosity, Pa s | |
| density, kg m−3 | |
| k-ε model parameters | |
| Subscripts | |
| a | air |
| b | battery |
| e | ERB |
| Acronyms | |
| BTMS | battery thermal management system |
| PCM | phase change material |
| ERB | epoxy resin board |
| CFD | computational fluid dynamics |
| FVM | finite volume method |
References
- Houache, M.S.E.; Yim, C.H.; Karkar, Z.; Abu-Lebdeh, Y. On the current and future outlook of battery chemistries for electric vehicles—Mini review. Batteries 2022, 8, 70. [Google Scholar] [CrossRef]
- Martínez-Sánchez, R.; Molina-García, A.; Ramallo-González, A.P. Regeneration of Hybrid and Electric Vehicle Batteries: State-of-the-Art Review, Current Challenges, and Future Perspectives. Batteries 2024, 10, 101. [Google Scholar] [CrossRef]
- Ajanovic, A.; Haas, R. Electric vehicles: Solution or new problem? Environ. Dev. Sustain. 2018, 20, 7–22. [Google Scholar] [CrossRef]
- Väyrynen, A.; Salminen, J. Lithium-ion battery production. J. Chem. Thermodyn. 2012, 46, 80–85. [Google Scholar] [CrossRef]
- Saw, L.H.; Ye, Y.; Tay, A.A.; Chong, W.T.; Kuan, S.H.; Yew, M.C. Computational fluid dynamic and thermal analysis of Lithium-ion battery pack with air cooling. Appl. Energy 2016, 177, 783–792. [Google Scholar] [CrossRef]
- Dan, D.; Yao, C.; Zhang, Y.; Zhang, H.; Zeng, Z.; Xu, X. Dynamic thermal behavior of micro heat pipe array-air cooling battery thermal management system based on thermal network model. Appl. Therm. Eng. 2019, 162, 114183. [Google Scholar] [CrossRef]
- Mahamud, R.; Park, C. Reciprocating air flow for Li-ion battery thermal management to improve temperature uniformity. J. Power Sources 2011, 196, 5685–5696. [Google Scholar] [CrossRef]
- Zhong, G.; Zhang, G.; Yang, X.; Li, X.; Wang, Z.; Yang, C.; Yang, C.; Gao, G. Researches of composite phase change material cooling/resistance wire preheating coupling system of a designed 18650-type battery module. Appl. Therm. Eng. 2017, 127, 176–183. [Google Scholar] [CrossRef]
- Mali, V.; Saxena, R.; Kumar, K.; Kalam, A.; Tripathi, B. Review on battery thermal management systems for energy-efficient electric vehicles. Renew. Sustain. Energy Rev. 2021, 151, 111611. [Google Scholar] [CrossRef]
- Wang, M.; Teng, S.; Xi, H.; Li, Y. Cooling performance optimization of air-cooled battery thermal management system. Appl. Therm. Eng. 2021, 195, 117242. [Google Scholar] [CrossRef]
- Yin, B.; Zuo, S.; Xu, Y.; Chen, S. Performance of liquid cooling battery thermal management system in vibration environment. J. Energy Storage 2022, 53, 105232. [Google Scholar] [CrossRef]
- Peng, P.; Wang, Y.; Jiang, F. Numerical study of PCM thermal behavior of a novel PCM-heat pipe combined system for Li-ion battery thermal management. Appl. Therm. Eng. 2022, 209, 118293. [Google Scholar] [CrossRef]
- Yang, T.; Su, S.; Xin, Q.; Zeng, J.; Zhang, H.; Zeng, X.; Xiao, J. Thermal Management of Lithium-Ion Batteries Based on Honeycomb-Structured Liquid Cooling and Phase Change Materials. Batteries 2023, 9, 287. [Google Scholar] [CrossRef]
- Guo, Z.; Wang, Y.; Zhao, S.; Zhao, T.; Ni, M. Modeling and optimization of liquid-based battery thermal management system considering battery electrochemical characteristics. J. Energy Storage 2023, 70, 108028. [Google Scholar] [CrossRef]
- Xu, C.; Ma, C.; Souri, M.; Moztarzadeh, H.; Nasr Esfahani, M.; Jabbari, M.; Hosseinzadeh, E. Numerical Investigation of Thermal Management of a Large Format Pouch Battery Using Combination of CPCM and Liquid Cooling. Batteries 2024, 10, 113. [Google Scholar] [CrossRef]
- Chen, K.; Song, M.; Wei, W.; Wang, S. Design of the structure of battery pack in parallel air-cooled battery thermal management system for cooling efficiency improvement. Int. J. Heat Mass Transf. 2019, 132, 309–321. [Google Scholar] [CrossRef]
- Ma, R.; Ren, Y.; Wu, Z.; Xie, S.; Chen, K.; Wu, W. Optimization of an air-cooled battery module with novel cooling channels based on silica cooling plates. Appl. Therm. Eng. 2022, 213, 118650. [Google Scholar] [CrossRef]
- Feng, Z.; Zhao, J.; Guo, C.; Panchal, S.; Xu, Y.; Yuan, J.; Fraser, R.; Fowler, M. Optimization of the cooling performance of symmetric battery thermal management systems at high discharge rates. Energy Fuels 2023, 37, 7990–8004. [Google Scholar] [CrossRef]
- Yu, D.; Huang, W.; Wan, X.; Fan, S.; Sun, T. Optimization of simultaneous utilization of air and water flow in a hybrid cooling system for thermal management of a lithium-ion battery pack. Renew. Energy 2024, 225, 120248. [Google Scholar] [CrossRef]
- Chen, K.; Song, M.; Wei, W.; Wang, S. Structure optimization of parallel air-cooled battery thermal management system. Int. J. Heat Mass Transf. 2017, 111, 943–952. [Google Scholar] [CrossRef]
- E, J.; Yue, M.; Chen, J.; Zhu, H.; Deng, Y.; Zhu, Y.; Zhang, F.; Wen, M.; Zhang, B.; Kang, S. Effects of the different air cooling strategies on cooling performance of a lithium-ion battery module with baffle. Appl. Therm. Eng. 2018, 144, 231–241. [Google Scholar] [CrossRef]
- Li, A.; Yuen AC, Y.; Wang, W.; Weng, J.; Yeoh, G.H. Numerical investigation on the thermal management of lithium-ion battery system and cooling effect optimization. Appl. Therm. Eng. 2022, 215, 118966. [Google Scholar] [CrossRef]
- Jin, F.L.; Li, X.; Park, S. Synthesis and application of epoxy resins: A review. J. Ind. Eng. Chem. 2015, 29, 1–11. [Google Scholar] [CrossRef]
- Kim, Y.M.; Kim, S.; Lee, J.Y.; Park, Y.K. Pyrolysis reaction pathways of waste epoxy-printed circuit board. Environ. Eng. Sci. 2013, 30, 706–712. [Google Scholar] [CrossRef]
- Jia, Y.S.; Shi, R.F.; Jian, X. Development of epoxy resin and its application in electrical and electronic materials. J. Funct. Mater. 2020, 51, 40–45. [Google Scholar]
- Levchik, S.; Piotrowski, A.; Weil, E.; Yao, Q. New developments in flame retardancy of epoxy resins. Polym. Degrad. Stab. 2005, 88, 57–62. [Google Scholar] [CrossRef]
- Chen, C.; Niu, H.; Li, Z.; Li, L.; Mo, S.; Huang, X. Thermal runaway propagation mitigation of lithium-ion battery by epoxy resin board. Energy Storage Sci. Technol. 2019, 8, 532. (In Chinese) [Google Scholar]
- Launder, B.E. DB Spalding Mathematical Models of Turbulence; Academic Press: London, UK, 1972. [Google Scholar]
- Panchal, S.; Dincer, I.; Agelin-Chaab, M.; Fraser, R.; Fowler, M. Experimental and simulated temperature variations in a LiFePO4-20 Ah battery during discharge process. Appl. Energy 2016, 180, 504–515. [Google Scholar] [CrossRef]
- Chen, D.; Jiang, J.; Kim, G.H.; Yang, C.; Pesaran, A. Comparison of different cooling methods for lithium ion battery cells. Appl. Therm. Eng. 2016, 94, 846–854. [Google Scholar] [CrossRef]
- Luo, W.; He, F.; Huang, Q.; Li, X.; Zhang, G.; Zhong, Z. Experimental investigation on thermal performance of silica cooling plate-aluminate thermal plate-coupled forced convection-based pouch battery thermal management system. Int. J. Energy Res. 2019, 43, 7604–7613. [Google Scholar] [CrossRef]
Disclaimer/Publisher’s Note: The statements, opinions and data contained in all publications are solely those of the individual author(s) and contributor(s) and not of MDPI and/or the editor(s). MDPI and/or the editor(s) disclaim responsibility for any injury to people or property resulting from any ideas, methods, instructions or products referred to in the content. |
© 2024 by the authors. Licensee MDPI, Basel, Switzerland. This article is an open access article distributed under the terms and conditions of the Creative Commons Attribution (CC BY) license (https://creativecommons.org/licenses/by/4.0/).