Article

Experimental and Modeling Study of Arc Fault Induced Thermal Runaway in Prismatic Lithium-Ion Batteries

1
School of Electrical & Electronic Engineering, Harbin University of Science and Technology, Harbin 150080, China
2
School of Vehicle and Mobility, Tsinghua University, Beijing 100084, China
3
School of Mechanical & Automotive Engineering, Qingdao University of Technology, Qingdao 266520, China
*
Author to whom correspondence should be addressed.
Batteries 2024, 10(8), 269; https://doi.org/10.3390/batteries10080269
Submission received: 24 June 2024 / Revised: 16 July 2024 / Accepted: 25 July 2024 / Published: 28 July 2024
(This article belongs to the Section Battery Performance, Ageing, Reliability and Safety)

Abstract

:
With the widespread application of electrochemical energy storage technology, the safety issues of lithium-ion batteries have garnered significant attention. The issue of arc faults resulting from electrical failures is especially critical, as it can lead to catastrophic battery disasters. Therefore, this paper first established an arc testing platform and conducted experiments on top cover and body of prismatic lithium-ion batteries to analyze the thermoelectric characteristics between arc and battery. Under experimental conditions of 300 V and 15 A, it was found that arcs can induce thermal runaway in batteries. Subsequently, based on the experimental conditions, a mathematical model was established to induce thermal runaway in batteries through an equivalent method of arc heat source. By comparing the temperature curves of model and experiment, the RMSE of temperature at the center point of large surface was 5.09 °C (with a maximum temperature of 212 °C), indicating the accuracy of the model. This paper’s research on arc faults in battery systems revealed the evolution pattern and realized that arcs can trigger thermal runaway in batteries. The model for arc-triggered thermal runaway in batteries is highly accurate, capable of reducing the number of experiments, accelerating experimental progress, and is of significant importance for guiding the design of arc experiments about batteries.

1. Introduction

With the widespread application of electrochemical energy storage technologies, safety issues related to lithium-ion batteries (LIBs) have received significant attention [1,2,3]. Currently, numerous scholars have conducted in-depth research on the thermal runaway (TR) and thermal propagation issues of LIBs [4,5]. Common factors inducing TR in batteries can be categorized as thermal abuse, electrical abuse, and mechanical abuse [6,7].
However, the demand for high voltage and large capacity in battery energy storage systems (BESSs) continues to rise, leading to a significant increase in issues related to the series and parallel connection of numerous cells and modules [8]. Concerns over arc faults caused by battery aging, swelling, and loose connections have been widely noted [9]. Arc faults are common electrical safety issues in power systems [10]. Early research on arc faults in BESSs primarily focused on fault detection [11,12], lacking in-depth studies on the disastrous effects of arcs on batteries. In 2019, the Korean government published a report on the causes of 23 fire accidents in energy storage systems, noting that the electrical protection measures for energy storage systems were inadequate and lacked protection against DC arc faults [13]. Arc faults in BESSs often lead to TR and fire spread issues, such as accidents in energy storage systems in Australia [14]. In 2021, a fire and explosion incident involving a 25 MWh lithium iron phosphate battery occurred in Beijing, China. The accident report identified several potential causes of the fire, one of which was the ignition of flammable gases released by the battery due to an arc, leading to the explosion [15]. Therefore, there is an urgent need to develop experimental methods and understand the evolutionary patterns of arc-induced TR in LIBs.
Additionally, the battery and arc coupling model plays a crucial role in guiding the electrical safety design of BESSs [9,16]. Gao et al. utilized a two-dimensional axisymmetric magnetohydrodynamic approach to construct an arc model for cylindrical batteries, revealing the evolution patterns of arcs and obtaining distributions of electric fields, thermal fields, flow fields, and magnetic fields [16]. However, this model involves numerous coupled equations, leading to complex computations and lengthy simulation times. Moreover, it does not address the safety issues caused by arcs in batteries. Moreover, Yongnam and colleagues developed a 3D simulation model specifically for arc faults in high-voltage circuit breakers [17]. This model provides a more intuitive representation of arc behavior but involves more complex computations. Meanwhile, 3D TR models for batteries have been extensively studied by many scholars, and the methods are relatively mature [18]. However, there still lacks computational methods for the coupling issues between arc and battery TR models. Moreover, the coupling computational complexity faced by both types of 3D models is even more severe.
Therefore, this study focuses on the experimental and modeling methods of arc-induced thermal runaway in battery energy storage systems. Firstly, an arc experimental platform suitable for battery systems was established to understand the thermoelectric coupling characteristics between arc and batteries, revealing arc as a novel factor inducing battery thermal runaway. Secondly, a coupled 3D model between arc and batteries was developed, with experimental arc data used as model inputs to successfully induce thermal runaway in batteries. Finally, the temperature curves from experiments and models closely matched, confirming the model’s accuracy. This research on experimental and modeling studies of arc hazards in battery energy storage systems improves understanding of arc evolution patterns and fills gaps in the field of arc hazards. It provides guidance for subsequent arc detection and protection technologies, contributing significantly to enhancing safety measures.

2. Arc Experiment of Batteries

2.1. Battery Selection

The battery selected for this study has lithium-iron phosphate (LFP)/graphite electrodes. The tested battery has a capacity of 20 Ah and consists of an aluminum shell with 5 jellyrolls in parallel. The relevant parameters of the battery are shown in Table 1.

2.2. Experimental Platform

2.2.1. Main Circuit and Measurement Equipment

To investigate the phenomena of arc hazards, an experimental platform simulating battery system arc events needs to be constructed. The experimental platform primarily includes a main circuit and measurement equipment, as shown in Figure 1.
The main circuit consists of a DC power supply, an arc fault generator (AFG), batteries, and adjustable resistors connected in series. The AFG is designed based on the UL1699B standard and comprises a movable electrode, an adjustment platform, a slider, and a stepper motor, used to simulate arc generation [19]. The adjustment platform of the AFG can move horizontally and vertically to simulate arc occurrences at different positions of the battery (positive terminal, negative terminal and shell). In the adjustment platform of the AFG there is a lifting knob that moves up and down, along with four fixed knobs, as shown in Figure 1. Before the experiment begins, the battery is securely mounted on the adjustment platform using the four fixed knobs. With the help of the adjustment platform, the battery can be firmly held in place while also allowing for flexible positioning of the arc occurrence. An improved AFG is adaptable to different battery encapsulations and can also accommodate battery top covers.
Measurement equipment includes high-speed data acquisition systems, thermocouples, and high-definition cameras. For safety during experiments, the AFG is housed in an explosion proof box. The parameters of each equipment are detailed in Table 2.

2.2.2. Experiment Procedure

  • Circuit connection:
Connect the main circuit devices as shown in Figure 1; ensure that the tip of the movable electrode makes close contact with the center point O of the negative electrode surface, forming a continuous series circuit.
2.
Parameter settings:
(1)
Circuit parameters: power supply voltage Udc = 200–300 V, load resistance R = 10–20 Ω.
(2)
AFG parameters: The stepper motor is controlled by a computer. The separation gap L = 1 mm between movable electrode and battery.
(3)
Test subject: Battery top cover, battery with 100% state of charge (SOC).
(4)
Measurement equipment parameters: The sampling frequency of the high-speed data acquisition system is 1 kHz, recording real-time data of battery voltage UB, arc voltage Uarc, circuit current Idc, and temperature TB. A high-definition camera is used to monitor the entire experiment process. A type K-thermocouple is utilized to capture changes in battery temperature TB caused by the evolution of the arc during the experiment.
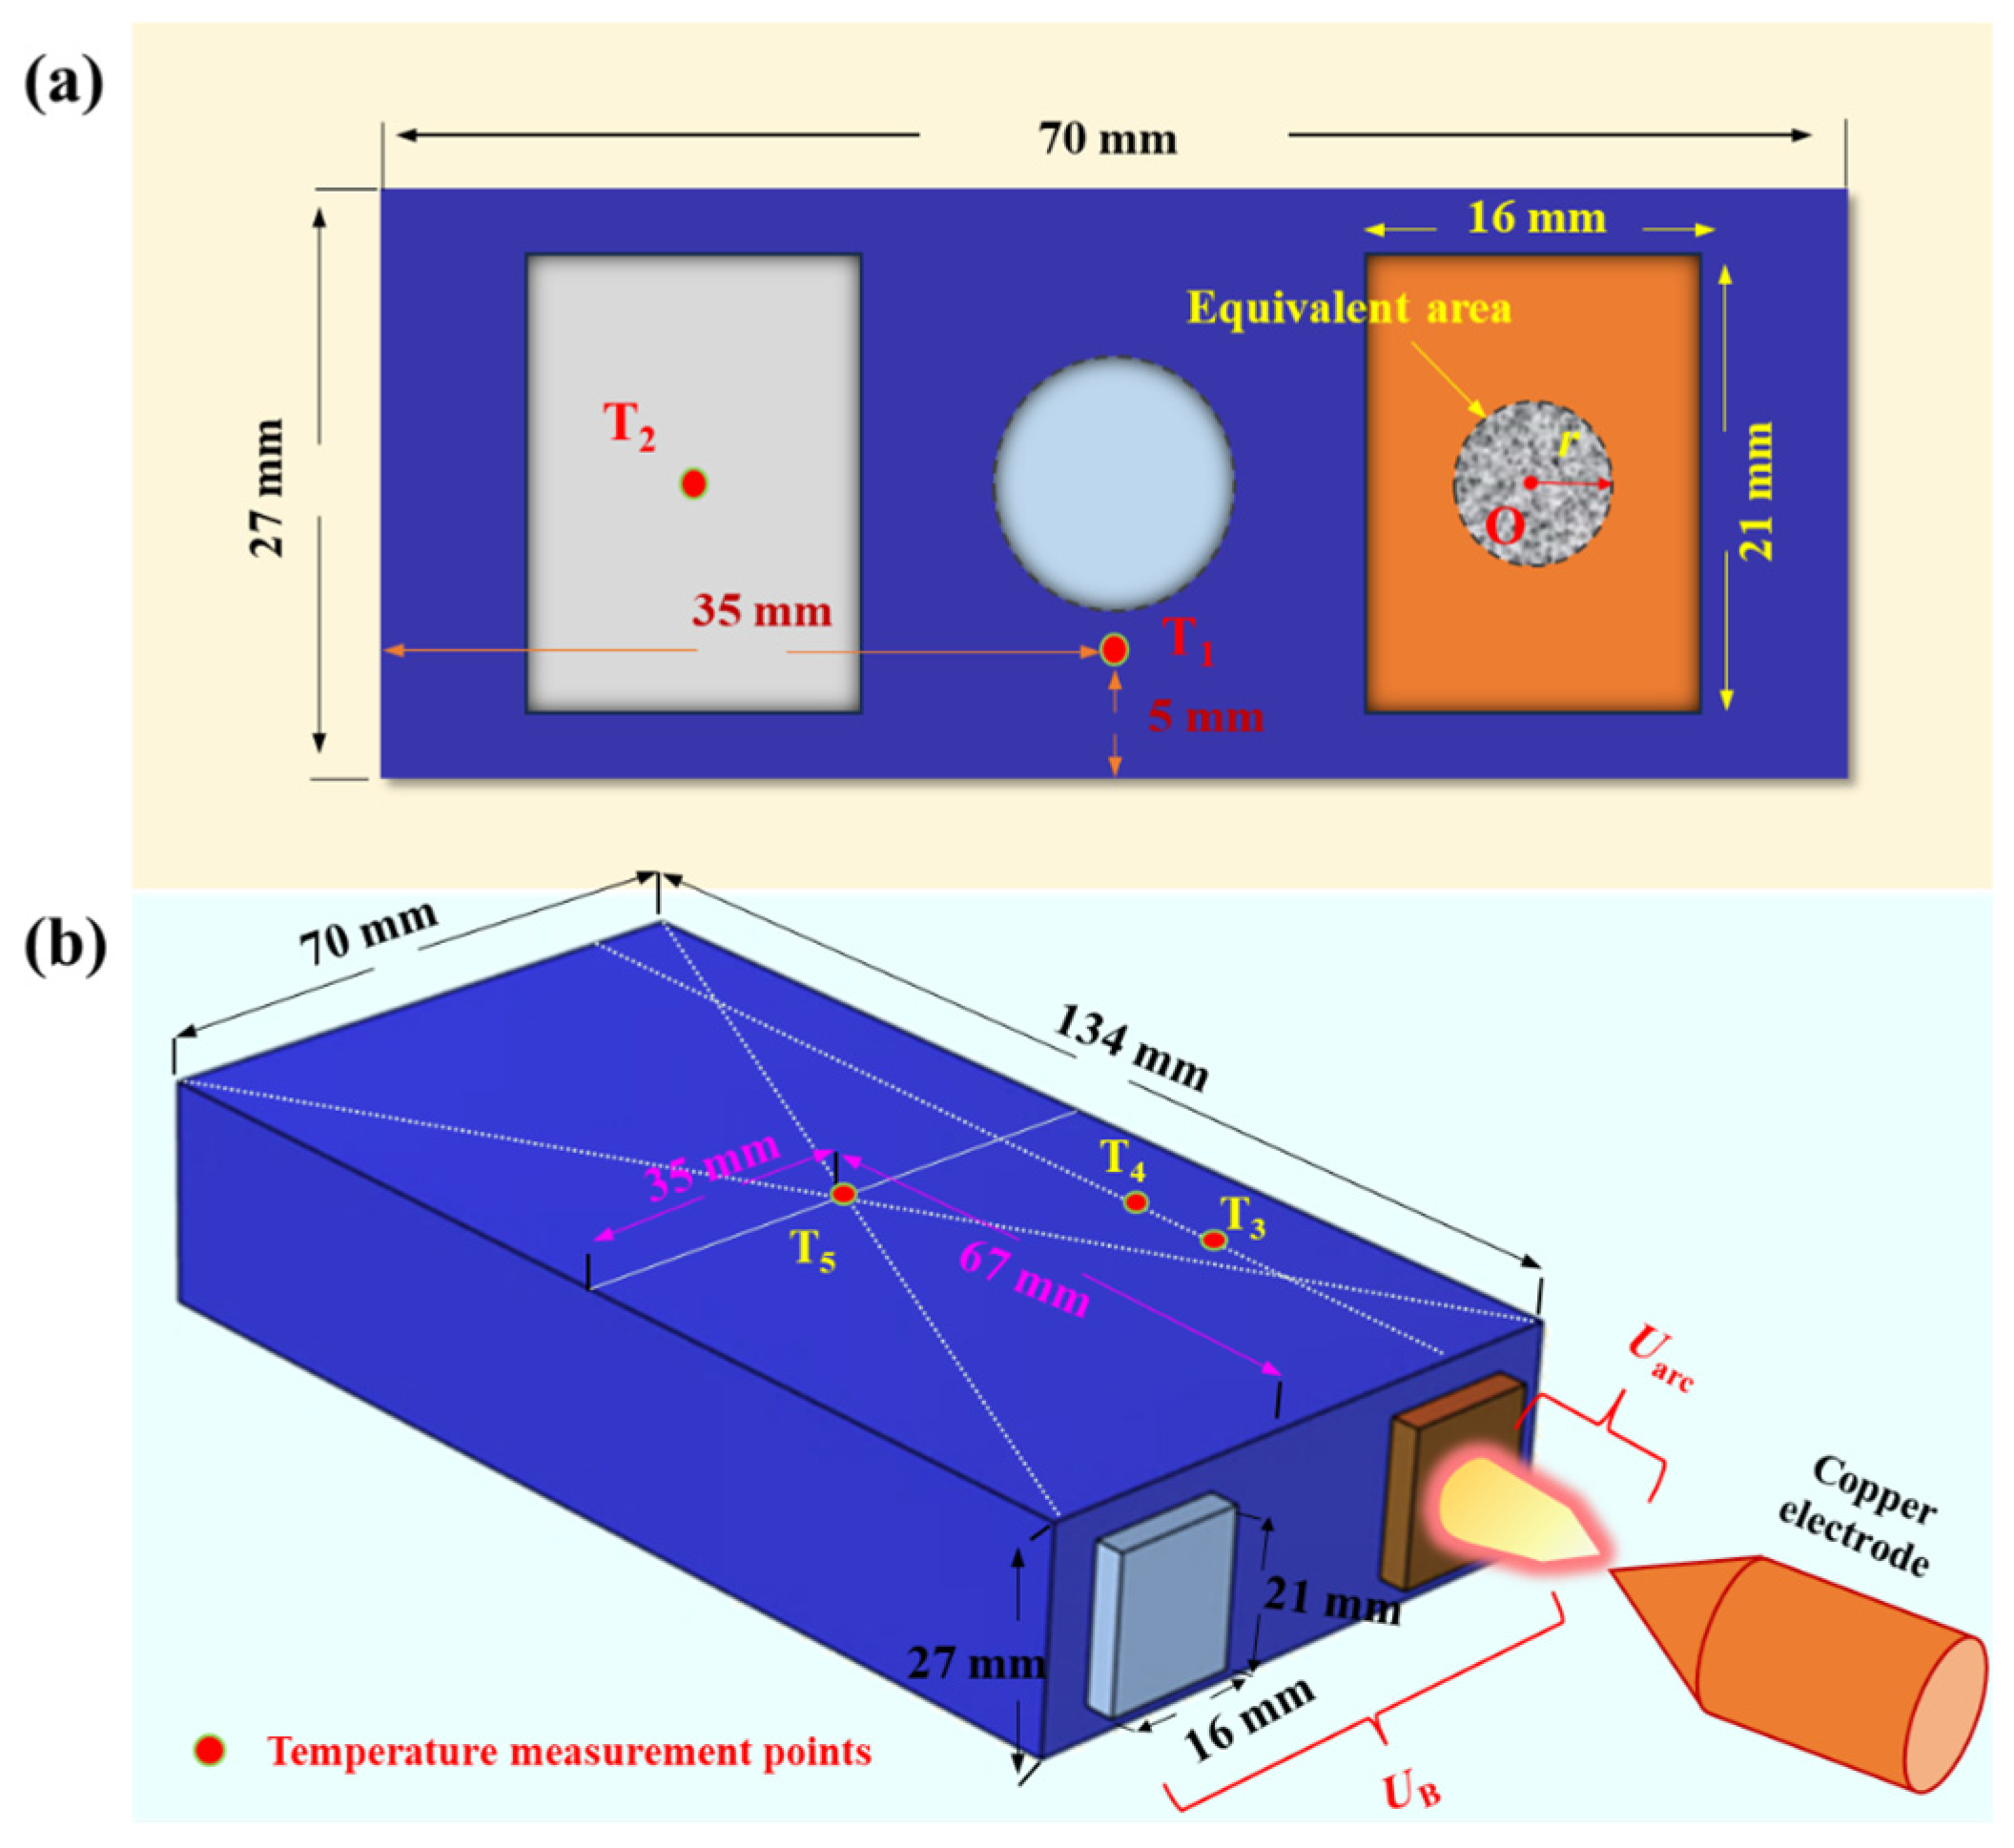
  • Battery top cover: 2 predefined temperature points (T1 and T2). T1 is located 8.5 mm below the center point of the top cover surface, and T2 is at the center point of the positive electrode terminal surface, as shown in Figure 2a.
  • Battery: The battery is equipped with 3 predefined temperature points (T3, T4, and T5) located near the negative electrode, as depicted in Figure 2b. Among these points, T3, T4, and the center point O of the negative electrode terminal are aligned on the same axis. T3 is positioned 3 cm from the top cover, T4 is 4 cm from the top cover, and T5 is located at the center of the larger face of battery, as shown in Figure 2b. In this study, the critical temperatures for T5, defined as the thermal transition rate (TTR), encompass gradual temperature increases and sharp temperature rises, indicating TR of the battery. The threshold for determining TTR is set at 1 °C/s [20].
3.
Experimental procedure:
After confirming correct circuit connections, power supply begins. According to preset parameters, control initiates the separation of the movable electrode from battery terminals. Under the influence of voltage and current, an arc is generated through air breakdown. Simultaneously, various detection devices collect real-time data such as arc voltage, current, temperature, and images. Before each experiment, copper electrodes are replaced to ensure stable arc generation. A computer is used for storing and processing arc data. Given that long-term use of the equipment may inevitably introduce errors, it is crucial to regularly calibrate measuring instruments and check the setup before experiments to minimize these discrepancies.

2.3. Results and Analysis

This article primarily includes two experiments: the negative electrode terminal arc on the battery top cover and the complete battery. The experiment on the battery top cover is presented in Section 2.3.1, which to obtain the power transfer coefficient from the arc to the battery. While the battery experiment is shown in Section 2.3.2, which to achieve the phenomenon of arc induced thermal runaway of batteries and establish corresponding models.

2.3.1. Arc Experiment on the Negative Terminal of Battery Top Cover

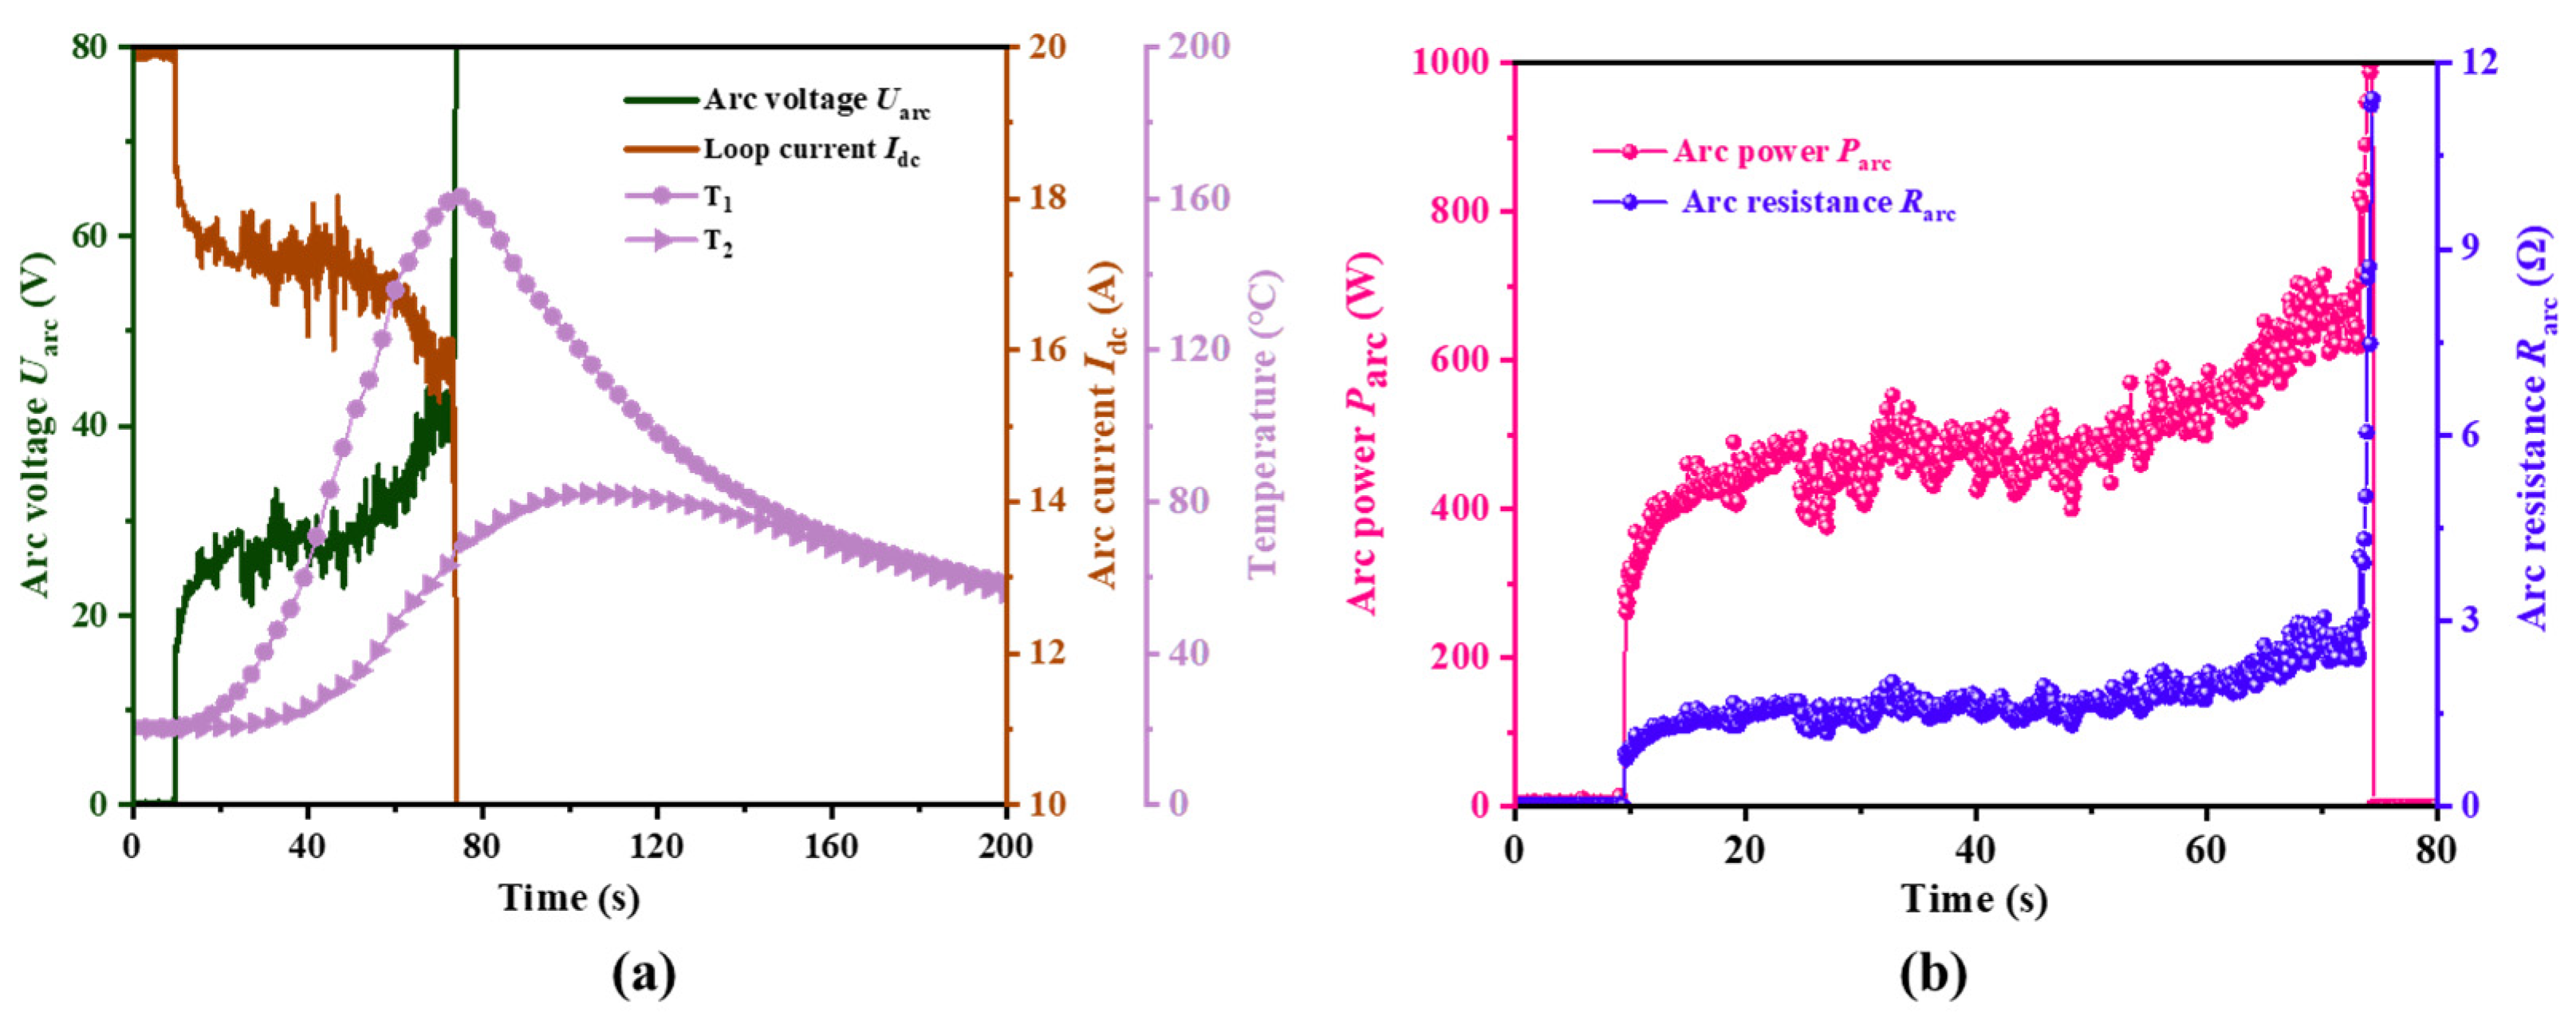
In Figure 3, the curve represents the experiment of arc on the battery cover under the condition of power supply voltage of 200 V and load resistance of 10 Ω. As shown in Figure 3a, when powered by the DC power supply, the circuit current is 20 A. At 8.9 s, the moving electrode separates from the negative pole column, forming an arc.
As shown in Figure 3a, At the onset of the arc, the arc voltage initially increases to the minimum arc voltage Uarc,min = 15.7 V. The minimum arc voltage is the lowest voltage required to sustain the arc for a specific contact material. In the case of series arc current, due to the introduction of nonlinear arc resistance upon arc formation, the loop current Idc decreases. The amount of current decrease is denoted as ΔI.
Δ I = I dc I arc = U dc R U dc U arc R = U arc R
Therefore, ΔI is only related to the arc voltage Uarc and the load resistance R. According to Equation (1), as the arc voltage increases, the arc current decreases continuously, demonstrating an overall negative resistance characteristic.
As shown in Figure 3a, T1 and T2 represent temperature curves monitored by thermocouples at the battery cover. As the arc continues to burn, both T1 and T2 rise continuously. T1, located closer to the arc position O, exhibits a faster temperature increase compared to T2. Additionally, T1 reaches a maximum value of 161.2 °C, while T2 reaches a maximum value of 82.5 °C.
Under the continuous action of the arc, on one hand, the consumption of the copper electrode and negative electrode increases the arc length, requiring greater input power to sustain combustion. On the other hand, the combustion of the arc results in a large amount of metal oxides adhering to the surfaces of the copper electrode and negative electrode, which hinder further combustion. Eventually, at 74.4 s, the arc extinguishes. Subsequently, T1 and T2 gradually begin to cool down.
Based on the arc voltage and arc current shown in Figure 3a, we can calculate the arc power Parc and arc resistance Rarc using Equations (2) and (3):
P arc = U arc I arc
R arc = U arc I arc
Figure 3b depicts the waveforms of arc power Parc and arc resistance Rarc during the experimental process. The evolution trends of Parc and Rarc are similar to Uarc. Parc is primarily concentrated in the range of 400 to 600 W, while Rarc is mainly concentrated in the range of 1.5 to 3 Ω. The experimental data in this chapter will be utilized in Section 3.2.2.

2.3.2. Arc Experiment on the Negative Terminal of Battery

Building upon the arc experiment conducted on the top cover, the evolution patterns of arc have been analyzed, leading to further arc experiments on battery itself. Similarly, the central point O of battery negative terminal has been selected as the location where arc will occur. Figure 4 displays the results of the arc experiment on the negative terminal of the battery.
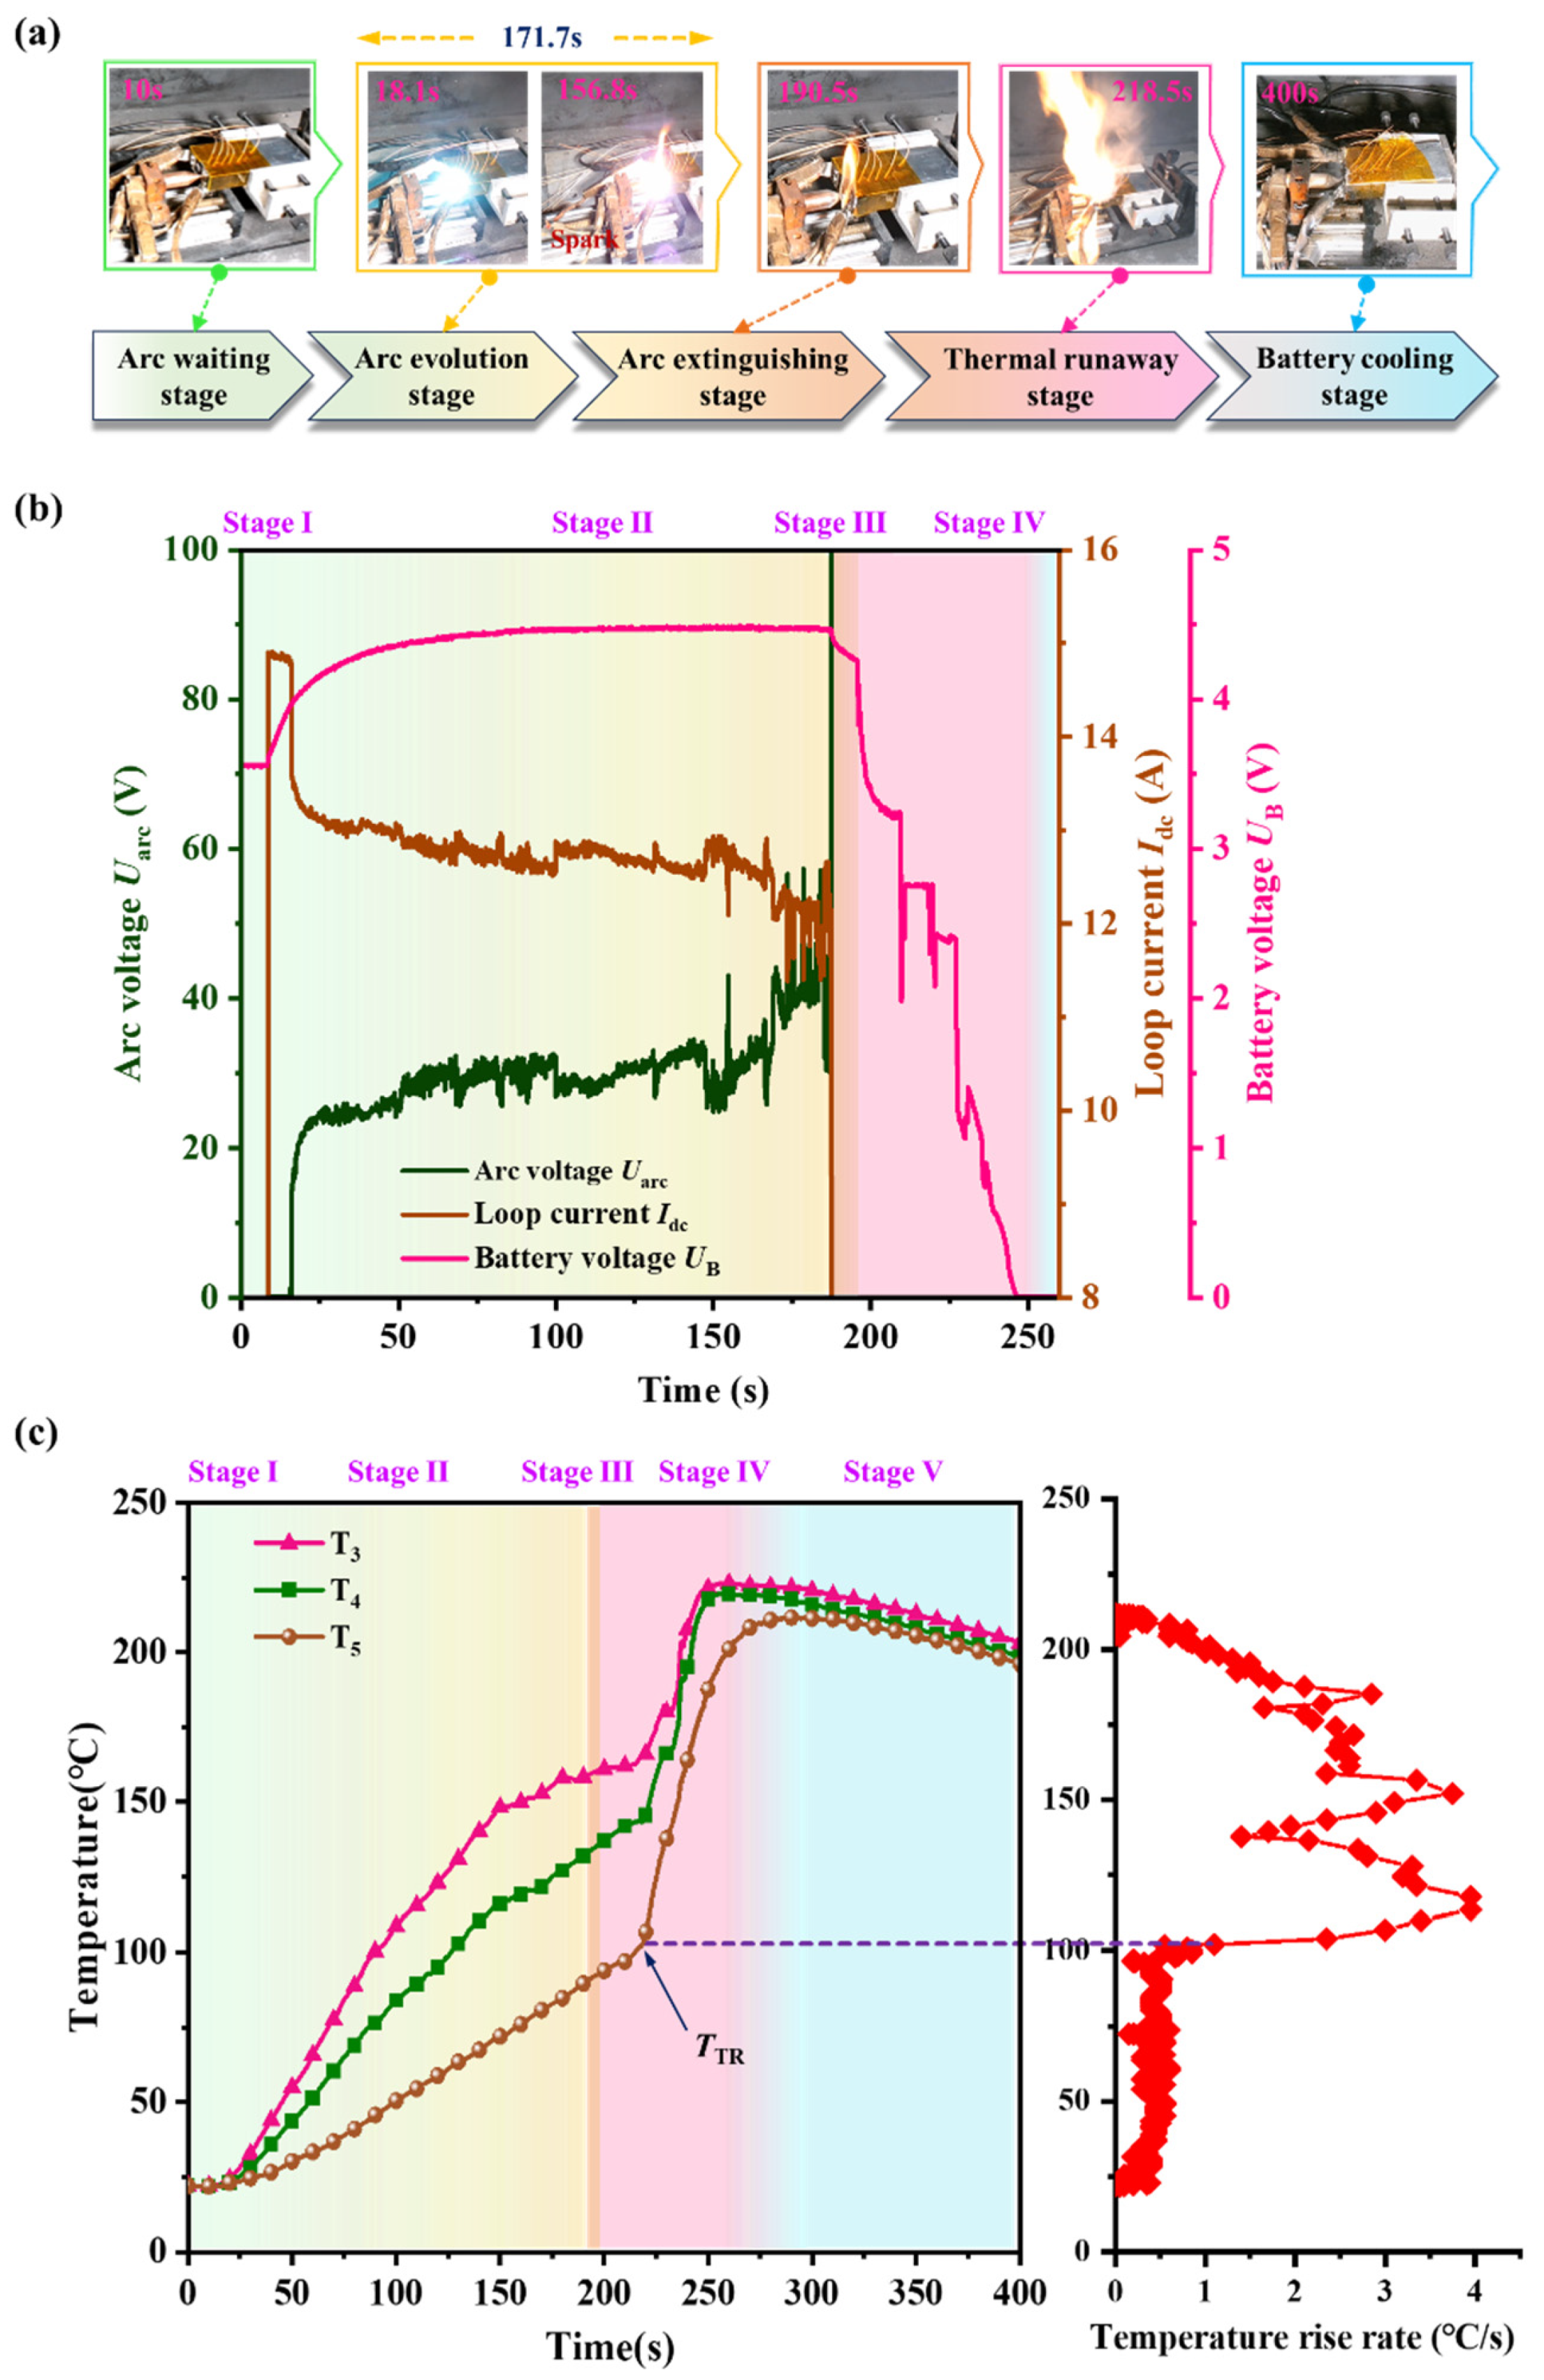
As shown in Figure 4a, the arc’s evolution process may involve five stages: arc waiting (stage I), arc evolution (stage II), arc extinction (stage III), TR (stage IV), and battery cooling (stage V).
Stage I: during the initial phase of experiment, the moving electrode remained closely connected to the negative terminal of battery. The DC power supply voltage Udc = 300 V and the loop current Idc = 14.8 A were maintained. At this point, the current charges the battery, and the battery voltage UB begins to rise, as shown in Figure 4b. Subsequently, AFG were activated to initiate the arc.
Stage II: at 16.1 s into the experiment, the arc voltage sharply rises to the minimum arc voltage Uarc,min = 15.8 V, as shown in Figure 4b. According to Equation (1), the minimum current drop ΔI = 0.79 A can be determined for this experiment. At this moment, the arc emits a bright blue-white light (18.1 s), as depicted in Figure 4a. As the arc evolves, significant splattering of metal sparks is observed, accompanied by a thin outer layer of orange light. The arc also ignites the insulation material on the battery cover, creating flames (156.8 s), as shown in Figure 4a. Figure 4b illustrates that throughout the arc’s evolution, the arc voltage remains generally stable within the range of 20–30 V. These findings are largely consistent with the arc experiment data obtained from the top cover. Furthermore, from the battery voltage waveform in Figure 4b, it is evident that the battery remains in a charging state during the occurrence of the arc.
Stage III: at 188.7 s, the arc extinguishes. The arc voltage abruptly switches to the power supply voltage, the loop current drops to 0, and the battery voltage begins to slowly decline, as shown in Figure 4b. Due to the arc igniting the insulation material on battery cover, after arc extinguishes, there is still an open flame present (190.5 s).
Stage IV: At 195.8 s, a significant amount of white smoke was observed leaking from the negative terminal of the battery, ignited by an open flame, resulting in a jet of flames. Simultaneously, the battery voltage rapidly dropped to 4.23 V, indicating an internal malfunction. This phenomenon closely resembles a situation of TR in batteries, often caused by internal short circuits.
The main components of white smoke include gases generated by irreversible reactions in jellyroll and vapor from the electrolyte. As internal reactions intensify, the volume of gas generated gradually increases, causing the battery shell to expand continuously and intensifying the strength of the flame jet.
This phenomenon requires heightened vigilance because TR in batteries can lead to serious safety issues. During experiments, especially when simulating battery arc experiments, strict safety measures and monitoring should be implemented to prevent such incidents.
The arc temperature is primarily used to characterize the hazards caused by the arc. T3 to T5 represent temperature changes at different preset points on the battery surface. As shown in Figure 4c, with the evolution of the arc, temperatures gradually increase. Specifically, the temperature rise near the arc point at T3 is faster compared to T5. This indicates that arc heating is the main factor leading to the increase in battery surface temperature. Additionally, the arc continuously conducts heat into the interior of the battery through the negative terminal.
Combining this with the voltage drop phenomenon shown in Figure 4b, it is evident that a series of internal short circuit faults have occurred inside the battery. Figure 4c further demonstrates the relationship between the rate of temperature increase in the central area of the battery and the actual temperatures. When the temperature at T5 reaches 102 °C and the rate of temperature increase reaches 1 °C/s (a turning point), it indicates that the battery has undergone TR.
From the comprehensive analysis of the voltage faults and thermal faults depicted in Figure 4, these are primarily attributed to internal short circuit issues caused by continuous arc conduction. Ultimately, the battery experienced widespread internal short circuits, which eventually led to thermal runaway.

3. The Model of Arc-Induced TR in Batteries

Using commercial finite element software (COMSOL Multiphysics 6.0) to simulate external heating tests. Specifically, using solid-state heat transfer for thermal simulation.

3.1. The Principle of Equivalent Heat Source of an Arc

Currently, arc and battery TR models generally suffer from high computational complexity and long simulation times. Arc models typically utilize a 2D symmetric structure to reduce model complexity, whereas battery TR models require a more complex 3D structure to better represent the battery’s hazard phenomena. This disparity makes it difficult to couple and jointly simulate arc and battery models.
To address this issue, simplification of both arc and battery TR models is necessary. The specific approaches are as follows:
(1)
Maintain the overall structure of the arc model and simplify the battery TR model, focusing on capturing the evolutionary characteristics of the arc itself.
(2)
Maintain the structure of the battery TR model and simplify the arc model, emphasizing the impact of the arc on inducing thermal hazards in the battery.
The objective of this study is to develop a model for arc-induced battery TR. To effectively analyze the thermal hazards caused by arcs in batteries, it is crucial to comprehensively simulate the thermal characteristics of batteries at different stages. Therefore, retaining the integrity of the battery thermal model while appropriately simplifying the arc model is a reasonable strategy to achieve the simulation goals.
In Figure 2, it can be observed that an arc occurs at the center of the negative pole column, forming an arc column between the tip copper electrode and the negative pole column. The arc continuously discharges, generating high temperatures, and eroding the base of the pole column, creating an affected area. This affected area can be regarded as a heating surface, through which the arc transfers heat to the pole column, end cap, and electrolyte, thereby heating the interior of the battery.
To conduct a combined simulation of arc and battery, it is necessary to simplify the arc model. The heat energy generated by the arc discharge process is treated as a concentrated heat source, namely the equivalent heat source of arc, used to simplify thermodynamic and heat transfer analyses. This equivalent heat source includes the equivalent area Sarc and the equivalent power Parc_bat of the arc, as shown in Figure 2. Here, Sarc represents only the area where the arc acts on the pole column, excluding its corrosive effects on the column. Meanwhile, Parc_bat denotes the power transferred from the arc to the battery, rather than the total arc power Parc_bat. Therefore, the first step is to determine the equivalent area Sarc and equivalent power Parc_bat of the arc during its discharge process.

3.1.1. Equivalent Area Sarc

Figure 2a vividly illustrates the equivalent area of the arc on the negative pole column. Since the arc column approximates a cylinder, the distribution shape on the battery pole also approximates a circle, with its effective thermal source radius denoted as r (where Sarc = π·r2). Research indicates that as the arc current Iarc increases, this radius r also increases [21,22]. Based on extensive data fitting analysis, the relationship equation between the arc current Iarc and the equivalent thermal source radius r is obtained as:
r = 2.337·Iarc0.1889 − 2.2542
where r and Iarc are measured in mm and A, respectively. Therefore, Equation (4) is applied in the model, where r is set based on the numerical value of Iarc observed in experiments. For instance: In the experiment on the battery corresponding to current of 15 A, r = 1.86 mm; In the experiment on the battery cover corresponding to current of 20 A, r = 2.44 mm.

3.1.2. Equivalent Power Parc_bat

Figure 5 depicts the simplified composition of arc power. From Figure 5, it can be seen that the arc power Parc includes the arc equivalent power Parc_bat, the power conducted to the electrode Parc_elec, and the arc dissipation power Parc_rad. Therefore, the Parc is:
Parc = Parc_bat + Parc_elec + Parc_rad
For the arc and battery coupling model, Parc_rad is a crucial factor in inducing thermal hazards in the battery due to the arc. Therefore, it is necessary to establish an approximate equivalence relationship between Parc_rad and Parc. The power transferred by the arc to the electrode and the external environment can be collectively considered as the dissipation power of the arc. Based on this, the relationship equation between Parc_rad and Parc can be defined as:
Parc_bat = k·Parc = k·Uarc·Iarc
where k represents the power transfer coefficient of the arc on the battery, with values ranging from 0 to 1. The Uarc and Iarc are obtained through experimental data. Therefore, by determining k, Parc_bat can be obtained.
It is worth noting that the method of equivalent arc thermal source and external heating are fundamentally similar in inducing TR in battery. The distinction lies in the arc’s location at the electrode column and the fact that arc power varies over time.

3.2. Model Establishment

3.2.1. Geometric Description

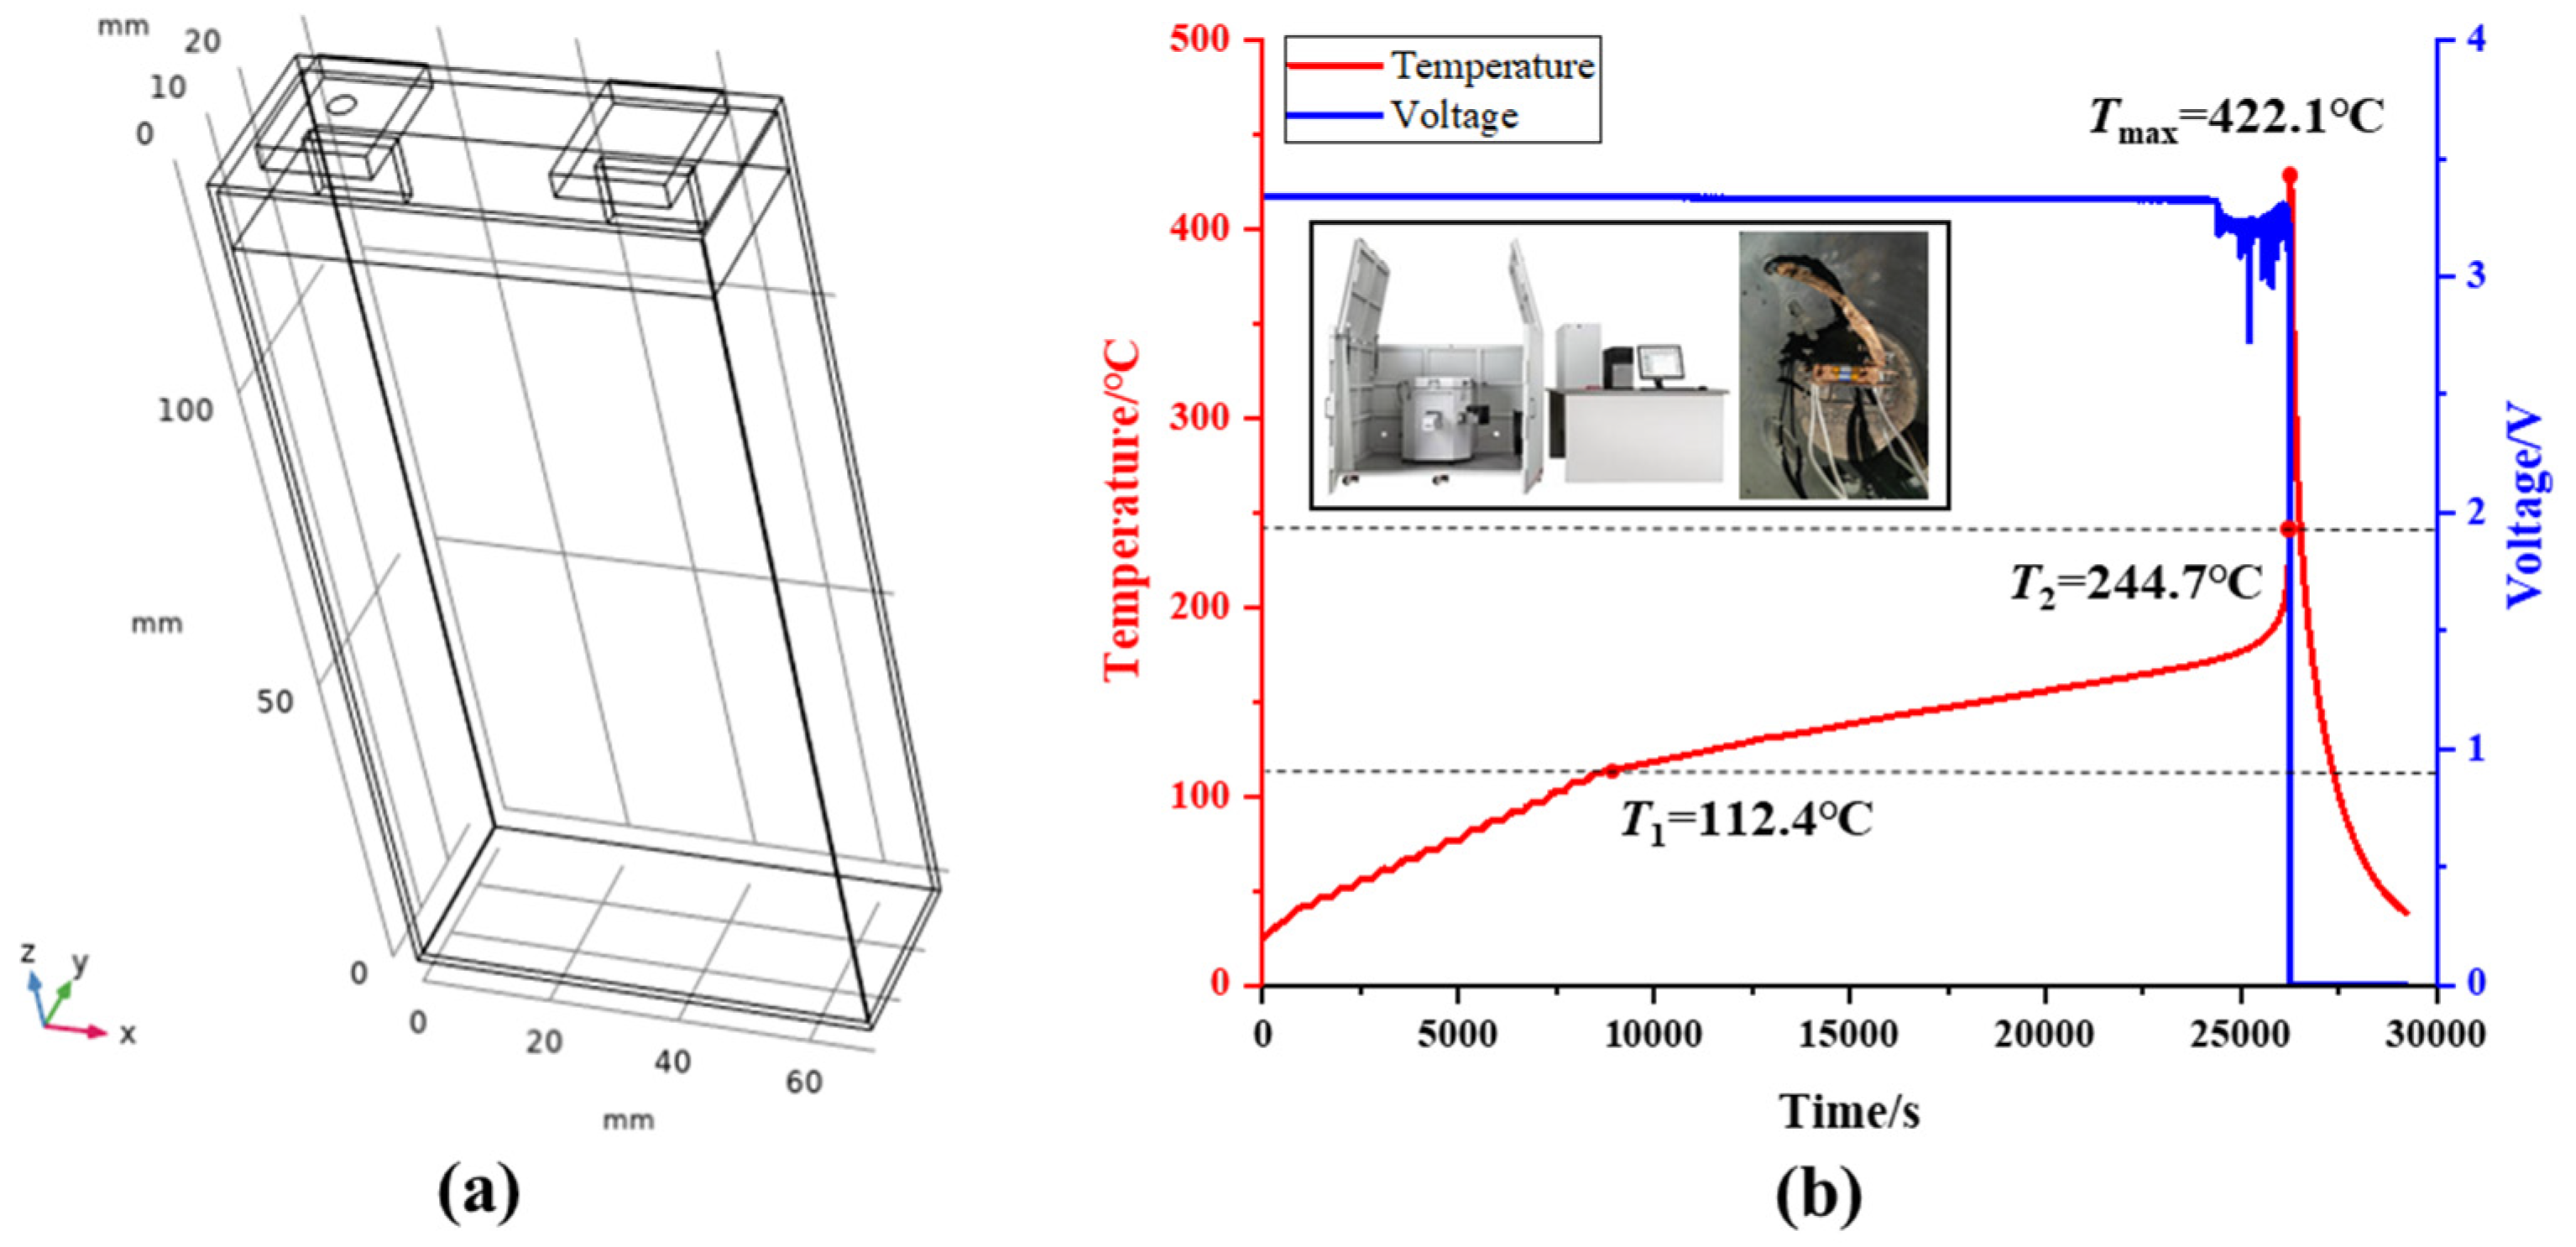
The geometric structure of the battery consists of a battery core, an air layer, a shell, a top cover, and two terminals. It is noteworthy that the actual 5 individual jellyrolls are simplified into a single integrated battery core, as shown in the geometry model in Figure 6a. The material properties corresponding to the 3D arc-induced TR model of the battery are listed in Table 3. Additionally, the adiabatic calorimeter data for the sample battery is presented in Figure 6b. Here, T1 denotes the self-heat temperature, T2 represents the TR initiation temperature, and Tmax indicates the maximum temperature.

3.2.2. Determination of Power Transfer Coefficient k

According to Section 3.1.2, based on the power transfer coefficient k, the equivalent arc power Parc_bat acting on the battery can be calculated. However, since the battery consists of multiple different components and materials, directly using the entire battery to determine k may involve complex parameter calculations, potentially leading to significant errors. Therefore, in the study of k determination, the focus has been on the battery top cover due to its simpler structure and fewer materials, including an aluminum alloy shell, aluminum terminal, and copper terminal.
Figure 7 depicts a flowchart illustrates the method for determining the power transfer coefficient k based on the battery top cover.
As shown in Figure 7, the method for determining the power transmission coefficient k includes two parts: experimentation and simulation. The experimental part involves the arc experiment on the battery cover (see Section 2.3.1), while the simulation part uses a COMSOL-built model of the battery cover arc. Based on the power data obtained from the negative electrode arc experiment on the battery cover as shown in Figure 3b, combined with Equation (7), the equivalent power Parc_bat_N of the battery cover negative electrode can be calculated for different values of k.
Parc_bat_N = kN Parc
where N = 1, 2, 3, …, 99, Parc_bat_N is used as input for the model, applied to the arc equivalent area on the negative pole of the battery cover as shown in Figure 8a1, with a radius of 2.44 mm (at 20 A). The temperature probe configured in Figure 8a1 corresponds to the thermocouple used in the experiment. The initial temperature for the simulation models is set to 22.5 °C. In this study, the T1 temperature point is chosen as the calibration point for both experiment and simulation, although this is not the only option. Through model calculations, the N-th temperature curve T1_N′ can be obtained. Typically, the root mean square error (RMSE) is used to assess the error between two sets of data curves; a smaller RMSE indicates higher accuracy. By comparing the RMSE of the simulated temperature curve T1_N′ with the experimental temperature curve T1, the model’s accuracy can be evaluated.
RMSE N = 1 m i = 1 m ( T 1 _ N - T 1 )
When RMSEN+1 > RMSEN, it indicates that the accuracy of T1_N+1′ is lower compared to T1_N′, suggesting that kN should be output. When RMSEN+1 < RMSEN, it indicates that T1_N+1′ has higher accuracy, and kN+1 should replace kN. Then, increment N by 1 to proceed to the next iteration (N = N + 1). Through these iterations and evaluations, the optimal value power transmission coefficient of kbest is determined. When N = 38, the RMSE38 is minimized (0.953 °C). This indicates that the optimal kbest = 0.38.
In Figure 8b, the results corresponding to the optimal power transfer coefficient kbest = 0.38 are shown. The RMSE for T1 is RMSET1 = 0.953 °C. To ensure the accuracy of the selected value of k, further RMSE for T2 was obtained, yielding RMSET2 = 0.615 °C. As depicted in Figure 8b, temperature data further away from the arc initiation point is more precise. This is primarily because during the evolution of arc, its outer flame often causes significant fluctuations in data and higher errors. Figure 8a2 presents a thermal image of the battery top cover temperature at 32 s, where it can be observed that the temperatures are higher in the vicinity of the arc initiation point.

3.2.3. Control Equations, Heat Generation, and Heat Transfer of 3D TR Model

The 3D TR model of the battery yields the following control equations:
ρ C P T t = q V + x ( λ x T x ) + y ( λ y T y ) + z ( λ z T z )
In Equation (9), where ρ represents the core density of the battery cell; Cp is the specific heat capacity of the core, indicating the rate of temperature rise; qV denotes the volumetric heat generation rate, with V representing the volume of the battery core. The integral of qV yields the total heat generation Q of the core, as shown in Equation (10):
Q = q V d V
H represents the time integral of Q in the equation. Equation (11) represents the total energy released in the model. It determines the maximum temperature of the battery core in the model.
H = t Q d t
E represents the total increment of internal energy in the accelerating rate calorimeter experiment under adiabatic conditions [23]. E determines the maximum temperature of the TR process, as shown in Equation (12).
E = Mcore ·Cp ·ΔT
In Equation (12), where Mcore = 0.420 kg is the mass of the battery core, Cp = 981 J·kg¹·K¹ is the specific heat capacity of the battery, and ΔT = TmaxT1 = 310.1 °C, as shown in Figure 6b. In this study, E = 127767.4 J.
However, in an open experimental environment, the TR of the battery does not occur under adiabatic conditions. Therefore, gases/smoke emitted by the battery will carry away a significant amount of heat. The equivalent relationship between H and E can be expressed as:
E = n·E
where n = 0.90 is an empirical coefficient, in many TR model cases, a value of 0.9 for n fits the experimental data well for the maximum temperature at model.
qV can be calculated using an empirical equation, as shown in Equation (14).
q V = 1 V core H d c d t
Here, Vcore is the volume of battery core, c is the normalized concentration of total energy, and dc/dt is the reaction rate. The initial value of c is 1, and c decreases from 1 to 0 to satisfy the derivative of the temperature function over time.
The above control equations and heat generation are key points in the model. For a more detailed modeling process, please refer to the referenced literature [18,24].
In addition, the heat transfer conditions affecting TR in batteries include thermal conduction and convective heat transfer. The boundary condition parameters are shown in Table 4.

3.3. Model Establishment

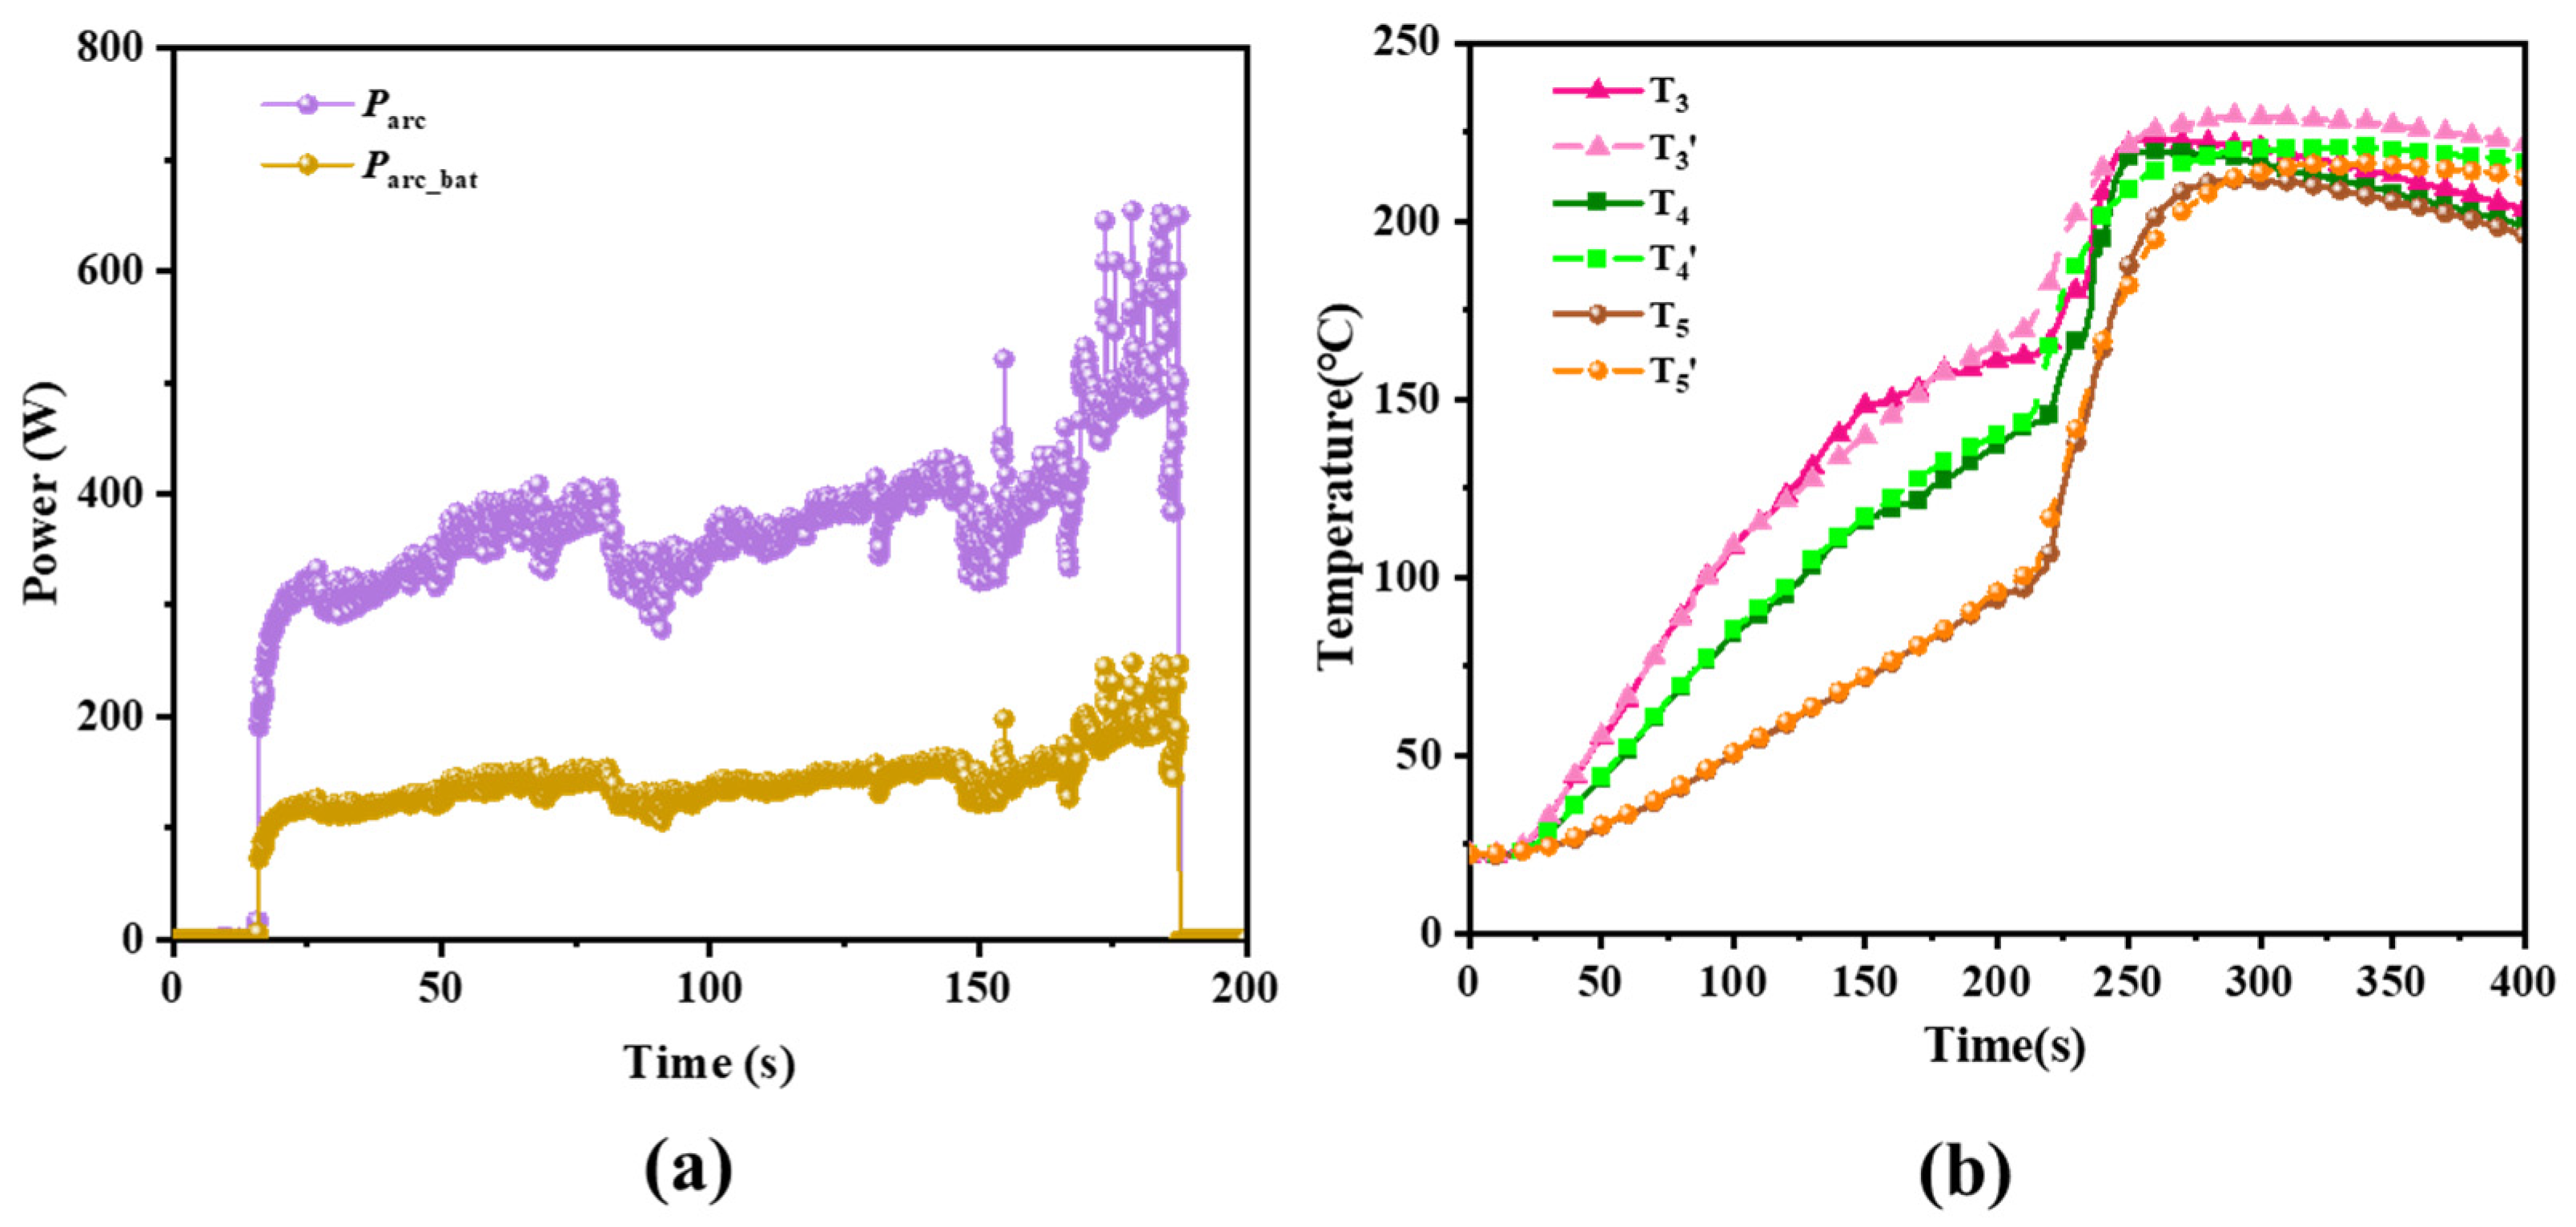
As shown in Figure 6a, based on a 3D TR model of the battery, an equivalent heat source of the arc is added on the surface of the negative electrode terminal. The arc’s equivalent radius is r = 1.86 mm (Idc = 15 A), located at the center point O on the surface of the battery’s negative electrode terminal. The equivalent power of the arc, Parc_bat, is determined based on the actual arc power Parc from Section 2.3.2 and the power transmission coefficient k = 0.38 determined in Section 3.2.2, as shown in Figure 9a.
Table 5 presents the comparison of experimental and simulation results at different temperatures. In both experiments and simulations, the arc waiting phase lasts for 16.1 s, and the arc duration is 171.7 s. The duration of the arc flash is calculated by subtracting the starting moment from the extinguishing moment. tarc_TR is used to denote the time from arc initiation to TR in the battery. Among the three temperature points, T5 exhibits the smallest discrepancy in time between experimental and simulated arc-induced TR, at only 3.5 s. The accuracy of the 3D model predicting arc-induced TR in the battery is assessed using RMSE. Over the entire simulation period (i.e., the first 400 s), T5 has the lowest RMSE, while T3 has the highest. Comparing the experimental and simulation curves at 187.8 s (before arc extinguishment), 300 s, and 400 s, the RMSE values for all three temperature points are minimized in the 187.8 s dataset, as shown in Figure 9b and Table 5. This is because chemical reactions inside the battery become significantly more intense after TR occurs, whereas before TR, the battery’s behavior is primarily influenced by heat conduction. Additionally, following the arc-induced TR of the battery, the explosion-proof box becomes filled with a large amount of smoke. At this point, the exhaust port is opened, accelerating the flow of gases within the explosion-proof box to expel the smoke. Simultaneously, the battery’s own heat dissipation capability is enhanced, thereby accelerating the rate at which the battery cools down. Therefore, during the experimental process, the cooling rate of the battery typically exceeds that simulated by the mode, as shown in Figure 9b.
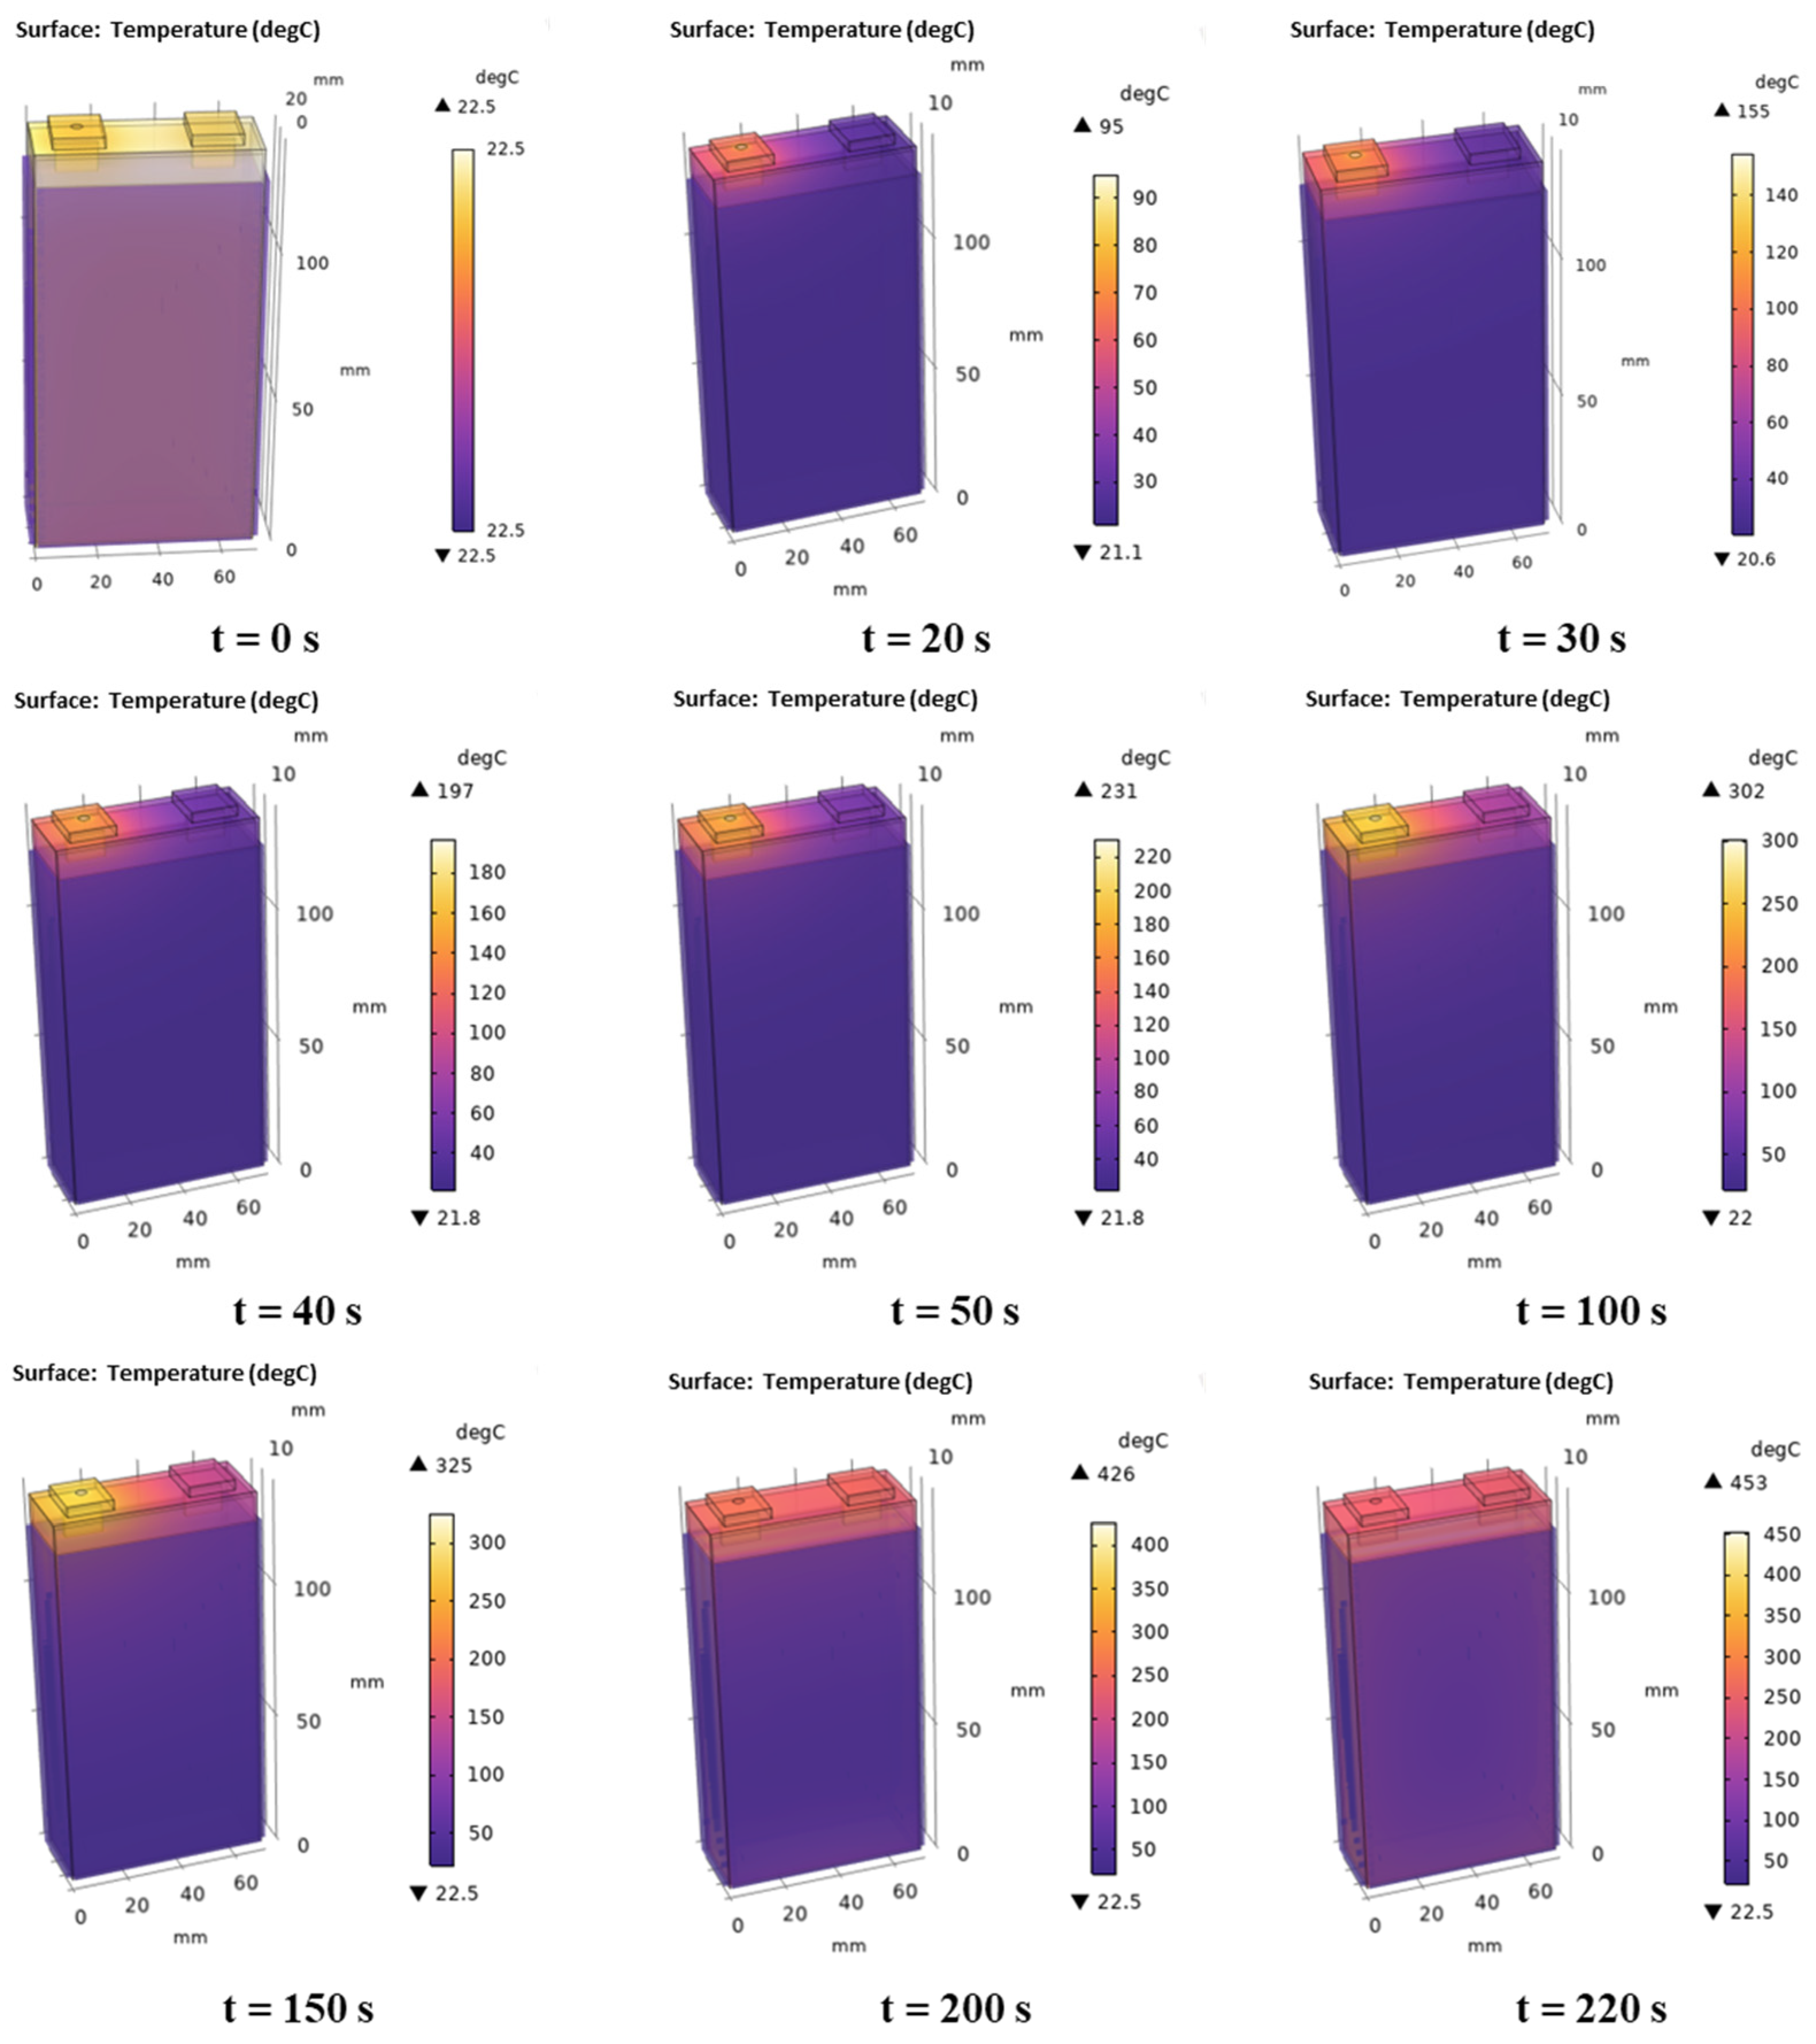
Figure 10 shows the temperature cloud map of the model. From the Figure 10, it can be observed that during the evolution of arc, the continuous high temperature generated by arc transfers heat from the negative terminal, top cover, and shell of the battery into its interior, until the battery experiences TR. This is also reflected in the temperature trends of the three points on the surface of the battery, where the temperature rise rate is faster closer to the location where the arc occurs.
To better validate the equivalence method of the arc heat source and the accuracy of the established model, data from the experimental conditions with a power supply voltage of 200 V and a loop current of 20 A were selected as model inputs. Figure 11 shows the experimental and simulation waveform results for 200 V and 20 A.
Table 6 presents the comparison of experimental and simulation results at different temperature points under the conditions of 200 V and 20 A. Among the three temperature points, T5 shows the smallest time difference of only 2.9 s between experimental and simulated arc-induced thermal runaway. Additionally, the RMSE for T5 is the lowest both before arc extinguishing and during the first 300 s, measuring 2.15 °C and 4.80 °C, respectively, as shown in Figure 11b and Table 6. These results are similar to those obtained under the conditions of 300 V and 15 A, further confirming the accuracy of the constructed model.
In summary, through tarc_TR, time differences, RMSE, and temperature cloud maps, it can be observed that the accuracy of the 3D model constructed in this paper for simulating arc-induced TR of batteries is confirmed. This also validates the rationality of the proposed method using equivalent heat sources for arcs in this study.

3.4. Model Analysis

Building upon the accurately calibrated model of arc-induced TR in batteries, further analysis is needed to examine the impact of key parameters (such as equivalent radius r and equivalent power Parc_bat) in the arc heat source method on the simulation results of battery TR.
Keeping the equivalent radius r = 2 mm constant, the equivalent power Parc_bat is set to 100 W, 200 W, 300 W, 400 W, and 500 W respectively. According to the model calculations, the time required for arc-induced TR under different powers is shown in Figure 12a. From Figure 12a, it can be observed that as the equivalent power of the arc increases, the time required for arc-induced TR in the battery decreases, indicating a greater susceptibility to TR.
Maintaining the equivalent power Parc_bat = 200 W, the equivalent radius r is set to 1 mm, 2 mm, 3 mm, and 4 mm respectively. According to model calculations, the time required for arc-induced TR is shown in Figure 12b. As the equivalent radius of the arc increases, the time required for arc-induced TR in the battery becomes longer, indicating it is more difficult to trigger TR. Comparing Figure 12a,b, it is evident that with the increase in equivalent arc power from 100 W to 400 W, the time decreases by 157.4 s. Conversely, reducing the arc radius from 4 mm to 1 mm decreases the time by 16.2 s. This suggests that changing r does not significantly affect the induction of battery TR compared to changing Parc_bat. Therefore, Parc_bat has a more pronounced effect on inducing battery TR compared to r.

4. Conclusions

This study focuses on investigating arc faults in battery systems using a 20 Ah prismatic lithium-ion battery as the research subject. Initially, an experimental platform for arc testing in battery systems was established to analyze the evolution patterns of arcs at the negative terminal and their electro-thermal coupling characteristics. The study also simulated the disaster process of arc-induced TR in batteries. Subsequently, utilizing COMSOL software, a coupled 3D model between arc and battery was developed. By employing the method of equivalent arc heat source, an accurate model of arc-induced TR in batteries was successfully constructed.
The main contributions are summarized as follows:
(1)
A specialized experimental platform was established to study arc faults in battery systems, simulating the generation, evolution, and catastrophic effects of arcs at the negative terminal of the battery. During the experiments, it was observed that the minimum arc voltage was approximately 15.8 V, and the stable arc voltage ranged between 20–30 V. Under experimental conditions of 300 V and 20 Ω, the arc lasted for 171.7 s, ultimately leading to TR of the battery. This indicates that arcs are a novel factor contributing to TR in batteries.
(2)
This paper employs the equivalent arc heat source method to simplify arc simulation, streamline the computation process, and enhance the coupling simulation between the arc and the battery. Initially, key parameters of the arc heat source equivalent method were determined based on experiments and models involving the battery cover: power transfer coefficient k = 0.38, equivalent radius r = 1.86 mm, and equivalent power Parc_bat = 0.38 × Parc. Subsequently, using COMSOL software and experimental data from arc tests on battery, a coupled 3D model was developed to successfully simulate the process of arc-induced TR in batteries. The research results indicate that there is a time difference of 3.5 s between simulation and experimental TR at the center of the battery surface, with a RMSE = 5.8 °C in temperature profiles. This demonstrates that the simulation model exhibits high accuracy.
This study focuses on arc faults in battery systems, enhancing understanding of arc faults and expanding the field of arc-induced hazards. The developed model for arc-induced TR in batteries can guide experimental design for arc testing, reducing experimental workload and accelerating research progress.
Although this paper demonstrates the phenomenon of arc-induced thermal runaway in batteries through both experiments and simulations, it does not comprehensively consider the impact of various factors contributing to arc-induced failures. Future research will delve deeper into the sequential effects of arc voltage, arc current, arc power, duration, and location on the thermal runaway of batteries. Furthermore, the precise parameters and configuration conditions under which an arc leads to thermal runaway in batteries remain unclear. The boundary conditions for arc-induced thermal runaway in batteries still need to be explored. Conducting arc experiments under various operating conditions is essential for advancing the research on arc failures in battery systems.

Author Contributions

Conceptualization, W.X. and Y.L.; Data curation, B.G. and Y.L.; Formal analysis, W.X., K.Z., H.W. and L.L.; Funding acquisition, L.L., Y.W. and Y.L.; Investigation, K.Z.; Methodology, W.X., L.L. and Y.L.; Project administration, K.Z. and H.W.; Resources, H.W. and Y.W; Software, W.X., H.W. and B.G.; Supervision, Y.W.; Validation, W.X.; Writing—original draft, W.X.; Writing—review & editing, Y.L. All authors have read and agreed to the published version of the manuscript.

Funding

This work is supported by the Ministry of Science and Technology of China (the grant No. 2022YFB2404803), and supported by the National Natural Science Foundation of China (grant No. 52207241, 52207240), and funded by China National Postdoctoral Program for Innovative Talents (grant no. BX20220171), and Shuimu Tsinghua Scholar Program (grant no. 2021SM130 & 2023SM232).

Data Availability Statement

The original contributions presented in the study are included in the article, further inquiries can be directed to the corresponding author.

Acknowledgments

State Key Laboratory of Intelligent Green Vehicle and Mobility.

Conflicts of Interest

The authors declare no conflict of interest.

References

  1. Wassiliadis, N.; Steinsträter, M.; Schreiber, M.; Rosner, P.; Nicoletti, L.; Schmid, F.; Ank, M.; Teichert, O.; Wildfeuer, L.; Schneider, J.; et al. Quantifying the state of the art of electric powertrains in battery electric vehicles: Range, efficiency, and lifetime from component to system level of the Volkswagen ID.3. eTransportation 2022, 12, 100167. [Google Scholar] [CrossRef]
  2. Yu, W.; Guo, Y.; Shang, Z.; Zhang, Y.; Xu, S. A review on comprehensive recycling of spent power lithium-ion battery in China. eTransportation 2022, 11, 100155. [Google Scholar] [CrossRef]
  3. Chen, Y.; Kang, Y.; Zhao, Y.; Wang, L.; Liu, J.; Li, Y.; Liang, Z.; He, X.; Li, X.; Tavajohi, N. A review of lithium-ion battery safety concerns: The issues, strategies, and testing standards. J. Energy Chem. 2021, 59, 83–99. [Google Scholar] [CrossRef]
  4. Liu, J.; Li, J.; Wang, J. In-depth analysis on thermal hazards related research trends about lithium-ion batteries: A bibliometric study. J. Energy Storage 2021, 35, 102253. [Google Scholar] [CrossRef]
  5. Li, Y.; Feng, X.; Ren, D.; Ouyang, M.; Lu, L.; Han, X. Thermal Runaway Triggered by Plated Lithium on the Anode after Fast Charging. ACS Appl. Mater. Interfaces 2019, 11, 46839–46850. [Google Scholar] [CrossRef] [PubMed]
  6. Christensen, P.A.; Milojevic, Z.; Wise, M.S.; Ahmeid, M.; Attidekou, P.S.; Mrozik, W.; Dickmann, N.A.; Restuccia, F.; Lambert, S.M.; Das, P.K. Thermal and mechanical abuse of electric vehicle pouch cell modules. Appl. Therm. Eng. 2021, 189, 116623. [Google Scholar] [CrossRef]
  7. Nie, B.; Dong, Y.; Chang, L. The evolution of thermal runaway parameters of lithium-ion batteries under different abuse conditions: A review. J. Energy Storage 2024, 96, 112624. [Google Scholar] [CrossRef]
  8. Xavier, L.S.; Amorim, W.C.S.; Cupertino, A.F.; Mendes, V.F.; do Boaventura, W.C.; Pereira, H.A. Power converters for battery energy storage systems connected to medium voltage systems: A comprehensive review. BMC Energy 2019, 1, 7. [Google Scholar] [CrossRef]
  9. Xu, W.; Wu, X.; Li, Y.; Wang, H.; Lu, L.; Ouyang, M. A comprehensive review of DC arc faults and their mechanisms, detection, early warning strategies, and protection in battery systems. Renew. Sustain. Energy Rev. 2023, 186, 113674. [Google Scholar] [CrossRef]
  10. Yoon, Y.-H. Safety Analysis of Smart Grid Lines According to DC Arc Generation. J. Electr. Eng. Technol. 2023, 18, 697–703. [Google Scholar] [CrossRef]
  11. Augeard, A.; Singo, T.; Desprez, P.; Abbaoui, M.H. Contribution to the study of electric arcs in lithium-ion batteries. IEEE Trans. Compon. Packag. Manuf. Technol. 2016, 6, 1066–1076. [Google Scholar] [CrossRef]
  12. Augeard, A.; Singo, T.; Desprez, P.; Abbaoui, M.H. Numerical methods for detecting DC arc fault in lithium-ion batteries. In Proceedings of the 2015 IEEE 61st Holm Conference on Electrical Contacts (Holm), San Diego, CA, USA, 11–14 October 2015; pp. 39–46. [Google Scholar]
  13. Guo, L.; Ke Xb, T.Y.S. Design of arc fault detection method and test system for new energy automobiles. Insul. Mater. 2018, 51, 74–79. [Google Scholar]
  14. Jie, D.; Baohui, C.; Jiazheng, L.; Tiannian, Z.; Chuanping, W. Thermal runaway and combustion characteristics, risk and hazard evaluation of lithium-iron phosphate battery under different thermal runaway triggering modes. Appl. Energy 2024, 368, 123451. [Google Scholar] [CrossRef]
  15. Lystianingrum, V.; Priyadi, A.; Negara, I.M.Y. Lessons learned from large-scale lithium-ion battery energy storage systems incidents: A mini review. Process Saf. Prog. 2023, 42, 348–355. [Google Scholar] [CrossRef]
  16. Dong, C.; Gao, B.; Li, Y.; Wu, X. Experimental and Model Analysis of the Thermal and Electrical Phenomenon of Arc Faults on the Electrode Pole of Lithium-Ion Batteries. Batteries 2024, 10, 127. [Google Scholar] [CrossRef]
  17. Park, Y.; Song, T. Plasma arc simulation of high voltage circuit breaker with a hybrid 2D/3D model. In Proceedings of the 2022 6th International Conference on Electric Power Equipment-Switching Technology (ICEPE-ST), Seoul, Republic of Korea, 15–18 March 2022; pp. 190–193. [Google Scholar]
  18. Jin, C.; Sun, Y.; Wang, H.; Lai, X.; Wang, S.; Chen, S.; Rui, X.; Zheng, Y.; Feng, X.; Wang, H. Model and experiments to investigate thermal runaway characterization of lithium-ion batteries induced by external heating method. J. Power Sources 2021, 504, 230065. [Google Scholar] [CrossRef]
  19. Johnson, J.; Schoenwald, D.; Kuszmaul, S.; Strauch, J.; Bower, W. Creating dynamic equivalent PV circuit models with impedance spectroscopy for arc fault modeling. In Proceedings of the 2011 37th IEEE Photovoltaic Specialists Conference, Seattle, WA, USA, 19–24 June 2011; pp. 002328–002333. [Google Scholar]
  20. Feng, X.; Zheng, S.; Ren, D.; He, X.; Wang, L.; Cui, H.; Liu, X.; Jin, C.; Zhang, F.; Xu, C. Investigating the thermal runaway mechanisms of lithium-ion batteries based on thermal analysis database. Appl. Energy 2019, 246, 53–64. [Google Scholar] [CrossRef]
  21. Liu, K.; Yang, F.; Wang, S.; Gao, B.; Xu, C. The research on the heat source characteristics and the equivalent heat source of the arc in gaps. Int. J. Heat Mass Transf. 2018, 124, 177–189. [Google Scholar] [CrossRef]
  22. Yang, F.; Liu, K.; Wang, S.; Gao, B.; Ai, S.; Zheng, X.; Le, Y.; Uilah, I. A thermal-stress field calculation method based on the equivalent heat source for the dielectric fitting under discharging. Appl. Therm. Eng. 2018, 138, 183–196. [Google Scholar] [CrossRef]
  23. Wang, H.; Du, Z.; Rui, X.; Wang, S.; Jin, C.; He, L.; Zhang, F.; Wang, Q.; Feng, X. A comparative analysis on thermal runaway behavior of Li (NixCoyMnz) O2 battery with different nickel contents at cell and module level. J. Hazard. Mater. 2020, 393, 122361. [Google Scholar] [CrossRef] [PubMed]
  24. Khan, S.; Anwar, S.; Casa, J.; Hasnain, M.; Ahmed, H.; Sezer, H. Modeling Thermal Runaway in Prismatic Lithium-Ion Batteries. In Proceedings of the ASME 2023 International Mechanical Engineering Congress and Exposition, New Orleans, LA, USA, 29 October–2 November 2023; p. V010T011A048. [Google Scholar]
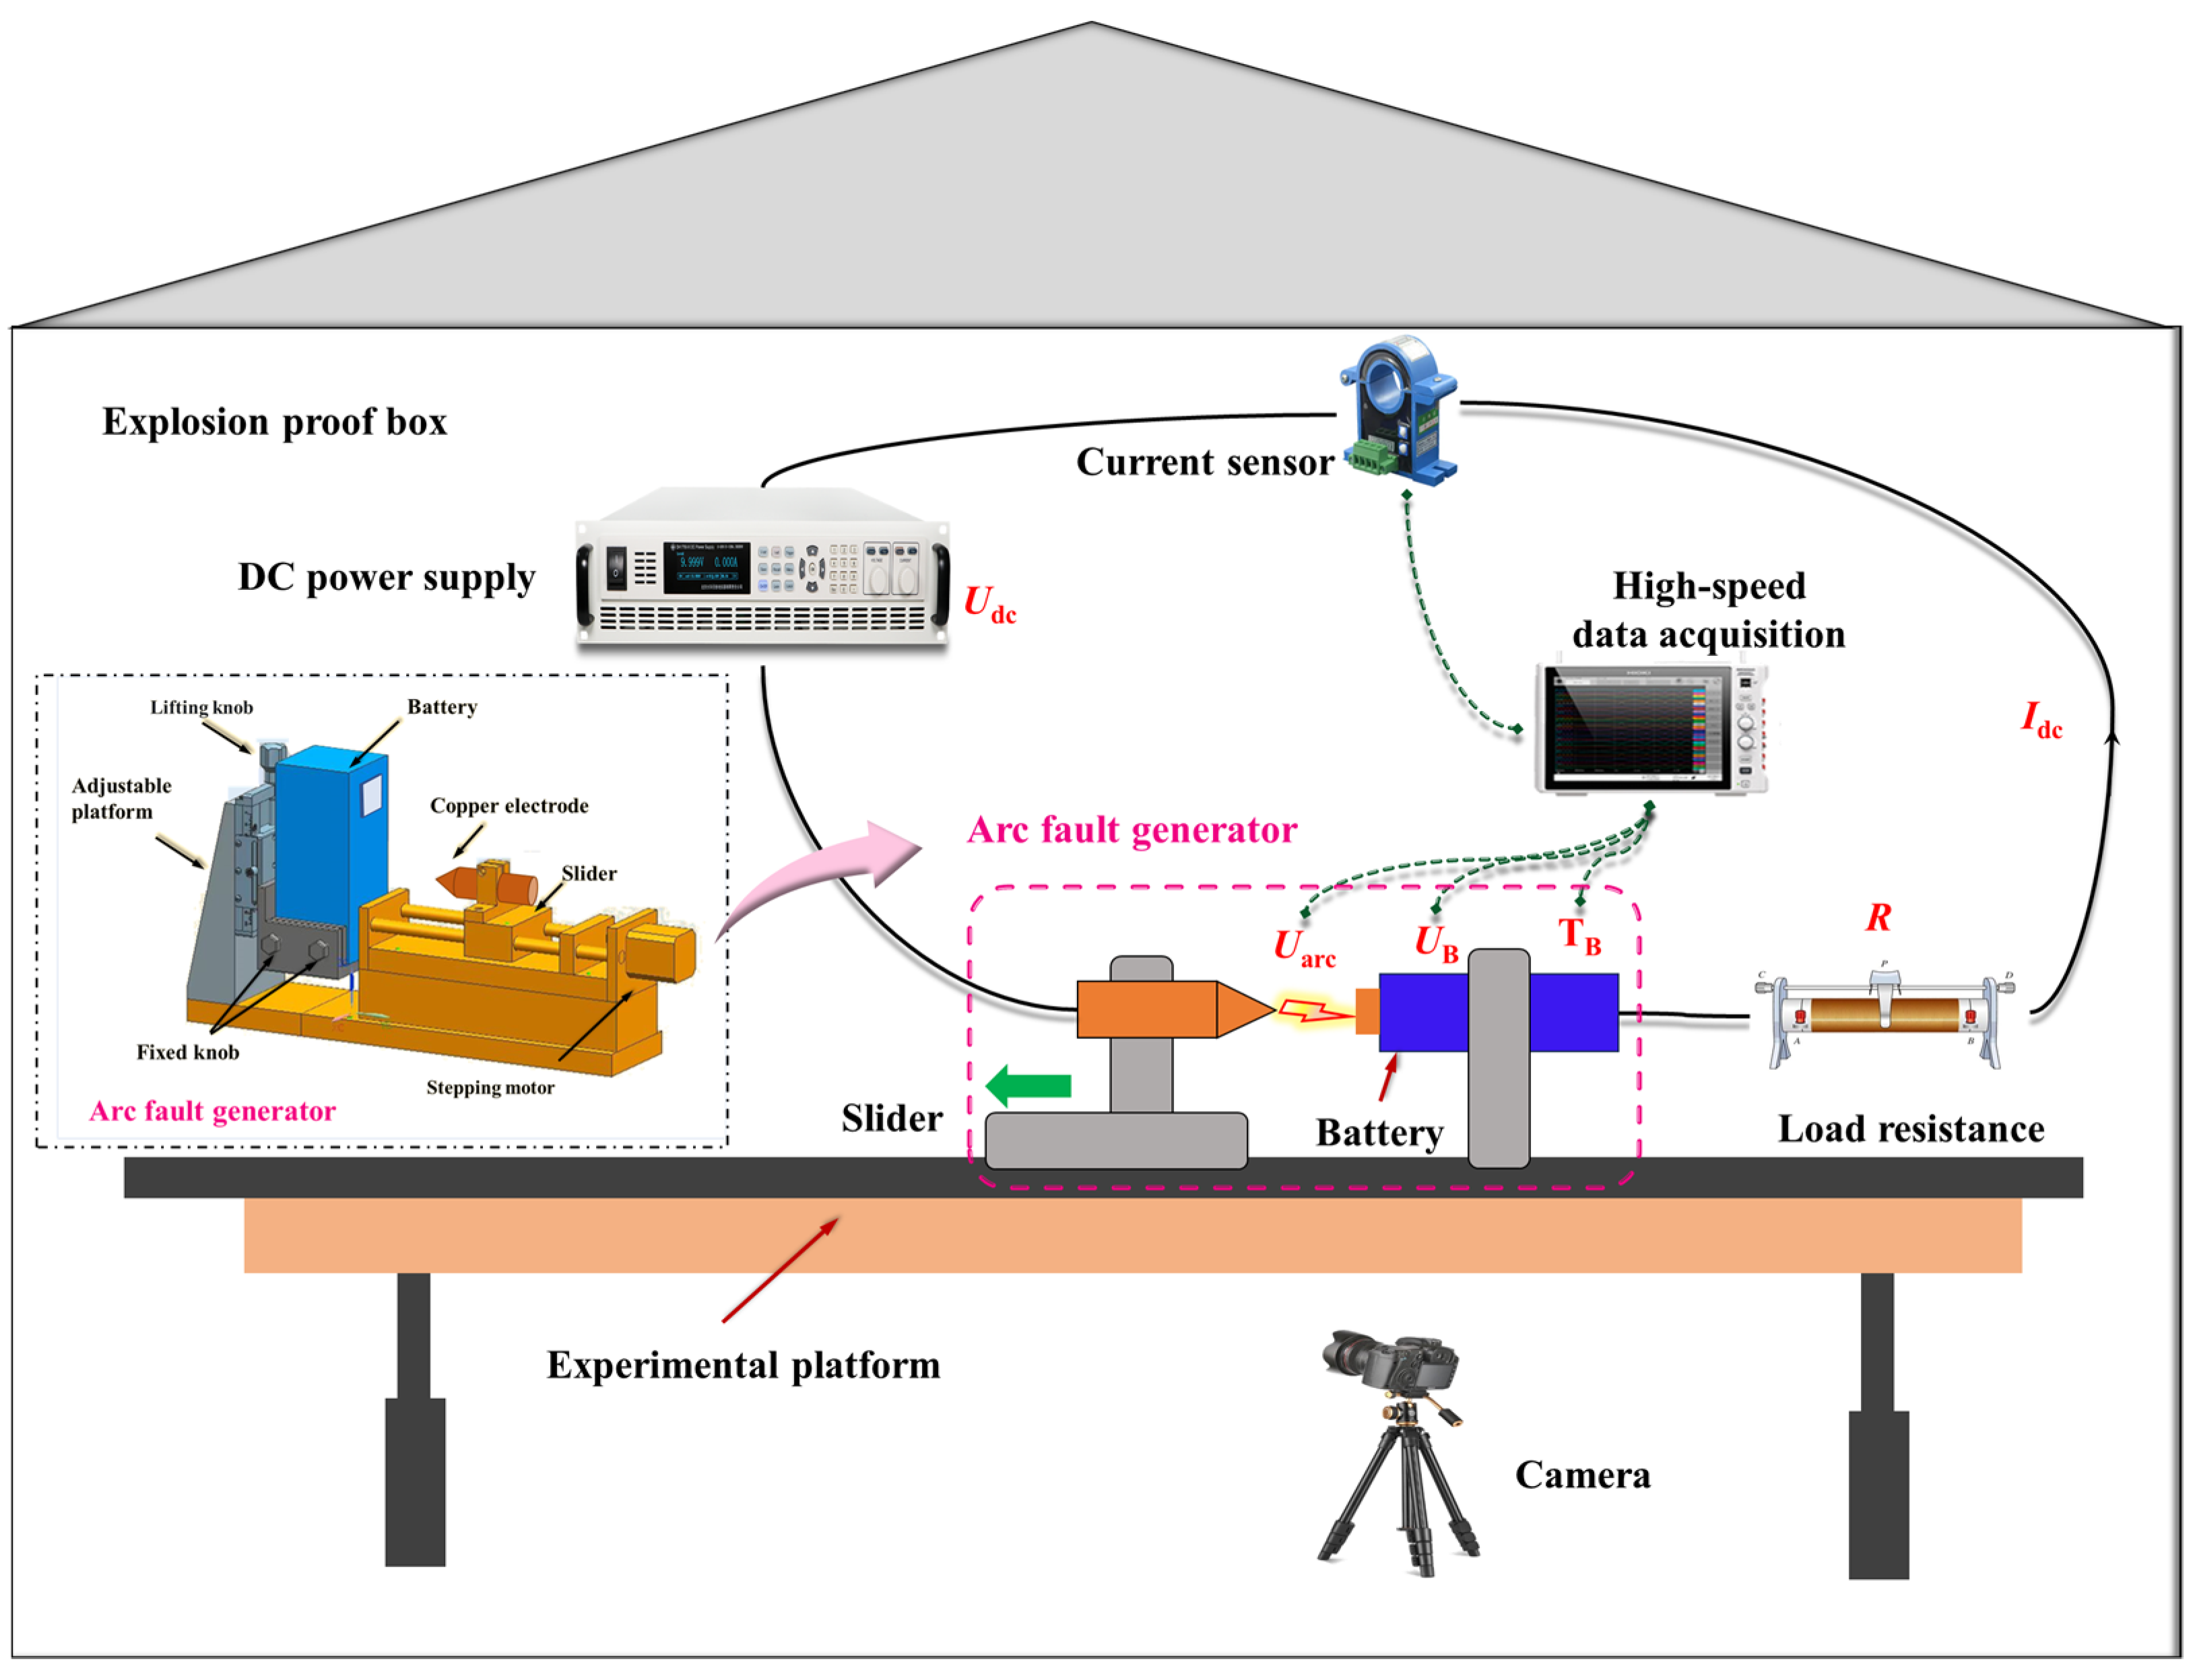
Figure 1. Experimental platform.
Batteries 10 00269 g001
Figure 2. Experimental setup: (a) Top cover; (b) Battery.
Batteries 10 00269 g002
Figure 3. Results of the arc experiment on the battery cover: (a) Arc voltage, loop current, and temperature; (b) Arc power and arc resistance.
Batteries 10 00269 g003
Figure 4. Arc experiment on the negative terminal of battery: (a) Experimental image; (b) Arc voltage, circuit current, and battery voltage; (c) Temperature at various preset points.
Batteries 10 00269 g004
Figure 5. The simplified composition of arc power.
Batteries 10 00269 g005
Figure 6. Sample battery geometry and data of accelerating rate calorimeter: (a) Battery geometry; (b) Data of accelerating rate calorimeter.
Batteries 10 00269 g006
Figure 7. Flowchart of the method to determine the power transfer coefficient k.
Batteries 10 00269 g007
Figure 8. The model results of the battery cover corresponding to the optimal kbest: (a) Top cover temperature map; (b) The temperature comparison between simulation and experiment (T1 and T2 represent the experimental curves, while T1′ and T2′ represent the simulation curves).
Batteries 10 00269 g008
Figure 9. The input and results of the arc-induced battery TR model with 300 V and 15 A: (a) Arc power Parc and equivalent power Parc_bat; (b) Comparison of experimental and model temperatures.
Batteries 10 00269 g009
Figure 10. Temperature cloud maps of batteries at different times.
Batteries 10 00269 g010
Figure 11. The input and results of the arc-induced battery TR model with 200 V and 20 A: (a) Arc power Parc and equivalent power Parc_bat; (b) Comparison of experimental and model temperatures.
Batteries 10 00269 g011
Figure 12. Relationship between different equivalent powers and equivalent radii and TR: (a) Parc_bat; (b) r.
Batteries 10 00269 g012
Table 1. Typical parameters of the LiFePO4 cell.
Battery CellSpecification
Cathode materialLiFePO4
Anode materialgraphite
Nominal capacity (Ah)20
Nominal voltage (V)3.2
Dimensions L × W × H (mm)70 × 27 × 134
Top cover dimensions(mm)70 × 27 × 4
Weight (kg)0.42
Table 2. Equipment parameters.
EquipmentParameters
DC power supply (V)0–1500
Hall current sensor (A)0–25
Load resistance (Ω)0–30
High-speed data acquisition (MS/s)0–10
Camera (dpi)2048 × 1080
Arc fault generatorUL1699B
ThermocoupleK-type
Table 3. Material properties.
Component NameMaterialρ [kg·m−3]Cp [J·kg−1·K−1]λ [W·m−1·K−1]
Battery shellAl2700880158
Battery coreAl2700880158
Battery coverUser-defined1900981λx = λz = 29
λy = 0.20
Positive terminalAl2700880237
Negative terminalCu8960385400
Air spaceAir0.3–1~13–8
Table 4. Boundary condition parameters.
ParametersMaterialThickness [mm]Heat Transfer Coefficient [W·m¹·K¹]Heat Dissipation Coefficient [W·m²·K¹]
Heat conductionInsulating layer between the equivalent heat source and the battery shell0.050.023/
Insulating layer between the front face of the cell and the battery shell0.10.023/
Insulating layer between the side face of the cell and the battery shell0.50.023/
Insulating layer between the rear face of the cell and the battery shell0.20.023/
Convective heat transfer coefficientEquivalent heat source//18
The top cover and terminal//18
The circum of the shell//20
The bottom of the shell//20
Table 5. The comparison between experimental and simulation results at different temperature points.
ParametersT3T3T4T4T5T5
tarc_TR/s201195.8201.8197.7202.5199
Time difference/s5.24.13.5
RMSE before arc extinguishes/°C2.862.210.55
RMSE in the first 300 s/°C6.476.002.67
RMSE in the first 400 s/°C9.028.075.80
Table 6. Comparison of experimental and simulation results at different temperature points under the conditions of 200 V and 20 A.
ParametersT3T3T4T4T5T5
tarc_TR/s179.7174.2180.8177.1182.1179.3
Time difference/s5.53.72.9
RMSE before arc extinguishes/°C3.613.562.15
RMSE in the first 300 s/°C7.036.814.80
Disclaimer/Publisher’s Note: The statements, opinions and data contained in all publications are solely those of the individual author(s) and contributor(s) and not of MDPI and/or the editor(s). MDPI and/or the editor(s) disclaim responsibility for any injury to people or property resulting from any ideas, methods, instructions or products referred to in the content.