Abstract
This paper presents an extensive study on the electrochemical, shunt currents, and hydraulic modeling of a vanadium redox flow battery of m stacks and cells per stack. The shunt currents model of the battery has been developed through the use of Kirchoff’s laws, taking into account the different design cases that can occur and enumerating the equations of nodes and meshes specifying them so that the software implementation can be performed in a direct way. The hydraulic model has been developed by numerical methods. These models are put to work simultaneously in order to simulate the behavior of a VRFB battery during charging and discharging, obtaining the pressure losses and shunt currents that occur in the battery. Using these models, and by using a PSO-type optimization algorithm, specifically designed for discrete variables, the battery design is optimized in order to minimize the round-trip efficiency losses due to pressure losses and shunt currents. In the optimization of the battery design, value is given to the number of stacks in which the total number of cells in the battery is distributed and the dimensions of the piping relative to both the stacks and the cells.
1. Introduction
The commitment to the use of renewable energies as an alternative to fossil fuels began decades ago, motivated among other factors by the growing concern about the depletion of fossil fuels, the environmental impact of their use, and by strategic political interests [1]. Since then, energy from renewable sources has been increasing year after year [2], with most developed countries planning to continue this trend in the long term.
Most types of renewable energy sources, such as solar and wind, are intermittent and variable in their energy generation, and therefore, by themselves, cannot respond to a constant energy demand. To solve this problem, energy storage systems are necessary, which make it possible to supply energy when renewable sources are not able to generate it. In addition, the inclusion of energy storage systems in the grid is beneficial for balancing energy demand and optimizing the cost of energy [3].
There are many types of energy storage systems, such as compressed air systems, which work by storing air in a subway cavern and then when necessary release it to a turbine to produce electricity, kinematic energy systems, in which a rotor rotates at high speeds and energy is extracted by decreasing the rotor speed and stored by increasing it, and energy pumping systems, in which the potential of water is used to store or discharge energy [4].
Currently, the most widely used storage systems are batteries, which store energy electrochemically. Among the batteries, lithium-ion batteries are the most widely used to date; due to their high energy density combined with their high specific energy they have made it possible to design storage systems of this type in small sizes for both industrial and personal use, being used for applications as diverse as mobile devices and electric cars.
In recent times, there is a growing interest in the use of vanadium redox flow batteries (VRFBs) for grid energy storage due to their characteristics compared to other types of batteries such as Li-ion batteries. The main advantages attributed to this type of batteries are their long life, which is theoretically infinite, and the scalability and flexibility inherent to the modularity present in systems of this type of batteries, which means that it can be adapted to different operating conditions and low response time and low self-discharge [5,6]. The biggest disadvantages of VRFBs are the low energy density and the lower efficiency they have compared to other types of batteries [3,5,7].
Because of this, there are numerous studies focused on the study of the efficiency of VRFBs. In [8], an analysis of the energy efficiency of kilowatt class batteries and a method for estimating the key parameters of VRFBs from an efficiency perspective are shown. An electrochemical model of the cells is shown, but any type of numerical modeling is omitted, since the developed method aims to be able to dispense with numerical modeling, due to the complexity of the development of this type of model.
In [9], the effects of operating temperature on the Coulombic efficiency of VRFBs are studied. By performing tests on VRFB test equipment, the authors came to the conclusion that a higher operating temperature implies losses in Coulombic efficiency and the need for thermal management is emphasized to obtain the greatest possible efficiency. In [10], a thermal hydraulic model is developed with the objective of studying the influence that the electrolyte flow rate and temperature have on the efficiency of the VRFB. More studies have been carried out that converge with the main line of optimizing efficiency based on flow [11,12,13].
Another factor that negatively affects the Coulombic efficiency of the battery are the shunt currents. These currents are those that circulate through the pipes of the hydraulic system of the battery, causing less current to circulate through the battery cells than it should. These currents have been studied in papers such as [14,15,16,17] and others, where tools are used or reduced numerical models are shown for the simulation of shunt currents.
In [15], a study on the optimization of the efficiency of the battery taking into account the efficiency losses due to shunt currents and due to pressure losses is carried out. The article models the primary and secondary pressure losses in the hydraulic system piping as well as the pressure losses due to the electrodes and the gravitational pressure losses. A scheme for the shunt currents model is shown, although the model for the calculation of the shunt currents is not developed. Finally, a set of possible battery designs are listed, which differ in the number of stacks in which the cells are distributed and the sizes of the channels and branches, and they are compared with each other in terms of efficiency losses.
In [14,15], a study is performed but only taking into account the shunt currents when comparing the efficiencies between different VRFB designs. The shunt currents model is detailed for batteries with several U-connected stacks of cells. This model is obtained by applying Kirchoff’s laws, and to formulate the equations simplifications are made considering that the current flowing through the channels of the same sign of a cell is the same. This simplification also applies to the branches of the same sign relative to a stack. The data are validated against experimental data and a sensitivity study is performed on the voltage variation as the cell resistance varies.
In [17], a study of shunt currents is conducted for a case of a single-stack battery with 10 cells. The calculation of the currents is made by means of a model developed with Kirchoff’s laws, in which it is considered that the currents that circulate through the two positive or negative channels of the cells are the same, making the pertinent simplifications derived from this consideration. This model is verified against a VRFB stack of which details are given on the materials used for its fabrication, showing that the results of the shunt currents obtained with the model are close to the experimental ones. In this article, a sensitivity analysis is also performed, showing results of increases and decreases of shunt currents for changes in model parameters such as equivalent pipe resistances, cell resistances, and total current imposed on the battery. The study of shunt currents is a current topic, as shown in articles such as [18,19].
In general, it can be concluded that much of the efficiency is determined by the battery design, which affects shunt currents and pressure losses. Taking this into account, this article presents the electrochemical, electrical, and hydraulic models of the vanadium battery. In the electrochemical model, the dynamics of the tanks and cells have been modeled, since, based on these concentrations, the and electrolyte conductivity values are obtained, which will serve as input for the battery shunt currents model.
The shunt currents model has been developed using Kirchoff’s laws. There are quite a few articles in which models of this type are presented, but usually there is a tendency to simplify it due to the number of cases to be taken into account and different equations to obtain. In this article, all possible cases of multi-stack battery design have been developed, excluding only the case of a battery with a single stack and a single cell. All the Kirchoff equations that occur in the electrical circuits equivalent to the VRFB have been presented, dividing them into different blocks and indexing the algebraic components in such a way as to facilitate the implementation of the model.
For the hydraulic model, the primary and secondary losses that occur in the pipes of the hydraulic system, those that occur due to the electrodes and the gravitational pressure losses, have been taken into account. For this model, the pressure losses that occur in the trunks and manifolds have been taken into account, although they are usually neglected because due to the diameter of these pipes, the losses that occur are very low. This model has been carried out using numerical methods and assuming that the same flow of electrolyte passes through each cell.
These models are put to work together, so that, through a metaheuristic optimization technique derived from the PSO, designed specifically for this work, an optimization of the design parameters is carried out in order to minimize the round-trip efficiency losses caused by pressure losses and shunt currents. In this way, what is sought in this work is the automation of the optimization of the design of this type of batteries. Basically, the research has been developed as shown in Figure 1.
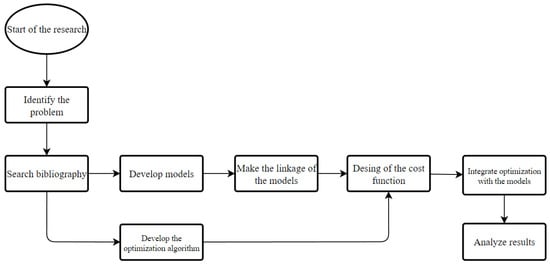
Figure 1.
Research process image.
2. Electrochemical Model of the Cells and Tanks
In the development of the electrochemical and tank models, the following considerations were taken into account:
- The effect of diffusion of vanadium ions through the membrane has not been considered for the model;
- In addition, no other side reactions have been considered;
- Positive sign of the current means discharge, negative sign means charge;
- The temperature remains constant throughout the simulation;
- Both activation and concentration over-potential have been neglected;
- Concentration of hydrogen ions of the cells remains constant;
- All cells receive the same flow rate;
- All cells have the same values of vanadium species concentrations.
The equations described in this section define the dynamical battery behavior. Equations (1)–(6) define the vanadium species concentrations differential equations in the cells and main vanadium chemical reactions. Equations (7)–(14) show the electrical aspects of the cells. Equations (15)–(18) define the vanadium species concentrations differential equations in the tanks. Equations (19) and (20) are the discrete version of the differential equations.
Table 1 shows the nomenclature related to the electrochemical model of the cells and tanks.

Table 1.
Information about the nomenclature related to the electrochemical model.
It should be noted that the electrochemical model works with the flow rate in while the hydraulic model works in .
2.1. Cell Electrochemical Model
Equations (1) and (2) show the redox reactions that take place inside a VRFB cell and perform the energy transformation [20,21].
At the positive electrode of the cell:
At the negative electrode of the cell:
In the case of considering the diffusion of vanadium ions through the cell membranes, other equations related to the side reactions that occur would also have to be taken into account, as described in [22,23]. Taking into account these side reactions would influence the expressions of the mass balance equations of the cells as shown in [20]. For this work, the mass balance equations considered for the VRFB cells are (3)–(6) [22,24].
where is the cell volume, is the total electrolyte flow rate for the VRFB, and are the number of stacks in the VRFB and the number of cell per stack, is the molar concentration of the vanadium species for the cells, is the molar concentration of the vanadium species for positive or negative tank, is the current of the battery, is the number of electrons transferred in the reaction, being in these cases, and is the Faraday constant.
The cell voltage can be calculated as shown in Equation (7) [20,25,26].
where is the open-circuit voltage of the cell, is the current flowing through the cell, is the ohmic resistance of the cell, are the cathodic and anodic activation over-potentials, and are the cathodic and anodic concentration over-potentials. Since activation and concentration over-potentials have not been taken into account for this work, Equation (7) can be simplified to Equation (8).
The resistance of the electrodes, membrane, bipolar plates, and other cell elements contribute to the cell resistance. Typically, it is a known value. The can be calculated using Equation (9).
where is the concentration of hydrogen ions in the cells, is the ideal gas constant, and is the temperature. Because the concentration of is assumed to remain constant, in [20] Equation (9) is reduced to Equation (10).
where is the formal standard potential of the cells.
The calculation of the SOC of the cells can be performed using the expressions of Equations (11) and (12).
The SOC influences the conductivity of the electrolyte and the electrolyte conductivity is further used in the shunt currents model for the calculation of the equivalent pipe resistivity (see Equation (21)). To calculate the conductivity of the catholyte and anolyte electrolyte, Equations (13) and (14) are used [16,27].
where and are the standard conductivities of the vanadium species.
2.2. Tank Electrochemical Model
Equations (15)–(18) are those related to the mass balance of the electrolyte tanks of the battery [20].
where and are the volume of the anodic and cathodic tanks.
2.3. Implementation of the Electrochemical Model
The implementation of this part of the work has been carried out by converting the differential equations to difference equations. Thus, for the tanks, instead of working with Equations (15)–(18), the difference equation defined in Equation (19) is used.
referring to the vanadium species, to the simulation step, and particularizing to the positive and negative tank values as appropriate. The same has been performed with Equations (3)–(6), resulting in Equation (20).
For it is necessary to set some initial values for and which will be denoted as and .
3. Shunt Currents Model
Shunt currents appear in an RFB because the electrolyte flowing through the hydraulic system and connecting the different cells and stacks is electrically conductive. In general, for RFBs, the existence of shunt currents leads to two main problems. On the one hand, as part of the current is lost in the hydraulic system bypasses, the current reaching the cells is less than it should be, causing power losses and consequently lowering the efficiency of the system. On the other hand, the shunt currents, which circulate through the electrolyte, produce the discharge of reactants, which can cause corrosion reactions in the different elements of the battery, such as electrodes and pipes [28,29].
The VRFBs, by using graphite electrodes, avoid the problem of electrode corrosion. The latter, together with the use of non-metallic pipes, would eliminate the problem of corrosion in the battery [30]. However, the problem of efficiency drop is still present in this type of batteries, so shunt currents are an issue to be taken into account when designing the battery.
NASA researchers were the first to present an equivalent electrical model for modeling shunt currents in an RFB battery [31]. The equivalent electrical circuit presented by the NASA researchers has been widely used to model the phenomenon of shunt currents, as can be seen in works such as [30,32,33,34]. This equivalent model has been modified for the inclusion of several cell stacks in works such as [14,15] in which the shunt currents in Z-connected stacks and U-connected stacks are studied, respectively.
In this article, the model presented in [31] has been used as a basis for the design of an electrical circuit that generically models the shunt currents of a battery composed of stacks connected in Z with cells in each one. For this purpose, the methodology of [33] of applying Kirchhoff’s laws of voltage and current for the formulation of the circuit equations and the applying of linear algebra for the analytical solution has been followed. The shunt model has been formulated to allow its integration with other electrochemical models, in which, for example, a different flow rate is considered for each of the cells.
Table 2 shows the nomenclature used for the shunt currents model.

Table 2.
Information about the nomenclature related to the shunt model.
3.1. Equivalent Electrical Model
Figure 2 shows an example of an equivalent electrical circuit modeling the shunt currents of single-stack cells according to [31].
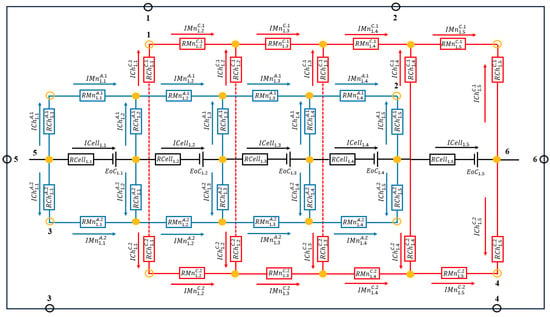
Figure 2.
Electrical circuit equivalent to a five-cell stack. The numbers indicate the connection points of the stack with another stack.
This circuit has been extended in the same way as seen in [15] to obtain an equivalent electrical circuit that models the shunt currents of a battery composed of several stacks of cells (Figure 3).
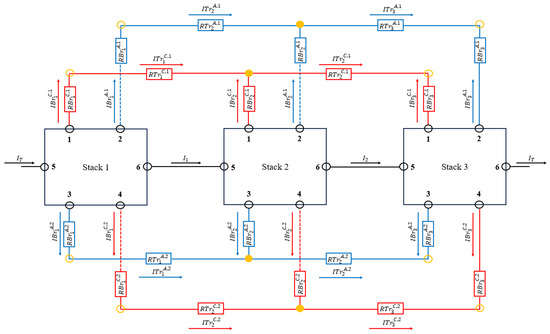
Figure 3.
Electrical circuit equivalent to a battery with three stacks of cells.
and represent the electrical resistance of the electrolyte flowing through the channels and manifolds associated with cell of stack , while and represent the electrical resistance of the electrolyte flowing through the branches and trunks associated with stack . The superscripts and indicate whether the pipe section is associated with the anode or the cathode and and indicate whether the pipe is an outlet or inlet pipe. The manifolds and trunks have been numbered according to their physical position and not their order of appearance. These resistances are calculated according with the expression in Equation (21).
where and are the length and cross section of the pipe and is the conductivity of the electrolyte. In the above equation, the conductivity of the anolyte or catholyte electrolyte has to be considered depending on which of the two circuits the pipe belongs to. and corresponds to the internal electrical resistance and open circuit potential, respectively, of cell of stack .
3.2. Mathematical Model
In the mathematical modeling, all special cases have been considered except for the case of having stacks with one cell in each. Some authors make the simplification of considering the current of the inlet and outlet channels [33] and the inlet and outlet branches [14] as equal because the paths are symmetrical in their works. Although these simplifications reduce the effort required for the formulation and implementation of the model, it has been decided not to consider them when formulating the equations. Thus, this model is applicable when the input and output paths are not electrically symmetrical.
The goal of the model is to solve the equivalent electrical circuit by obtaining the currents through each element of the circuit. The number of currents to be determined in an equivalent circuit with stacks with cells in each is obtained with the expression in Equation (22).
For the case , there will be channel currents, cell currents, and 4 manifold currents. Since there is only one stack, the complete equivalent circuit would be as shown in Figure 2 and there would be no branch and trunk currents due to the non-existence of these. Therefore, the number of currents to be determined is . For the general case of having stacks, each of the stacks contribute with currents but due to the appearance of trunks and branches, branch currents and trunk currents must be taken into account. This results in a number of currents to be determined equal to .
To obtain all currents in the circuit an equal number of equations are needed. These equations are obtained by applying Kirchhoff’s laws to all the nodes and meshes of the circuit. The following cases have been distinguished in the formulation of the equations:
- First cell of the stack and first cell of the circuit;
- Intermediate cells of the stack;
- Last cell of the stack and last cell of the circuit;
- Battery with only a stack;
- First stack of the circuit;
- Intermediate stacks;
- Last stack of the circuit.
3.2.1. First Cell of the Stack and First Cell of the Circuit
Applying Kirchhoff’s laws to the nodes and meshes of the first cell of a stack gives the Equations (23)–(29).
The first cell of the circuit is also the first cell of its stack, thus resulting in a particular case of the previous case. Equations (24)–(29) are applicable for this case, while Equation (23) is replaced by Equation (30).
where is the current imposed in the charge or discharge of the battery. In case the battery has only one stack, since the branch and trunk disappear, Equations (25) and (26) must be modified to Equations (31) and (32). This only applies to the first cell of the circuit.
3.2.2. Intermediate Cells of the Stack
Applying Kirchhoff’s laws for an intermediate cell of a stack gives the Equations (33)–(41).
The equations in this case are not affected by whether there is one stack or several, since the stacks are electrically connected through the first and last stack cells.
3.2.3. Last Cell of the Stack and Last Cell of the Circuit
Starting with the most general case, Equations (42)–(48) are those obtained by applying Kirchhoff’s laws to the nodes and meshes of the last cell of stacks.
The equations of the last cell of the circuit are the same as the previous ones, only having to consider the substitution of Equations (43) and (46) by Equations (49) and (50) in case there is only one stack.
3.2.4. Battery with Only a Stack
In the case that the battery has only one stack, the considerations mentioned in previous sections must be taken into account. Apart from this, it is not necessary to add any additional equation related to the stack; therefore, Section 3.2.5, Section 3.2.6 and Section 3.2.7 need not be taken into account.
3.2.5. First Stack of the Circuit
The equations obtained for the first stack of the circuit are Equations (51)–(56).
Figure 4 shows the meshes and their current directions in Equations (55) and (56) taken for the first stack.
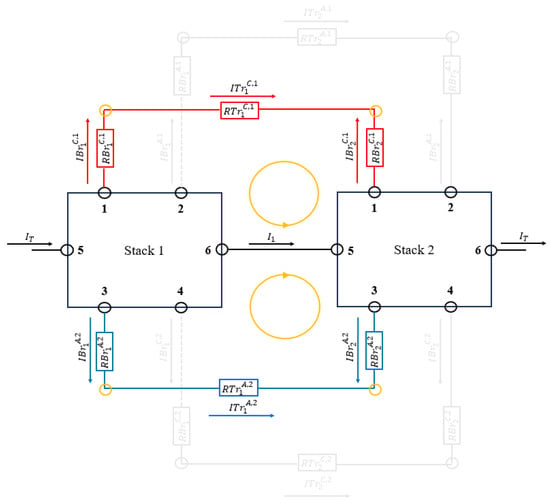
Figure 4.
Meshes and current directions taken for the first stack. The figure shows a battery with only two stacks, but it is generalizable to stacks.
3.2.6. Intermediate Stacks
The equations obtained for any intermediate stacks of the circuit are Equations (57)–(64).
As shown in Figure 5 for the intermediate stacks, four meshes have been considered instead of the two considered for the first and last stack. This fact is consistent with the number of equations obtained for this case.
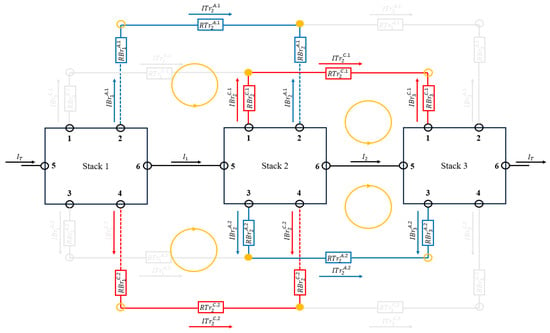
Figure 5.
Meshes and current directions taken for the middle stacks. The figure shows a battery with only three stacks, but it is generalizable to stacks.
3.2.7. Last Stack of the Circuit
The equations obtained for the last stack of the circuit are Equations (65)–(70).
Figure 6 shows the meshes and their current directions in Equations (69) and (70) taken for the last stack.
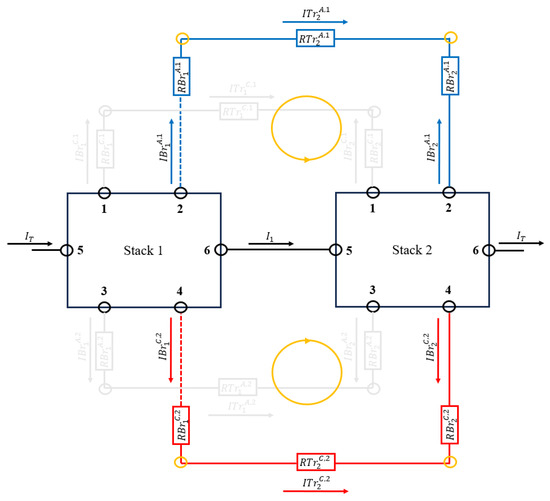
Figure 6.
Meshes and current directions taken for the last stack. The figure shows a battery with only two stacks, but it is generalizable to stacks.
3.3. Solve Methodology
To solve the system of equations generated for a battery of stacks and cells for each one, the method proposed in [33] has been followed. Since the equations are algebraic and linear, the value of the currents can be obtained as shown in Equation (71).
where is a column vector with the values of the independent terms of the equations, is a matrix with the coefficients of the equations, and is the column vector of the currents. By obtaining the vector of currents, all the currents flowing through each pipe and cell are obtained. The shunt currents are those currents that do not pass through the cells of the battery, being that they can be calculated with the Equation (72) [15].
4. Hydraulic Model
For the calculation of pressure losses in the hydraulic system, a numerical model has been developed subject to the following considerations:
- The same electrolyte flow rate is distributed throughout the battery stacks;
- It is also considered that the same flow of electrolyte is distributed to each of the cells of the stacks of the battery;
- The characteristics of dynamic viscosity and density of the electrolytes have been considered constant and equal for both;
- In the calculation of secondary pressure losses, bends and T-joints have been considered.
Usually, the segments of the trunks and manifolds of the battery are not considered for the calculation of pressure losses [15,21]. This is due to the fact that typically the section of these pipes is large compared to the section of the branches and channels, and, therefore, the pressure losses that occur when the flow of electrolyte passes through the trunks and manifolds is negligible compared to that which occurs in the branches and channels. However, for this study this simplification has not been taken into account.
Primary and secondary pressure losses have been considered when calculating the contribution of the hydraulic system piping to the total pressure loss. Primary pressure losses are those caused by the internal friction of the liquid itself and by friction with the pipe walls. Secondary pressure losses are those that are produced by singular elements of the pipes, such as bends, T-joints, and valves.
Table 3 shows the information of the parameters related to the hydraulic model.

Table 3.
Information about the nomenclature related to the hydraulic model.
4.1. Primary Pressure Losses in Pipes
To calculate primary pressure losses, the Darcy–Weisbach equation is typically applied (Equation (73)).
where is the electrolyte density, , and are the length, diameter, and section of the pipe segment, respectively, is the electrolyte flow that circulates through the pipe segment, and is the Darcy friction factor.
The value of the friction factor depends on several factors. Depending on whether the flow regime is laminar, critical, or turbulent, the expressions for the calculation of changes. To know the flow regime, the Reynolds number value is calculated (Equation (74)).
where represents electrolyte viscosity. There are variations in the limits of the values that the authors consider to make the transition from one regime to another. In this paper, we have considered the cases as described in Equation (75).
In laminar regime (), has been calculated by Equation (76).
Depending on the shape of the pipe section, the value of changes. In the case of circular section pipes, takes the value of 64. For the calculation of the friction factor in transition and turbulent regimes, there are many applicable equations (for example [35,36,37]). In this article, the Churchill equation for transitional and turbulent regimes has been taken into account because of its applicability for any value of [38]. Equation (77) shows the mathematical expression of the calculation of the friction factor according to Churchill.
where and are calculated as in Equation (78).
In the case of rectangular section pipes, the hydraulic diameter of the pipe will be calculated according to Equation (79).
where is the width of the pipe and is the height of the pipe. For this type of piping, the calculation of the coefficient will be considered as in [15], applying Equation (80).
4.2. Secondary Pressure Losses Due to Bends
In the case of bends, the pressure losses are calculated as the sum of the pressure losses in a straight pipe of the same radius as the bend radius plus those produced by the bend curvature plus the losses in the downstream tangent [39,40]. That said, Equation (81) shows the complete mathematical expression for the calculation of pressure losses in a bend.
where , and are the length, diameter, and cross section of the bend of the pipe segment, respectively, and and are the curvature and downstream tangent coefficient, respectively. The calculation of the bend length is achieved by Equation (82).
where and are the angle and radius of the bend, respectively. The radius of the bends is measured as shown in Figure 7.
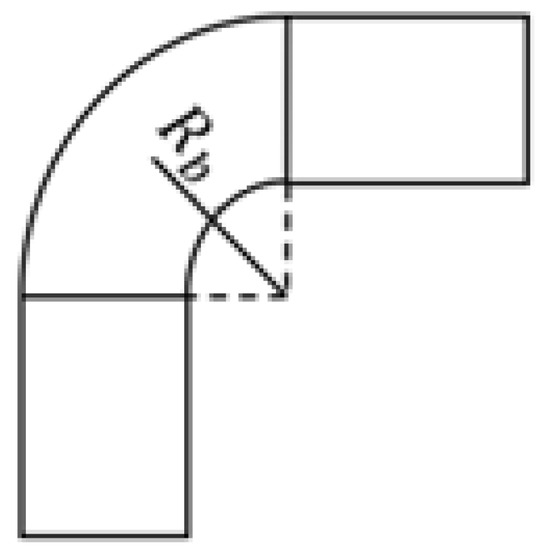
Figure 7.
Measurement of the radius of the bends.
Equation (81) is commonly rewritten as the expression shown in [41].
where is denoted as the bend coefficient and is the sum of and . In the literature, sometimes losses due to bend length are considered separately as additional straight pipe losses and consequently calculating the secondary losses caused by the existence of bends with the expression in Equation (84).
In this case, losses due to bend length are still taken into account, but as primary losses. In this work, the pressure losses in the bends are going to be calculated according to the expression in Equation (84).
The section of the bend will be considered to be that of the pipe segment previous to it.
4.3. Secondary Pressure Losses Due to T-Junction
There are many factors that affect localized pressure losses in T-junctions. These include the diameters and lengths of the individual T-junction branches, whether the flow diverges or converges across the T-junction, and others. To simplify this calculation, the length of the T-junction terminals has been considered, as part of the length of the pipe segments also has not been considered for whether the flows converge or diverge. In this way, Equations (85) and (86) has been considered for the calculation of pressure losses.
The same considerations on the section of the bends have been upheld to the sections and of the T-junctions.
4.4. Pressure Losses in Electrodes
Other important elements to take into account when calculating the overall pressure loss in the system are the porous graphite electrodes located in each half-cell of the battery. These pressure losses are not negligible and have been studied in studies such as [13,42]. Pressure losses caused by the porous electrodes can be calculated using Darcy’s law (Equation (87)).
where , and are the permeability, length, and cross section area of the porous electrode, respectively, and is the electrolyte flow through the electrode, which is the same as the flow through cell channels.
4.5. Pressure Losses Due to Gravity
These pressure losses exist due to the height difference between the outlet trunk pipe segment and the electrolyte surface of the tanks. The greater the height difference, the greater the pressure losses. The calculation of the pressure losses due to gravity is performed by the expression in Equation (88).
where is the gravity value and is the difference in height between the outlet trunk and the electrolyte surface of the tank.
4.6. Calculation Method
For the calculation of the total pressure drop of the battery, the following must be taken into consideration. Naturally, the pressure drop in the parallel branches of the hydraulic circuit should be equal, distributing the total flow in each branch according to the hydraulic resistance of each one. In this work, as a simplification, it has been considered that the same flow rate circulates in each of the cells of the battery. This in turn implies that the same flow rate circulates in each stack.
This simplification means that the parallel pressure losses will not be equal. Therefore, it has been decided to calculate an upper limit for the pressure loss of the hydraulic system, which is higher than what the total pressure loss of the circuit would be if the flow rates of the cells were not imposed. Figure 8 and Figure 9 show the path taken for the calculation of the upper dimension equivalent to the pressure losses in an example case.
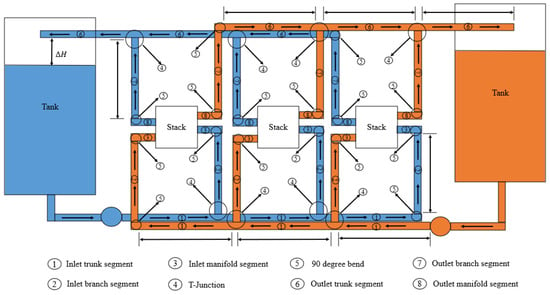
Figure 8.
Path taken for the calculation of pressure losses between stacks.
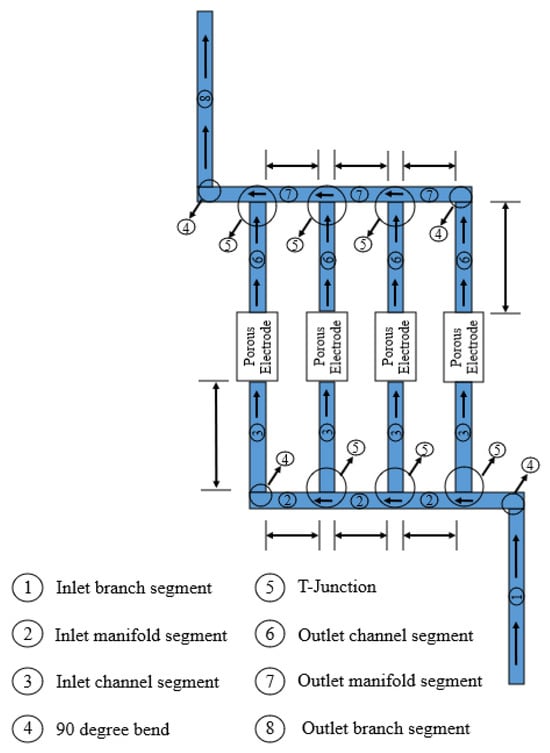
Figure 9.
Path taken for pressure calculation between cells.
The total pressure loss is calculated as the sum of the pressure losses in the elements through which the red arrow passes plus the losses due to gravity.
5. Simulation of the Models
5.1. Model Linkage and Calculation of Efficiencies
The implementation of the models has been carried out in MATLAB. Each model has been implemented individually, in order to be able to reuse them in subsequent work and to be able to compare the results obtained in each one with the literature. Once the verifications were performed, we proceeded to the union of the models by means of code that makes the calls for the execution of these.
In this work, the execution of an entire simulation consists of setting a and performing the complete charging and discharging of the battery according to the imposed design parameters. At each simulation instant, all three models are run. The final time at the end of the simulation is not defined in advance but is determined by the duration of the charging and discharging, being that this duration depends on parameters such as the imposed current and others.
Part of the inputs to the hydraulic and shunt currents models are determined by the electrochemical and tank models. In the shunt currents model, the and electrical resistances (Equation (21)) are determined by the electrochemical model (Equations (10), (13) and (14)). The flow rate of the cells at each instant of the simulation is determined by Equation (89) [10,20].
This equation is derived from Faraday’s law of electrolysis. is a ratio that relates the actual flow rate to the theoretical flow rate calculated by Faraday’s law and is the reactant concentration in the semi-cells for the chemical reactions of charge and discharge. To determine the total flow rate from the tanks, we have to apply Equation (90).
From these flow values obtained, the flow rates that circulate through each trunk and manifold segment are determined, taking into account that each cell receives the same flow rate and that each stack receives the same flow rate. The flow rate of the channels is the same as that of the cells and the flow rate of the branches is equal to the flow rate coming from the tank divided by the number of stacks.
The objective of the work is to optimize the battery design by maximizing efficiency. For this purpose, a round-trip efficiency loss calculation has been performed for the shunt and hydraulic models. For the hydraulic model, the expression in Equation (91), which determines the round-trip pumping losses, has been used [15].
where is the nominal current density of the battery, is the nominal voltage of the battery cells, and are the length and width of the electrodes, respectively, and and are the number of stacks and cells per stack, respectively. is the pumping efficiency, taken as a constant value. At the end of the simulation, an average of is made, summing the of all the instants and dividing it by the total number of instants of the simulation.
For the calculation of the round-trip efficiency loss due to shunt currents, Equation (92) has been applied [15].
That is, 1 minus the sum of the cell currents in the load divided by the cell currents in the discharge. Note that this equation should be applied for loading and unloading to a specific SOC.
Because the simulation consists of a charge from SOC 0 to SOC 100 and a discharge from SOC 100 to SOC 0, Equation (92) has not been applied directly. The sums of the charge and discharge currents were averaged for the time periods with SOC between 0 and 10, 10 and 20, 20 and 30, and continuing in intervals of 10 up to 90 and 100 following the Equations (93) and (94).
where represents the total number of instants with an SOC between and . Finally, the average round-trip efficiency losses due to shunt currents are calculated with Equation (95).
5.2. Example of Results Obtained in a Simulation
In this part, we will show the results obtained in a simulation with parameters taken from the literature. The parameters are a mix between the case G of the article [15] and the article [20] with some of our own parameters (Table 4, Table 5, Table 6, Table 7, Table 8, Table 9, Table 10, Table 11 and Table 12).

Table 4.
Cell parameters values used in the example simulation.

Table 5.
Electrolyte parameters values used in the example simulation.

Table 6.
Electrode parameters values used in the example simulation.

Table 7.
Pipe parameters values used in the example simulation.

Table 8.
Tank parameters values used in the example simulation.

Table 9.
Vanadium species parameters values used in the example simulation.

Table 10.
Battery parameters values used in the example simulation.

Table 11.
Constant parameters values used in the simulation.

Table 12.
Simulation parameters values used in the simulation.
This has been performed in order to compare the results obtained in the simulation with the results obtained in other articles.
Figure 10 and Figure 11 show the concentrations of vanadium species in the tanks and cells, respectively. Figure 12 shows plots of the flow rate and EOC of the cells during the simulation as well as the maximum, average, and minimum shunt currents of the cells according to Equation (72). Figure 13 shows the distribution of average pressure losses relative to the simulation.
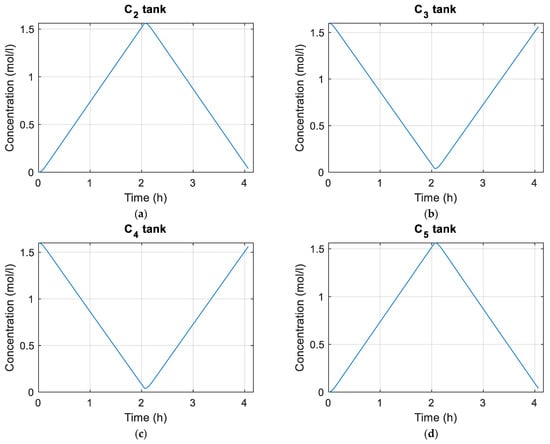
Figure 10.
(a) Concentration of in the tanks; (b) concentration of in the tanks; (c) concentration of in the tanks; (d) concentration of in the tanks.
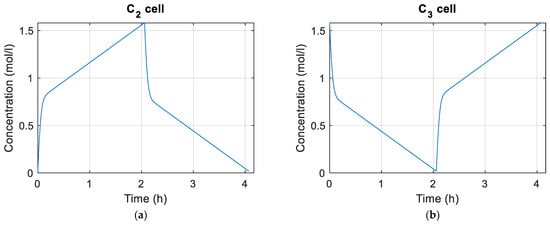
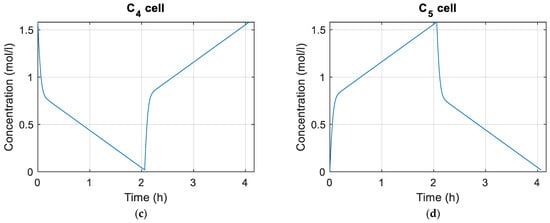
Figure 11.
(a) Concentration of in the cells; (b) concentration of in the cells; (c) concentration of in the cells; (d) concentration of in the cells.
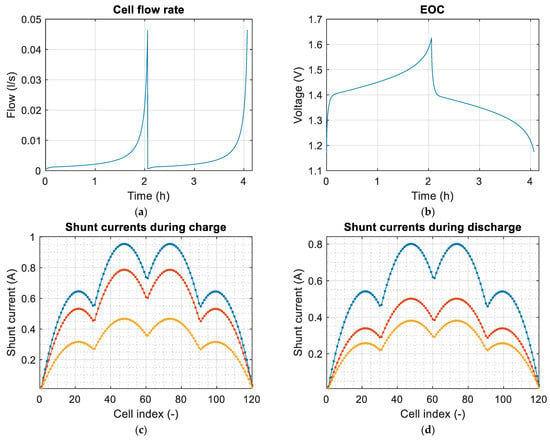
Figure 12.
(a) Electrolyte flow rate of the cells during the simulation. The flow rate was calculated with Equation (89); (b) the open circuit voltage of the cells during the simulation; (c) maximum, average, and minimum shunt currents during the simulation of the charge; (d) maximum, average, and minimum shunt currents during the simulation of the discharge. (Blue for maximum currents, red for average currents, and yellow for minimum currents).
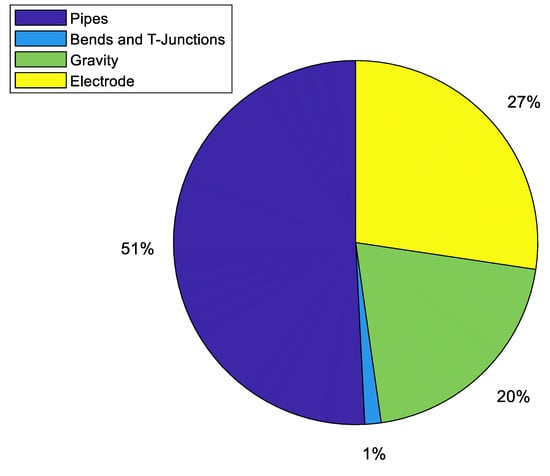
Figure 13.
Distribution of the average pressure losses relative to the entire simulation.
Table 13 shows the distribution of the average pressure losses differentiating the different causes.

Table 13.
Distribution of the average pressure losses by cause. Note that the data are only for the hydraulic circuit connecting one of the tanks.
It can be observed that the pressure losses in trunks and manifolds are negligible compared to those of the branches and channels. This is due to the diameters of these pipes. Table 14 shows averages of the round-trip efficiency losses in shunt and pressure from the simulation.

Table 14.
Average round-trip efficiency losses in the simulation.
The concentrations and correspond to the concentrations of the electrolyte coming from the negative tank, while the and are those of the electrolyte from the positive tank. This can be extrapolated to the concentrations of the battery cells.
Figure 11 shows the concentrations of the different species for the battery cells during charging and discharging. It must be taken into account that for this work it has been considered that the same flow reaches the cells and that the concentration of the species is the same for all of them. If these considerations were not made, the vanadium concentrations of the cells would be different.
The simulation begins by charging the battery and after charging to 100%, the discharge process begins, which ends when the battery has been completely discharged. As can be seen in Figure 10 and Figure 11, the charging and discharging processes for the parameters with which we are working last approximately two hours.
In Figure 12a it can be seen how the flow rate of the cells increases exponentially as the loading and unloading takes place. This is due to how the flow calculation is achieved in Equation (82). The smaller the amount of reactant, the greater the flow rate must be. Figure 12c,d show the shunt currents associating them with the battery cells. It must be taken into account that the shunt currents do not circulate through the cells, but they can be associated with them using Equation (72). The shunt currents are greater in the cells positioned in the center of the stacks, and at the stack level, it is in the group of cells in the central stacks where the higher shunt currents occur. This coincides with what is reported in most articles in which shunt currents are studied.
Figure 13 shows the data shown in Table 13 in group and percentage terms. Although the contribution of the primary pressure losses of the pipes makes up more than half of the total pressure losses, the losses caused by the electrodes and by the difference in height between the surface of the electrolyte in the tank with the outlet trunks should not be disregarded.
6. Optimization Method
The PSO has been used to optimize the parameters. The PSO (particle swarm algorithm) is a metaheuristic optimization algorithm inspired by nature. Metaheuristic optimization algorithms are used for complex optimization problems, which typically have very large solution search spaces.
These algorithms are designed to obtain good solutions while keeping the execution time for solving the problem viable. Metaheuristic algorithms allow to solve problems that currently cannot be solved otherwise due to the computational costs, but on the other hand, it is not possible to ensure that the solution obtained is really the best solution to the problem. The search space is determined by the number of variables to be assigned a value and by the values they can take. The addition of restrictions to the optimization problem causes the possible values of the variables to be limited and, therefore, the search space is reduced.
Specifically, the PSO is an iterative algorithm that works with a population to which each individual is called a particle. Each particle is a candidate solution of the problem, understanding candidate solution as any feasible solution and being that such solution is a composition of a concrete and possible value of each of the variables to be determined. In each iteration of the algorithm the update of the particles is performed, changing the value of the components of these according to specific rules as well as the evaluation of the suitability of each of the updated particles to the problem.
The particles are evaluated through a mathematical function called the cost function (usually also called the fitness function) that has to be defined specific to the problem to be solved. This value is usually called the cost of the particle. It is an algorithm with memory, since during the given iterations for solving the problem, information is stored, such as what is the global optimal particle and its cost and the local optimal particles and their values. The information that is stored may vary depending on the version of the PSO and does not have to be limited exclusively to what has been mentioned.
The particle with the best cost is called the global optimal particle until the new update of the particles, where it can be maintained or replaced if in that update a particle with a better cost is obtained. The local optimal particles follow the same logic but are associated with a specific particle index, and the particles with the best cost are stored, taking into account the particles that have been generated in that index. These local optimum particles and the global optimum particle are used for the update of the particle population. Figure 14 shows the data structures that would be stored to solve a five-variable PSO problem with a population of 100 particles.
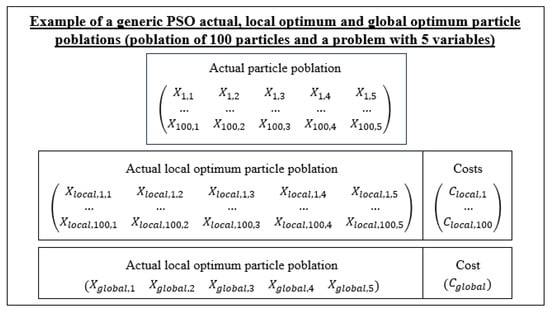
Figure 14.
Diagram of the data structures for the application of the PSO for the solution of a generic 5-variable problem.
At the end of the algorithm execution, the global optimal particle is the one to be considered as the optimal solution of the problem. In this work, the variables that have been taken into account for the formulation of the optimization problem are the diameters of the trunks, branches, and manifolds, the lengths of the channels and branches, the height and width of the channels, and the number of stacks in which the total number of cells of the battery will be distributed. For the number of stacks, the restriction shown in Equation (96) must be satisfied.
where is the number of stacks in the battery and is the total number of cells in the battery. Therefore, the character of the number of stacks variable is discrete. It is not necessary for the PSO to take into account the number of cells per stack as an independent variable, since by defining a total number of cells in the battery, the number of cells per stack is obtained from Equation (97).
where is the number of cells per stack. The diameters of the trunks, branches, and manifolds, the height, length, and width of the channels, and the length of the branches have been considered as discrete variables for this work. Since the original implementation of the PSO (see [43]) is designed for continuous variables, it has been necessary to adapt the PSO to work with discrete variables. The designed algorithm is based in part on the one shown in [44], where an implementation of a PSO algorithm that works with continuous and discrete variables simultaneously is shown.
Based on the idea of [44], the version of the designed discrete PSO replaces the concept of velocities from the original PSO with that of the probability of a variable taking one of its possible values. Each discrete variable has an associated probability matrix of columns and rows, where is the number of possible values that the variable can take and is the total number of particles with which we are working. Each row represents the probability that the variable has of taking each of its values, associated with a particular particle. For all variables, these matrices will have the same number of rows. However, as each variable has its own set of possible values, the number of columns does not have to be the same. Algorithm 1 shows the process of updating a particle and its associated probabilities for a variable.
| Algorithm 1. Discrete variable particle updating method. | |
| 1: | : actual local optimum particle actual global optimum particle, possible values of discrete variables, probability vectors of the variables associated with the particle probability change factor associated to particle exploration factor,: exploitation factor. |
| 2: | updated probability vectors of the variables for the particle. |
| 3: | Procedure: UpdateParticle |
| 4: | do |
| 5: | do |
| 6: | |
| 7: | |
| 8: | |
| 9: | end |
| 10: | Assign the value of according to the probability distribution of and |
| a random value between 0 and 1 | |
| 11: | end |
The probability matrices are initialized before starting the iterations according to Equation (98).
where is the possible number of values that the variable can take. Algorithm 2 shows the structure of the PSO optimization.
| Algorithm 2. PSO optimization method (initialization excluded). | |
| 1: | initial local optimum particles, initial global optimum particles, possible values of discrete variables, initialized probability matrices of the variables,probability change factor vector, : exploitation factor. |
| 2: | : cost of the global optimum particle. |
| 3: | Procedure: Optimization |
| 4: | for each iteration do |
| 5: | do |
| 6: | |
| 7: | then |
| 8: | |
| 9: | then |
| 10: | |
| 11: | end |
| 12: | end |
| 13: | end |
As shown in Equation (99), the cost function used for the optimization problem is the sum of the round-trip losses.
where corresponds to the average obtained during the entire simulation. It must be taken into account that for each particle and in each iteration of the algorithm a complete simulation has to be performed. Although the shunt currents model solves quickly, during a complete simulation it is run thousands of times. For this reason, it has been decided to run the optimization model in SOC sections, instead of in each simulation step, in order to significantly reduce the time spent on each particle. Algorithm 3 shows how the cost function designed for this problem works.
| Algorithm 3. Cost evaluation method. | |
| 1: | is a vector with nine components. The components of this vector are the following ones: trunk diameter, branch diameter, manifold diameter, channel height, channel width, channel length, branch length. All this data define a solution for our optimization. |
| 2: | Output: the cost of the particle solution. |
| 3: | Procedure: Simulation and Evaluation |
| 4: | Simulation of the models defined in Section 2, Section 3 and Section 4 and their linkage (Section 5) |
| 5: | Evaluation using the Equation (99) |
In this case, it has been decided to perform at least one run at each 2% SOC interval. It has been verified that by doing so, the average of does not change much with respect to a simulation in which the shunt currents model is run at each simulation step.
7. Optimization Results and Conclusions
In this section, the results related to the optimization of the design parameters of the pipes and distribution of cells in stacks will be presented. Table 15 shows the parameters relative to the PSO as well as the ranges of possible values that each of the variables of the problem can take.

Table 15.
Parameters of the PSO and ranges considered for the variables.
For the rest of the battery parameters, we have considered those shown in Section 5. The lengths of the trunks are determined by Equation (100), and the lengths of the manifolds have been restricted so that the sum does not exceed the sum of the lengths of the trunks.
Figure 15 shows the evolution of the cost of the global optimal particle during the iterations of the algorithm.
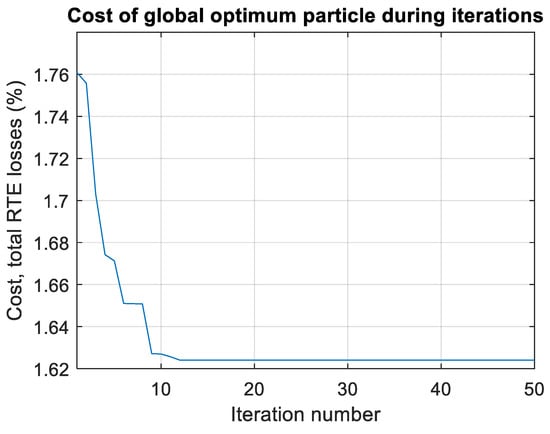
Figure 15.
Cost of global optimum particle during the PSO execution.
Note that the global optimum particle is the best particle that has been obtained up to the time at which each iteration is performed. This means that in the iterations in which the cost does not change, after updating the population of particles and evaluating the cost of each one, no particle has been found that improves what has been obtained up to that moment. From iteration 16 onwards, there is no improvement on what has been obtained so far. Although this may seem a failure of the algorithm, it is something quite typical and may be determined by the parameters of the exploitation and exploration factors, by the probability change factor, by the number of particles that compose the population, and by the random initialization of the population.
However, it must be taken into account that initially, in the random initialization of the particle population itself, a particle has been obtained whose value of the variables substantially improves the efficiency obtained from the example of Section 5, from having a total of RTE losses of 2.3759% to 1.7608%—this is already very important to take into account. Table 16 shows the evolution of the RTE losses during the algorithm iterations, broken down into shunt and pressure losses.

Table 16.
Evolution of RTE losses during algorithm iterations.
Analyzing the results of the table up to iteration 16 (being that after that iteration there are no changes), some interesting things can be observed. During the iterations of the algorithm, many tradeoffs occur, improving one of the RTEs and worsening the other (Figure 16 is provided to clearly see this fact). However, it is believed that this is not due to anything special, and that it happens simply due to the dynamics of the algorithm; moreover, it is likely that in other executions of the algorithm, depending on the random initialization of the particles, this particularity may not appear.
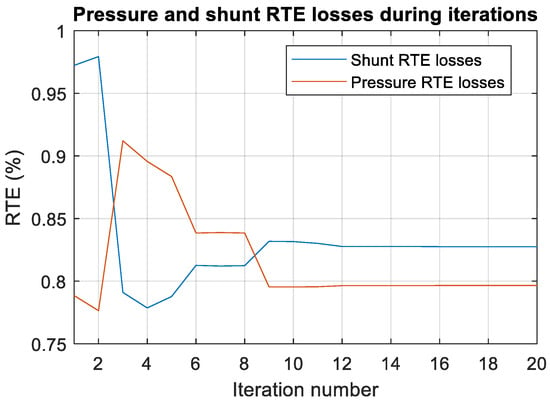
Figure 16.
Global optimum pressure and shunt RTE losses during the iterations of the PSO algorithm (until iteration 20, since from iteration 16 to 50 there is no improvement in the global optimum).
Table 17 shows the global optimum result that has been given in this execution of the PSO.

Table 17.
Optimum solution of the optimization problem.
Although, as has been commented several times, different executions of the algorithm can give different solutions, and the solution obtained for the article is not guaranteed to be the best obtainable, we have seen an improvement with respect to other articles in which we start from preestablished designs and compare their efficiency.
Author Contributions
Conceptualization, D.A.I.-G. and U.F.-G.; methodology, J.O. and A.Z.; software, E.Z. and U.F.-G.; validation, D.A.I.-G. and A.Z.; formal analysis, D.A.I.-G., J.O. and U.F.-G.; investigation, E.Z., J.O., and U.F.-G.; resources, E.Z. and A.Z.; data curation, E.Z.; writing—review and editing, D.A.I.-G. and U.F.-G.; visualization, J.O.; supervision, E.Z.; project administration, E.Z.; funding acquisition, E.Z. and U.F.-G. All authors have read and agreed to the published version of the manuscript.
Funding
This work has been partially supported by the Government of the Basque Country, program: Elkartek CICe2022; grant no.: KK-2022/00043. E. Z. and U.F.-G. were supported by the Mobility Lab Foundation, a governmental organization of the Provincial Council of Araba and the local council of Vitoria-Gasteiz.
Data Availability Statement
All data generated in the current study are available upon reasonable request to the corresponding authors.
Acknowledgments
The authors are grateful for the support provided by SGIker of UPV/EHU. This research was developed under the frame of the Joint Research Laboratory on Offshore Renewable Energy (JRL-ORE).
Conflicts of Interest
Javier Olarte is employed by the Centre for Cooperative Research on Alternative Energies (CIC EnergiGUNE). The remaining authors declare that the research was conducted in the absence of any commercial or financial relationships that could be construed as potential conflicts of interest.
References
- Ajanovic, A. Biofuels versus Food Production: Does Biofuels Production Increase Food Prices? Energy 2011, 36, 2070–2076. [Google Scholar] [CrossRef]
- Ritchie, H.; Roser, M.; Rosado, P. Renewable Energy. Our World Data 2024. Available online: https://ourworldindata.org/renewable-energy (accessed on 16 May 2024).
- Aluko, A.; Knight, A. A Review on Vanadium Redox Flow Battery Storage Systems for Large-Scale Power Systems Application. IEEE Access 2023, 11, 13773–13793. [Google Scholar] [CrossRef]
- Koohi-Fayegh, S.; Rosen, M.A. A Review of Energy Storage Types, Applications and Recent Developments. J. Energy Storage 2020, 27, 101047. [Google Scholar] [CrossRef]
- Clemente, A.; Costa-Castelló, R. Redox Flow Batteries: A Literature Review Oriented to Automatic Control. Energies 2020, 13, 4514. [Google Scholar] [CrossRef]
- Guarnieri, M.; Mattavelli, P.; Petrone, G.; Spagnuolo, G. Vanadium Redox Flow Batteries: Potentials and Challenges of an Emerging Storage Technology. IEEE Ind. Electron. Mag. 2016, 10, 20–31. [Google Scholar] [CrossRef]
- Weber, S.; Peters, J.F.; Baumann, M.; Weil, M. Life Cycle Assessment of a Vanadium Redox Flow Battery. Environ. Sci. Technol. 2018, 52, 10864–10873. [Google Scholar] [CrossRef] [PubMed]
- Pugach, M.; Vyshinsky, V.; Bischi, A. Energy Efficiency Analysis for a Kilo-Watt Class Vanadium Redox Flow Battery System. Appl. Energy 2019, 253, 113533. [Google Scholar] [CrossRef]
- Zhang, C.; Zhao, T.S.; Xu, Q.; An, L.; Zhao, G. Effects of Operating Temperature on the Performance of Vanadium Redox Flow Batteries. Appl. Energy 2015, 155, 349–353. [Google Scholar] [CrossRef]
- Xiong, B.; Zhao, J.; Tseng, K.J.; Skyllas-Kazacos, M.; Lim, T.M.; Zhang, Y. Thermal Hydraulic Behavior and Efficiency Analysis of an All-Vanadium Redox Flow Battery. J. Power Sources 2013, 242, 314–324. [Google Scholar] [CrossRef]
- Kumar, S.; Jayanti, S. Effect of Flow Field on the Performance of an All-Vanadium Redox Flow Battery. J. Power Sources 2016, 307, 782–787. [Google Scholar] [CrossRef]
- Xu, Q.; Zhao, T.S.; Leung, P.K. Numerical Investigations of Flow Field Designs for Vanadium Redox Flow Batteries. Appl. Energy 2013, 105, 47–56. [Google Scholar] [CrossRef]
- Tang, A.; Bao, J.; Skyllas-Kazacos, M. Studies on Pressure Losses and Flow Rate Optimization in Vanadium Redox Flow Battery. J. Power Sources 2014, 248, 154–162. [Google Scholar] [CrossRef]
- Chou, H.-W.; Chang, F.-Z.; Wei, H.-J.; Singh, B.; Arpornwichanop, A.; Jienkulsawad, P.; Chou, Y.-S.; Chen, Y.-S. Locating Shunt Currents in a Multistack System of All-Vanadium Redox Flow Batteries. ACS Sustain. Chem. Eng. 2021, 9, 4648–4659. [Google Scholar] [CrossRef]
- Ye, Q.; Hu, J.; Cheng, P.; Ma, Z. Design Trade-Offs among Shunt Current, Pumping Loss and Compactness in the Piping System of a Multi-Stack Vanadium Flow Battery. J. Power Sources 2015, 296, 352–364. [Google Scholar] [CrossRef]
- Wandschneider, F.T.; Röhm, S.; Fischer, P.; Pinkwart, K.; Tübke, J.; Nirschl, H. A Multi-Stack Simulation of Shunt Currents in Vanadium Redox Flow Batteries. J. Power Sources 2014, 261, 64–74. [Google Scholar] [CrossRef]
- Glazkov, A.; Pichugov, R.; Loktionov, P.; Konev, D.; Tolstel, D.; Petrov, M.; Antipov, A.; Vorotyntsev, M.A. Current Distribution in the Discharge Unit of a 10-Cell Vanadium Redox Flow Battery: Comparison of the Computational Model with Experiment. Membranes 2022, 12, 1167. [Google Scholar] [CrossRef]
- Delgado, N.; Monteiro, A.; Cruz, J.; Bentien, A.; Mendes, A. Shunt Currents in Vanadium Redox Flow Batteries—A Parametric and Optimization Study. Electrochim. Acta 2021, 403, 139667. [Google Scholar] [CrossRef]
- Zhao, X.; Kim, Y.-B.; Jung, S. Shunt Current Analysis of Vanadium Redox Flow Battery System with Multi-Stack Connections. J. Energy Storage 2023, 73, 109233. [Google Scholar] [CrossRef]
- Li, Y.; Skyllas-Kazacos, M.; Bao, J. A Dynamic Plug Flow Reactor Model for a Vanadium Redox Flow Battery Cell. J. Power Sources 2016, 311, 57–67. [Google Scholar] [CrossRef]
- König, S.; Suriyah, M.R.; Leibfried, T. Model Based Examination on Influence of Stack Series Connection and Pipe Diameters on Efficiency of Vanadium Redox Flow Batteries under Consideration of Shunt Currents. J. Power Sources 2015, 281, 272–284. [Google Scholar] [CrossRef]
- Trovò, A.; Di Noto, V.; Epoupa Mengou, J.; Gamabaro, C.; Guarnieri, M. Fast Response of kW-Class Vanadium Redox Flow Batteries. IEEE Trans. Sustain. Energy 2021, 12, 2413–2422. [Google Scholar] [CrossRef]
- Puleston, T.; Clemente, A.; Costa-Castelló, R.; Serra, M. Modelling and Estimation of Vanadium Redox Flow Batteries: A Review. Batteries 2022, 8, 121. [Google Scholar] [CrossRef]
- Khaki, B.; Das, P. An Equivalent Circuit Model for Vanadium Redox Batteries via Hybrid Extended Kalman Filter and Particle Filter Methods. J. Energy Storage 2021, 39, 102587. [Google Scholar] [CrossRef]
- Murthy, S.K.; Sharma, A.K.; Choo, C.; Birgersson, E. Analysis of Concentration Overpotential in an All-Vanadium Redox Flow Battery. J. Electrochem. Soc. 2018, 165, A1746. [Google Scholar] [CrossRef]
- Kurilovich, A.A.; Trovò, A.; Pugach, M.; Stevenson, K.J.; Guarnieri, M. Prospect of Modeling Industrial Scale Flow Batteries—From Experimental Data to Accurate Overpotential Identification. Renew. Sustain. Energy Rev. 2022, 167, 112559. [Google Scholar] [CrossRef]
- Trovò, A.; Picano, F.; Guarnieri, M. Comparison of Energy Losses in a 9 kW Vanadium Redox Flow Battery. J. Power Sources 2019, 440, 227144. [Google Scholar] [CrossRef]
- Kaminski, E.A.; Savinell, R.F. A Technique for Calculating Shunt Leakage and Cell Currents in Bipolar Stacks Having Divided or Undivided Cells. J. Electrochem. Soc. 1983, 130, 1103. [Google Scholar] [CrossRef]
- Darling, R.M.; Shiau, H.-S.; Weber, A.Z.; Perry, M.L. The Relationship between Shunt Currents and Edge Corrosion in Flow Batteries. J. Electrochem. Soc. 2017, 164, E3081. [Google Scholar] [CrossRef]
- Tang, A.; McCann, J.; Bao, J.; Skyllas-Kazacos, M. Investigation of the Effect of Shunt Current on Battery Efficiency and Stack Temperature in Vanadium Redox Flow Battery. J. Power Sources 2013, 242, 349–356. [Google Scholar] [CrossRef]
- Prokopius, P.R. Model for Calculating Electrolytic Shunt Path Losses in Large Electrochemical Energy Conversion Systems; NASA: Washington, DC, USA, 1976.
- Trovò, A.; Picano, F.; Guarnieri, M. Maximizing Vanadium Redox Flow Battery Efficiency: Strategies of Flow Rate Control. In Proceedings of the 2019 IEEE 28th International Symposium on Industrial Electronics (ISIE), Vancouver, BC, Canada, 12–14 June 2019; pp. 1977–1982. [Google Scholar]
- Chen, Y.-S.; Ho, S.-Y.; Chou, H.-W.; Wei, H.-J. Modeling the Effect of Shunt Current on the Charge Transfer Efficiency of an All-Vanadium Redox Flow Battery. J. Power Sources 2018, 390, 168–175. [Google Scholar] [CrossRef]
- Burney, H.S.; White, R.E. Predicting Shunt Currents in Stacks of Bipolar Plate Cells with Conducting Manifolds. J. Electrochem. Soc. 1988, 135, 1609. [Google Scholar] [CrossRef]
- Swamee, P.K.; Jain, A.K. Explicit Equations for Pipe-Flow Problems. J. Hydraul. Div. 1976, 102, 657–664. [Google Scholar] [CrossRef]
- Romeo, E.; Royo, C.; Monzón, A. Improved Explicit Equations for Estimation of the Friction Factor in Rough and Smooth Pipes. Chem. Eng. J. 2002, 86, 369–374. [Google Scholar] [CrossRef]
- Sonnad, J.R.; Goudar, C.T. Turbulent Flow Friction Factor Calculation Using a Mathematically Exact Alternative to the Colebrook–White Equation. J. Hydraul. Eng. 2006, 132, 863–867. [Google Scholar] [CrossRef]
- Churchill, S.W. Friction Factor Equation Spans All Fluid Flow Regimes. Chem. Eng. 1977, 84, 91–92. [Google Scholar]
- Co, C. Flow of Fluids Through Valves, Fittings, and Pipe; Crane Company: Stamford, CT, USA, 1988. [Google Scholar]
- Hilding, K. Pressure Losses for Fluid Flow in 90° Pipe Bends. J. Res. Natl. Bur. Stand. 1938, 21, 1–18. [Google Scholar]
- Jayanti, S. Bends, Flow and Pressure Drop in. In Thermopedia; Begel House Inc.: Danbury, CT, USA, 2011; ISBN 978-1-56700-456-4. [Google Scholar]
- Kumar, S.; Jayanti, S. Effect of Electrode Intrusion on Pressure Drop and Electrochemical Performance of an All-Vanadium Redox Flow Battery. J. Power Sources 2017, 360, 548–558. [Google Scholar] [CrossRef]
- Kennedy, J.; Eberhart, R. Particle Swarm Optimization. In Proceedings of the 1995 IEEE International Conference on Neural Networks Proceedings, Perth, WA, Australia, 27 November–1 December 1995; Volume 1–6, pp. 1942–1948. [Google Scholar] [CrossRef]
- Wang, F.; Zhang, H.; Zhou, A. A Particle Swarm Optimization Algorithm for Mixed-Variable Optimization Problems. Swarm Evol. Comput. 2021, 60, 100808. [Google Scholar] [CrossRef]
Disclaimer/Publisher’s Note: The statements, opinions and data contained in all publications are solely those of the individual author(s) and contributor(s) and not of MDPI and/or the editor(s). MDPI and/or the editor(s) disclaim responsibility for any injury to people or property resulting from any ideas, methods, instructions or products referred to in the content. |
© 2024 by the authors. Licensee MDPI, Basel, Switzerland. This article is an open access article distributed under the terms and conditions of the Creative Commons Attribution (CC BY) license (https://creativecommons.org/licenses/by/4.0/).