Article

A Novel Reaction Rate Parametrization Method for Lithium-Ion Battery Electrochemical Modelling

1
Faculté des Sciences d’Orsay, Université Paris-Saclay, ICMMO/ERIEE, UMR CNRS 8182, 17 Av. des Sciences, 91400 Orsay, France
2
Stellantis, 212 Boulevard Pelletier, 78955 Carrières-sous-Poissy, France
3
Kurybees, 6 Rue d’Armaillé, 75017 Paris, France
*
Author to whom correspondence should be addressed.
Batteries 2024, 10(6), 205; https://doi.org/10.3390/batteries10060205
Submission received: 8 January 2024 / Revised: 28 May 2024 / Accepted: 5 June 2024 / Published: 14 June 2024
(This article belongs to the Special Issue Modeling, Reliability and Health Management of Lithium-Ion Batteries)

Abstract

:
To meet the ever-growing worldwide electric vehicle demand, the development of advanced generations of lithium-ion batteries is required. To this end, modelling is one of the pillars for the innovation process. However, modelling batteries containing a large number of different mechanisms occurring at different scales remains a field of research that does not provide consensus for each particular model or approach. Parametrization as part of the modelling process appears to be one of the issues when it comes to building a high-fidelity model of a target cell. In this paper, a particular parameter identification is therefore discussed. Indeed, even if Butler–Volmer is a well-known equation in the electrochemistry field, identification of its reaction rate constant or exchange current density parameters is lacking in the literature. Thus, we discuss the process described in the literature and propose a new protocol that expects to overcome certain difficulties whereas the hypothesis of calculation and measurement maintains high sensitivity.

1. Introduction

At present, the automotive industry is undergoing an electric transformation with a constant increasing number of battery electric vehicle (BEVs) available on the market. The invention and rapid commercialization of the lithium-ion cell in 1991 by Sony brought decent energy density, safety, and lifetime expectancy to meet cars’ actual technological requirements. Nevertheless, to ensure optimized usage of lithium-ion technology, and to improve its performance, the development of electrochemical, thermal, or mechanical models or a combination of all of them is necessary to better understand internal mechanisms upon usage. Up to now, electric equivalent circuit (EEC) models have been used to ensure battery management system (BMS) performance in cell control [1,2]. An EEC consists of mathematical models and does not reliably represent the physico-chemical mechanisms occurring in the battery cell. Due to many approximations, a deeper, more accurate understanding is not easy. Indeed, a more robust physical model is necessary to comprehensively explore the evolution of the reactions taking place within the battery cell.
The most widely studied numerical model is the so-called “Pseudo 2D Model”, which is inspired by Newman’s porous electrode model. This model has been the basis of numerous forms of industrial as well as academic modelling software [3,4,5,6,7].

2. Model Presentation

2.1. Model Types

This section aims to describe the different physical models used to fit the targeted parameters. A review of other papers led to the identification of two different families of existing battery models [8,9] listed below:
Electrochemical Models—These models are often based on Newman’s model [10,11], and aim to explicitly describe the major physical and chemical phenomena occurring in the cell. Thus, a wide range of electrochemical models exist, from the simplest single particle models (SPMs), considering each electrode as a single spherical particle [12,13], to more sophisticated pseudo-2D (P2D) models [3,6,14,15], taking into account the thickness of the electrode.
Electrochemical models can be improved by considering geometrical aspects, such as the active material particle size, the form factor, and their relative distribution, including the porosity and tortuosity of the electrode. Moreover, secondary elements’ dimensions and physical characteristics such as jellyrolls, casing, and bus bars also contribute to the actual behavior of the cell. The models can also be enhanced through thermal add-ons by considering temperature impacts on the system, directly or indirectly, and external thermal conditions. Moreover, the model can include mechanical aspects in various ways such as mechanical strain at macro or micro scales. Finally, an aging mechanism could be added considering side effects and long-term degradation mechanisms such as the growth of the solid-electrolyte interphase (SEI), negative effects on battery function, or mechanical strain and stress [16,17,18].
Molecular and Atomistic Models—These are more sophisticated models that describe the interactions between the different elements of the cell in a true three-dimensional region through a tomography scan or molecular-level description [19,20]. Despite being theoretically the most accurate models, they are highly demanding in terms of feeding parameters and calculation time.
In the following sections, the chosen model belongs to the electrochemical model type.

2.2. Chosen Model Description

The model used in this paper is taken from [3,14,21] for P2D equations and from [13,22] for SPM equations. This paper will not develop the entire equation set further since the latter cited papers are clearly describing all of them. In the following sections, only the Butler–Volmer equation will be highlighted, and the chosen parameter conventions will be defined. Then, a brief literature review concerning parameter identification will be described. Finally, our protocol approach will be developed and discussed with regard to the literature results.
Our model aims to describe the main processes taking place inside a battery cell: at both current collectors, at the positive and negative electrodes, and within the separator and the electrolyte. It is named pseudo-2D as it considers dynamics in the x direction (as illustrated in Figure 1), as well as along the radius r of the spherical equivalent particles standing for the active materials present inside the electrodes. This section presents the different equations related to ion concentration, charge flux, and electric potentials occurring in a Li-ion cell while operating through the following standard electrochemical processes.
At the negative insertion electrode: < L i M >   d i s c h a r g e   < L i 1 x M > +   x L i + + x e .
During discharge, the intercalation compound < L i M > at the negative electrode is oxidized (loss of electron), leading, for electroneutrality of the solid, to a parallel de-intercalation of lithium ions (which consequently decreases the lithium concentration in the negative solid phase, from c s ,   n ,   m a x to c s ,   n ), with a reaction rate constant value of kn at an overpotential of ηn.
At the positive insertion electrode: < L i y M > +   x L i + + x e   d i s c h a r g e   < L i y + x M > .
During discharge, the intercalation compound < L i y M > at the positive electrode is reduced (gain of electrons), leading, for the electroneutrality of the solid, to the parallel intercalation of lithium ions (which increases the lithium concentration in the positive solid phase from c s ,   p to c s ,   p ,   m a x ), with a reaction rate constant value of kp at an overpotential of ηp.
In the liquid electrolyte (through separator): L i + n d i s c h a r g e L i + p .
During discharge, the lithium ions in the liquid electrolyte phase (embedded inside the separator) move from the negative side to the positive side for overall charge/matter compensation (so that the lithium concentration in the electrolyte remains steadily equal to the pristine one, c e ).
All of these latter processes are electrochemically reversible (as long as we are talking about a rechargeable battery) and will accordingly lead to opposite reactions during the charge of the cell.
Butler–Volmer law is a well-known equation in the electrochemistry field. In a battery model, it plays a crucial role that links charge carrier flow, concentration, and electrical potential. It makes the link between voltage and current inside the cell, when electrochemical reactions are taking place at each electrode, as different kinetic limitations can occur: charge transfer (redox reaction rate constant), mass transfer (ion mobility), and ohmic drop (internal resistance), with either electronic or ionic effects.
The pore wall ionic flux J i , for i { n , p } (for negative and positive electrodes, respectively), which appears in the boundary conditions of the solid diffusion equations, is determined by
J i = k i c s , i , m a x c e α c , i z i , s u r f α a , i 1 z i , s u r f α c , i e α a , i F R T η i e α c , i F R T η i
η i = Φ s , i Φ e , i U i
where, in (1), k i is the reaction rate constant, c s , i , m a x is the saturation concentration, z i , s u r f is the relative ion concentration on the surface of particles given by z i , s u r f = c s , i c s , i , m a x , c e is the electrolyte ion concentration, F is the Faraday constant, T is the temperature, and R is the ideal gas constant. In (2), U i is the open circuit potential (OCP) of the electrode i , Φ s and Φ e are the potentials of the solid phase and the electrolyte, respectively, and η is the resulting overpotential. All symbols are listed with their respective unit in Table 1.
The exponents α c , i and α a , i correspond to the cathodic and anodic charge transfer coefficients of the electrode i , respectively. These parameters stand for the fraction of the interfacial potential at the electrode/electrolyte interface that helps in lowering the free energy barrier for the electrochemical reaction.
In the literature, it is commonly assumed that these charge transfer coefficients are equal to 0.5; the reason is that this considerably simplifies Equation (1) with a reasonable hypothesis [23,24].
Equation (2) becomes Equation (3):
J i = k i   c s , i , m a x   c e   z i , s u r f   1 z i , s u r f     e F 2 R T η i e F 2 R T η i  
On the other hand,   I i = J i F S i with I i being the current applied to the electrode i and S i being the geometric surface of the active material on the electrode i .
Also, by defining m i = I i F S i k i C s , i , m a x c e z i , s u r f 1 z i , s u r f , Equation (3) thus becomes Equation (4)
m i = 2 2 e F 2 R T Φ s , i Φ e , i U i e F 2 R T Φ s , i Φ e , i U i  
It can be converted to Equation (5) using the hyperbolic sinus definition:
m i = 2 s i n h F 2 R T Φ s , i Φ e , i U i
Then, reversing Equation (5) using a r c s i n h , the Butler–Volmer equation can be rewritten as Equation (6) and can be found under the same form factor in [13,22].
2 R T F l n m i 2 + m i 2 4 + 1 = Φ s , i Φ e , i U i

2.3. Coefficient Convention and Units

By decomposing the different terms of the Butler–Volmer (BV) Equation (3), three different types of terms appear:
  • Variables: These represent the actual state of a physical quantity such as J i —the ionic flux, z i , s u r f —the normalized ion concentration on the surface of a particle, η i —the overpotential, T —the temperature, and c e —the electrolyte concentration (for P2D models).
  • Constants: F is the Faraday constant, R is the ideal gas constant, and c s , i , m a x is the electrode maximum concentration that is known via material selection.
  • Coefficient: k i is the reaction rate constant.
Thus, when it comes to calibrating the BV equation, k i is the prominent kinetic parameter to be identified. Nevertheless, in the literature, there is no consensus on the calibration of the BV equation. Indeed, we can find different choices to simplify the identification of this parameter:
Parameter 
k i : k i  is the initial and only physically meaningful form as it is used in Equation (3).   k i  is given in   [ m 2.5 m o l 0.5 s 1 ] .
Parameter 
k 0 , i : k 0 , i  is defined according to the following expression   k 0 , i = k i c s , i , m a x c e . This expression mostly brings better physical understanding since it is given in   m o l   m 2 s 1 .
Parameter 
i 0 : i 0  is defined according to the following expression   i 0 = k 0 , i F . This expression mostly brings measurable quantities since it is given in   [ A   m 2 ] . This parameter refers to the exchange current density, which is the current at zero overpotential. The exchange current density reflects intrinsic rates of electron transfer between redox species at the electrode interface and depends on the nature of the redox reaction, the chemical nature of the electrode, and its surface properties (for example, roughness).

3. Experimental Protocol

In order to establish a suitable database for this work, it was necessary to dispose of multiple half-cells of each electrode versus metallic lithium as the counter electrode of the target full cell. As half-cells tend to degrade significantly faster, the less they are used for different tests, the better the results are. In other words, the more half-cells used, the easier it is to remove the aging mechanisms.
Then, the idea is to apply galvanostatic intermittent titration technique (GITT) pulses at different C-rates and under various thermal conditions to observe the voltage response. As shown in the following section, choosing relatively small C-rates (<0.5C) and relatively high C-rates (>3C) offers better results compared to this method.
Iterating these measurements at various states of lithiation (SoL) creates more robust results, but theoretically, measurements at SoL of 0.5 only are sufficient. The state of lithiation stands for the ratio of ion concentration inserted into the electrode compared to the maximum theoretical concentration that the electrode is able to accept.

4. State of the Art of the Identification Methods for the BV Kinetic Parameter

First of all, note that k i and its derivative expressions are considered as highly sensitive [25] in the model and consequently require a particular focus for their accurate identification.
Taking advantage of the rapid time slot when BV is predominant before the appearance of diffusion phenomena after a pulse of current has been applied to the cell, Namor et al. [22] transformed the SPM by gathering parameters into groups that allow for non-intrusive parameter identification. However, even if the transformation of the model does not affect its accuracy, as mentioned in the above paper, the identification method still suffers from multiple indiscernible causalities of the voltage drop. Indeed, the kinetics k i and the equivalent ohmic resistance that represents the combination of all non-defined ohmic contributions to the cell, such as electrolytes, solid phase conductivities, current collectors, and connection resistances, implies instantaneous voltage drop when the current is applied.
Thus, minimizing the apparent error of voltage drop, while applying pulses of current, by fitting parameters can unfortunately lead to local minima, particularly when it comes to fitting multiple parameters at once.
In [26], the equation was also transformed to advantageously isolate the exchange current density parameter. The authors used a multiple pulse database to figure out values in a trend law.
First, taking the BV simplified form from Equation (3) and introducing the aforementioned equivalent forms gives Equation (7):
I S = 2 i 0 z 1 z     s i n h F 2 R T η
After adding the limited development of the s i n h term for η < 0.2 V , the former equation turns into Equation (8)
I S = 2 i 0 z 1 z   F 2 R T η
Using the hypothesis that pulses induced a voltage drop at 50% SoL, z = 0.5 simplifies the final expression as Equation (9), where the overpotential is the measured voltage drop ∆V.
I S = i 0 F 2 R T V
When the applied current density is plotted with respect to the voltage drop for different conditions for current and temperature (Figure 2), it is thus possible to identify a linear trend in the small voltage drop window. Using a linear regression for those points, the current exchange density   i 0   could be identified, as shown in Equation (10):
i 0 = a × 2 R T F
Applying this method, on multiple data sets, especially at different temperatures, allows us to plot an Arrhenius law.
Figure 2 is divided into two lines, each one of them representing an electrode. Then, three steps are shown; the first column (Figure 2a,d) displays the current density I S with respect to the voltage drop V from the pulse data set. The slope near 0 V corresponds to the exchange current density i 0 . The second column (Figure 2b,e) displays the results of this identification with respect to temperature, with each point corresponding to each curve from the previous figure. Then, the last column (Figure 2c,f) displays the Arrhenius law fitting of the results. The left column accounts for positive electrode, and the right column accounts for negative electrode.

5. Method

In the latter method, one of the main issues remains the lack of consideration of ohmic resistance in order to implement an algorithm, in addition to the needed parameters, namely the electrode active surface area m 2 g 1 , the sample surface m 2 , the electrolyte concentration m o l   m 3 , and the SoL at 50%.
Adding a resistive term, through Ohm’s law, in order to consider an ohmic contribution R c e l l to the cell that will also contribute to an instantaneous voltage drop when the current pulse is applied, leads to Equation (11):
V = R c e l l I + 2 R T F ln m i + m i 2 + 4 2   w i t h   m i = I S i F R i c i , m a x k i z 1 z
With this particular representation, it is now possible to combine the strategies of both methods presented above. Actually, since the voltage drop on a half-cell is now defined with two contributions, one electrochemical source and one ohmic source, it is then possible to apply simultaneous identification.
For this identification, by minimizing an error, the two terms should impact the voltage drop with uncorrelated trends to avoid local minima. In the manner that Equation (11) is written, the two terms have noticeably different trends with regard to the applied current in isothermal conditions. One is indeed linear while the other one follows a logarithmic tendency. The method developed by [26] makes its contribution here to the method proposed in this paper.
Figure 3 displays the tendency of the two terms appearing in Equation (11) with respect to the applied current. In Equation (11), the first term (in orange in Figure 3) corresponds to Ohm’s law, and in red, the electrochemical overpotential derived from the BV equation is shown. The sum of both is displayed in blue. The scale is arbitrary.
Note that Ohm’s law is predominant at higher C-rates whereas the electrochemical overpotential is dominant at lower C-rates. These two distinguished predominancies allow for a decorrelation of their own contribution to the voltage drop.
Tuning these two parameters manually shows that R c e l l induces a change in the slope of the ohmic curve (orange), whereas k i seems to induce a vertical translation on the overpotential curve (red). Thanks to these well-separated effects of both parameters and consequently the effects on the terms of Equation (11), it becomes possible to implement a minimization routine algorithm on MATLAB® (Version R2023a) with limited risk of converging into a local minimum. Figure 4 presents the fitting results of Equation (11) with the experimental data obtained (the error in measurement, <0.5%, is within the thickness of the dots) by plotting the voltage drop with respect to the applied C-rate for different temperatures. Applying this fitting method, with both positive and negative currents, and for each electrode (positive vs. Li+/Li and negative vs. Li+/Li) brings a possible identification of the couple R c e l l , k i at a given temperature.
For our method to be particularly efficient, it is recommended to execute a test plan for half-cells with greater C-rate discretization at low currents (<1C) and high currents (>4C) in order to exacerbate the predominance of each term in Equation (11) and help the algorithm to converge more rapidly with better robustness.
It has to be noted that, since the experiments might be conducted on half-cells, the identified resistance within this method is not representative of a full cell because it includes conductivities corresponding to the experimental setup (such as EL-CELL in this work). Nevertheless, the trend with temperature is still meaningful. Indeed, it would be a great support to our approach to identify an exponential decrease in internal resistance with the increase in temperature.
Figure 5 shows the results of the study. Identification was conducted at −10 °C, 0 °C, 15 °C, 25 °C, and 45 °C in order to fit an Arrhenius law to model the thermal dependency of the BV parameter with temperature. For better robustness, it is also recommended here to identify the parameter at different SoL, since it is beneficial to know with accuracy the SoL of a cell. Nevertheless, it is possible to overcome SoL uncertainties by a variable change in the equation: K i = k i   z 1 z , then identifying K i instead of k i and recovering the actual reaction rate constant by using the variable change equation.
In certain conditions of SoL and temperature, some pulses could induce biased data by crossing voltage boundaries. A checking routine must then be implemented beforehand to ensure that one is dealing with relevant data.
Arrhenius law could also be expressed using a reference exchange current density at a given temperature. Equation (12) thus allows one to display a comparison with the literature identification, as presented in Figure 6.
i 0 = i 0 , r e f e E a R 1 T r e f 1 T   k 0 = k 0 , r e f e E a R 1 T r e f 1 T   k i = k i , r e f e E a R 1 T r e f 1 T
Figure 5 represents each SoL point identification, with the surface color of the max–min range of data as follows: in pink—resistance and in blue—the BV parameter. The dotted line represents the mean values.
As expected, resistance decreases exponentially with increasing temperature, and the current exchange density increases exponentially. In the literature, it is commonly assumed that the BV parameter follows an Arrhenius law with respect to temperature. Arrhenius law is valid only in a certain temperature range since the BV parameter cannot increase indefinitely.
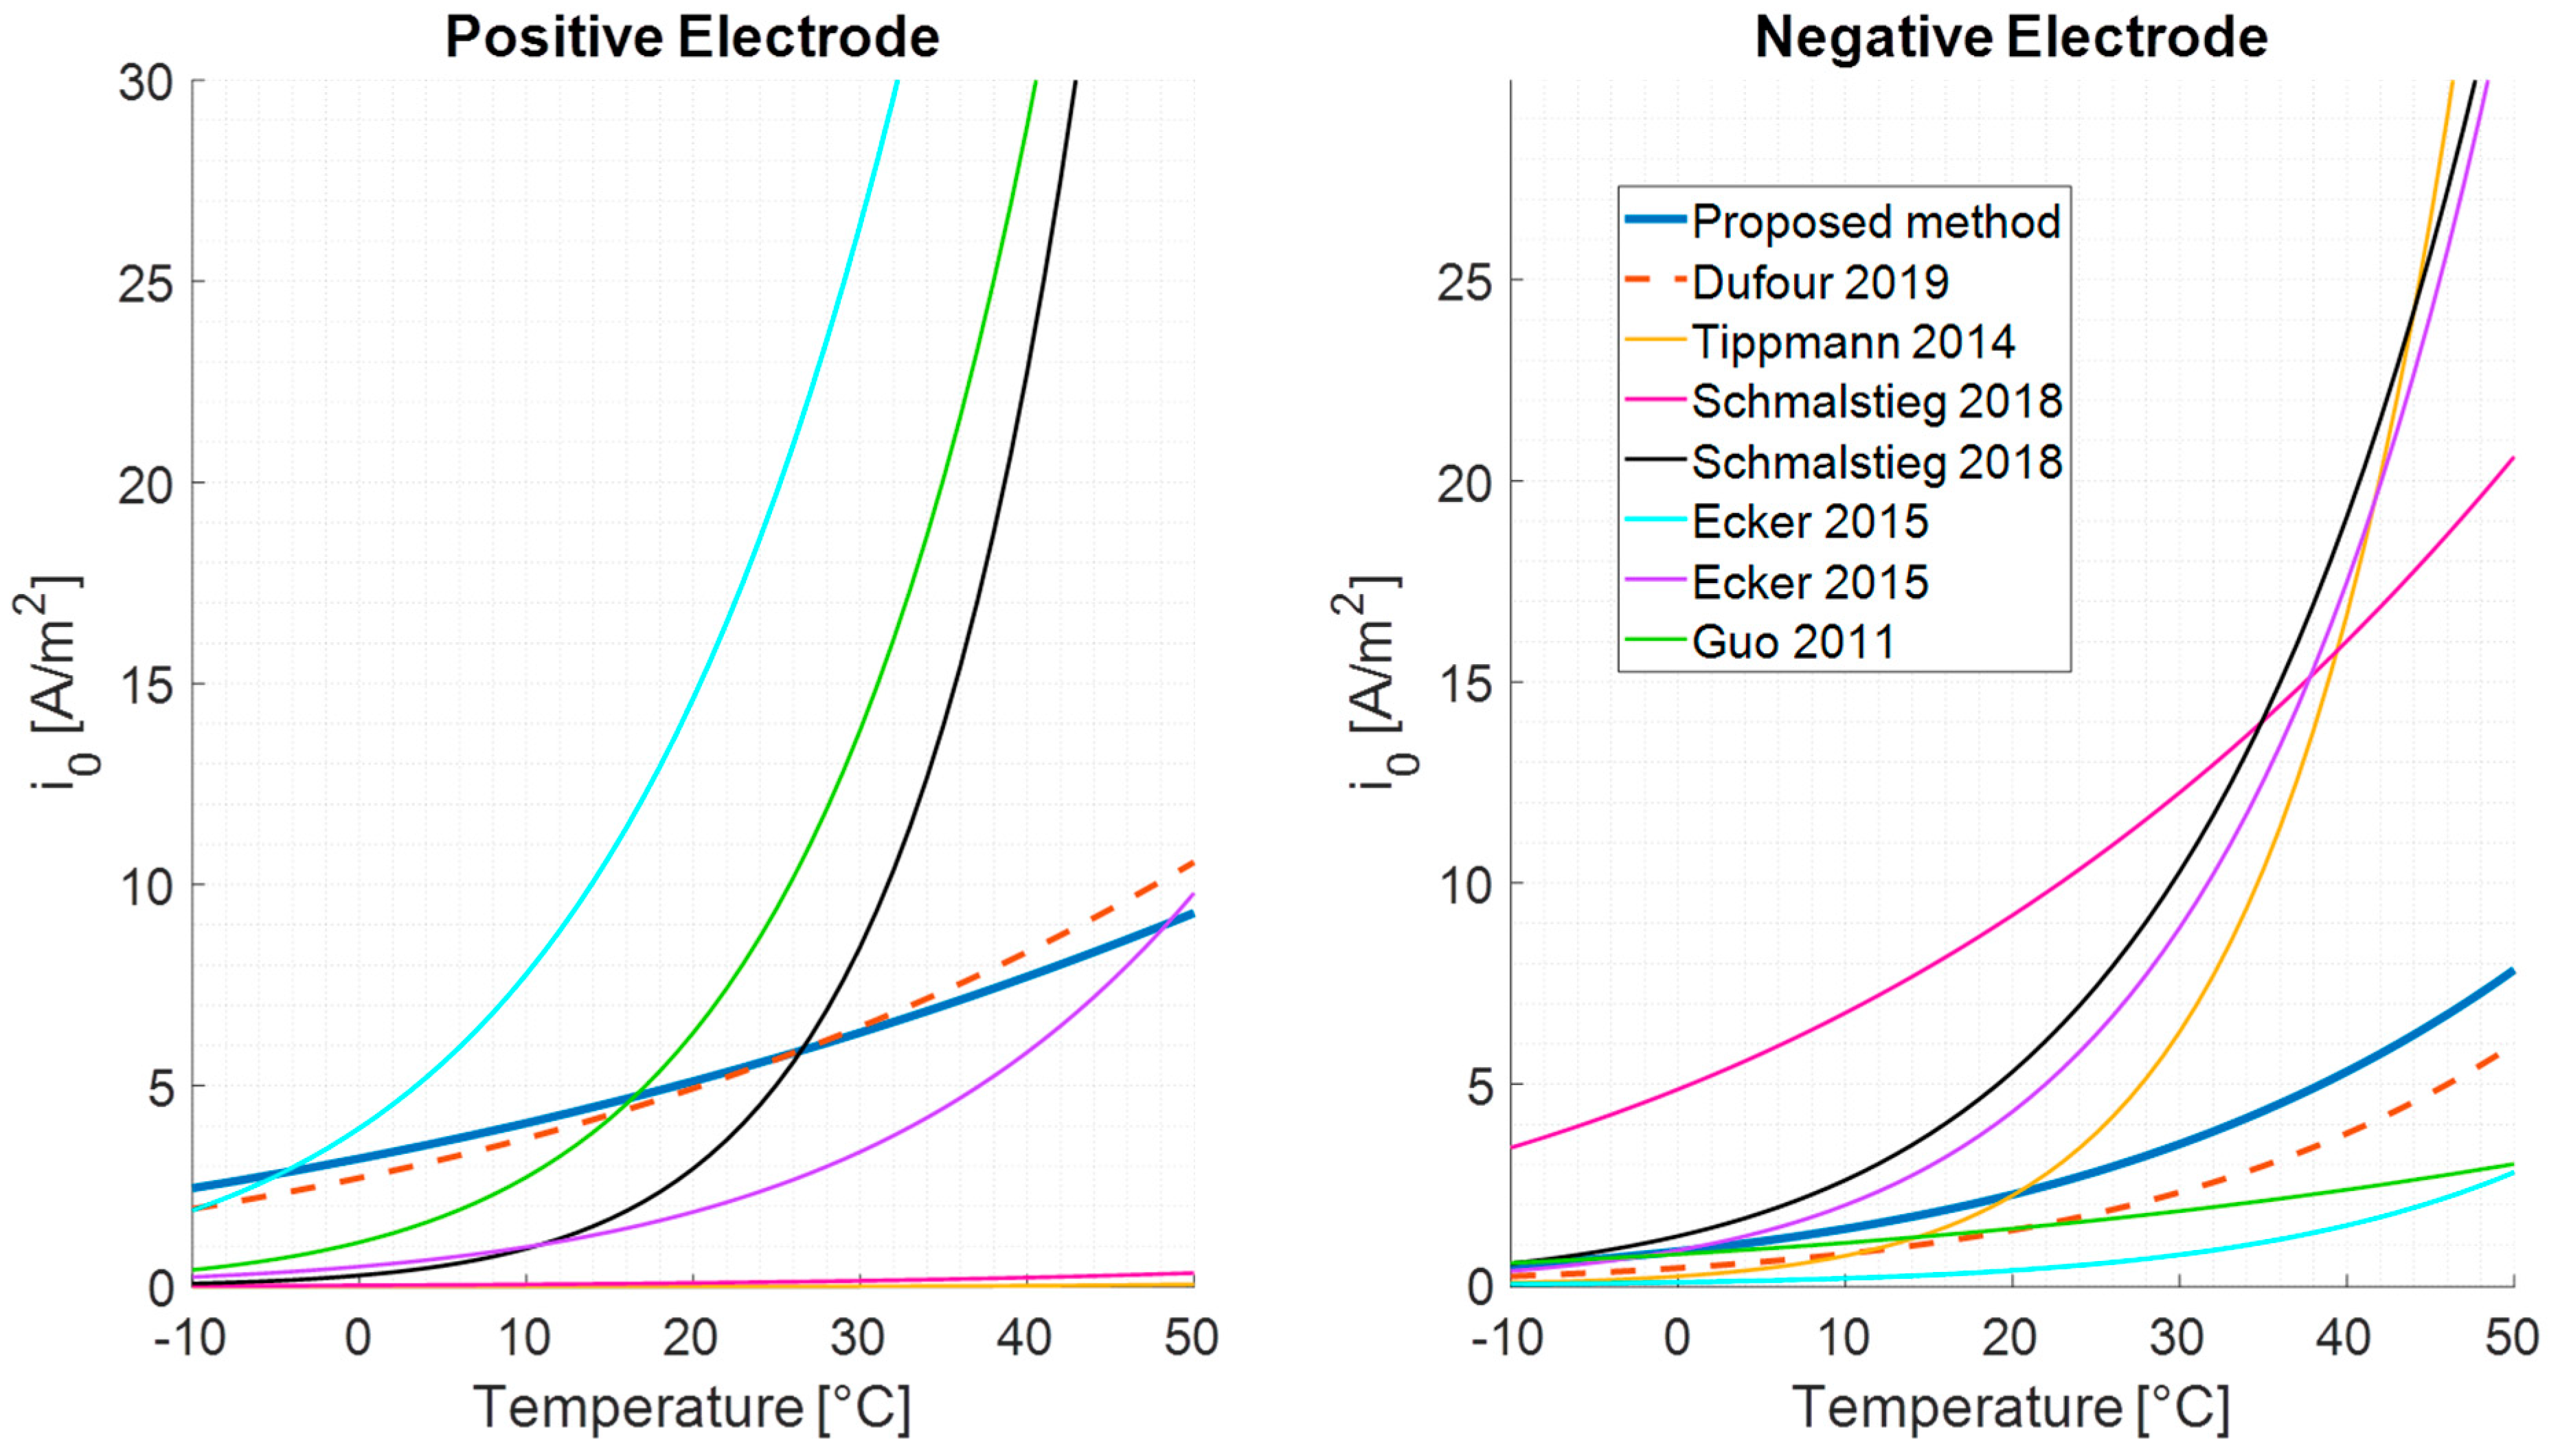
Once the identification is finished, at different temperatures, the proposed method’s results can be compared with those obtained using Dufour’s method [26] on the same data set. Figure 6 shows the differences between both methods, with respect to temperature dependency. Figure 6 also shows a comparison with the literature data with similar chemistries to compare orders of magnitude.
Despite coming from the same cell parameter set, a slight difference in the estimation of the exchange current density between both methods clearly appears, particularly at higher temperatures. This could be explained by the impact of some hypotheses since each method do not apply the same weight to parameters.

6. Conclusions

In this paper, a novel method for the characterization of the BV parameter is proposed and compared to existing methods in the literature. This paper discusses the physical interpretation of existing methods in order to propose a more phenomenological-oriented protocol. To achieve this, the BV equation was transformed in order to express the voltage drop with respect to the current and by considering ohmic contributions that occur at the same time as the reaction rate described in the BV equation. Once the equation is written in that rationalized form, it is possible to find the global minima of parametric optimization thanks to an uncorrelated trend between the two parameters of interest with the applied current intensity.
By comparing Dufour’s method and our proposed methodology, a noticeable slight difference appears, despite being identified in the same raw data. Each method considers different hypotheses that happen to show high sensitivity to the results which does not allow one to establish a strict conclusion on the interpretations of the results. This work highlights again the difficulty of practically identifying parameters of interest in battery models and especially the importance of the underlying hypotheses. Our method is believed to bring less deviation from reality by considering both voltage drop phenomena. Unfortunately, validation is required to know with accuracy the ohmic resistance of all elements since the initial voltage drop is caused both by ohmic and electrochemical kinetics contributions.

Author Contributions

Conceptualization, A.G., L.A., I.B. and S.F.; methodology, A.G., L.A., I.B. and S.F.; software, A.G.; validation, A.G., L.A., I.B., C.N. and S.F.; writing—original draft preparation, A.G.; writing—review and editing, L.A., I.B., C.N. and S.F. All authors have read and agreed to the published version of the manuscript.

Funding

This research was funded by Stellantis grant number 20HR0706.

Data Availability Statement

Data supporting the reported results are confidential.

Conflicts of Interest

Authors Alain Goussian and Cédric Nouillant were employed by the company Stellantis. Author Issam Baghdadi was employed by the company Kurybees. The remaining authors declare that the research was conducted in the absence of any commercial or financial relationships that could be construed as a potential conflict of interest.

References

  1. Krewer, U.; Roeder, F.; Harinath, E.; Braatz, R.D.; Beduerftig, B.; Findeisen, R. Review-Dynamic Models of Li-Ion Batteries for Diagnosis and Operation: A Review and Perspective. J. Electrochem. Soc. 2018, 165, A3656–A3673. [Google Scholar] [CrossRef]
  2. Meng, J.; Luo, G.; Ricco, M.; Swierczynski, M.; Stroe, D.-I.; Teodorescu, R. Overview of Lithium-Ion Battery Modeling Methods for State-of-Charge Estimation in Electrical Vehicles. Appl. Sci. 2018, 8, 659. [Google Scholar] [CrossRef]
  3. Cai, L.; White, R.E. Mathematical modeling of a lithium ion battery with thermal effects in COMSOL Inc. Multiphysics (MP) software. J. Power Sources 2011, 196, 5985–5989. [Google Scholar] [CrossRef]
  4. Botte, G.G.; Subramanian, V.R.; White, R.E. Mathematical modeling of secondary lithium batteries. Electrochim. Acta 2000, 45, 2595–2609. [Google Scholar] [CrossRef]
  5. Fan, G.; Pan, K.; Canova, M.; Marcicki, J.; Yang, X.G. Modeling of Li-Ion Cells for Fast Simulation of High C-Rate and Low Temperature Operations. J. Electrochem. Soc. 2016, 163, A666–A676. [Google Scholar] [CrossRef]
  6. Jokar, A.; Rajabloo, B.; Désilets, M.; Lacroix, M. Review of simplified Pseudo-two-Dimensional models of lithium-ion batteries. J. Power Sources 2016, 327, 44–55. [Google Scholar] [CrossRef]
  7. Mai, W.; Colclasure, A.; Smith, K. A Novel Reformulation of the Pseudo2D Battery Model Coupling Large Deformations at Particle and Electrode Levels; National Renewable Energy Lab (NREL): Golden, CO, USA, 2019.
  8. Liu, B.; Li, Q.; Engelhard, M.H.; He, Y.; Zhang, X.; Mei, D.; Wang, C.; Zhang, J.-G.; Xu, W. Constructing Robust Electrode/Electrolyte Interphases to Enable Wide Temperature Applications of Lithium-Ion Batteries. ACS Appl. Mater. Interfaces 2019, 11, 21496–21505. [Google Scholar] [CrossRef] [PubMed]
  9. Ramadesigan, V.; Northrop, P.W.C.; De, S.; Santhanagopalan, S.; Braatz, R.D.; Subramanian, V.R. Modeling and Simulation of Lithium-Ion Batteries from a Systems Engineering Perspective. J. Electrochem. Soc. 2012, 159, R31–R45. [Google Scholar] [CrossRef]
  10. Doyle, C.M. Design and Simulation of Lithium Rechargeable Batteries; University of California, Berkeley: Berkeley, CA, USA, 1995. [Google Scholar] [CrossRef]
  11. Doyle, M.; Newman, J. The use of mathematical modeling in the design of lithium/polymer battery systems. Electrochim. Acta 1995, 40, 2191–2196. [Google Scholar] [CrossRef]
  12. Dao, T.-S.; Vyasarayani, C.P.; McPhee, J. Simplification and order reduction of lithium-ion battery model based on porous-electrode theory. J. Power Sources 2012, 198, 329–337. [Google Scholar] [CrossRef]
  13. Guo, M.; Sikha, G.; White, R.E. Single-Particle Model for a Lithium-Ion Cell: Thermal Behavior. J. Electrochem. Soc. 2011, 158, A122–A132. [Google Scholar] [CrossRef]
  14. Cai, l.; White, R.E. Mathematical Modeling of a Lithium Ion Battery; University of South Carolina: Columbia, SC, USA, 2009; p. 5. [Google Scholar]
  15. Li, X.; Fan, G.; Rizzoni, G.; Canova, M.; Zhu, C.; Wei, G. A simplified multi-particle model for lithium ion batteries via a predictor-corrector strategy and quasi-linearization. Energy 2016, 116, 154–169. [Google Scholar] [CrossRef]
  16. Schmitt, J.; Kraft, B.; Schmidt, J.P.; Meir, B.; Elian, K.; Ensling, D.; Keser, G.; Jossen, A. Measurement of gas pressure inside large-format prismatic lithium-ion cells during operation and cycle aging. J. Power Sources 2020, 478, 228661. [Google Scholar] [CrossRef]
  17. Cheng, Y.-T.; Verbrugge, M.W. The influence of surface mechanics on diffusion induced stresses within spherical nanoparticles. J. Appl. Phys. 2008, 104, 083521. [Google Scholar] [CrossRef]
  18. Zhao, Y.; Stein, P.; Bai, Y.; Al-Siraj, M.; Yang, Y.; Xu, B.-X. A review on modeling of electro-chemo-mechanics in lithium-ion batteries. J. Power Sources 2019, 413, 259–283. [Google Scholar] [CrossRef]
  19. Ender, M. An extended homogenized porous electrode model for lithium-ion cell electrodes. J. Power Sources 2015, 282, 572–580. [Google Scholar] [CrossRef]
  20. Kashkooli, A.G.; Farhad, S.; Lee, D.U.; Feng, K.; Litster, S.; Babu, S.K.; Zhu, L.; Chen, Z. Multiscale modeling of lithium-ion battery electrodes based on nano-scale X-ray computed tomography. J. Power Sources 2016, 307, 496–509. [Google Scholar] [CrossRef]
  21. Torchio, M.; Magni, L.; Gopaluni, R.B.; Braatz, R.D.; Raimondo, D.M. LIONSIMBA: A Matlab Framework Based on a Finite Volume Model Suitable for Li-Ion Battery Design, Simulation, and Control. J. Electrochem. Soc. 2016, 163, A1192–A1205. [Google Scholar] [CrossRef]
  22. Namor, E.; Torregrossa, D.; Cherkaoui, R.; Paolone, M. Parameter identification of a lithium-ion cell single-particle model through non-invasive testing. J. Energy Storage 2017, 12, 138–148. [Google Scholar] [CrossRef]
  23. Doyle, M.; Newman, J.; Gozdz, A.S.; Schmutz, C.N.; Tarascon, J.-M. Comparison of Modeling Predictions with Experimental Data from Plastic Lithium Ion Cells. J. Electrochem. Soc. 1996, 143, 1890. [Google Scholar] [CrossRef]
  24. Ecker, M.; Tran, T.K.D.; Dechent, P.; Käbitz, S.; Warnecke, A.; Sauer, D.U. Parameterization of a Physico-Chemical Model of a Lithium-Ion Battery: I. Determination of Parameters. J. Electrochem. Soc. 2015, 162, A1836–A1848. [Google Scholar] [CrossRef]
  25. Edouard, C.; Petit, M.; Forgez, C.; Bernard, J.; Revel, R. Parameter sensitivity analysis of a simplified electrochemical and thermal model for Li-ion batteries aging. J. Power Sources 2016, 325, 482–494. [Google Scholar] [CrossRef]
  26. Dufour, N. Modélisation Multi-Physique de L’électrode de Graphite au Sein d’une Batterie Lithium-Ion: Etude des Hétérogénéités et des Mécanismes de Vieillissement. Ph.D. Thesis, Université Grenoble-Alpes, Saint-Martin-d’Hères, France, 2019. Available online: https://theses.hal.science/tel-02148211 (accessed on 1 February 2020).
  27. Tippmann, S.; Walper, D.; Balboa, L.; Spier, B.; Bessler, W.G. Low-temperature charging of lithium-ion cells part I: Electrochemical modeling and experimental investigation of degradation behavior. J. Power Sources 2014, 252, 305–316. [Google Scholar] [CrossRef]
  28. Schmalstieg, J.; Rahe, C.; Ecker, M.; Sauer, D.U. Full Cell Parameterization of a High-Power Lithium-Ion Battery for a Physico-Chemical Model: Part I. Physical and Electrochemical Parameters. J. Electrochem. Soc. 2018, 165, A3799–A3810. [Google Scholar] [CrossRef]
  29. Schmalstieg, J.; Sauer, D.U. Full Cell Parameterization of a High-Power Lithium-Ion Battery for a Physico-Chemical Model: Part II. Thermal Parameters and Validation. J. Electrochem. Soc. 2018, 165, A3811–A3819. [Google Scholar] [CrossRef]
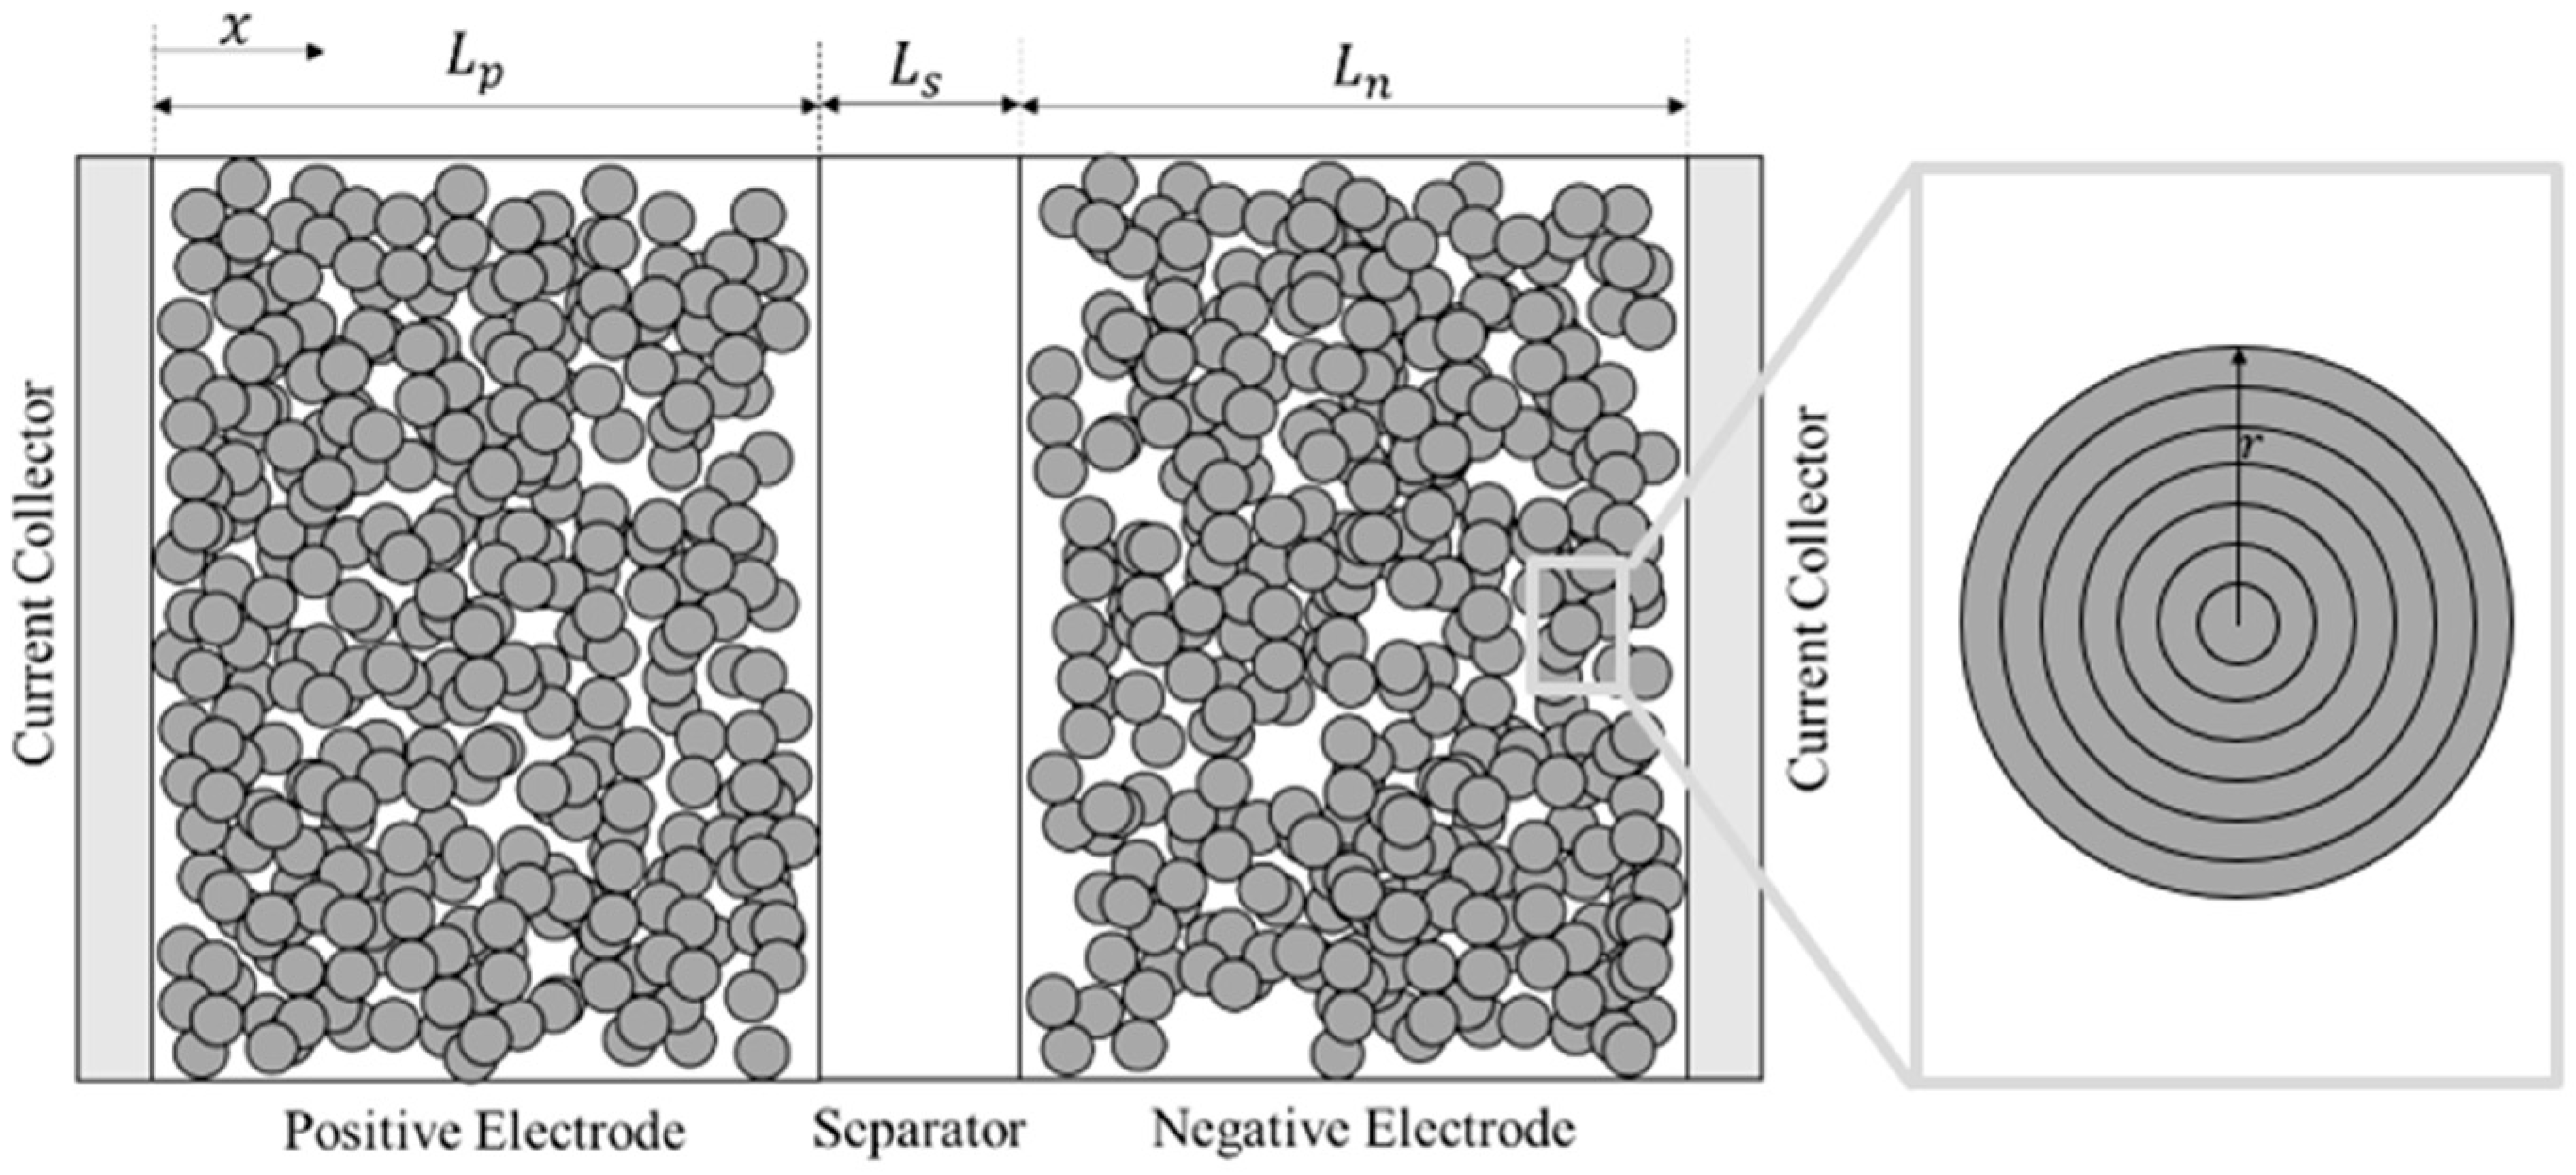
Figure 1. P2D model representation.
Batteries 10 00205 g001
Figure 2. Dufour’s method [26] applied on our data set.
Batteries 10 00205 g002
Figure 3. Uncorrelated trends with current observation: ohmic drop in orange, overpotential in red, and the sum of both in blue.
Batteries 10 00205 g003
Figure 4. Proposed method model fitting with experimental data. Measured versus simulated voltage drop with respect to the applied C-rate.
Batteries 10 00205 g004
Figure 5. Identification results at different temperatures.
Batteries 10 00205 g005
Figure 6. Comparison results with Dufour’s method and the literature [13,24,26,27,28,29].
Batteries 10 00205 g006
Table 1. List of symbols.
ParameterSymbolUnit
Ionic flux J i m o l   m 2 s 1
Maximum concentration c s , i , m a x m o l / m 3
Local concentration c s , i m o l / m 3
Electrolyte concentration c e m o l / m 3
Normalized surface concentration z i , s u r f %
Faraday constant F 96,485   s   A   m o l 1
Perfect gas constant R 8.314   J   m o l 1 K 1
Temperature T K
Overpotential η i V
Solid phase potential Φ s , i V
Liquid phase potential Φ e , i V
Open circuit potential U i V
Anodic and cathodic charge transfer coefficients α c , i   α a , i -
Applied current I i A
Active material surface S i m 2
Reaction rate constant k i m 2.5 m o l 0.5 s 1
SoL-dependent reaction rate K i m 2.5 m o l 0.5 s 1
Arranged reaction rate constant k 0 , i m o l   m 2 s 1
Exchange current density i 0 A / m 2
Internal cell resistance R c e l l
Voltage drops V V
Disclaimer/Publisher’s Note: The statements, opinions and data contained in all publications are solely those of the individual author(s) and contributor(s) and not of MDPI and/or the editor(s). MDPI and/or the editor(s) disclaim responsibility for any injury to people or property resulting from any ideas, methods, instructions or products referred to in the content.