Article

Reducing Energy Consumption and Greenhouse Gas Emissions of Industrial Drying Processes in Lithium-Ion Battery Cell Production: A Qualitative Technology Benchmark

1
Bayerische Motoren Werke Aktiengesellschaft, 80809 Munich, Germany
2
Florian Degen, Fraunhofer Research Institution for Battery Cell Production FFB, Bergiusstraße 8, 48165 Munster, Germany
*
Author to whom correspondence should be addressed.
Batteries 2024, 10(2), 64; https://doi.org/10.3390/batteries10020064
Submission received: 8 January 2024 / Revised: 5 February 2024 / Accepted: 8 February 2024 / Published: 16 February 2024
(This article belongs to the Section Battery Processing, Manufacturing and Recycling)

Abstract

:
As the world’s automotive battery cell production capacity expands, so too does the demand for sustainable production. Much of the industry’s efforts are aimed at reducing the high energy consumption in battery cell production. A key driver is electrode drying, which is currently performed in long ovens using large volumes of hot air. Several drying technologies from other industries could reduce energy consumption and greenhouse gas emissions if successfully applied to battery cell production. High process and quality requirements must be met when adapting these technologies for battery cell production. Evaluating the technologies against these requirements is difficult due to the technological novelty of this industry and the associated lack of data. Furthermore, the significant differences in drying technologies render a comparison even more challenging. One objective of this study was to evaluate drying technologies and identify those that could be best adapted to lithium-ion battery cell production. Near-infrared and laser drying were found to be the best in terms of energy efficiency, cost savings and other parameters. Another aim was to analyse, in more detail, the technological challenges and the advantages and disadvantages of the top-ranked drying technologies. Finally, the saving potential for greenhouse gas emissions of near-infrared and laser drying was calculated for a global production scenario of LIB cells in 2030. The saving potential in this scenario would amount to 2.63 million metric tonnes (Mt) CO2eq per year if near-infrared drying was applied in all global LIB cell production facilities within the mentioned scenario and 1.47 million Mt CO2eq per year for laser drying.

1. Introduction

1.1. Environmental Impact of Automotive Battery Cell Production

The transport sector is responsible for over 28% of global greenhouse gas (GHG) emissions, and significant efforts have been undertaken by industry and politics to reduce these emissions [1]. The electrification of transport can be a promising strategy if renewable energy sources are used [2]. The annual sales of electric vehicles (EVs) are increasing and are likely to continue to rise in the coming decades [3]. The number of EVs is expected to reach 145–230 million by 2030, which is the 2020 stock times 14.5 or 23, respectively [4]. Simultaneously, the demand for high-energy battery cells has increased. It is estimated that in 2030, approximately 1525 GWh/a of battery cell capacity is required to meet the demand for EVs alone [5]. Other estimates were as high as 2623 GWh/a [6]. However, EVs and lithium-ion batteries (LIBs) are not free from environmental impacts, such as GHG emissions. Up to 20% of GHGs emitted over the complete lifecycle of an EV belong to LIB production [3], and of these, 51% are due to the energy-intense LIB cell production [7]. Reducing GHG emissions during the production of LIB cells is of paramount importance for providing sustainable electric mobility [7]. In a study by Degen and Schütte [8], the energy consumption of each step of LIB cell production was calculated. The results are shown in Figure 1. It turns out that drying electrodes consume approximately 27% (11.02 kWh/kWh cell capacity) of all energy required in LIB cell production and is, therefore, the largest energy consumer. Yuan et al. [9] and Jinasena et al. [10] assigned an even larger share of total energy consumption to drying at 47% and 48%, respectively.
Since the supply of energy mainly depends on fossil fuels right now, the energy consumption directly impacts the GHG emissions of a product. The use of electricity generated from regenerative energy sources could drastically reduce GHG emissions. However, a preferable alternative for reducing GHG emissions is to reduce the energy consumption of the process in the first place. Degen [11] examined technological innovations to reduce the energy consumption of LIB cell production until 2030. The most promising technologies were dry coating, fast formation cycling and the implementation of micro-environments. These three technologies address the three biggest energy consumers in Figure 1: coating and drying, formation and dry rooms, respectively. Another study by Drachenfels et al. [12] shows similar results. Dry coating would, if implemented successfully, render the drying process obsolete. However, dry coating is still in the early stage of development [13]. Until implemented at a large scale, efficient drying processes are key to reduce the energy consumption of LIB cell production. Therefore, this study examines technological approaches to reduce energy consumption and GHG emissions of LIB cell drying.

1.2. Existing Literature on Drying in LIB Cell Production

In industrial companies, heat energy represents 40 to 60% of the overall energy consumption and is mainly used for drying processes [14]. Examples range from drying food to prolonging the shelf life over drying straw, wood or paper to drying electronic components such as semiconductors or LIB cells. In a study by Degen and Schütte [8], energy consumption for the production line of cylindrical cells with lithium nickel manganese cobalt oxide (NMC) as cathodes and an output of 200 cells per minute (883 MWh/a) is investigated. Here, 52% of all energy is required as heat, most of which is for electrode drying [2,8]. Drying is a process in which heat and mass transfer occur simultaneously to remove water or another liquid solvent [15,16]. For this, a considerable amount of energy is required, as well as a long process time for the liquid to evaporate [15]. Most of this energy is required to match the enthalpy of the evaporation. In general, fossil fuels are involved in the supply of heat by either burning them onsite at the production site or by burning them offsite for electricity generation. The high energy consumption of drying processes leads to high GHG emissions. Owing to its substantial impact on GHG emissions, cost and production speed, drying in LIB cell production has gained the attention of the industry and research community. However, most research efforts to date regarding drying coatings have been conducted in other industries, such as paper, textiles and food [15]. Although several technological approaches for electrode drying have been proposed and investigated over the past few years, none were applicable to mass production. These technological approaches for drying differ in the type of heat transfer, achievable temperature, purchase and operating costs and energy efficiency. Research activity mainly focuses on technologies using electromagnetic radiation to deliver the energy required to dry the active material on the electrode [17]. The main challenges with these technologies are low process speed and the potential to damage the electrodes because of the high energy intensity. The state-of-the-art LIB cell drying is relatively simple and technologically mature and is, therefore, available for large-scale production. However, this method is very energy-intensive and inefficient [18,19].

1.3. Focus and Goal of This Study

The goal of this study is to investigate how LIB electrode drying can be improved by applying technologies already in use in other applications. The potential improvement was analysed and evaluated in four dimensions.
  • Economics and ecology (e.g., investment and energy consumption);
  • Process performance (e.g., process speed, efficiency and ramp-up time);
  • Technological maturity (e.g., technology readiness level (TRL), patent situation);
  • Quality (e.g., homogeneity of drying and residual moisture).
It is important to note that these dimensions overlap in some areas. For example, a high process speed would not only be beneficial in terms of process performance but also from an economical point of view. On the other hand, faster drying can reduce the quality of the electrode because the residual moisture content is higher or the drying is not homogeneous. However, to reduce complexity, the four dimensions mentioned above were analysed separately.

2. Methods and Data

This section presents the fundamentals of LIB cells and electrode production. In addition, a more detailed investigation of electrode drying was carried out to establish a fundamental understanding of the drying process. Finally, the methodological approach of this study is explained. This includes the three stages of conceptualisation, data collection and data evaluation. Full information and details can be found in Appendix A, Appendix B, Appendix C and Appendix D.

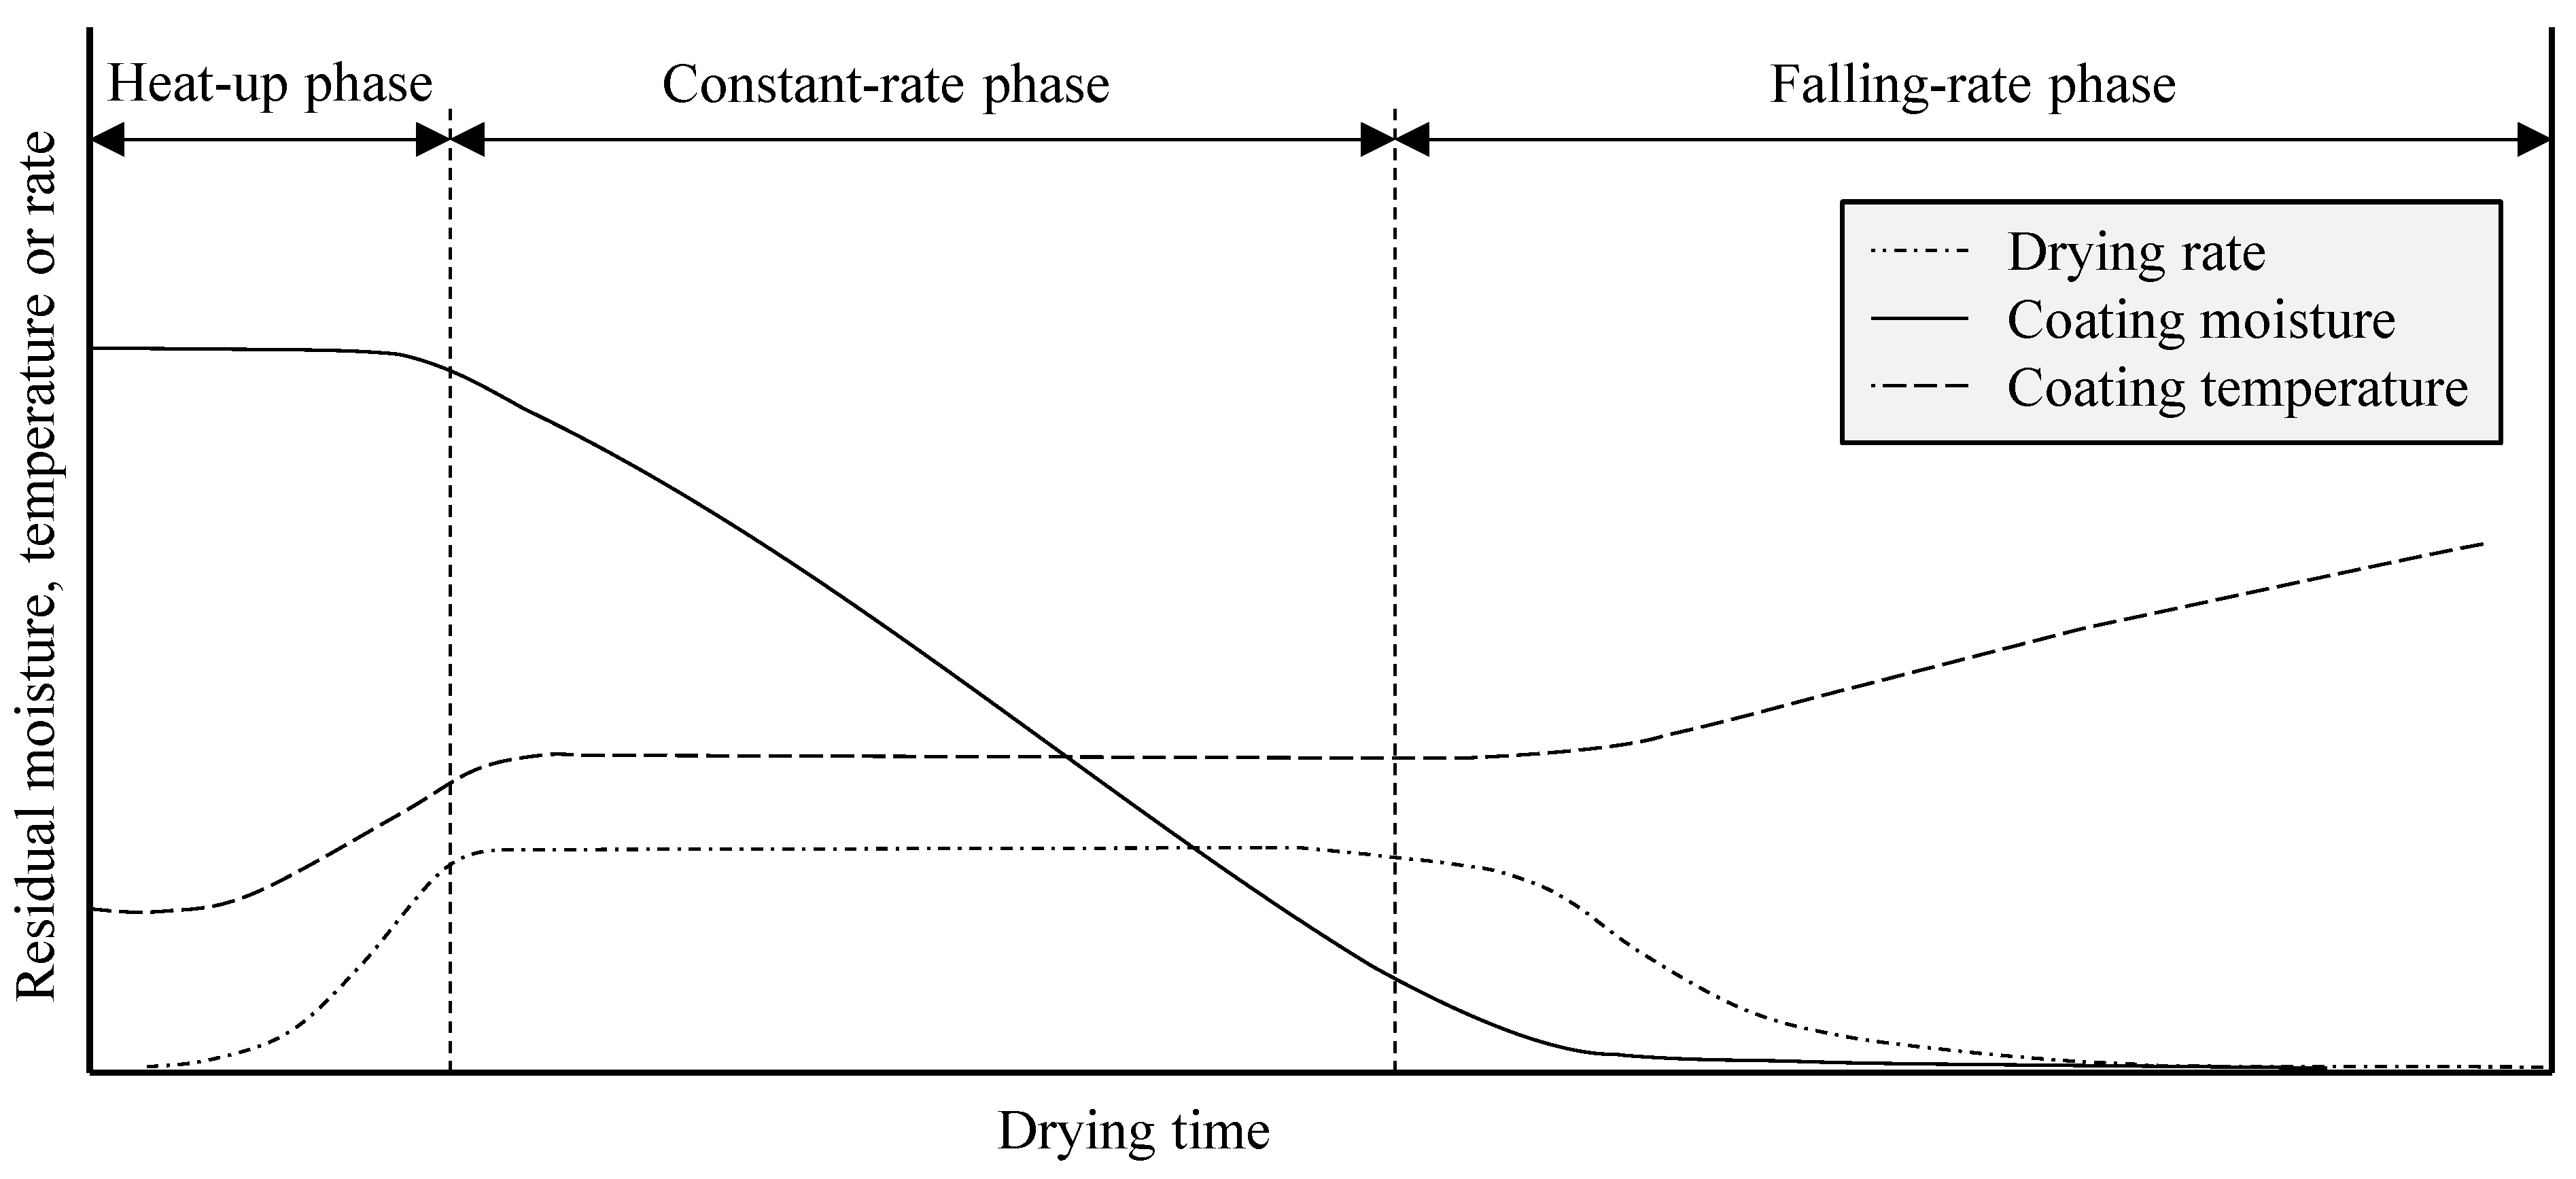
2.1. Physics of LIB Electrode Drying

Electrode drying involves the simultaneous transfer of heat and mass [15,16]. To match the processing speed of the (faster) upstream and downstream production steps in electrode manufacturing, the oven must be very long to provide sufficient time for slow heat and mass transfer. The drying process is divided into three phases (Figure 2). The “Heat-up” phase is mostly characterized by heat transfer into the coating. In state-of-the-art LIB cell production, the coated electrode foil is dried using hot air as a drying medium flowing over the foil [15]. During the transition to the second phase, the solvent evaporates at the surface of the coating, whereas more solvent diffuses through the coating on the surface. The drying rate stays approximately constant (hence, the “Constant-rate” phase), and the major resistance to the evaporation is in the gas phase at the surface [15,16]. At the end of this phase, most of the drying process was completed. The porous structure is now not solely filled with liquid solvent but also with vapor, leading to a complex interplay of different physical processes [15]. To extract residual moisture and achieve the desired properties, extensive energy and time are required to overcome the resistance to mass transport by the porous structure of the coating [16]. When the drying rate decreases, the excessive thermal energy further heats up the coating temperature. In Figure 2, the curves for the drying rate, moisture and temperature of the coating are shown for all three phases. Although most of the moisture is extracted in the “Constant-rate” phase, the “Falling-rate” phase is often the longest.
To prevent the air from becoming saturated with the solvent, thus impeding further evaporation, the process air flows through the oven and is exhausted while fresh unsaturated air is replenished. The process air is, therefore, responsible for transporting thermal energy to the coating surface and carrying away the evaporated solvent. A substantial amount of energy is required to continuously heat a large quantity of the process air flowing through the oven [20].
Several factors influence drying time and energy consumption:
  • The type of solvent used;
  • The thickness of the coating;
  • The solid content of the coating;
  • The dew point of the supply air.
In state-of-the-art LIB cells, water is used as the solvent for the anode, whereas NMP is used for the cathode. Both require large quantities of energy during drying. In the case of NMP, a higher boiling point of 204.3 °C at atmospheric pressure (vs. 100 °C for water) and lower vapor pressure increases energy demand [16]. In addition, NMP is flammable and explosive. Therefore, the NMP concentration in the dryer must be kept well below the flammability threshold, increasing the quantity of air and the accompanying amount of energy required [20]. Finally, because NMP is explosive and toxic, it must be recovered from the exit gas, adding further equipment and energy demand to the process [16,20]. A switch from NMP to water as a solvent is desirable regarding the latter two points but is associated with different challenges. One of the challenges is the side reaction between water and Li during the formation of LiOH. This, in turn, increases the pH value of the slurry, leading to the corrosion of the Al2O3 passivation layer of the current collector foil and a reduction in the performance and life expectancy of the cell [21]. From an energetic perspective, the use of water as a solvent is not optimal, as it requires more than 4× the heat to evaporate compared to NMP (2260 vs. 510 kJ/kg) and has a higher specific heat capacity [16].
Another key factor in the drying process of LIB cells is the thickness of the active material layer. Increasing coating thickness will also increase the amount of solvent and the distance travelled before it evaporates [16]. The high solid content in the coating and the low dew point of the supply air both reduce energy consumption and drying time.

2.2. Methodology

The development of a technology strategy includes the tasks of technology acquisition, technology exploitation and technology management [22]. Prior to acquisition, technologies must be identified, benchmarked and selected [23]. Hamzeh and Xu [24] provide an overview of established technology benchmarking methods. Most of these methods are primarily quantitative, which requires sufficient valid data. However, previous studies reported challenges in applying these methods to emerging technologies due to the scarcity of quantitative data [13,25,26]. To address this issue, a qualitative research approach was adopted in this study. In order to include highly novel technologies, three different categories of sources were used: peer-reviewed scientific literature, patents and research projects. The scarcity of empirical data complicates the selection and comparison of relevant key performance indicators (KPIs) [27]. In this study, a three-step process of conceptualisation, data collection and data evaluation was used to overcome this challenge. One KPI that is often used to assess and compare the maturity of emerging technologies is the TRL, which was first introduced by the National Aeronautics and Space Administration (NASA) in the 1960s [28]. Since then, additional readiness levels have been developed such as the Manufacturing Readiness Level (MRL). The reason for this is that manufacturing technologies are only mature if the product technology and design are mature and stable [13,28,29]. Since the product design and the impact of different drying technologies on product quality and performance are still under development, it is appropriate to use the TRL to indicate the maturity level.

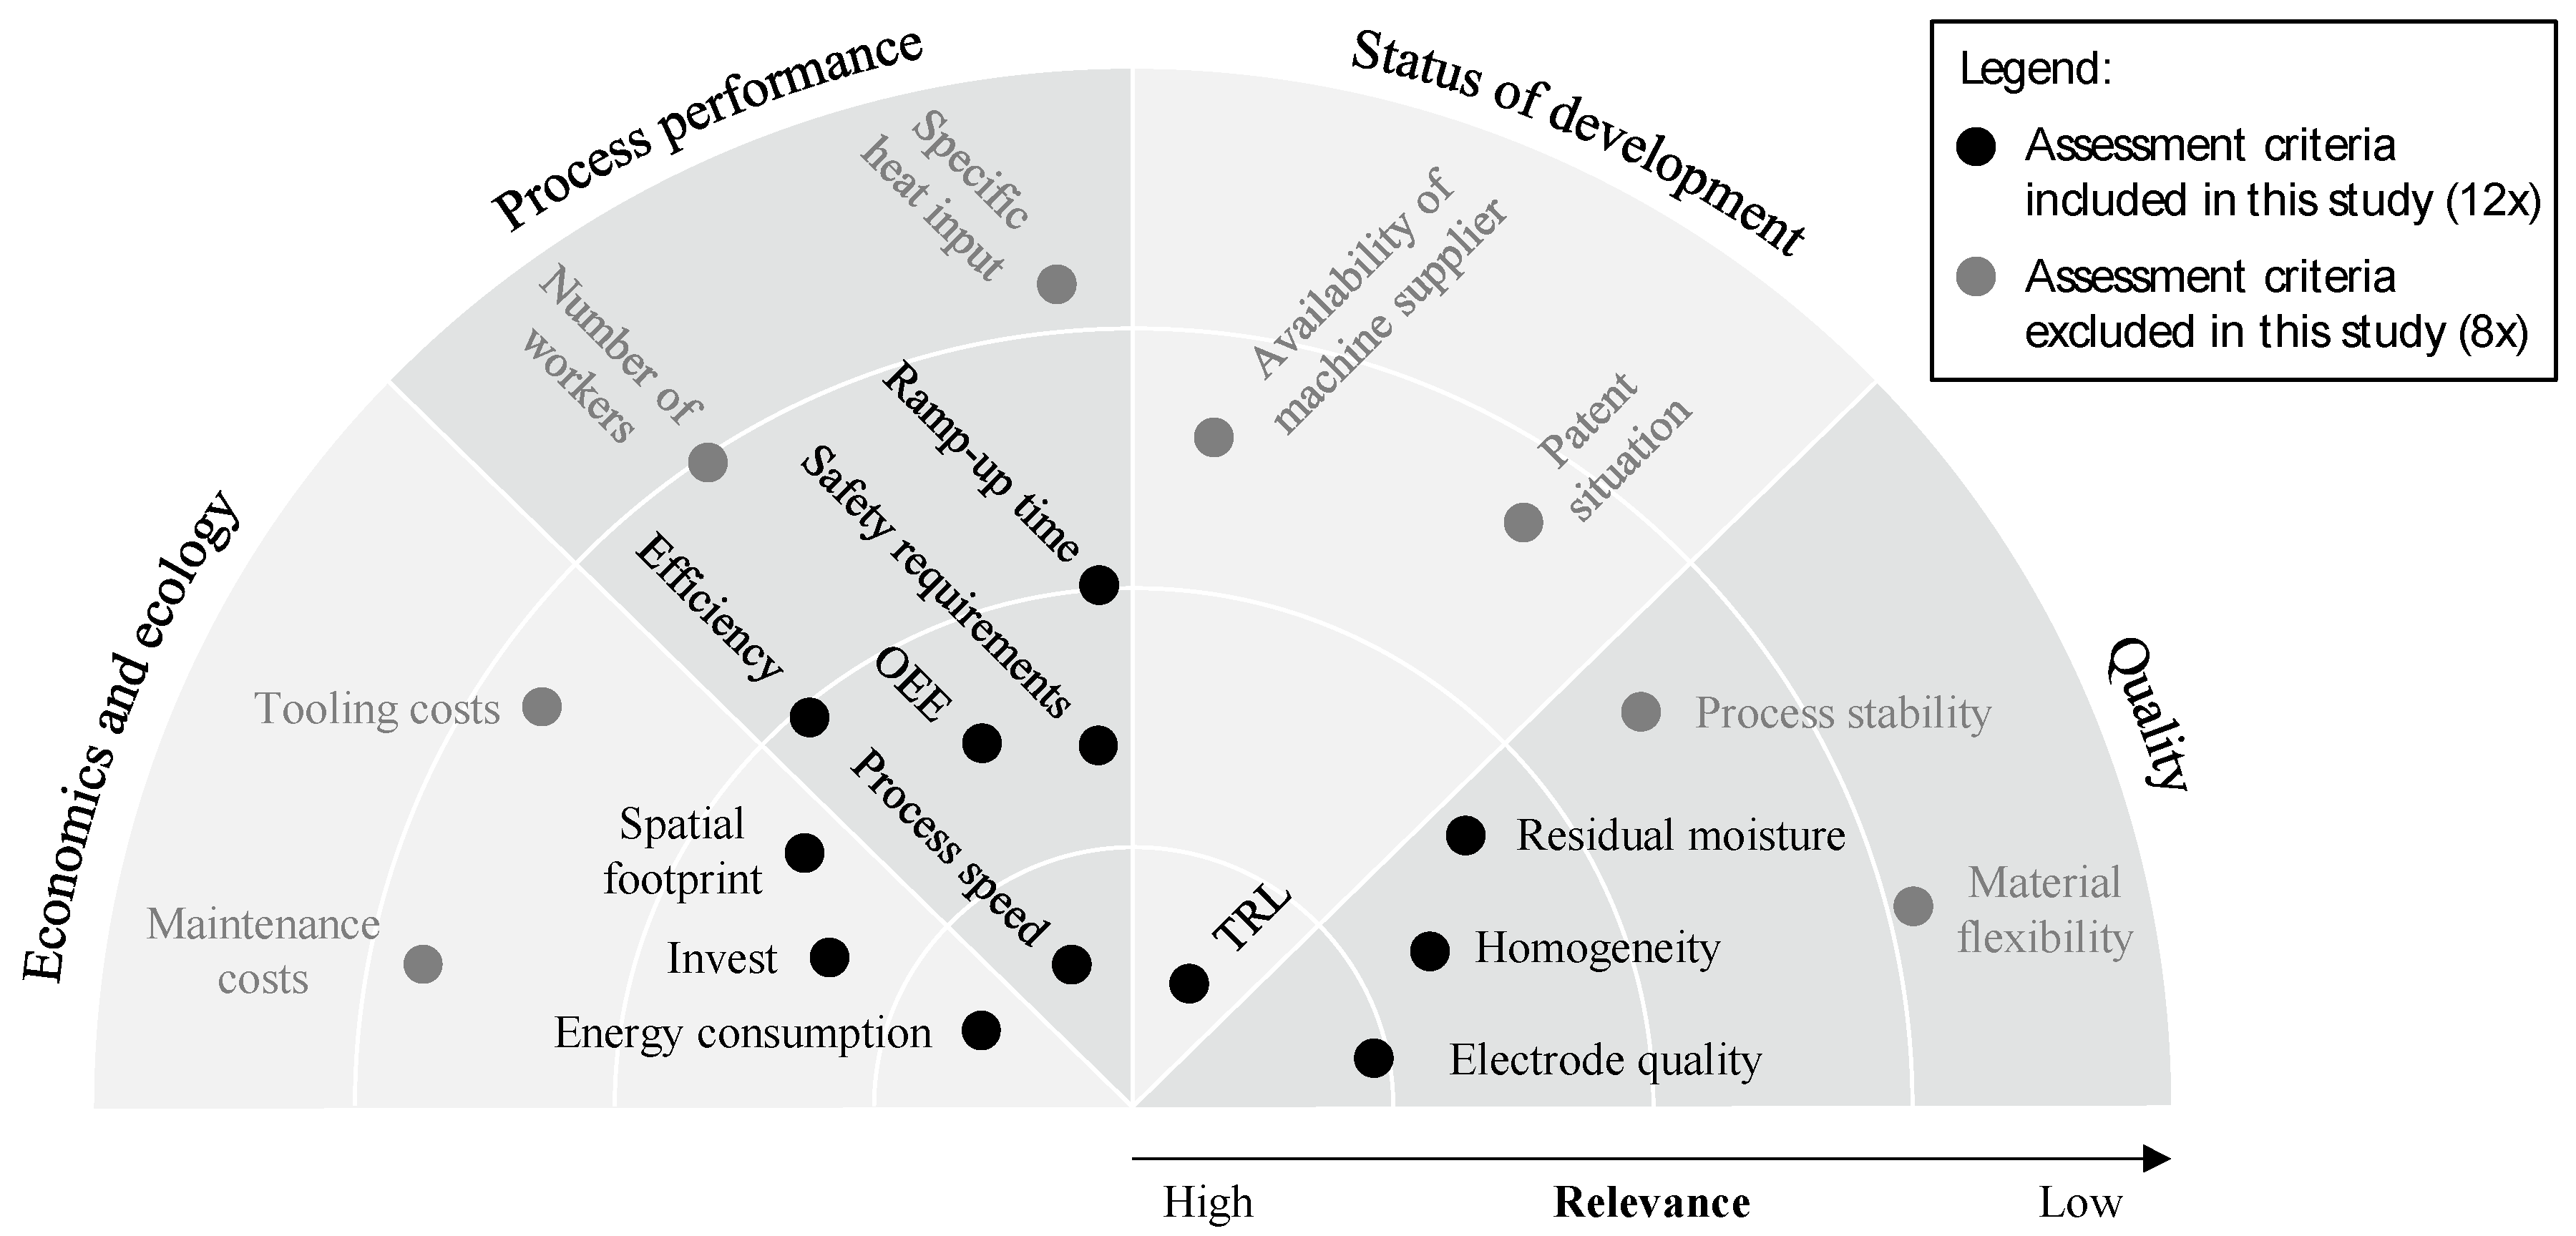
2.2.1. Conceptualisation of the Study and Determination of Key Performance Indicators

In an initial guided workshop, the question of which KPIs are relevant for benchmarking drying technologies for LIB cells was addressed. The format of a guided workshop was chosen because research has shown that guided workshops are well suited for the problem-structuring and -solving process [13,30]. The workshop involved a management team from a battery cell factory and researchers in the field of LIB cell production. In total, 12 experts with several years of experience in the fields of either drying or LIB cell production participated in this workshop. Further information on these experts, such as educational background and expertise, is listed in Appendix A. As a first step, each expert recorded the assessment criteria relevant to the LIB electrode drying. These assessment criteria were later used to form the KPIs. The experts reviewed all the assessment criteria and clustered them using group assessment. In addition, the assessment criteria were evaluated for their individual relevance via a group assessment. The results of this procedure are shown in Figure 3.
A total of 20 assessment criteria were identified in the workshop and ranked according to their relevance. Of these, eight were ranked less relevant in the extensive discussion and were, therefore, excluded from this study. The remaining 12 assessment criteria were clustered into four categories. For each category, relevant assessment criteria were accumulated to create representative KPIs. A higher level was chosen to enable a comparison of the technologies, even if the information on individual assessment criteria was not available. The four KPIs representing the four categories are as follows:
  • Status of development indicator: The KPI reflects current progress in the development of the technology. The only assessment criterion here was the TRL.
  • Economic and ecology indicator: KPI expressing financial and ecological means or use of resources. The key influences on this KPI are investment costs, energy consumption (or energy-related costs) and spatial footprint (space demand in factory layout).
  • Process performance indicator: The KPI is related to the technological performance of the process, expressed by process speed, overall equipment effectiveness (OEE), efficiency, safety requirements and ramp-up time.
  • Quality indicator: KPI expressing how well electrodes can be dried repeatedly. The main aspects of this KPI are electrode quality, homogeneity of drying and residual moisture.

2.2.2. Data Acquisition and Evaluation

Multiple sources of data were included to reduce the bias of individual participants in this study. A comprehensive literature search was conducted. This included scientific publications from various publishers, patents and research project reports. Expert interviews were then conducted on the identified technologies. The search terms used for the desk research and the corresponding results in each search engine are listed in Appendix B, while information on the experts and the interview questionnaire are listed in Appendix C and Appendix D, respectively.
The desk review identified over 40,000 scientific articles related to industrial drying. The source of the articles can be found in Appendix B. Appendix B lists the search engines/databases used, the search terms and the corresponding results. In subsequent selection procedures, these articles were further filtered by relevance and year of publication, as older publications do not reflect the current state of both the processes and the LIB technology. Further information on the selection procedure and criteria can be found in Appendix B. Only articles published between 2016 and 2022 were included in the present study. The decision to include articles from 2016 to 2022 was driven by the focus on recent advancements in the field. Some of the scientific articles were not in the field of LIB production but addressed drying in different industries or compared it between different industries. However, the purpose of this study was to explore novel approaches by examining other industries. A total of 28 scientific articles were analysed in this study. In addition, a comprehensive patent search was conducted. Following the selection procedure described in Appendix B, five patents were further investigated in this study. Finally, the reports of six research projects currently running or already finished were collected and analysed. In addition to the search for relevant publications, 15 semi-structured interviews of at least 60 min each were conducted with experts from industry and research. The interviewees were carefully selected so that there were at least two experts for each specific technology to increase the objectivity of the results. More information on the experts interviewed is provided in Appendix C. The interviews covered each of the 12 relevant evaluation criteria as well as additional questions on the advantages, disadvantages and remaining challenges of each technology. The questionnaire used for all interviews is given in Appendix D.
For evaluation, the results were sent to the same 12 experts who participated in the first workshop. In addition, the results were shared with the industry experts interviewed. In the final workshop, the experts’ and researchers’ evaluations were analysed and compared. If several feedbacks suggested an adjustment of a KPI in the same direction, the adjustment was made and recorded. Due to the absence of quantitative data for certain technologies with lower TRL levels, we opted for a comprehensive exploration through workshops and interviews with esteemed experts in the field of battery cell manufacturing and drying technology. These interactions allowed us to glean qualitative insights, capturing the nuances and potential future impacts of the technologies, even when quantitative data was not readily available.

3. Results and Discussion

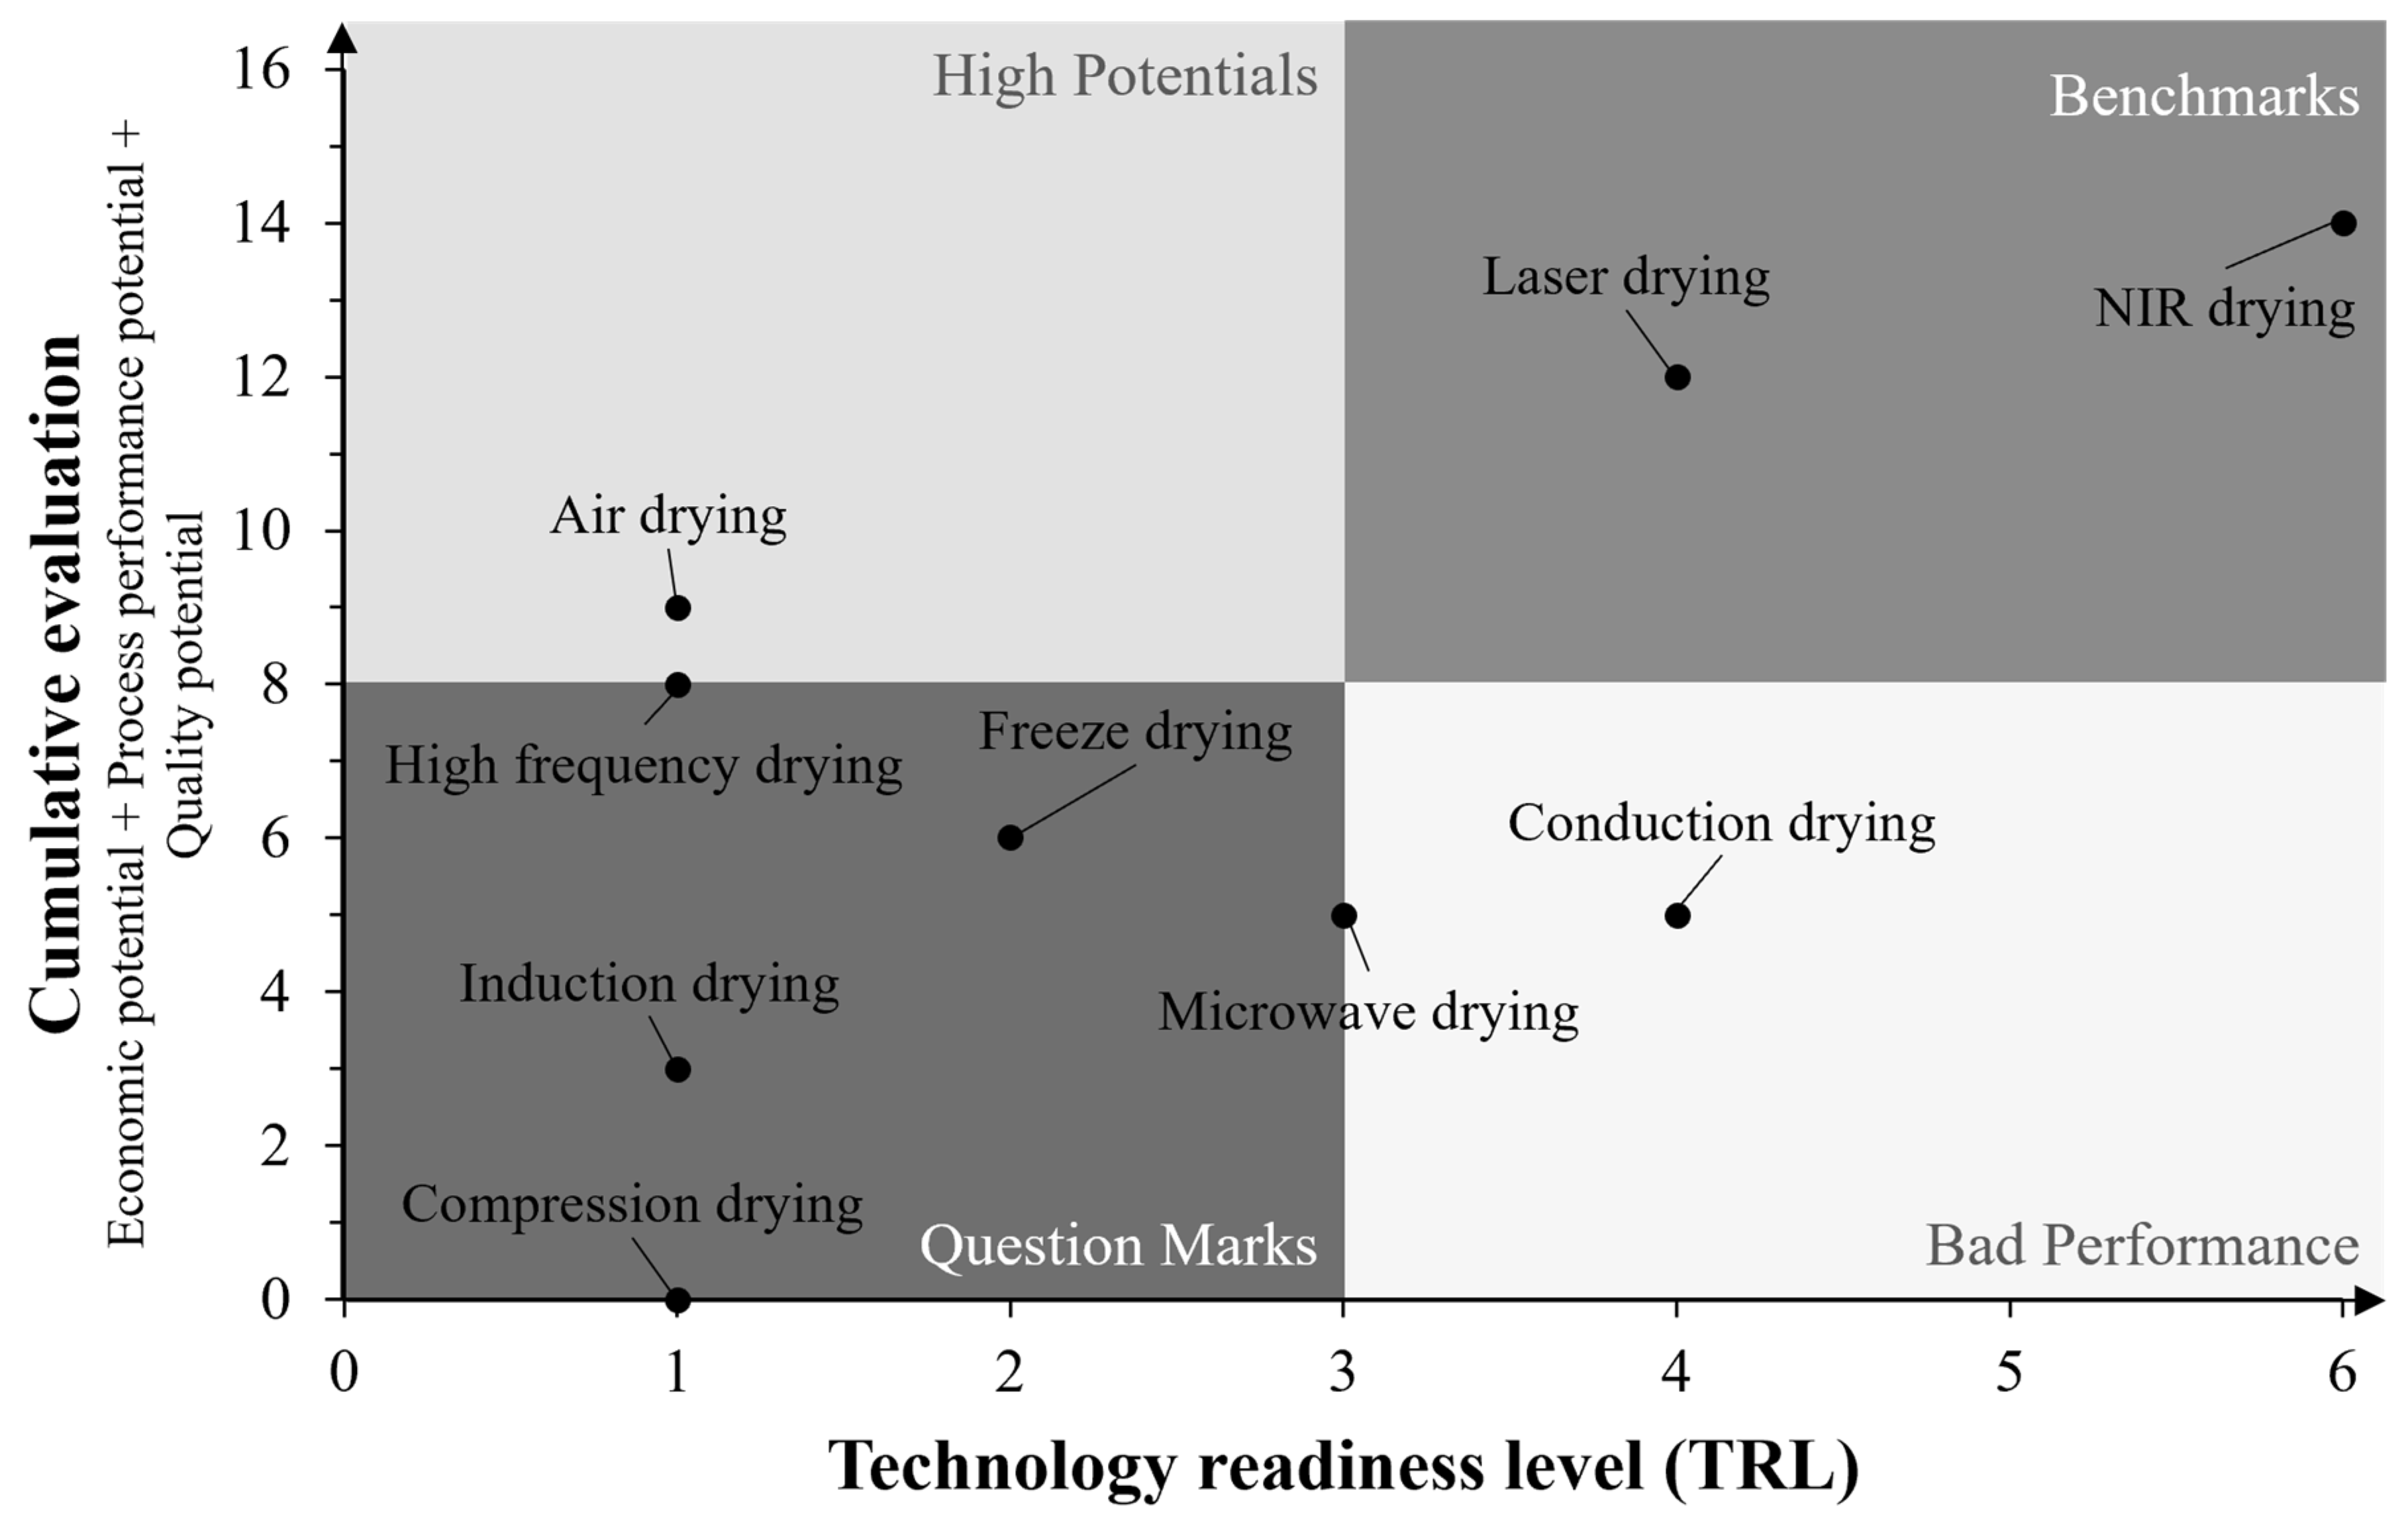
3.1. Overview of Identified Technological Approaches

The extensive screening procedure described above shows that there are currently various technological approaches for drying in LIB cell production in the early or advanced development stages, differing in the type of heat input or the technological implementation. In total, ten drying technologies linked to LIB cell drying were identified. These technological approaches can be clustered into three groups: drying by convection, drying by electromagnetic waves and others, which use mechanisms different from the first two groups. A straightforward alternative approach to the state-of-the-art electrode drying process is to use unheated ambient air, which is used in the food industry [31]. A completely different approach involves the use of electromagnetic waves to evaporate the solvent. In this case, the process air is only necessary for carrying the evaporated solvent and not for heating. Energy is directly inserted into the coating through radiation. Technologies currently in development use near-infrared (NIR), laser or microwave radiation to evaporate solvents [17,32]. A completely different approach is conduction drying, in which the coated electrode comes in contact with a heated surface and is dried by thermal conduction [33]. In induction drying, the electrode foil is surrounded by a magnetic field that generates heat through high-frequency currents [17]. In high-frequency drying, the material to be dried is placed in an alternating electrical field induced by two electrodes [33]. This stimulates molecules in the material, and the resulting frictional heat evaporates the solvent. Freeze-drying is a process in which the solvent is first frozen and then transferred to the gas phase by sublimation [34]. Finally, compression drying refers to the process of pressing out the solvent using rollers. These approaches have different advantages and disadvantages. To find a suitable option for electrode drying, a comprehensive and in-depth study of different technologies is necessary. The rating scheme displayed in Table 1 was used. In Table 2, the ratings for TRL, as well as economic and ecological process performance and quality potential based on the expert interviews for all technologies mentioned above, are shown. In the evaluation of the economic and ecological process performance and quality potential, it was considered that all technologies were already at TRL 9.
These points were then used to calculate the cumulative benchmarking value (Figure 4).
The TRL rating for the stated innovative technologies is challenging, and deviations of +/− 1 are possible. Nevertheless, benchmarking demonstrates that most drying technologies are at an early stage of development. In addition to state-of-the-art hot air drying, only NIR drying has a TRL greater than 4, whereas six of them have a TRL of 3 or less and are, therefore, still in the research phase. Column four lists the ratings of economic and ecological potential. It reveals that only three technologies are economically superior to hot air drying: air drying, NIR drying and laser drying. NIR drying appears promising, whereas freeze-drying yields the lowest rating. The fifth column lists the ratings for the process performance potential. While NIR drying again has the highest rating, air drying has a much lower process performance potential compared to hot air drying because of its low process speed and efficiency. The last column shows the ratings for the quality potential. Only four of the ten technologies showed better quality than hot air drying. High-frequency and microwave drying perform poorly because of the high possibility of burning the active material within the drying process. For the remaining technologies, too little information is available for reliable rating.
Based on the ratings in Table 2 and the rating scheme mentioned above, the cumulative KPI was calculated by adding the ratings for the economic and ecological potential, process performance potential and quality potential. Figure 4 shows the cumulative ratings as a function of TRL level. It is apparent that most technologies are in the early stages of development, and the lack of accessible, reliable information renders an evaluation complex. This is especially the case for compression drying, for which no reliable rating is possible. Only NIR drying and laser drying are in the upper right quadrant and are, therefore, of particular interest for application in industrial LIB production.

3.2. Analysis of the Most Promising Approaches

The benchmarks of the different technological approaches show that NIR drying and laser drying are the most promising approaches, as they promise better performance at lower cost and energy consumption compared to state-of-the-art hot air drying. Simultaneously, both have a TRL of four or more, so their implementation in large-scale production is feasible in the next few years. Thus, NIR and laser drying are examined in more detail in the following section.
The TRL of state-of-the-art drying has been rated 9 because it has been proven in its operational environment for several years (see Figure 5). From an economic and ecological perspective, this technology is suboptimal because its spatial footprint, investment and energy consumption are all high. The performance was also low, mainly because of the low efficiency, long ramp-ups and low process speed. The achievable quality is restricted because surface evaporation leads to inhomogeneous drying along the coating thickness. This limitation can be compensated for by smart process management. However, there are obvious disadvantages regarding all three KPIs; a neutral evaluation was chosen because it served as a benchmark for novel technologies.
The NIR drying process is a promising approach for improving LIB production. By using electromagnetic waves in the near-infrared spectrum, energy is efficiently transported directly into the active material coating and its deeper layers. This approach is beneficial in several respects. First, the drying speed is significantly higher than that of convection drying because the direct high-energy heat input through electromagnetic waves is faster than the heat transfer by convection. Second, it is more efficient because it does not require heating large volumes of air. In NIR drying, the process air is only needed to carry away the solvent, for which it is not necessary to reach a high temperature. Moreover, by separating the heat transfer from the airflow, the drying process can be run at low pressure to support solvent evaporation. This reduces energy demand and energy-related costs. Third, investments are low because NIR bulbs are an established and inexpensive technology. In addition, the spatial footprint can be reduced compared with convection drying because of the higher efficiency and speed of NIR drying. Finally, homogeneous heat input can further improve the electrode quality and reduce the remaining moisture. However, the high energy intensity of NIR radiation is accompanied by challenges regarding the interaction with the active material, such as binder migration. Multiple studies have shown that fast drying leads to the accumulation of a binder near the coating surface [35,36,37]. Jaiser et al. [36] demonstrated that the binder is enriched at the coating surface, where the evaporation of the solvent leads to higher solid content, and capillary effects trigger binder migration. The resulting binder shortage near the current collector reduced the adhesion of the coating. The slow compensatory processes of back diffusion can reduce the binder gradients only if sufficient time is provided [36]. However, investigations by Adphos showed that binder gradients do not occur in NIR drying processes if they are fast enough to prevent binder migration in the first place. Westphal et al. [37] reported a similar observation regarding high-speed drying. In summary, NIR drying promises substantial energy- and time-saving potential if the implementation on an industrial scale is successful and the electrode quality remains high. NIR drying has already been used in several LIB productions to boost convection drying but is yet to be implemented as a stand-alone application.
Laser drying has many similarities to NIR drying, especially regarding the expected advantages, such as process speed. However, some distinctions were made. The energy-saving potential is expected to be lower because of the low overall efficiency of laser machines. Thus, the energy costs of laser drying are higher than those of NIR drying. The same is true for investment because lasers are more expensive than NIR bulbs. In terms of process performance, the safety requirements are higher when laser drying is used. Binder migration is a challenge in the implementation of laser-drying. In addition, it seems that the monochromatic light of the laser does not reach the deeper layers of the multi-component coating, and most of the energy is absorbed in the vicinity of the surface, leading to the development of dried skin at the surface. Currently, the applications of laser drying are still at the lab scale, and the stated challenges are yet to be fully understood. Thus, more research and development are necessary before implementing this technology on an industrial scale.

3.3. Impact of Different LIB Drying Technologies on Energy Consumption and GHG Emissions

By applying an efficient drying technology, the energy consumption of LIB cell drying can be reduced. However the extent of the reduction is difficult to determine due to insufficient data. Nevertheless, a rough assessment can be made by using the relative saving potentials estimated by the experts (Table 3). These saving potentials were determined by asking the experts what percentage of energy consumption can be reduced by innovative technologies compared to convection drying. The average estimates for NIR and laser drying are 80% and 50%, respectively. Based on this, the energy consumption for drying one kWh cell capacity can be calculated (Table 3, column three). Finally, by estimating a LIB production capacity of 1525 GWh in 2030 [5], the resulting savings of GHG emissions can be calculated (Table 3, column four). The potential energy and GHG emission savings of drying technologies in LIB cell production are considerable. By switching to NIR drying, the annual GHG emissions of LIB electrode drying in 2030 could be reduced from 3.4 million Mt CO2eq with hot air drying to less than 0.8 million Mt CO2eq. The energy-saving potential for laser drying is smaller, resulting in GHG emissions of 1.9 million Mt CO2eq in 2030. This suggests that NIR drying or laser drying is applied in 100% of LIB cell production facilities. Although NIR drying is about to reach maturity for mass production from a technological point of view, existing production equipment has usually been in operation for over ten years because of the high investment costs. However, many new production sides are currently under construction to meet the continuously rising demand for LIB, and thus, new opportunities to include novel drying technologies have arisen. Whether these technological approaches also affect the requirements for subsequent processes, such as vacuum drying by the reduction of residual moisture content, is yet to be determined.

4. Conclusions

The aim of this study was to evaluate novel drying technologies for their suitability for LIB cell drying and their potential to reduce the energy consumption and greenhouse gas emissions of LIB cell production. A total of ten drying technologies were identified and analysed for their potential to reduce cost, energy consumption, process time and improve electrode quality. Of these, two technologies have shown great benefits and potential for commercialisation in the coming years: NIR drying and laser drying. In particular, NIR drying appears promising as it has the potential to reduce energy consumption, process time and cost while being close to large-scale industrial applications. Both technologies have the potential to significantly reduce greenhouse gas emissions from LIB cell production: up to 2.63 million Mt of CO2eq can be saved by 2030 using NIR drying. This makes drying an effective approach to reducing energy consumption in LIB cell production over the coming years.
This study contributes to the scientific literature on sustainable LIB cell production with a comprehensive technology review of post-coating drying, assessing the economic, performance and quality potential as well as the TRL for each technology. The results of this study provide practical insights for industry and policy stakeholders by raising awareness of promising new technologies in LIB cell production.
A limitation of this study’s approach is the inherent subjectivity of expert interviews. Although this subjectivity ought to be minimized through cross-examinations, it cannot be completely ruled out. Another challenge is the identification of all relevant technological approaches. The authors conducted research to the best of their abilities, but a 100 percent accuracy rate cannot be promised, partly because emerging innovative technologies are guarded as corporate secrets.
However, these limitations do provide opportunities for further research. Future studies using a more quantitative approach can verify or complement these findings and further advance technological maturity. In addition, subsequent studies are needed to identify innovative technologies or breakthroughs in drying processes and other processes. This study can be considered a starting point for this endeavour.

Author Contributions

M.S.: writing—original draft, data curation, F.D.: writing—original draft, supervision, methodology, H.W.: writing—review and editing. All authors have read and agreed to the published version of the manuscript.

Funding

This research was funded by the German Federal Ministry of Education and Research (Grant no: 03XP0256).

Data Availability Statement

The data that support the findings of this study are available in the supporting information of this article.

Conflicts of Interest

The authors declare no conflicts of interest.

Appendix A

Table A1. Information on experts in the initial workshop.
No.Education LevelEducational BackgroundField of Expertise Relevant to This StudyWork
Experience
1Doctoral degreeMechanical EngineeringBattery production20–29 years
2Doctoral degreeMaterial ScienceBattery technology10–19 years
3Doctoral degreeProcess EngineeringDrying technology20–29 years
4Doctoral degreeElectrochemistryBattery chemistry10–19 years
5Doctoral degreeElectrochemistryBattery chemistry10–19 years
6Master of ScienceMechanical EngineeringBattery production20–29 years
7Master of ScienceMechanical EngineeringBattery production10–19 years
8Master of ScienceMechanical EngineeringDrying technology6–10 years
9Master of ScienceMechanical EngineeringEnergy technology6–10 years
10Master of ScienceElectrochemistryBattery chemistry6–10 years
11Master of ScienceElectrochemistryBattery chemistry2–5 years
12Master of ScienceEnvironmental SciencesEnvironmental technology2–5 years
In this table, the experts were sorted by educational level and work experience.

Appendix B

Table A2. Search terms applied in databases for data acquisition.
Data TypeDatabaseSearch Terms in Boolean OperatorsTotal HitsRemaining after First Screening Final Number of Sources
Scientific
Publications
(published between
2016 and 2022)
ScienceDirectli-ion AND (battery OR batteries) AND (manufacturing OR production) AND drying19,9043828
TITLE-ABS-KEY li-ion AND (battery OR batteries) AND drying32012
IEEExploreli-ion AND (battery OR batteries) AND drying61
TITLE-ABS-KEY li-ion AND (battery OR batteries) AND drying30
Wileyli-ion AND (battery OR batteries) AND (manufacturing OR production) AND drying17,1646
TITLE-ABS-KEY li-ion AND (battery OR batteries) AND drying103
Taylor & Francisli-ion AND (battery OR batteries) AND (manufacturing OR production) AND drying20301
TITLE-ABS-KEY li-ion AND (battery OR batteries) AND drying10
Springerli-ion AND (battery OR batteries) AND (manufacturing OR production) AND drying45212
TITLE-ABS-KEY li-ion AND (battery OR batteries) AND drying00
Patents
(published until
2022)
Espacenetli-ion AND (battery OR batteries) AND drying AND technology2875
industrial AND drying AND technology15,176274
Patbaseli-ion AND (battery OR batteries) AND drying AND technology7911
industrial AND drying AND technology398941
R&D projects
(launched in 2022 or before)
Googleli-ion battery electrode drying966
Description of the screening process
(1)
First screening of ‘Total Hits’:
The initial search results were sorted by relevance in the respective search engine. Only the top 100 results were then manually screened by a team of four research experts. The criteria for this screening process were overall fit to the subject and date. Each criterion was rated from 1 to 5, with 1 being the lowest and 5 being the highest. Only results with an average score ≥ 3 were considered.
(2)
Second screening to arrive at the ‘Final number of sources’:
For the second screening, the results were again analysed in depth using the same criteria, and only those with an average rating ≥ 4 were considered.

Appendix C

Table A3. Information on interviewed experts from public R&D institutions and industry.
No.Education LevelEducational BackgroundIndustry SectorWork
Experience
1Doctoral degreeMechanical EngineeringEquipment manufacturing30–39 years
2Doctoral degreeProcess EngineeringR&D in production technology20–29 years
3Master of ScienceElectronics and test systemsR&D in battery technology10–19 years
4Master of ScienceElectrochemistryR&D in battery production6–10 years
5Master of ScienceProcess EngineeringR&D in battery production6–10 years
6Bachelor of ScienceMechanical EngineeringEquipment manufacturing20–29 years
7Master of ScienceMechanical EngineeringEquipment manufacturing10–19 years
8Doctoral degreeMechanical EngineeringEquipment manufacturing20–29 years
9Master of ScienceProcess EngineeringBattery production6–10 years
10Master of ScienceMechanical EngineeringEquipment manufacturing20–29 years
11Doctoral degreeProcess EngineeringEquipment manufacturing20–29 years
12Master of ScienceElectrochemistryR&D in Battery production10–19 years
13Master of ScienceMechanical EngineeringR&D in Battery production6–10 years
14Doctoral degreeElectrochemistryR&D in battery technology10–19 years
15Master of ScienceElectrochemistryR&D in battery technology6–10 years
The order of the experts listed corresponds to the chronological order of the interviews conducted.

Appendix D

Table A4. Guideline for expert interviews from public R&D institutions and industry.
TopicQuestion
Technology overviewHow would you briefly explain the technology?
How would you explain the underlying physical principle?
Which partners or institutions participate in the development of this technology?
How would you assess the technological maturity?
What are the major advantages of the technology?
What are the major disadvantages currently and in the long term?
Competence of expertIn which way are you involved with the technology?
How many years of expertise do you have regarding this technology?
Process detailsWhat process steps are involved in the technology?
How does the technology differ from other drying technologies?
How is the process performance regarding
Drying speed?
OEE?
Process robustness?
What are requirements/restrictions?
safety requirements
area requirements (spatial footprint)
infrastructure requirements
product limitations (e.g., anode or cathode excluded)
Economic detailsHow does the technology compare (qualitative) to state-of-the-art drying with
operating cost and invest?
energy consumption?
maintenance?
personnel expenses?
Quality detailsDoes the technology (in comparison to state-of-the-art drying) positively or negatively affect
drying homogeneity?
porosity?
residual moisture?
other quality parameters?
OutlookHow would you estimate the amount of time and costs to reach marketability?
How much effort is required to integrate the technology into a production line (pilot and industrial scale)?
What plans do you have for the further development of the technology?
Do you know alternative technologies currently in development?
How can these be described and how do they differ?

References

  1. Sommerville, R.; Zhu, P.; Rajaeifar, M.A.; Heidrich, O.; Goodship, V.; Kendrick, E. A qualitative assessment of lithium ion battery recycling processes. Resour. Conserv. Recycl. 2021, 165, 105219. [Google Scholar] [CrossRef]
  2. Wessel, J.; Turetskyy, A.; Cerdas, F.; Herrmann, C. Integrated Material-Energy-Quality Assessment for Lithium-ion Battery Cell Manufacturing. Procedia CIRP 2021, 98, 388–393. [Google Scholar] [CrossRef]
  3. Scheller, C.; Schmidt, K.; Spengler, T.S. Effects of CO2-Penalty Costs on the Production and Recycling Planning of Lithium-Ion Batteries. Procedia CIRP 2021, 98, 643–647. [Google Scholar] [CrossRef]
  4. IEA. I.E.A. Global EV Outlook 2021. Available online: https://iea.blob.core.windows.net/assets/ed5f4484-f556-4110-8c5c-4ede8bcba637/GlobalEVOutlook2021.pdf (accessed on 23 June 2022).
  5. Statista Research Department. Projected Demand for Lithium-Ion Batteries Worldwide in EVs 2019–2030. 2021. Available online: https://www.statista.com/statistics/309570/lithium-ion-battery-market-in-electric-vehicles/ (accessed on 13 June 2022).
  6. World Economic Forum. A Vision for a Sustainable Battery Value Chain in 2030: Unlocking the Full Potential to Power Sustainable Development and Climate Change Mitigation. Available online: https://www3.weforum.org/docs/WEF_A_Vision_for_a_Sustainable_Battery_Value_Chain_in_2030_Report.pdf (accessed on 20 September 2022).
  7. Kosai, S.; Takata, U.; Yamasue, E. Natural resource use of a traction lithium-ion battery production based on land disturbances through mining activities. J. Clean. Prod. 2021, 280, 124871. [Google Scholar] [CrossRef]
  8. Degen, F.; Schütte, M. Life cycle assessment of the energy consumption and GHG emissions of state-of-the-art automotive battery cell production. J. Clean. Prod. 2022, 330, 129798. [Google Scholar] [CrossRef]
  9. Yuan, C.; Deng, Y.; Li, T.; Yang, F. Manufacturing energy analysis of lithium ion battery pack for electric vehicles. CIRP Ann. 2017, 66, 53–56. [Google Scholar] [CrossRef]
  10. Jinasena, A.; Burheim, O.S.; Strømman, A.H. A Flexible Model for Benchmarking the Energy Usage of Automotive Lithium-Ion Battery Cell Manufacturing. Batteries 2021, 7, 14. [Google Scholar] [CrossRef]
  11. Degen, F. Lithium-ion battery cell production in Europe: Scenarios for reducing energy consumption and greenhouse gas emissions until 2030. J Ind. Ecol. 2023, 27, 964–976. [Google Scholar] [CrossRef]
  12. Von Drachenfels, N.; Husmann, J.; Khalid, U.; Cerdas, F.; Herrmann, C. Life Cycle Assessment of the Battery Cell Production: Using a Modular Material and Energy Flow Model to Assess Product and Process Innovations. Energy Tech. 2023, 11, 2200673. [Google Scholar] [CrossRef]
  13. Degen, F.; Krätzig, O. Future in Battery Production: An Extensive Benchmarking of Novel Production Technologies as Guidance for Decision Making in Engineering. IEEE Trans. Eng. Manag. 2024, 71, 1038–1056. [Google Scholar] [CrossRef]
  14. Simić, S.; Orašanin, G.; Golubović, D.; Milić, D.; Batinić, K. Consideration of Opportunities for the Optimization of Heat Energy Consumption in Industry and Energetics. In New Technologies, Development and Application II; Karabegović, I., Ed.; Springer International Publishing: Cham, Germany, 2020; pp. 494–503. ISBN 978-3-030-18071-3. [Google Scholar]
  15. Susarla, N.; Ahmed, S.; Dees, D.W. Modeling and analysis of solvent removal during Li-ion battery electrode drying. J. Power Sources 2018, 378, 660–670. [Google Scholar] [CrossRef]
  16. Wood, D.L.; Quass, J.D.; Li, J.; Ahmed, S.; Ventola, D.; Daniel, C. Technical and economic analysis of solvent-based lithium-ion electrode drying with water and NMP. Dry. Technol. 2018, 36, 234–244. [Google Scholar] [CrossRef]
  17. Von Horstig, M.-W.; Schoo, A.; Loellhoeffel, T.; Mayer, J.K.; Kwade, A. A Perspective on Innovative Drying Methods for Energy-Efficient Solvent-Based Production of Lithium-Ion Battery Electrodes. Energy Tech. 2022, 10, 2200689. [Google Scholar] [CrossRef]
  18. Chojnacka, K.; Mikula, K.; Izydorczyk, G.; Skrzypczak, D.; Witek-Krowiak, A.; Moustakas, K.; Ludwig, W.; Kułażyński, M. Improvements in drying technologies—Efficient solutions for cleaner production with higher energy efficiency and reduced emission. J. Clean. Prod. 2021, 320, 128706. [Google Scholar] [CrossRef]
  19. Barrozo, M.A.S.; Mujumdar, A.; Freire, J.T. Air-Drying of Seeds: A Review. Dry. Technol. 2014, 32, 1127–1141. [Google Scholar] [CrossRef]
  20. Ahmed, S.; Nelson, P.A.; Gallagher, K.G.; Dees, D.W. Energy impact of cathode drying and solvent recovery during lithium-ion battery manufacturing. J. Power Sources 2016, 322, 169–178. [Google Scholar] [CrossRef]
  21. Bichon, M.; Sotta, D.; Dupré, N.; de Vito, E.; Boulineau, A.; Porcher, W.; Lestriez, B. Study of Immersion of LiNi0.5Mn0.3Co0.2O2 Material in Water for Aqueous Processing of Positive Electrode for Li-Ion Batteries. ACS Appl. Mater. Interfaces 2019, 11, 18331–18341. [Google Scholar] [CrossRef]
  22. Ford, D. Develop your Technology Strategy. Long Range Plan. 1988, 21, 85–95. [Google Scholar] [CrossRef]
  23. Gregory, M.J. Technology Management: A Process Approach. Proc. Inst. Mech. Eng. Part B J. Eng. Manuf. 1995, 209, 347–356. [Google Scholar] [CrossRef]
  24. Hamzeh, R.; Xu, X. Technology selection methods and applications in manufacturing: A review from 1990 to 2017. Comput. Ind. Eng. 2019, 138, 106123. [Google Scholar] [CrossRef]
  25. Efstathiades, A.; Tassou, S.A.; Oxinos, G.; Antoniou, A. Advanced manufacturing technology transfer and implementation in developing countries. Technovation 2000, 20, 93–102. [Google Scholar] [CrossRef]
  26. Huang, G.Q.; Mak, K.L. Current practices of engineering change management in UK manufacturing industries. Int. J. Oper. Prod. Manag. 1999, 19, 21–37. [Google Scholar] [CrossRef]
  27. Fleischer, T.; Decker, M.; Fiedeler, U. Assessing emerging technologies—Methodological challenges and the case of nanotechnologies. Technol. Forecast. Soc. Change 2005, 72, 1112–1121. [Google Scholar] [CrossRef]
  28. Gavankar, S.; Suh, S.; Keller, A.A. The Role of Scale and Technology Maturity in Life Cycle Assessment of Emerging Technologies: A Case Study on Carbon Nanotubes. J. Ind. Ecol. 2015, 19, 51–60. [Google Scholar] [CrossRef]
  29. United States Department of Defence. Manufacturing Readiness Level (MRL) Deskbook—Version 2.0. Available online: https://www.dodmrl.com/MRL_Deskbook_V2.pdf (accessed on 20 March 2023).
  30. Bell, S.; Morse, S. Groups and facilitators within problem structuring processes. J. Oper. Res. Soc. 2013, 64, 959–972. [Google Scholar] [CrossRef]
  31. Nino, J.; Nelwan, L.O.; Purwanto, Y.A. Application of Natural Air Drying on Shelled Corn in Timor. IOP Conf. Ser. Earth Environ. Sci. 2018, 147, 12024. [Google Scholar] [CrossRef]
  32. Neb, D.; Kim, S.; Clever, H.; Dorn, B.; Kampker, A. Current advances on laser drying of electrodes for lithium-ion battery cells. Procedia CIRP 2022, 107, 1577–1587. [Google Scholar] [CrossRef]
  33. Heindl, A. Praxisbuch Horden- und Flächentrocknung; Springer: Berlin/Heidelberg, Germany, 2020; ISBN 978-3-662-60432-8. [Google Scholar]
  34. Bryntesen, S.N.; Strømman, A.H.; Tolstorebrov, I.; Shearing, P.R.; Lamb, J.J.; Stokke Burheim, O. Opportunities for the State-of-the-Art Production of LIB Electrodes—A Review. Energies 2021, 14, 1406. [Google Scholar] [CrossRef]
  35. Font, F.; Protas, B.; Richardson, G.; Foster, J.M. Binder migration during drying of lithium-ion battery electrodes: Modelling and comparison to experiment. J. Power Sources 2018, 393, 177–185. [Google Scholar] [CrossRef]
  36. Jaiser, S.; Müller, M.; Baunach, M.; Bauer, W.; Scharfer, P.; Schabel, W. Investigation of film solidification and binder migration during drying of Li-Ion battery anodes. J. Power Sources 2016, 318, 210–219. [Google Scholar] [CrossRef]
  37. Westphal, B.; Bockholt, H.; Günther, T.; Haselrieder, W.; Kwade, A. Influence of Convective Drying Parameters on Electrode Performance and Physical Electrode Properties. ECS Trans. 2015, 64, 57–68. [Google Scholar] [CrossRef]
  38. Umweltbundesamt. Carbon Dioxide Emissions for the German Atmospheric Emission Reporting 1990–2020. Available online: https://www.umweltbundesamt.de/sites/default/files/medien/361/dokumente/co2_ef_liste_2022_brennstoffe_und_industrie_final.xlsx (accessed on 15 March 2023).
  39. European Environment Agency. Greenhouse Gas Emission Intensity of Electricity Generation by Country. Available online: https://www.eea.europa.eu/data-and-maps/daviz/co2-emission-intensity-9#tab-googlechartid_googlechartid_googlechartid_googlechartid_chart_11111 (accessed on 10 June 2022).
Figure 1. Share of energy consumption for processes in battery cell production [8].
Batteries 10 00064 g001
Figure 2. Schematic diagram of LIB electrode drying process [16].
Batteries 10 00064 g002
Figure 3. Assessment criteria to rate LIB electrode drying clustered to KPIs and ranked by relevance. Assessment criteria written in grey are not included in the study to reduce complexity.
Batteries 10 00064 g003
Figure 4. Cumulative technology rating as a function of the TRL.
Batteries 10 00064 g004
Figure 5. Evaluation of hot air drying, NIR drying and laser drying.
Batteries 10 00064 g005
Table 1. Rating scheme for drying technologies.
++Much higher potential than reference(5 points)
+Higher potential than reference(4 points)
0Same potential as the reference(3 points)
-Lower potential than reference(2 points)
--Much lower potential than the reference(1 point)
?Not enough reliable information available for a rating(0 points)
n/aTechnology serves as a reference and is, therefore, not rated
Table 2. Rating of drying technologies.
Physical
Mechanism
TechnologyRating
TRLEconomic and Ecological PotentialProcess Performance PotentialQuality Potential
ConvectionHot air drying9n/an/an/a
Air drying1+--+
Electromagnetic wavesMicrowave drying3?+--
Near-infrared drying (NIR)6+++++
Laser drying4+++
OthersConduction drying40-?
Induction drying10??
High-frequency drying1-+--
Freeze drying2----+
Compression drying1???
Table 3. Effect of novel drying technologies on annual energy consumption and GHG emissions in 2030.
Drying TechnologyEnergy Saving PotentialEnergy Consumption
(kWh/kWh Cell Capacity)
GHG Emissions in 2030
(Metric Ton CO2eq/a)
Hot air drying (status quo)0%10.09 kWh natural gas3.400 million Mt CO2eq/a
0.92 kWh electricity
NIR drying80%2.204 kWh electricity0.773 million Mt CO2eq/a
Laser drying50%5.51 kWh electricity1.933 million Mt CO2eq/a
Assumptions: Energy saving potential in relation to hot air drying, energy consumed in form of electricity, energy consumption for hot air drying as baseline [8], 0.2 kg CO2eq/kWh natural gas [38], 0.23 kg CO2eq/kWh electricity [39] (European average in 2020), 1525 GWh annual LIB production in 2030 [5].
Disclaimer/Publisher’s Note: The statements, opinions and data contained in all publications are solely those of the individual author(s) and contributor(s) and not of MDPI and/or the editor(s). MDPI and/or the editor(s) disclaim responsibility for any injury to people or property resulting from any ideas, methods, instructions or products referred to in the content.

