Article

Adaptive Integrated Thermal Management System for a Stable Driving Environment in Battery Electric Vehicles

1
Department of Mechanical and Automotive Engineering, Kongju National University, 1223-24, Cheonan-daero, Seobuk-gu, Cheonan-si 31080, Republic of Korea
2
Department of Future Convergence Engineering, Kongju National University, 1223-24, Cheonan-daero, Seobuk-gu, Cheonan-si 31080, Republic of Korea
3
Department of Future Automotive Engineering, Kongju National University, 1223-24, Cheonan-daero, Seobuk-gu, Cheonan-si 31080, Republic of Korea
4
Institute of Green Car Technology, Kongju National University, 1223-24, Cheonan-daero, Seobuk-gu, Cheonan-si 31080, Republic of Korea
*
Author to whom correspondence should be addressed.
Batteries 2024, 10(2), 59; https://doi.org/10.3390/batteries10020059
Submission received: 26 December 2023 / Revised: 8 February 2024 / Accepted: 12 February 2024 / Published: 15 February 2024

Abstract

:
With an increase in global warming, battery electric vehicles (BEVs), which are environmentally friendly, have been rapidly commercialized to replace conventional vehicles with internal combustion engines. Unlike traditional internal combustion engine vehicles, the powertrain system of BEVs operates with high efficiency, resulting in lower heat generation. This poses a challenge for cabin heating under low-temperature conditions. Conversely, under high-temperature conditions, the operating temperature of a high-voltage battery (HVB) is lower than the ambient air temperature, which makes cooling through ambient air challenging. To overcome these challenges, in this study, we proposed an integrated thermal management system (ITMS) based on a heat pump system capable of stable thermal management under diverse climatic conditions. Furthermore, to assess the ability of the proposed ITMS to perform thermal management under various climatic conditions, we integrated a detailed powertrain system model incorporating BEV specifications and the proposed ITMS model based on the heat pump system. The ITMS model was evaluated under high-load-driving conditions, specifically the HWFET scenario, demonstrating its capability to perform stable thermal management not only under high-temperature conditions, such as at 36 °C, but also under low-temperature conditions, such as at −10 °C, through the designated thermal management modes.

1. Introduction

1.1. Research Background

Since the Industrial Revolution up to the present day, the automotive industry has evolved, focusing on internal combustion engine vehicles powered by fossil fuels. In recent times, regulations on internal combustion engine vehicles have gradually expanded, as greenhouse gases generated through the combustion reactions in these vehicles are increasingly recognized as a major contributor to global warming. In response to these regulations, global automotive manufacturers have accelerated their research and development efforts toward environmentally friendly vehicles that do not emit greenhouse gases [1,2,3]. Among environmentally friendly vehicles, battery electric vehicles (BEVs) have gained considerable attention, constituting approximately 6.2% of the global automotive market, because of their high energy efficiency and convenient charging accessibility [4,5]. However, the commercial adoption of BEVs is limited owing to technical issues, such as a reduced driving range during winter, which is attributed to rapid power consumption for cabin heating [6,7]. The thermal management system of BEVs is identified as the primary cause of reduced driving range.
Thermal management systems of traditional internal combustion engine vehicles can heat the cabins under low-temperature conditions based on the high operating temperature and waste heat of the internal combustion engine. Under high-temperature conditions, the cabin is cooled using an air-conditioning system. However, BEVs, which have relatively lower operating temperatures for the powertrain and higher energy efficiency, require an independent additional heat source because they cannot sufficiently supply heat for cabin heating.
In general, to achieve the cabin heating performance levels demanded by passengers, a positive temperature coefficient (PTC) heater is employed in BEVs [8,9,10,11]. PTC heaters are known for their high heat dissipation capability and rapid responsiveness, with reported efficiencies reaching approximately 90% of their input electrical energy [8]. Therefore, using only a PTC heater for cabin heating can satisfy the heating demand and ensure thermal comfort. However, because of its substantial energy consumption, relying solely on a PTC heater for cabin heating in low-temperature climates can shorten the driving range of a BEV by up to 60% [12,13,14]. For this reason, global automotive manufacturers have accelerated the research and development of heat pump systems with a coefficient of performance (COP) of >1. This is aimed at improving the heating efficiency of BEVs under low-temperature conditions and securing an enhanced driving range in terms of the amount of heat provided compared with the amount of energy consumed [15,16]. A heat pump is a heat transfer system designed to absorb heat from a low-temperature heat source and release it into a high-temperature heat source by utilizing the latent heat generated during the phase change of the refrigerant. It fundamentally consists of a compressor, condenser, expansion valve, and evaporator. The working fluid used is a refrigerant capable of evaporating at relatively low temperatures and condensing at high temperatures compared with common fluids. In a heat pump system, the refrigerant is expelled in a superheated vapor state through the compressor, which is the sole energy-consuming component of the closed system, and moves to the condenser. In the condenser, the refrigerant releases heat to the high-temperature heat source, causing it to reach a saturated liquid state and move to the expansion valve. After passing through the expansion valve, the refrigerant is subjected to a significant decrease in pressure, transitioning into a saturated liquid–vapor mixture state as it moves toward the evaporator. Subsequently, in the evaporator, the refrigerant absorbs heat from the low-temperature heat source, returns to the compressor, and determines the refrigerant flow rate within the closed system based on the pressure difference between the inlet and outlet of the compressor. This is a crucial parameter that influences heat transfer in the condenser and evaporator. The heat pump system, which moves the heat through phase changes within the closed system, always operates with a COP greater than 1 because the sum of the heat absorbed in the evaporator and the heat generated by the compressor is released to the condenser. Therefore, the COP is always greater than 1 during heating. Compared with PTC heaters with a COP less than 1, heat pump systems with a COP greater than 1 can reduce energy consumption. Thus, a heat pump system with a COP greater than 1 can minimize the reduction in the driving range for BEVs operating under low-temperature conditions by decreasing energy consumption.
However, the thermal management system of a BEV is not limited to the heating, ventilation, and air-conditioning (HVAC) systems for cabin cooling/heating. BEVs continuously generate heat not only from the high-voltage battery (HVB), which serves as energy storage during driving, but also from the power electronics (PE) module consisting of a motor and inverter. In particular, lithium-ion batteries, which are widely used in BEVs, are highly sensitive to the operating temperature. Consequently, if the operating temperature is lower than the standard temperature, energy losses occur because of a decrease in the energy capacity and an increase in the impedance [17,18]. By contrast, if the operating temperature exceeds the standard temperature, each 1 °C increase shortens the lifespan by approximately 2 months [19,20,21]. This leads to reduced charge/discharge efficiency, increased material loss, and accelerated electrolyte movement and poses the risk of fire and explosion owing to thermal runaway. Although the PE module is less temperature-sensitive than the HVB, operating outside the temperature range can lead to component damage, abnormal operation, and power loss [22,23].
Consequently, to ensure the stable operation of BEVs in various operating environments while minimizing the reduction in the driving range, an integrated thermal management system (ITMS) capable of simultaneously managing cabin heating/cooling, HVAC system, and thermal control for the HVB and PE modules is required. Furthermore, to evaluate the ITMS designed to comprehensively manage the thermal load of a BEV, it is essential to develop a sophisticated evaluation model. This model should be based on the driving conditions and load profiles of the BEV to assess the capability of the system for integrated thermal management.

1.2. Research Survey

Researchers worldwide have conducted several studies to develop and enhance the ITMS for BEVs operating under diverse conditions. Sun et al. developed a heat-pump-based thermal management system model that optimizes the efficiency of the heat management system by intricately considering the shape of the cabin [24]. The researchers integrated the cabin and the heat pump system and analyzed the cooling/heating performance of the cabin through the heat pump system. However, this has the limitation that the thermal load imposed on the heat pump system is limited to the cabin and the thermal load of the powertrain system generated during vehicle driving is not considered. In contrast, Miri et al. performed detailed modeling of the powertrain system for electric vehicles [25]. The powertrain system model predicts the possible driving distance by predicting the energy load applied to the powertrain system as the vehicle drives at a speed profile based on detailed specifications of the vehicle’s chassis, motor, tires, brakes, etc. These models have the advantage of being able to predict in detail the load applied to the powertrain system when the vehicle is driven. However, there is a limitation in that it does not take into account the change in energy consumption according to the operating temperature of the battery and motor and the energy consumption due to operating the thermal management system. Although they account for a significant portion of the energy consumption of electric vehicles, they are not considered, making it difficult to accurately predict the driving range of electric vehicles. In Harihara et al., to predict the mileage of a BEV, a model that can predict energy load by applying powertrain specifications and an algorithm that can predict the load of the HVAC system by performing thermal management of the cabin are integrated to reduce energy consumption due to vehicle driving [26]. We developed an integrated predictive model. These integrated models can predict energy consumption for electric vehicles in more detail than considering only the load on the powertrain system as the vehicle is driven or the load as the cabin is heated or cooled. However, actual electric vehicles also require thermal management of the battery and motor, and additional energy consumption is required to perform thermal management. Therefore, the model presented in this study also needs to be improved. Singirikonda et al. developed an integrated system model for BEVs by predicting the thermal load of the powertrain system as the vehicle tracks the driving cycle and integrating it with an ITMS that integrates the HVAC flow path and the flow path for cooling electric components [27]. The model was able to demonstrate the ability to perform thermal management for electrical components and cabins under various outdoor temperature conditions, such as −10 to 40 °C. However, since this model does not have a heat pump system, it has the limitation of using high energy in the PTC heater in low-temperature climate conditions to meet the heating capacity for cabin heating. In summary, the current energy consumption for BEVs largely consists of two systems: the powertrain system for driving the vehicle and the ITMS for thermal management of the electrical components and cabin. However, there is a lack of models that integrate both, and a BEV integrated system model that reflects the detailed specifications of the ITMS system and powertrain system using a high-efficiency heat pump method is lacking.

1.3. Motivation and Novelty

The model developed in this study is a BEV integrated system model that integrates the powertrain system and heat-pump-based ITMS considering the detailed specifications of the BEV. The powertrain system predicts the thermal load as the vehicle tracks its driving cycle, taking into account detailed specifications and operating temperature of the battery, PE module, vehicle chassis, tires, and brakes. ITMS is a model that integrates the HVAC loop, HVB thermal management loop, and PE module thermal management loop and is designed to perform stable thermal management for the thermal load generated as the vehicle is driven in various climate conditions. The configured HVAC loop operates as a heat pump system with R1234yf used as the working fluid. Although conventional vehicles commonly use nontoxic, noncorrosive, and nonflammable R134a, which belongs to the hydrofluorocarbon family, its high global warming potential (GWP) of 1430 has led to its designation as a restricted substance under the Mobile Air Conditioning Directive introduced by the EU [28]. Therefore, a commonly used working fluid, namely, R1234yf of the hydrofluoro olefin series, with a GWP of 4 and an operating pressure similar to that of R134a, was selected as the working fluid for the HVAC loop in this study [29]. The HVAC loop, based on the principles of the Clausius–Clapeyron, Peng–Robinson, and Hankinson–Thomson equations, controls the pressure of the working refrigerant R1234yf to change the evaporating and condensing points. In addition, the ITMS proposed in this study performs cooling to HVB using HVAC flow paths through which refrigerant flows, considering that the air temperature is relatively higher than the operating temperature of HVB under high-temperature climatic conditions. By contrast, under low-temperature conditions, where the atmospheric air is sufficiently cool for effective cooling, conventional methods often utilize atmospheric air for cooling. However, considering the increased load for cabin heating under low-temperature conditions, the proposed system uses a heat pump to absorb the heat generated in the HVB and PE modules for cabin heating. The HVB and PE module thermal management loops are circuits designed to actively control the operating temperatures of the HVB and PE modules by utilizing a chiller and a radiator. These circuits use a mixed coolant (ratio of water to ethylene glycol = 50:50) as the working fluid, which has been reported to achieve stable and efficient cooling performance under various climatic conditions [29,30].
As a result, in this study, we developed an ITMS model based on the BEV’s powertrain system and a directly designed heat pump and then applied integrated control logic to realize integration of the entire BEV, which is generated as the BEV runs in various climate environments. It demonstrates the ability to perform stable integrated thermal management in response to changes in thermal load.
The remainder of this paper is organized as follows: in Section 2, we introduce a powertrain model capable of deriving the thermal load due to driving based on the detailed specifications of the components in the BEV powertrain system, including the HVB, PE module, and vehicle body. Subsequently, we provide an overview of the heat-pump-system-based HVAC circuit, the HVB cooling circuit for the thermal management of the HVB, the PE module cooling circuit for the thermal management of the PE module, and an ITMS model combining these circuits. In Section 3, we describe the evaluation of the characteristics of the thermal management system in response to BEV operation under various climatic conditions and driving cycles. We assessed the adaptability of the ITMS to respond actively to different scenarios. Finally, in Section 4, we summarize and discuss the results of the ITMS evaluation.

2. Simulations Methods

2.1. Powertrain System Model

The ITMS of a BEV is a comprehensive system designed to manage not only cabin heating and cooling but also the operating temperatures of powertrain components. Therefore, to evaluate the ITMS model, a powertrain system model is required to calculate the thermal load on powertrain components as the vehicle operates and applies heating/cooling effects. In this study, we configured a powertrain system model, which is shown in Figure 1. The constructed powertrain system is broadly divided into Matlab/Simulink®-based models for the HVB and vehicle control unit (VCU); and Matlab SimscapeTM-based models for the PE, reducer, DC/DC converter, low-voltage battery (LVB), electrical loads, and vehicle dynamics. During operation, the electrical energy stored in the HVB is supplied to two locations the inverter and DC/DC converter in the form of DC electrical energy through the VCU. Subsequently, the electrical energy supplied to the inverter is converted into a 3-phase AC form and supplied to the permanent magnet synchronous motor (PMSM), and a rotational force is generated by creating a rotating magnetic field. The torque and rotational force generated by the PMSM are then reduced by a reducer to drive the wheels. Additionally, the electrical energy reduced through the DC/DC converter charges the LVB and supplies power to the headlamps, wipers, and thermal management system.

2.1.1. High-Voltage Battery Model

The HVB model consists of an HVB pack that stores electrical energy for the vehicle operation. To manage changes in specifications and configurations flexibly, mathematical modeling was performed based on a 2-RC equivalent circuit, as shown in Figure 2 [31]. Detailed specifications of the HVB model are listed in Table 1.
The modeling of the HVB was based on cell data collected from charge/discharge experiments conducted under conditions where the outside temperature was 25 °C and the cell operating temperatures were maintained at 20, 30, and 40 °C. The experiments involved charging at a 0.02 C-rate with a cut-off voltage of 4.2 V and discharging until the cell voltage reached the minimum cut-off voltage limit of 2.5 V. From these experiments, the resistance and time constant with respect to the state of charge (SOC) of the cell were determined, and the data were applied to the model through curve fitting. Therefore, the overall voltage of the HVB model was calculated as follows:
V H V B = V O C V S O C H V B I H V B ( R i + R c t ( 1 e t / T c t ) + R d i f f ( 1 e t / T d i f f ) )
where I is defined as a positive value during discharging and a negative value during charging. The SOC of the HVB was calculated by integrating the current; the Peukert effect was applied to account for the capacity variation with the charge/discharge current [32,33]. Therefore, the SOC of the HVB was calculated as follows:
S O C H V B = S O C i n i t i a l I K 1 d t A H · K 2
The charge transfer and diffusion time constants of the battery are calculated as follows:
T c t = R c t C d l
T d i f f = R d i f f C d i f f
The total heat generation of the battery was calculated using Bernadi’s heat generation model [34,35,36]. This model is used to calculate the sum of irreversible heat generation owing to ohmic losses and reversible heat generation owing to entropy changes during the reaction. Therefore, the heat generated by the battery was calculated as follows:
Q H V B = I 2 R t o t a l + I T H V B d V o c v d t
Q i r r = I 2 R t o t a l
Q r e v = I T d V o c v d t
The temperature of the battery was calculated considering the heat generated within the battery, heat transfer through convection with air, and heat transfer through conduction with the cooling water. Therefore, the battery temperature was calculated as follows:
T H V B = Q h g Q c o n v Q c o n d m H V B C p , H V B d t

2.1.2. Power Electronics Module Model

The PE module model was configured as a system-level model integrating the PMSM and inverter to reduce the simulation load. The specifications of the PMSM were modeled to have a maximum output of 125 kW and generate a maximum torque of 350 Nm, as shown in Figure 3. The PE module model receives voltage and current inputs from the HVB based on the target torque specified by the VCU. Subsequently, the motor rotates to generate torque and angular velocity, and the thermal load generated through the energy conversion process is managed by the thermal management system.

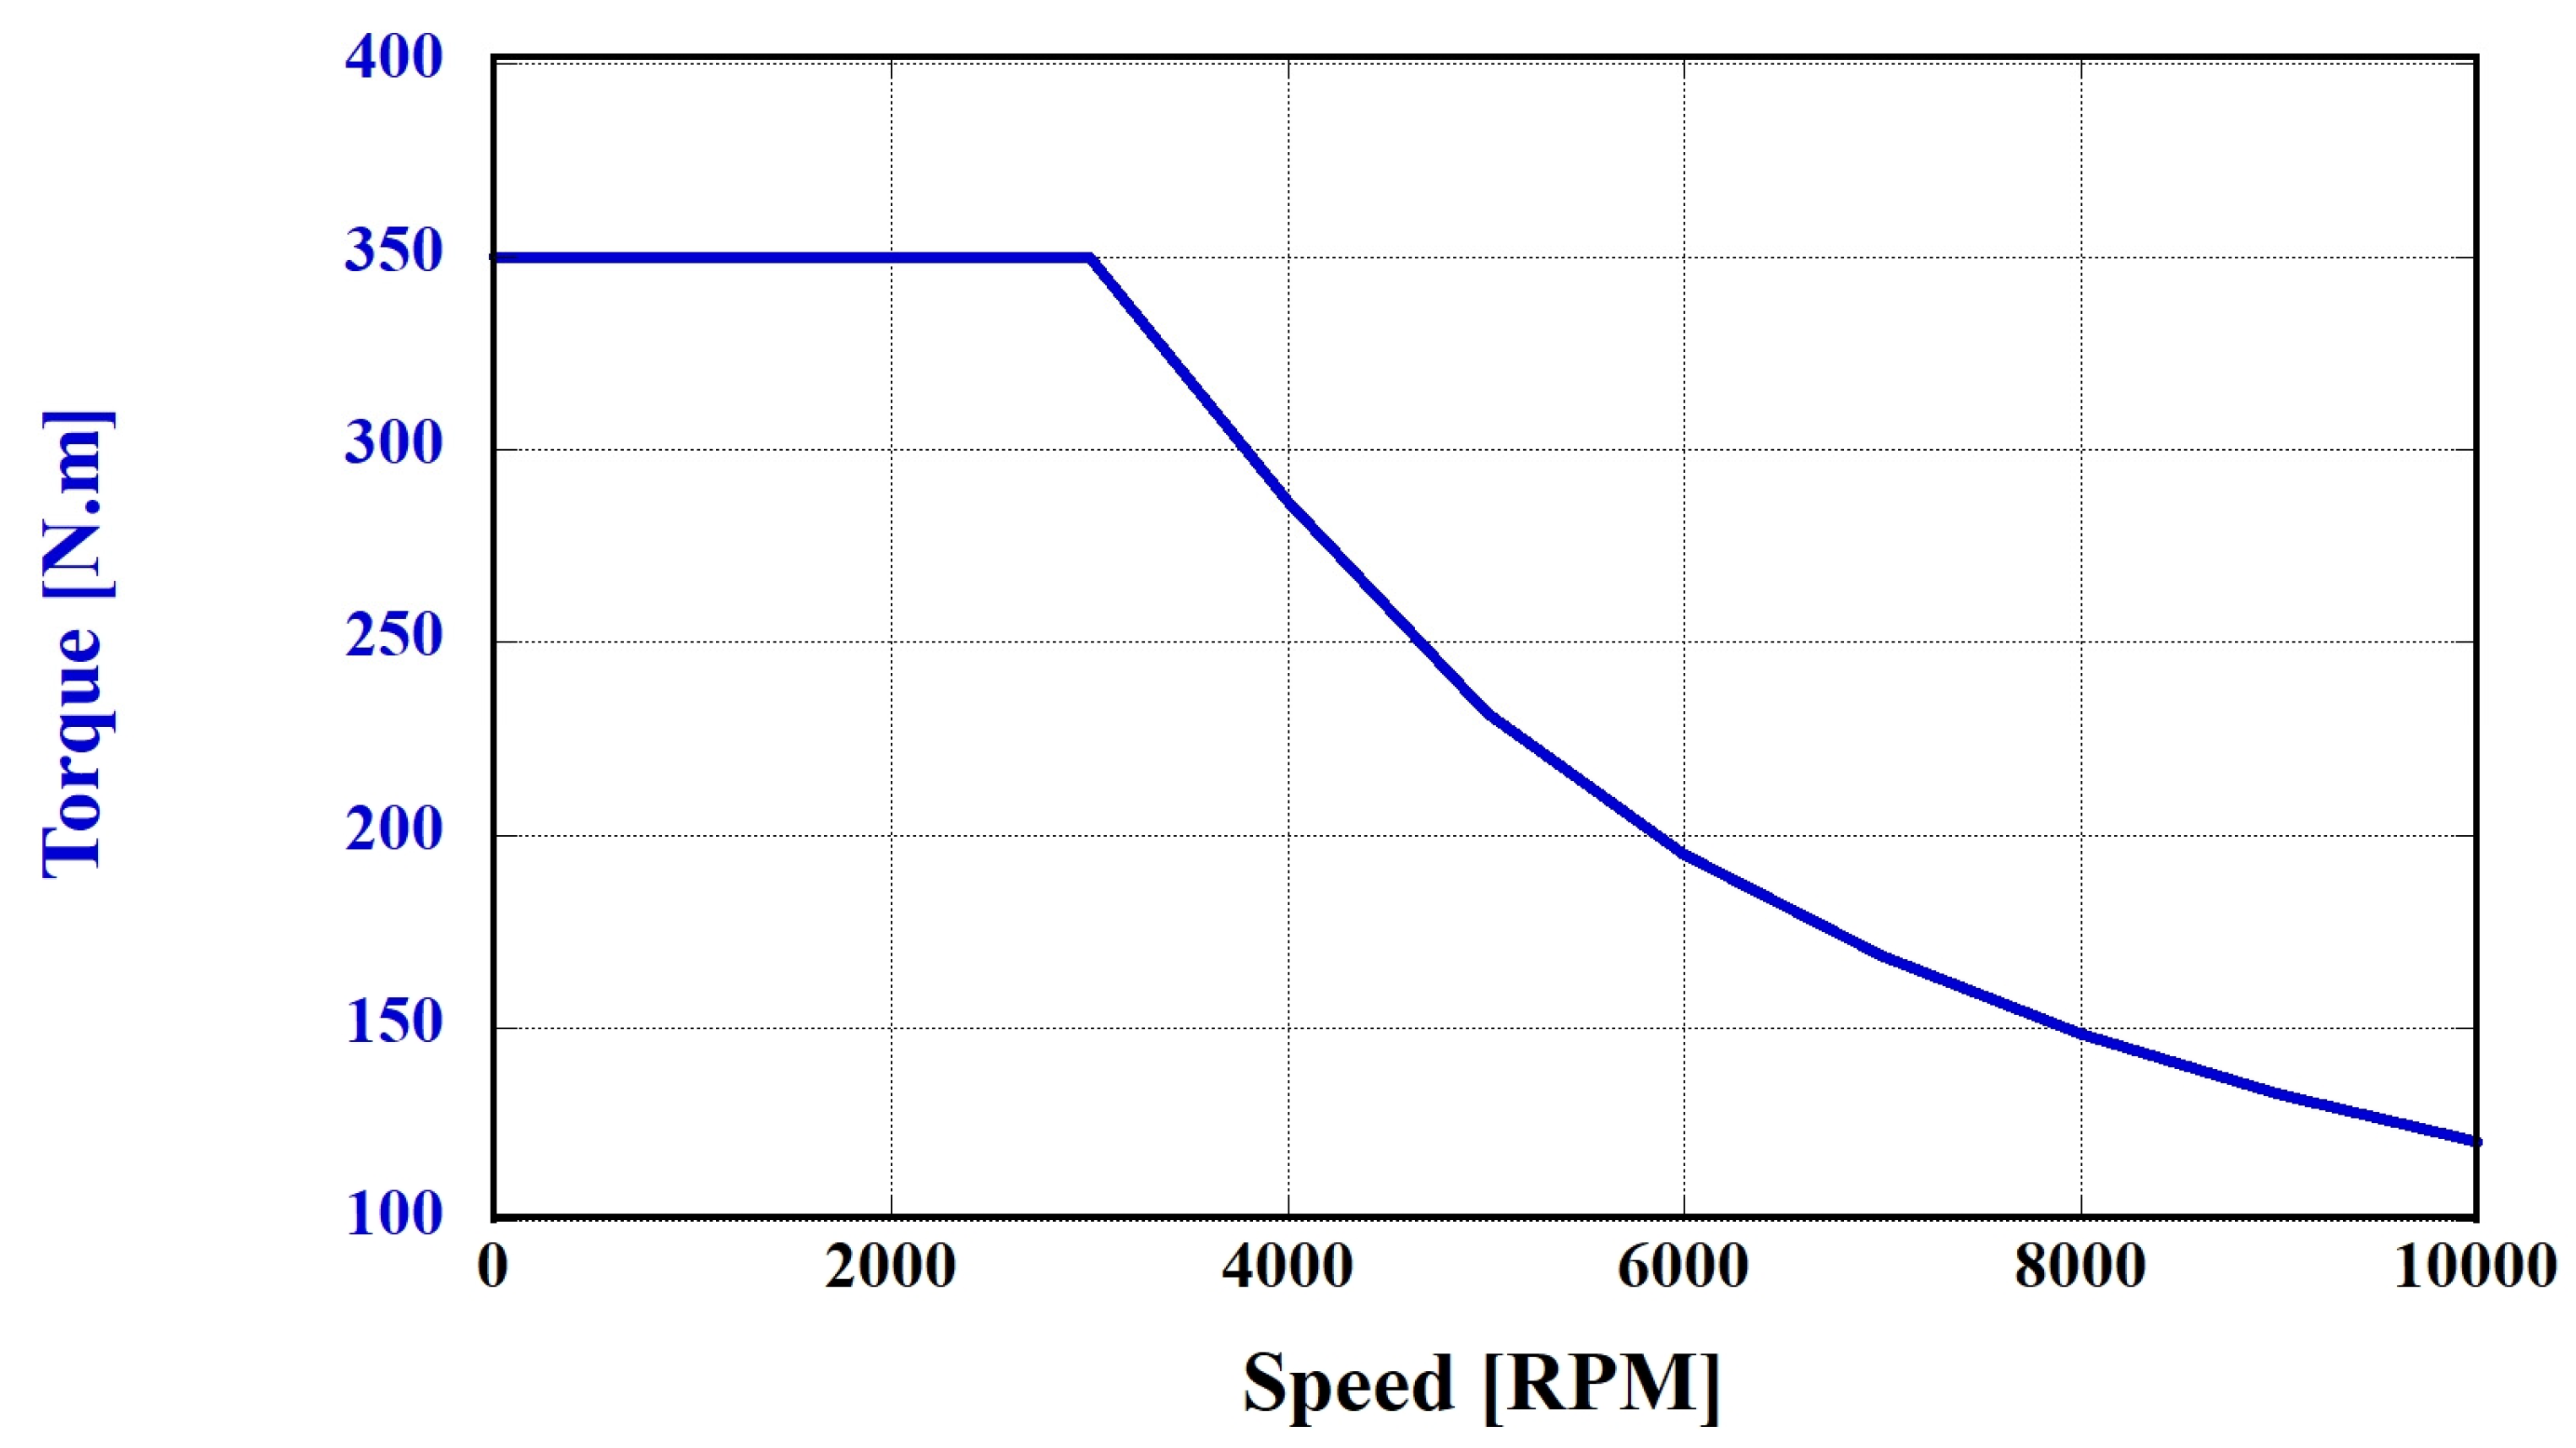
2.1.3. Reducer Model

The torque and rotational power generated by the PMSM are transmitted to the reducer. The reducer consists of a base gear connected to the PMSM and a follower gear connected to the drive shaft. The torque and angular velocity transmitted to the axle are determined using the set gear ratio. In this study, the gear ratio of the reducer was set to 7 and applied as follows:
g F B = r F r B = N F N B
The torque of the follower gear transmitted to the drive shaft through the reducer was calculated as follows:
τ F = τ l o s s g F B τ B

2.1.4. Vehicle Dynamic Model

The power transmitted through the reducer was inputted into the vehicle dynamic model. The specifications of the vehicle dynamic model are listed in Table 2. It represents the dynamic characteristics of a vehicle based on various resistances, including the power generated at the drive shaft centered on the center of gravity, towing force using the diameter of the tires, braking force through brakes, and various driving resistances, such as rolling resistance, gradient resistance, inertia resistance, and aerodynamic resistance. Using these inputs, the calculated total force acting on the vehicle is the driving force of the vehicle. Therefore, the total driving force was calculated as follows:
F x = F d r i v e F b r a k e F r e s i s t
F d r i v e = τ a x l e r t i r e
F b r a k e = F B t a n h ω a x l e ω 1
F r e s i s t = F t i r e c o s θ + F a i r tanh v x v 1 + m g s i n
This driving force determines the speed of the vehicle, and the calculated vehicle speed is integrated to track real-time position changes of the vehicle over time. Consequently, the vehicle speed was calculated as follows:
v v e h i c l e = F x / m v e h i c l e d t

2.1.5. DC/DC Converter, Low-Voltage Battery, and Electrical Loads Model

To ensure smooth operation of an actual vehicle, low-voltage auxiliary devices, such as wipers, headlights, and thermal management systems, are required. However, if low-voltage auxiliary devices receive high-voltage electrical energy discharged from the HVB, it may lead to circuit damage by exceeding the maximum rated voltage of the components, potentially resulting in a fire. Therefore, in the powertrain system model developed in this study, the components were configured to convert high-voltage electrical energy discharged from the HVB into low-voltage electrical energy using a DC/DC converter. Additionally, a 60 AH LVB was included to store the converted electrical energy and supply stable electrical energy to low-voltage load devices. Models for low-voltage load devices, referred to as electrical loads, were incorporated into the system. The voltage and current outputs from the DC/DC converter, which reduce the high-voltage electrical energy inputted from the HVB, were calculated as follows:
V o u t , D C = V i n , D C D u t y   C y c l e
I o u t , D C = I i n , D C / D u t y   C y c l e

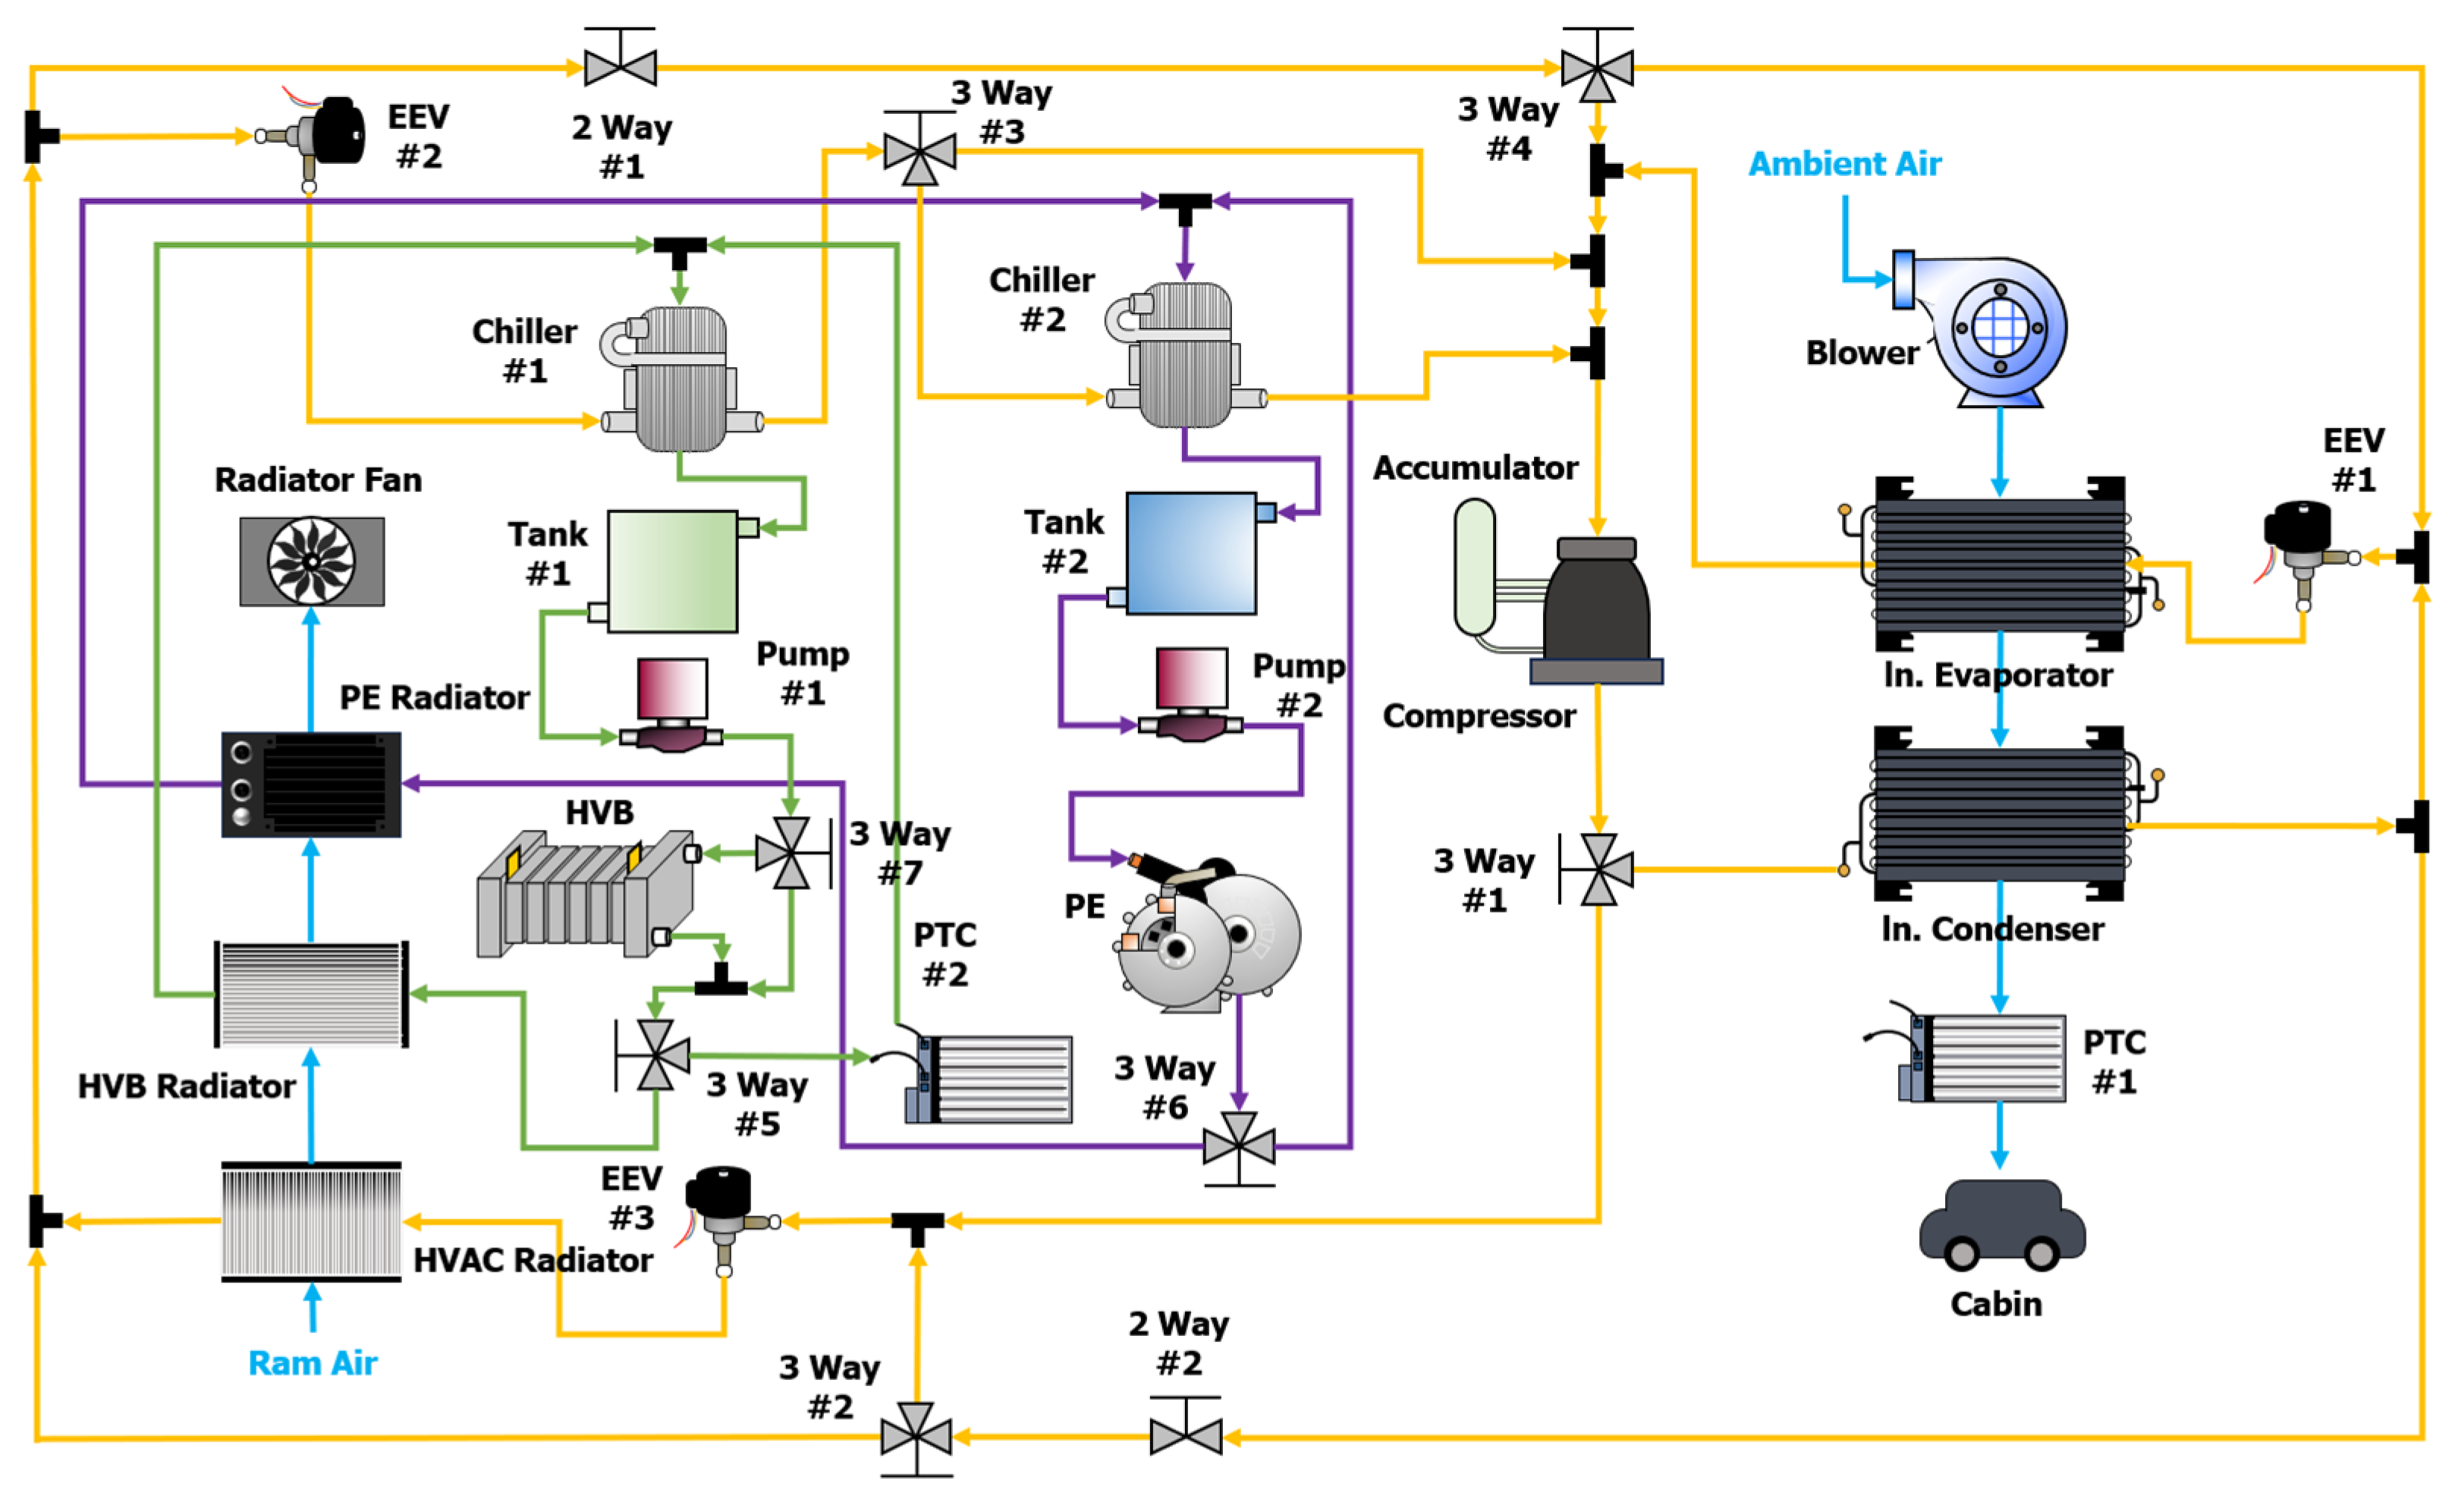
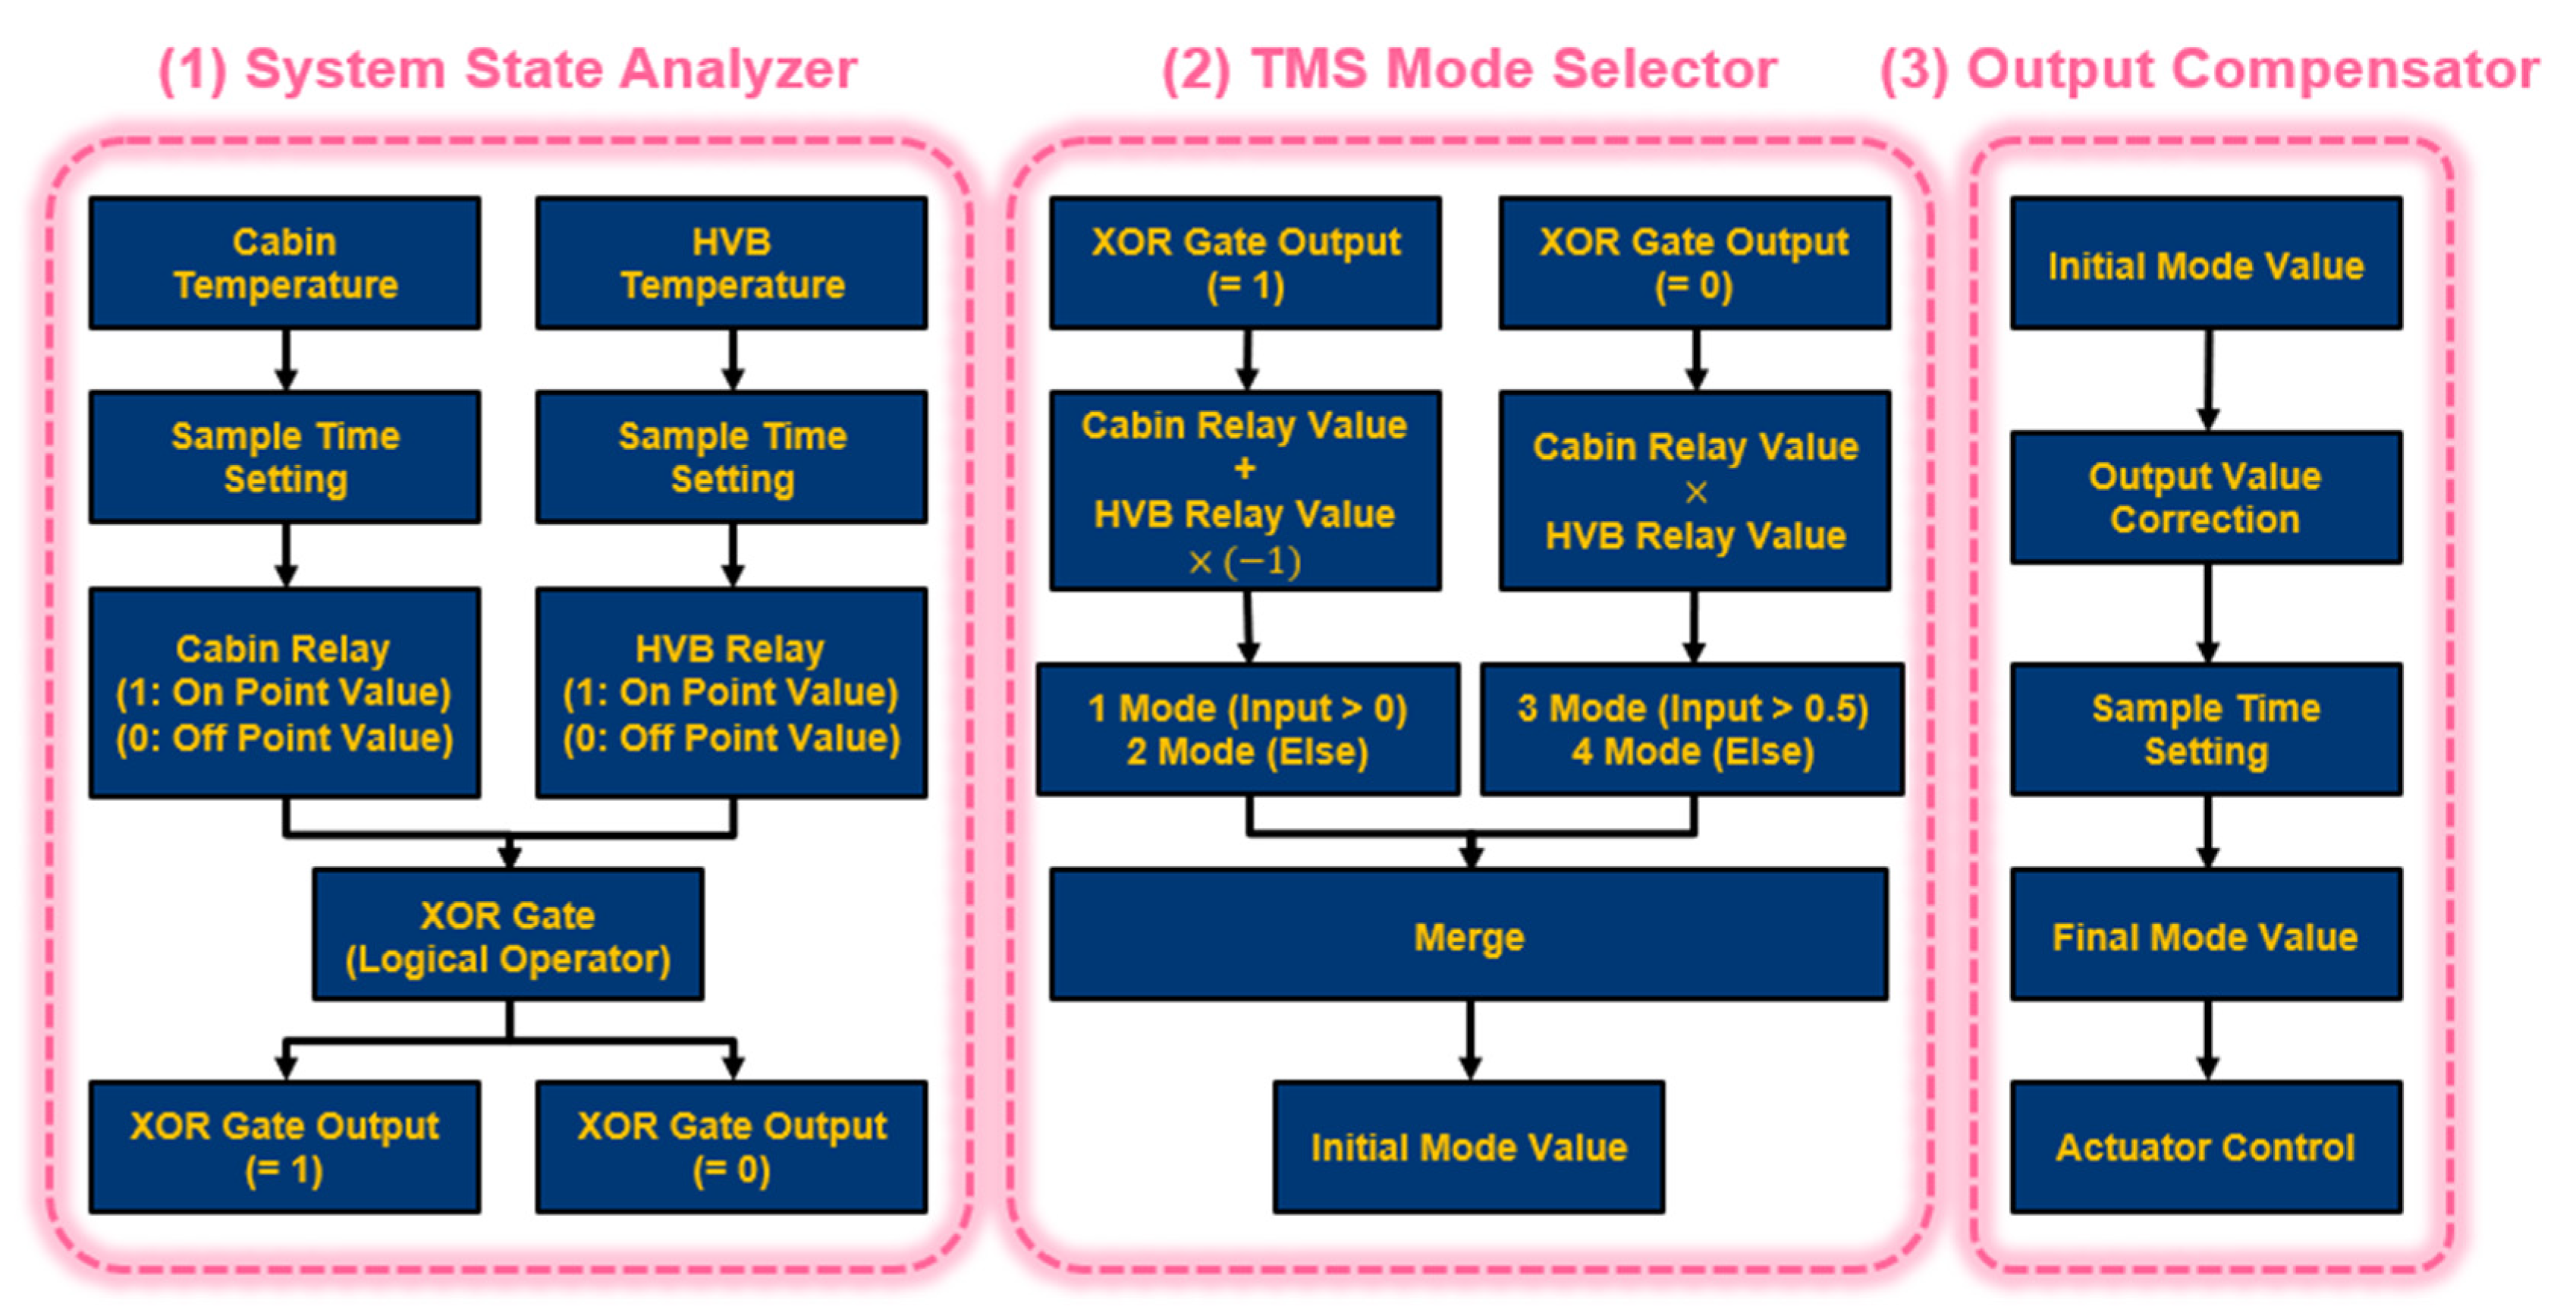
2.2. Integrated Thermal Management System Model

The proposed heat-pump-based ITMS for managing the operating temperatures of the HVB and PE modules as well as for cabin heating and cooling is depicted in Figure 4. The highlighted orange lines represent the HVAC circuit, green lines correspond to the thermal management circuit for the HVB, and purple lines indicate the thermal management circuit for the PE module.
The proposed ITMS was designed to operate in 15 thermal management modes, as summarized in Table 3, to effectively adapt to various climatic conditions. In this study, we focused on introducing modes 3, 5, 8, and 11. The thermal management modes were selected based on a rule-based logic, as illustrated in Figure 5, which considers the input temperatures from the cabin and HVB. The input temperatures are processed using relays to output binary values (1 or 0). The output of the XOR logic gate determines the selected thermal management mode, and the ITMS controls each component configured in the system according to the specified sample time.
The third and fifth thermal management modes, which operate as shown in Figure 6, are designed to address high-temperature climatic conditions under which the vehicle operates in situations that exceed the set temperature of the interior and the operating temperature of the HVB. Specifically, the third thermal management mode operates under conditions in which the operating temperature of the HVB is either below or at the minimum allowable operating temperature and below the maximum allowable operating temperature. When the ITMS operates in the third thermal management mode, the hot and high-pressure refrigerant discharged from the compressor passes through the radiator in the HVAC circuit and undergoes condensation. The condensed refrigerant then passes through electronic expansion valve (EEV) #1 at the cabin evaporator inlet, reaches a low-temperature and low-pressure state, cools the air transferred from the evaporator to the cabin, and returns to the compressor. Thus, the third thermal management mode primarily aims to provide cooling to cabins. By contrast, the fifth thermal management mode operates under conditions in which the operating temperature of the HVB reaches the maximum allowable operating temperature and is higher than the minimum allowable operating temperature. When the ITMS operates in the fifth thermal management mode, the hot and high-pressure refrigerant discharged from the compressor passes through the radiator in the HVAC circuit and undergoes condensation. The condensed refrigerant is then split into two paths: one for cabin cooling through EEV #1 and the other for HVB cooling through EEV #2. The refrigerant passing through EEV #2 returns to the compressor after cooling the cooling water on the HVB side through chiller #1. Therefore, the fifth thermal management mode performs cabin and HVB cooling.
The 8th and 11th thermal management modes are designed to perform thermal management, as shown in Figure 7, when the vehicle is driven under conditions in which the indoor set and HVB operating temperatures are below the normal range. The eighth thermal management mode is operated when the operating temperature of the HVB is either below the maximum allowable operating temperature or at the minimum allowable operating temperature and under conditions lower than the maximum allowable operating temperature. When the ITMS operates in the eighth thermal management mode, the high-temperature and high-pressure refrigerant discharged from the compressor undergoes condensation by releasing heat into the air, which is transferred to the cabin through the cabin-side condenser. The condensed refrigerant then passes through EEV #3, installed at the entrance of the HVAC-side radiator, reaching a low-temperature and low-pressure state. After absorbing heat from the outdoor air in the HVAC-side radiator, the refrigerant returns to the compressor. In summary, the eighth thermal management mode utilizes outdoor air as a heat source to provide cabin heating. Conversely, the 11th thermal management mode operates when the operating temperature of the HVB reaches the maximum allowable operating temperature and under conditions higher than the minimum allowable operating temperature. When the ITMS is operated in the 11th thermal management mode, the high-temperature and high-pressure refrigerant discharged from the compressor undergoes condensation by releasing heat to the air that is transferred to the cabin through the cabin-side condenser. After absorbing heat from the outdoor air in the HVAC-side radiator and waste heat from the HVB and PE through chillers #1 and #2, respectively, the refrigerant returns to the compressor. In summary, the 11th thermal management mode utilizes both outdoor air and waste heat from both the HVB and PE as heat sources for cabin heating.

2.2.1. Compressor Model

The compressor model was designed to generate refrigerant flow in the refrigerant loop by rapidly rotating the refrigerant by utilizing the created pressure difference. The outlet mass flow rate of the compressor was calculated by considering the rotation speed, density of the refrigerant, compression ratio, and volumetric efficiency as follows:
m ˙ o u t = N 60 ρ r e f V D η v
The flow work was calculated by applying the polytropic index, which reflects irreversibility, as shown below:
W ˙ f l o w = N 60 P i n V n n 1 P o u t P i n n 1 n 1
The power consumed by the compressor was calculated by applying isentropic efficiency as follows:
W ˙ c o m p = W ˙ f l o w / η k

2.2.2. Electric Expansion Valve Model

The EEV model was designed to regulate the pressure and temperature of the fluid passing through it by adjusting the area according to the specified expansion ratio. As the pressure and temperature decrease rapidly, a state capable of absorbing a significant amount of heat is created as the fluid passes through the heat exchanger. It also acts as a device to block the fluid flow. The pressure and temperature corresponding to the specified expansion ratio were decreased and discharged as follows:
T e e v , o u t = T e e v , i n z X T
P e e v , o u t = P e e v , i n z X P

2.2.3. Water Pump Model

The water pump model was designed to generate a coolant flow in the coolant loop by rapidly rotating the coolant and creating a pressure difference. The model was constructed using curve-fitting experimental data for the flow rate, power consumption, and efficiency based on the rotation speed of the water pump and the inlet/outlet pressure difference. The representative output of the pump model, that is, the mass flow rate, was calculated as follows:
m ˙ w p = a b s 1 0.0002983 99.74 × R P M w p 3500 2 P w p 0.016617

2.2.4. Chiller Model

A chiller effectively recovers waste heat from the cooling water, which cools various field components and cooling water. Therefore, the chiller model was based on a plate heat exchanger with a small volume and a large heat transfer area, allowing effective heat exchange when the refrigerant and cooling water pass through. It was modeled based on a plate heat exchanger with low pressure loss. The plate heat exchanger model was designed to derive the exit temperature and heat transfer rate of each fluid through heat exchange between the passing fluids; therefore, the ε-NTU method was used. The heat transfer effectiveness was calculated by considering the shape of the heat exchanger, such as channels and fins, as follows:
ε p l a t e = 1 e x p N T U 1 c 1 c   e x p N T U 1 c
c = C m i n C m a x
N T U = 1 C m i n R
Using the calculated heat transfer effectiveness, the heat transfer rate was calculated as follows:
Q ˙ p l a t e = ε Q ˙ m a x , p l a t e
Q ˙ m a x , p l a t e = C m i n T r e f , i n T c o o l , i n
As a result, the exit temperature of the fluid was calculated as follows:
T r e f , o u t = T r e f , i n Q ˙ p l a t e C r e f
T c o o l , o u t = T c o o l , i n + Q ˙ p l a t e C c o o l

2.2.5. Radiator, Condenser, and Evaporator Model

The radiator, condenser, and evaporator should effectively induce cooling or heating of the refrigerant or cabin through heat exchange between the gaseous air and the refrigerant. Therefore, in this study, the operating fluid was modeled based on a louvered fin heat exchanger that efficiently exchanges heat with a large heat transfer area in a small volume and less pressure loss during heat exchange with air. The louvered fin heat exchanger model was designed to derive the exit temperatures and heat transfer rates of each fluid through heat exchange between the passing fluids. The ε-NTU method was employed, considering the shape information of tubes, fins, and louvers in the model. However, owing to the shape differences from the previously described plate heat exchanger, the heat transfer effectiveness was calculated as follows:
ε l o u v e r = 1 e x p N T U 0.22 c exp c   N T U 0.78 1
Using the calculated heat transfer effectiveness, the heat transfer rate was calculated as follows:
Q ˙ l o u v e r = ε   Q ˙ m a x , l o u v e r
Q ˙ m a x , l o u v e r = C m i n T r e f , i n T c o o l , i n
As a result, the exit temperature of the fluid was calculated as follows:
T c o o l , o u t = T c o o l , i n Q ˙ l o u v e r C c o o l
T a i r , o u t = T a i r , i n + Q ˙ l o u v e r C a i r

2.2.6. Positive Temperature Coefficient Heater

The PTC heater model was designed to rapidly heat the passing fluid. The consumed power and characteristics of the PTC heater were calculated by converting the losses generated by supplying power to the resistive element into thermal energy based on thermal efficiency. This determines the amount of heat supplied to the operating fluid.
Q ˙ p t c = c m d × W ˙ p t c , m a x × η p t c
Q ˙ p t c , d y n a m i c = Q ˙ p t c 1 τ + 1
where c m d represents the on/off signal of the PTC heater and W ˙ p t c , m a x is the maximum power consumption of the PTC heater. The fluid temperature, calculated based on the generated heat, was determined as follows:
T o u t , p t c = Q ˙ p t c m ˙ p t c C p + T p t c , i n

2.2.7. Ram Air and Radiator Fan Model
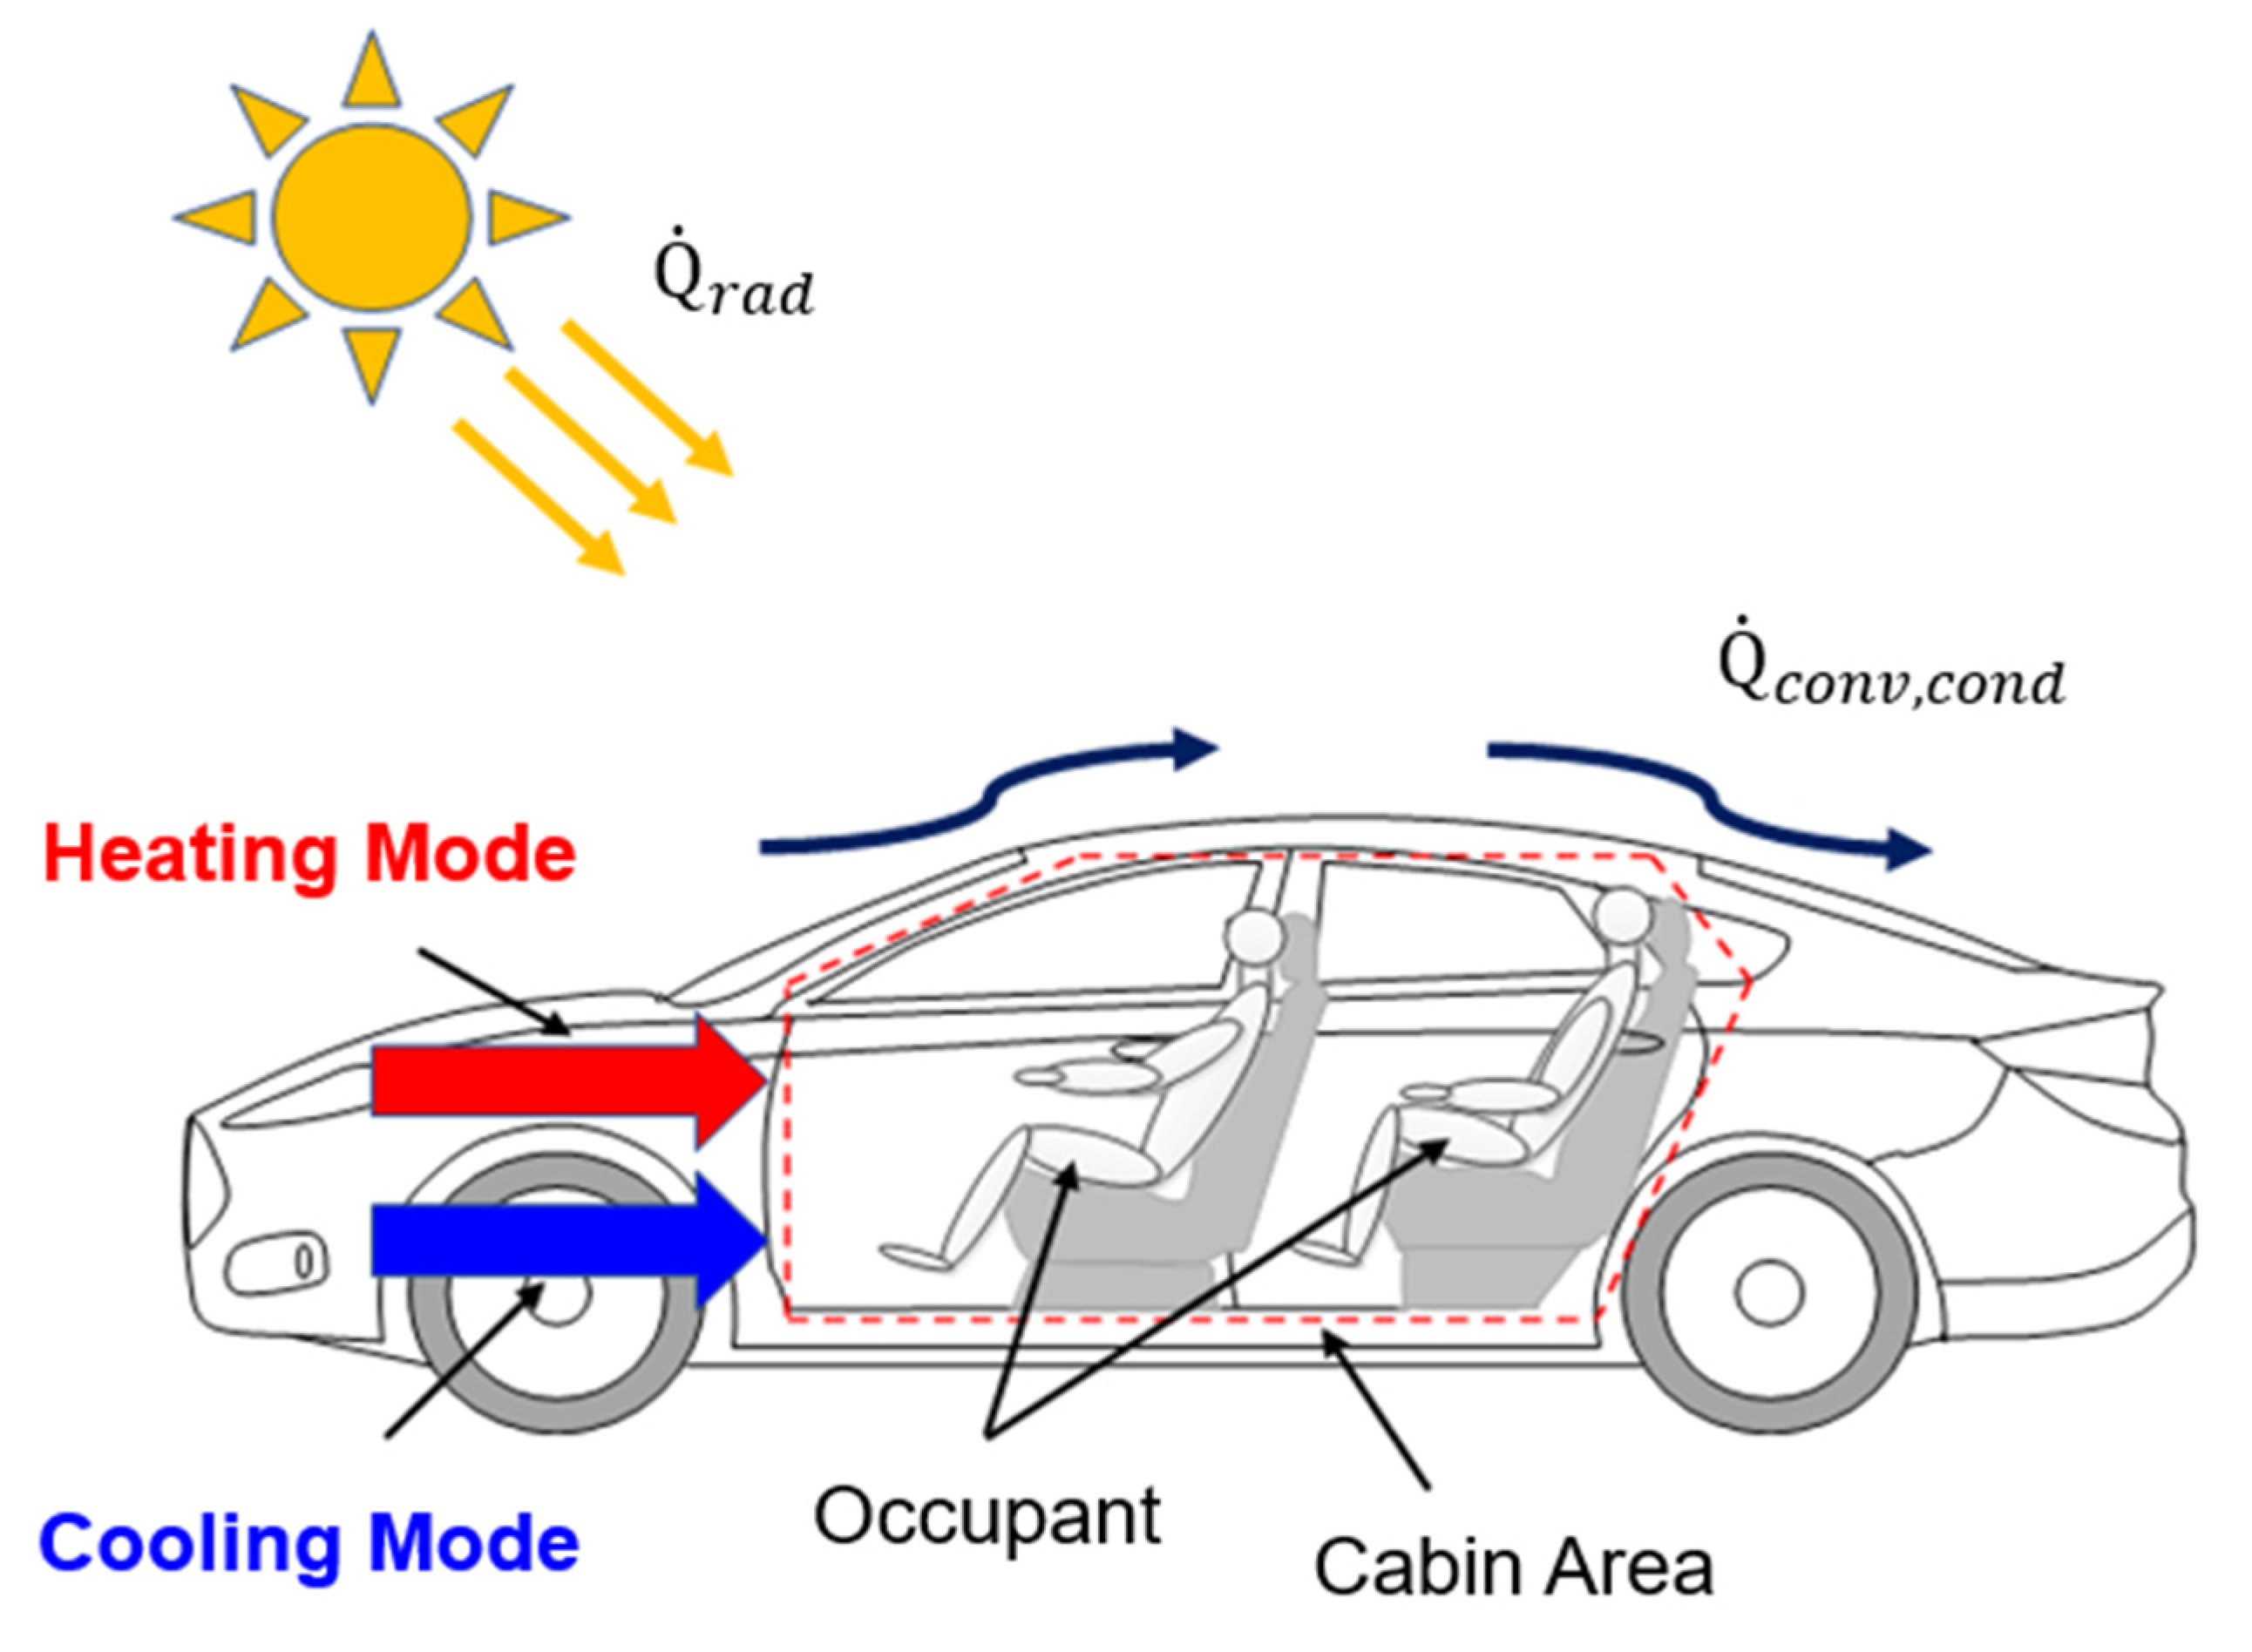
Cooling a vehicle using the air flowing through the front of the vehicle during operation is effective in reducing the weight and unnecessary energy consumption compared with liquid cooling. In this study, the ram air and radiator fan models were constructed to cool the vehicle in the following order: HVAC, low-temperature (LT), and high-temperature (HT) radiators using air flowing in from the front of the vehicle.
The ram air model calculates the airflow rate, velocity, and pressure of the air entering through the front based on the vehicle speed, as follows:
m ˙ r a m = W H V A C _ R a d i a t o r H H V A C _ R a d i a t o r ρ a i r v r a m
v r a m = v v e h i c l e 3.6
P r a m = 1 2 ρ a i r v r a m 2
The radiator fan model calculates the airflow rate, velocity, and pressure based on the shape of the fan and the rotational speed of the blades, as follows:
m ˙ f a n _ a i r = π ( r b l a d e 2 r h u b 2 ) v f a n _ a i r ρ a i r
v f a n _ a i r = 2 Φ m 2 π N 60 ( η h u b )
P f a n _ a i r = 1 2 ρ a i r v f a n _ a i r 2
where the flow rate coefficient, hub rate coefficient, and hub rate were calculated as follows:
Φ m = v a i r _ i n v b l a d e
η h u b = 1 φ h u b 2 1 + φ h u b 2
φ h u b = r h u b r b l a d e  

2.2.8. Cabin Model

The cabin model represents the controlled volume of the HVAC system in which the occupants are located. As depicted in Figure 8, the cabin model considers not only the heat transfer entering the cabin through the HVAC system but also the heat transfer through the cabin’s windows, doors, and roof; heat transfer from occupants; and solar radiation. Therefore, based on the shape information and heat transfer coefficients of the cabin, as presented in Table 4, resistance circuits for the windows, doors, and roofs were constructed to calculate the total thermal resistance. Subsequently, the heat transfer for each component, including windows, doors, and the roof, was calculated as follows:
R c a b i n , s h a p e = R c o n v , 1 + R c o n d + R c o n v , 2 = 1 h 1 A + L k A + 1 h 2 A
Q ˙ c a b i n , s h a p e = T c a b i n T a m b R + Q ˙ r a d
The total heat transfer to the cabin, considering the calculated heat transfer, heat transfer through the HVAC system, and heat transfer from the occupants in a comprehensive manner, was calculated as follows:
Q ˙ T o t a l = Q ˙ g l a s s + Q ˙ d o o r s + Q ˙ r o o f + Q ˙ h v a c + Q ˙ o c c u p a n t
The temperature inside the cabin was calculated by considering the total heat transfer to the cabin and its volume. The real-time temperature variation was then calculated through integration, as follows:
d T c a b i n d t = 1 ρ a i r C p , a i r V c a b i n Q ˙ t o t a l

2.2.9. HVB and PE Module Cooling Channel Model

To integrate the Matlab/SimscapeTM-based powertrain system model and Matlab/Simulink®-based thermal management system model developed in this study, the cooling channel models for the HVB and PE modules utilized both physical and mathematical blocks. The heat generated by the HVB and PE modules was modeled to be interconnected with the cooling fluid information of the thermal management system, thereby facilitating heat exchange. The cooling fluid information entered into the thermal management system model was transferred to the physical model and circulated inside the cooling case, performing heat exchange over 10 cycles. Subsequently, information on the cooling fluid passing through the cooling channel was fed back into the thermal management system model. Heat transfer between the pipes and the fluid in the cooling channel model occurs through conduction and convection, resulting in the total heat transfer being calculated as follows:
Q ˙ c o n d , c c = k I S H D T p i p e T f l u i d
Q ˙ c o n v , c c = c p m ˙ f l u i d T p i p e T f l u i d 1 e x p h S H c p m ˙ f l u i d
Q ˙ t o t a l , c c = Q ˙ c o n d , c c + Q ˙ c o n v , c c
where k I is the thermal conductivity of the fluid, S H is the surface area of the pipe wall, D is the hydraulic diameter, and h is the heat transfer coefficient.

3. Results and Discussion

3.1. Simulation Scenario

The evaluation of the integrated BEV system model comprising the introduced component models was divided into two cases based on climatic conditions, as presented in Table 5. Additionally, to verify the potential of load reduction by the ITMS, simulations were conducted under the assumption of vehicle operation in a high thermal load scenario, simulating the HWFET [37] driving cycle. The cabin temperature was set to 23 °C, which is commonly considered the most comfortable temperature for passengers. Additionally, as the operating temperature of HVB increases, electrochemical reactions become more active and energy efficiency improves but, if it is too high, energy consumption increases as high performance control is required. Therefore, considering this trade-off, the optimal control point was set at 32 to 38 degrees for the HVB temperature and 47 to 51 degrees for the PE module.

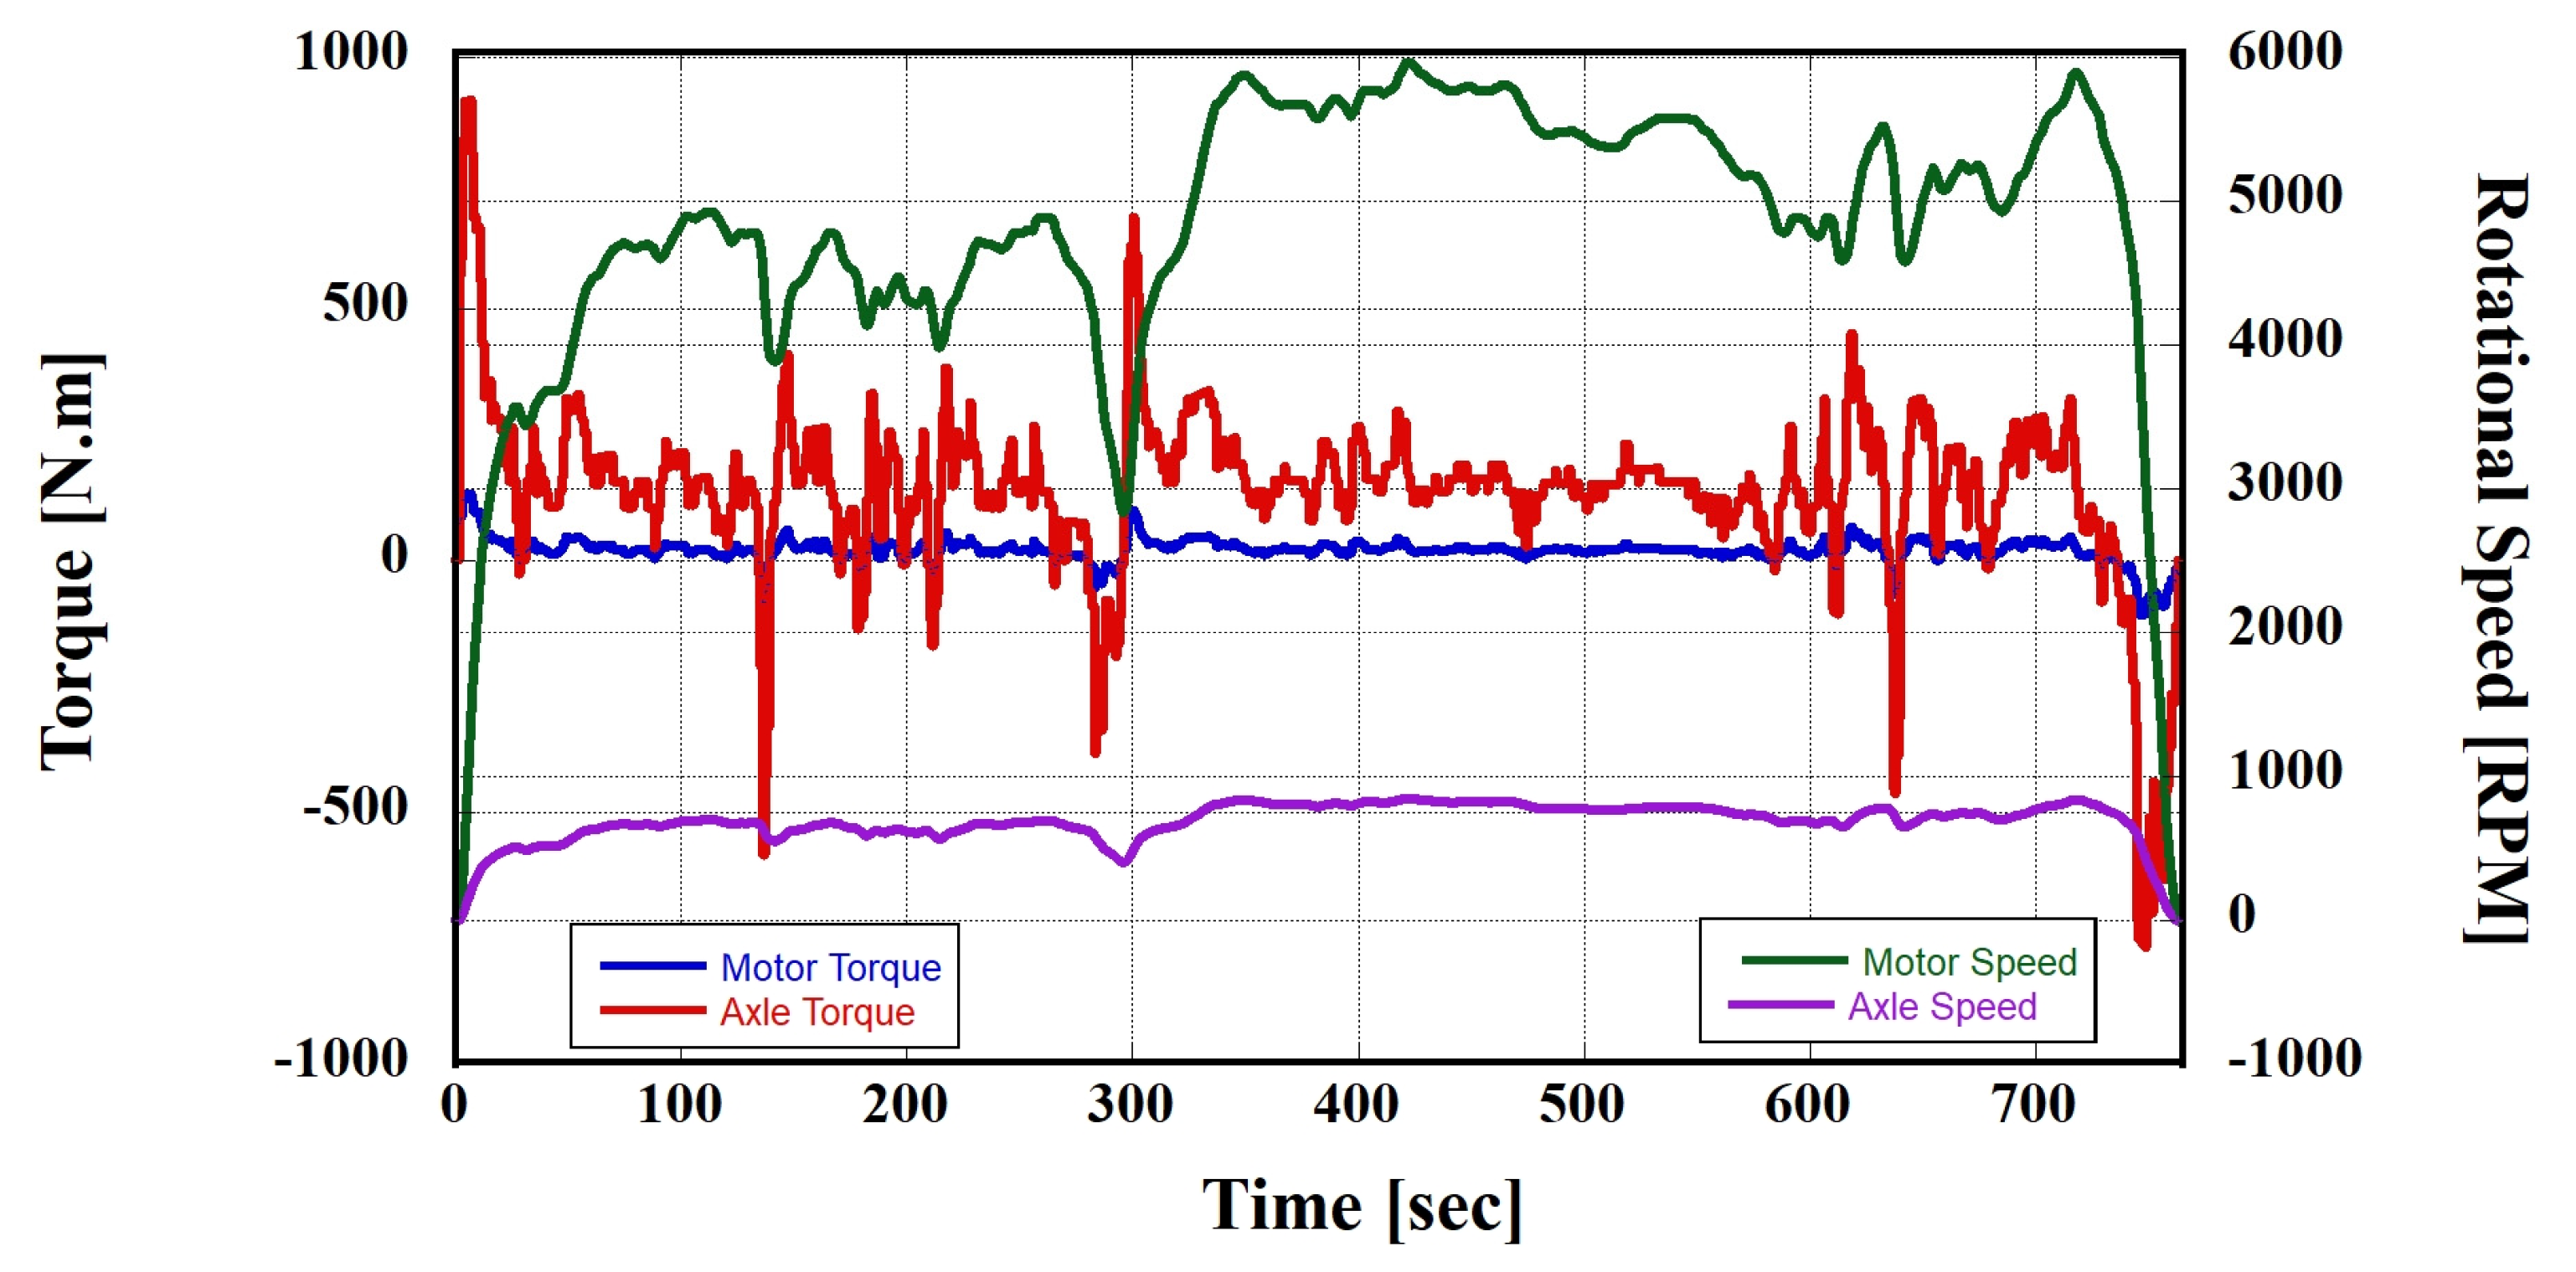
3.2. Results of the Powertrain System Model of the Battery Electric Vehicle

Before evaluating the proposed ITMS, it is essential to conduct a preliminary assessment of the thermal load inputted into the ITMS to ensure the reliability of the thermal load. The powertrain system model undergoes energy storage, discharge, and conversion processes between the HVB and PE modules for driving. The energy losses act as thermal loads. To generate thermal loads, the BEV tracked the speed profile, as shown in Figure 9. The maximum error owing to speed estimation was 0.05 km/h, indicating a low error rate of less than 0.0005% relative error [38,39,40]. Furthermore, the torque and rotational speeds of the PMSM and axle were generated to track the speed profile, as shown in Figure 10. Consequently, as the powertrain system model tracked the speed profile, thermal loads were generated in the HVB and PE modules, as illustrated in Figure 11.

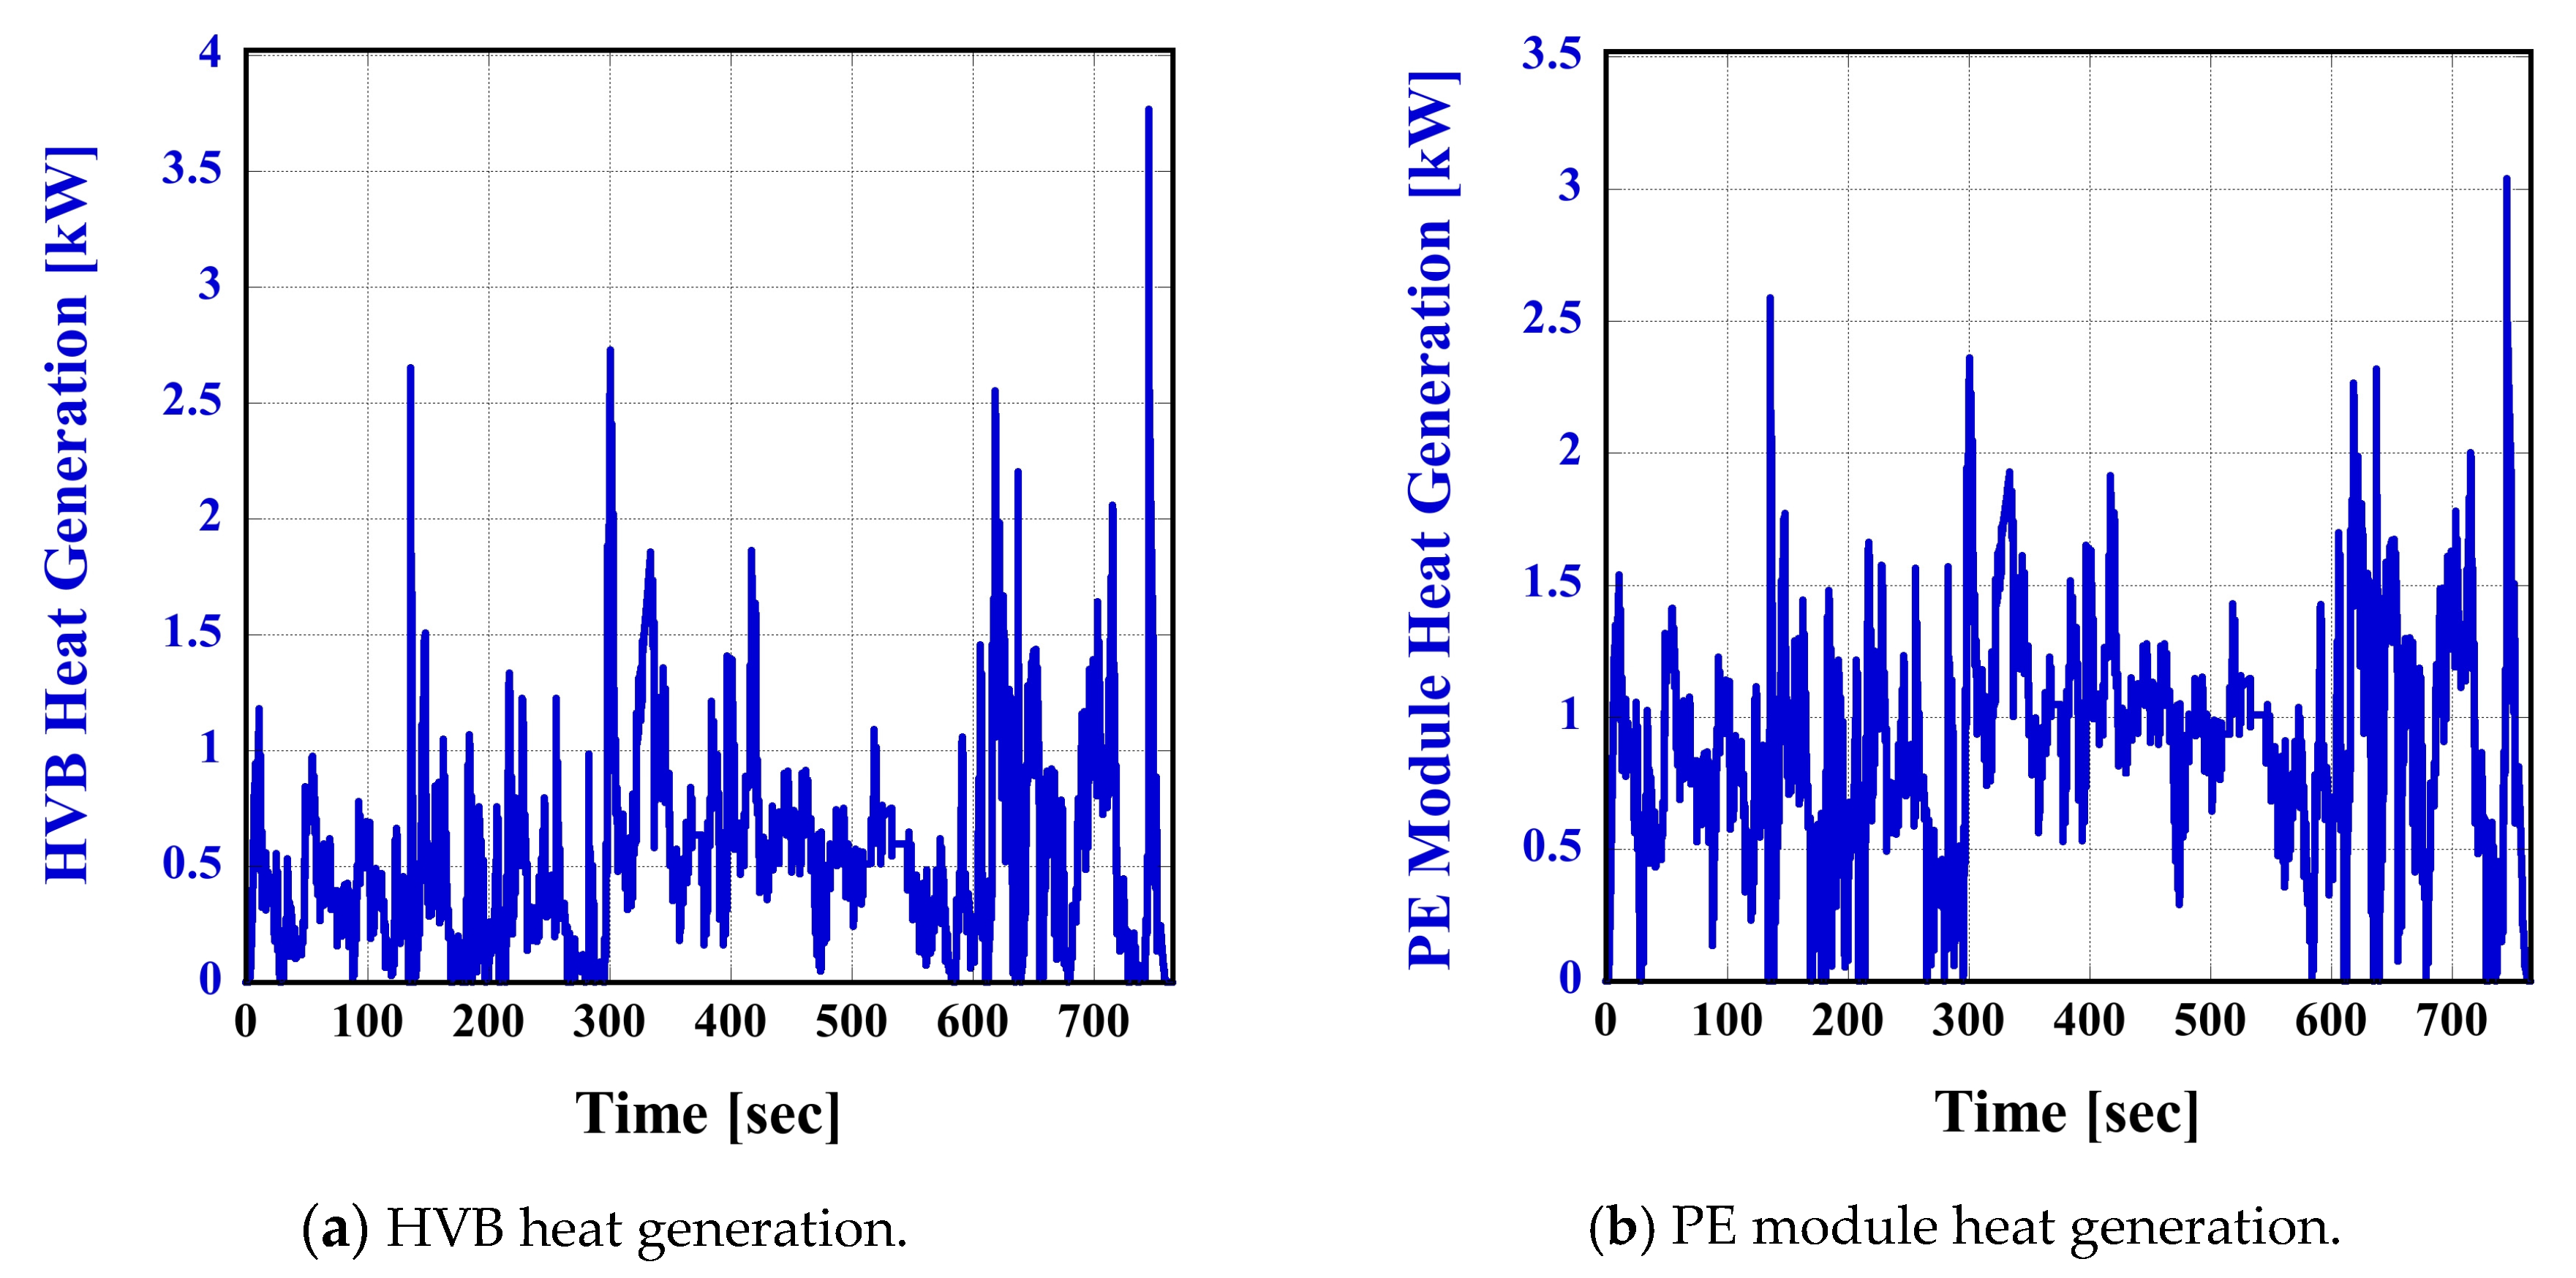
3.3. Results of the Integrated Thermal Management System Model

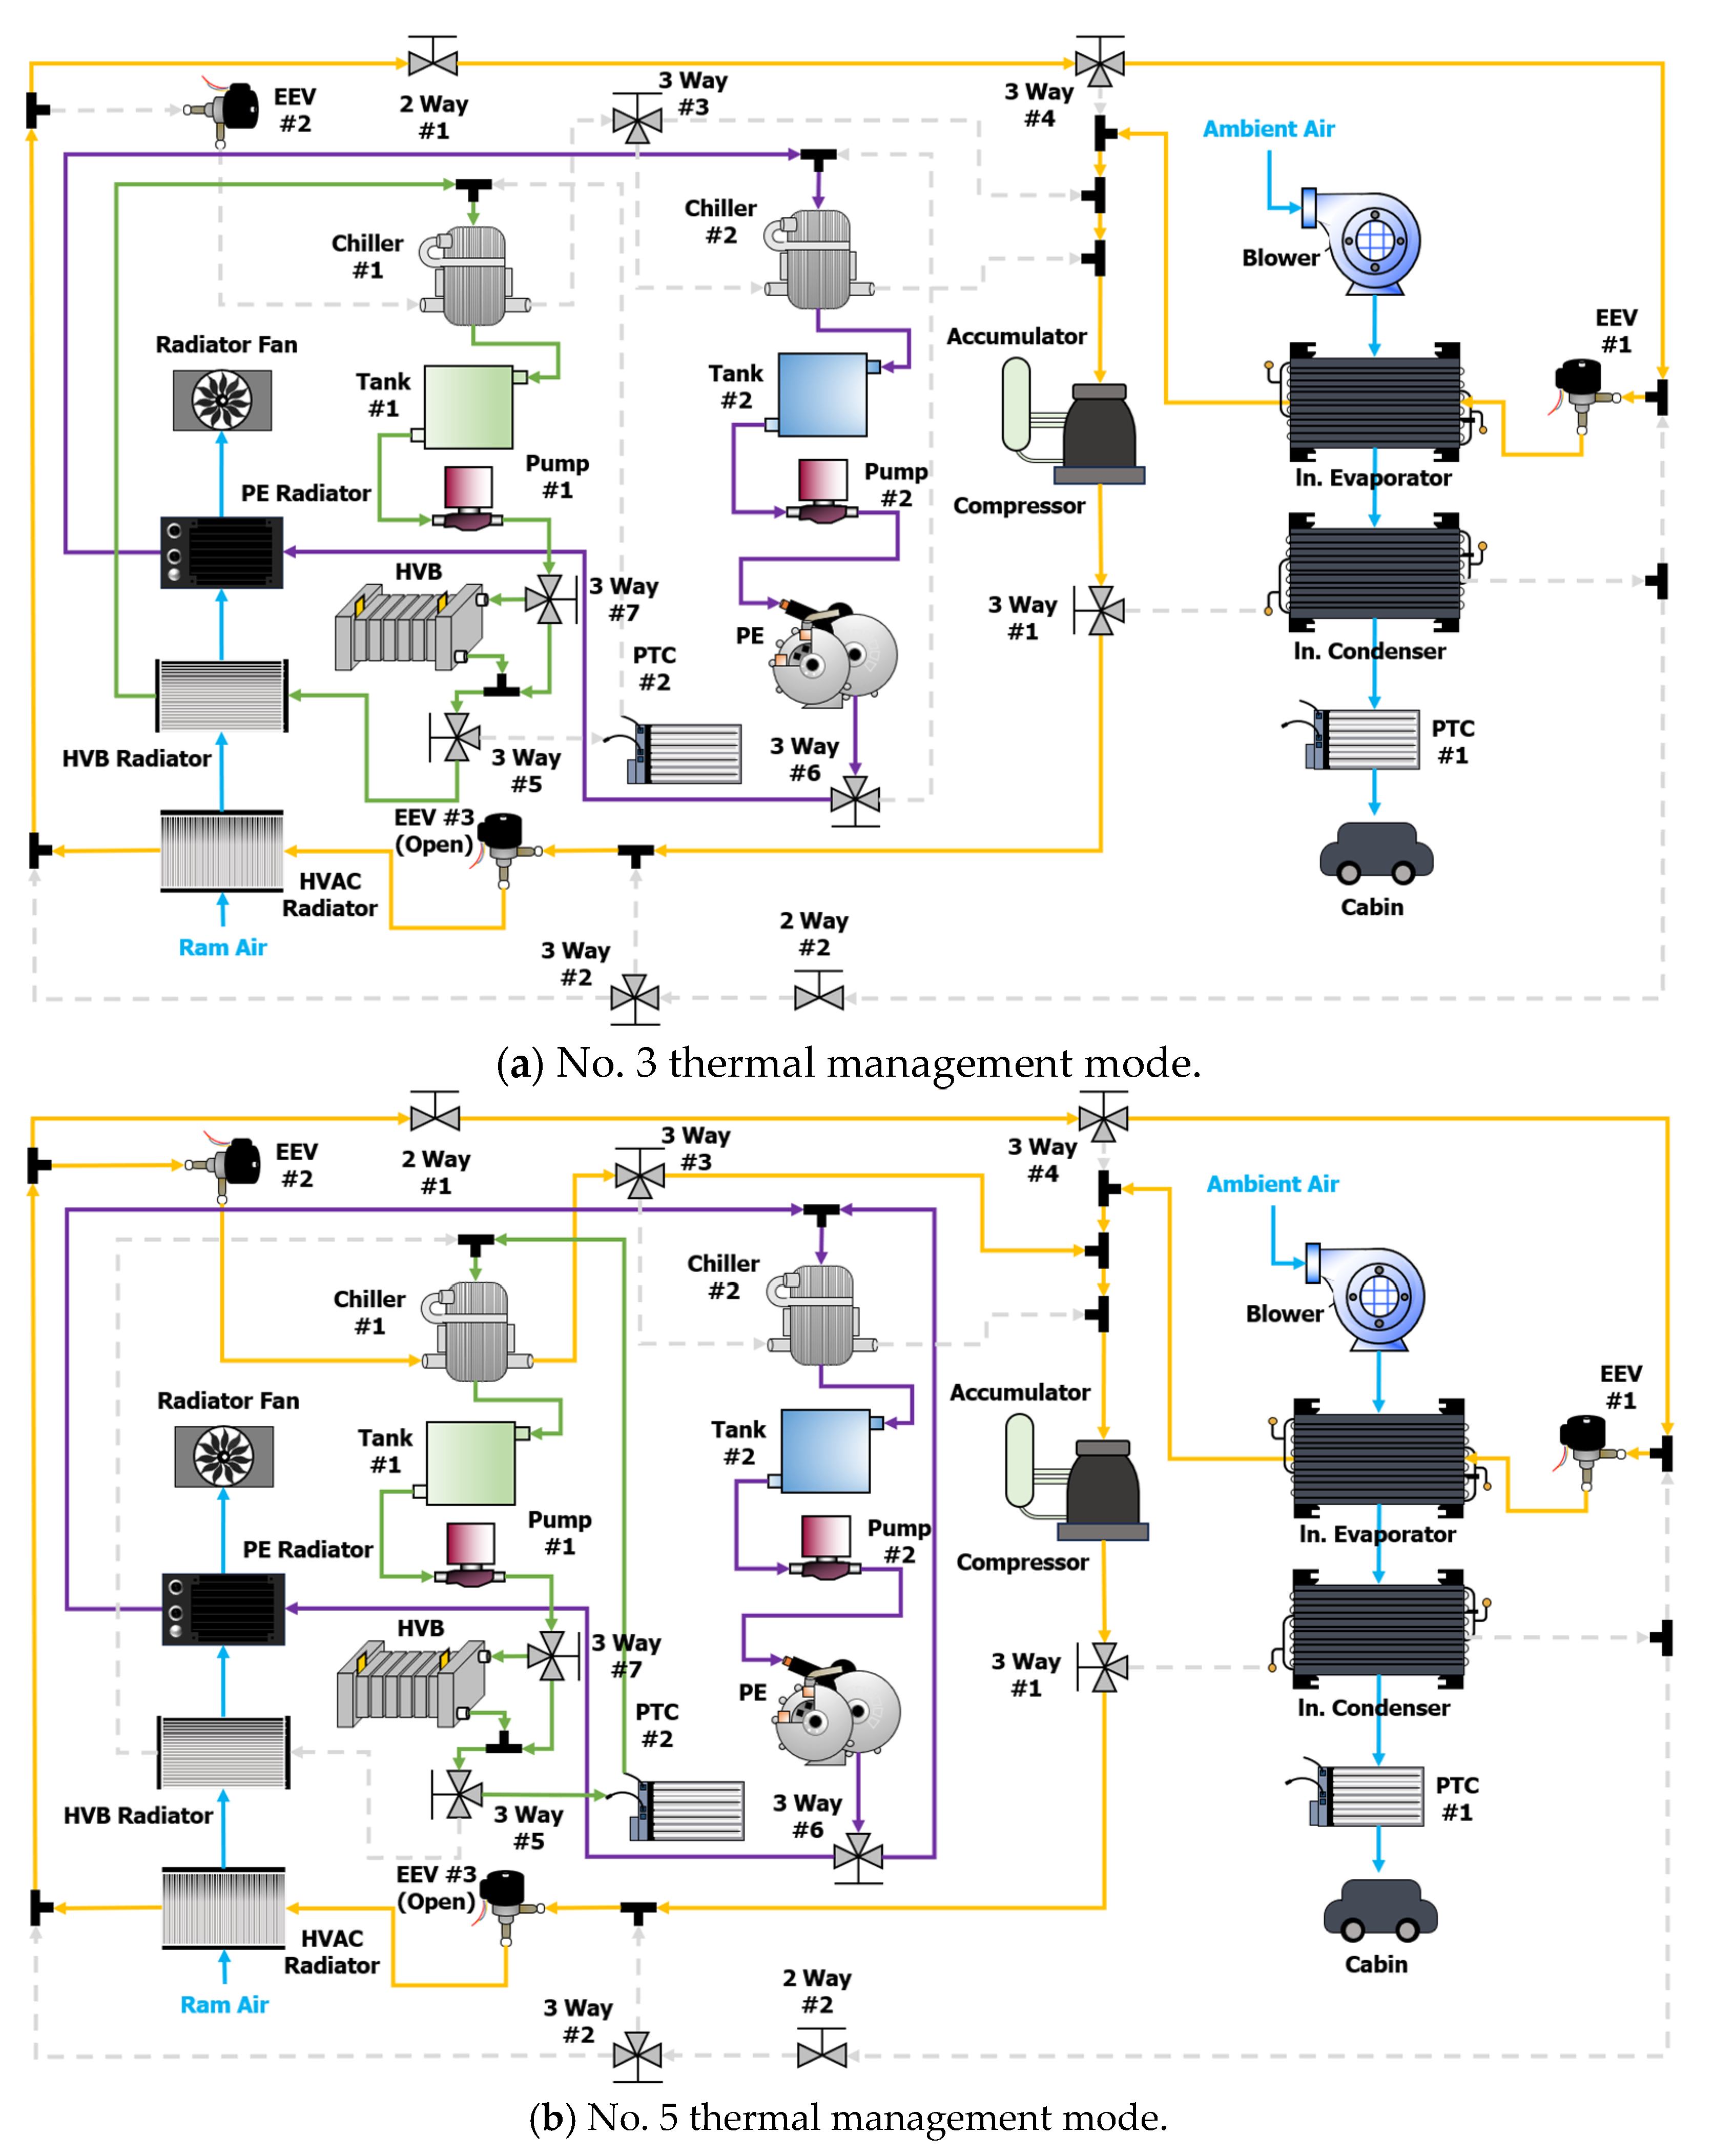
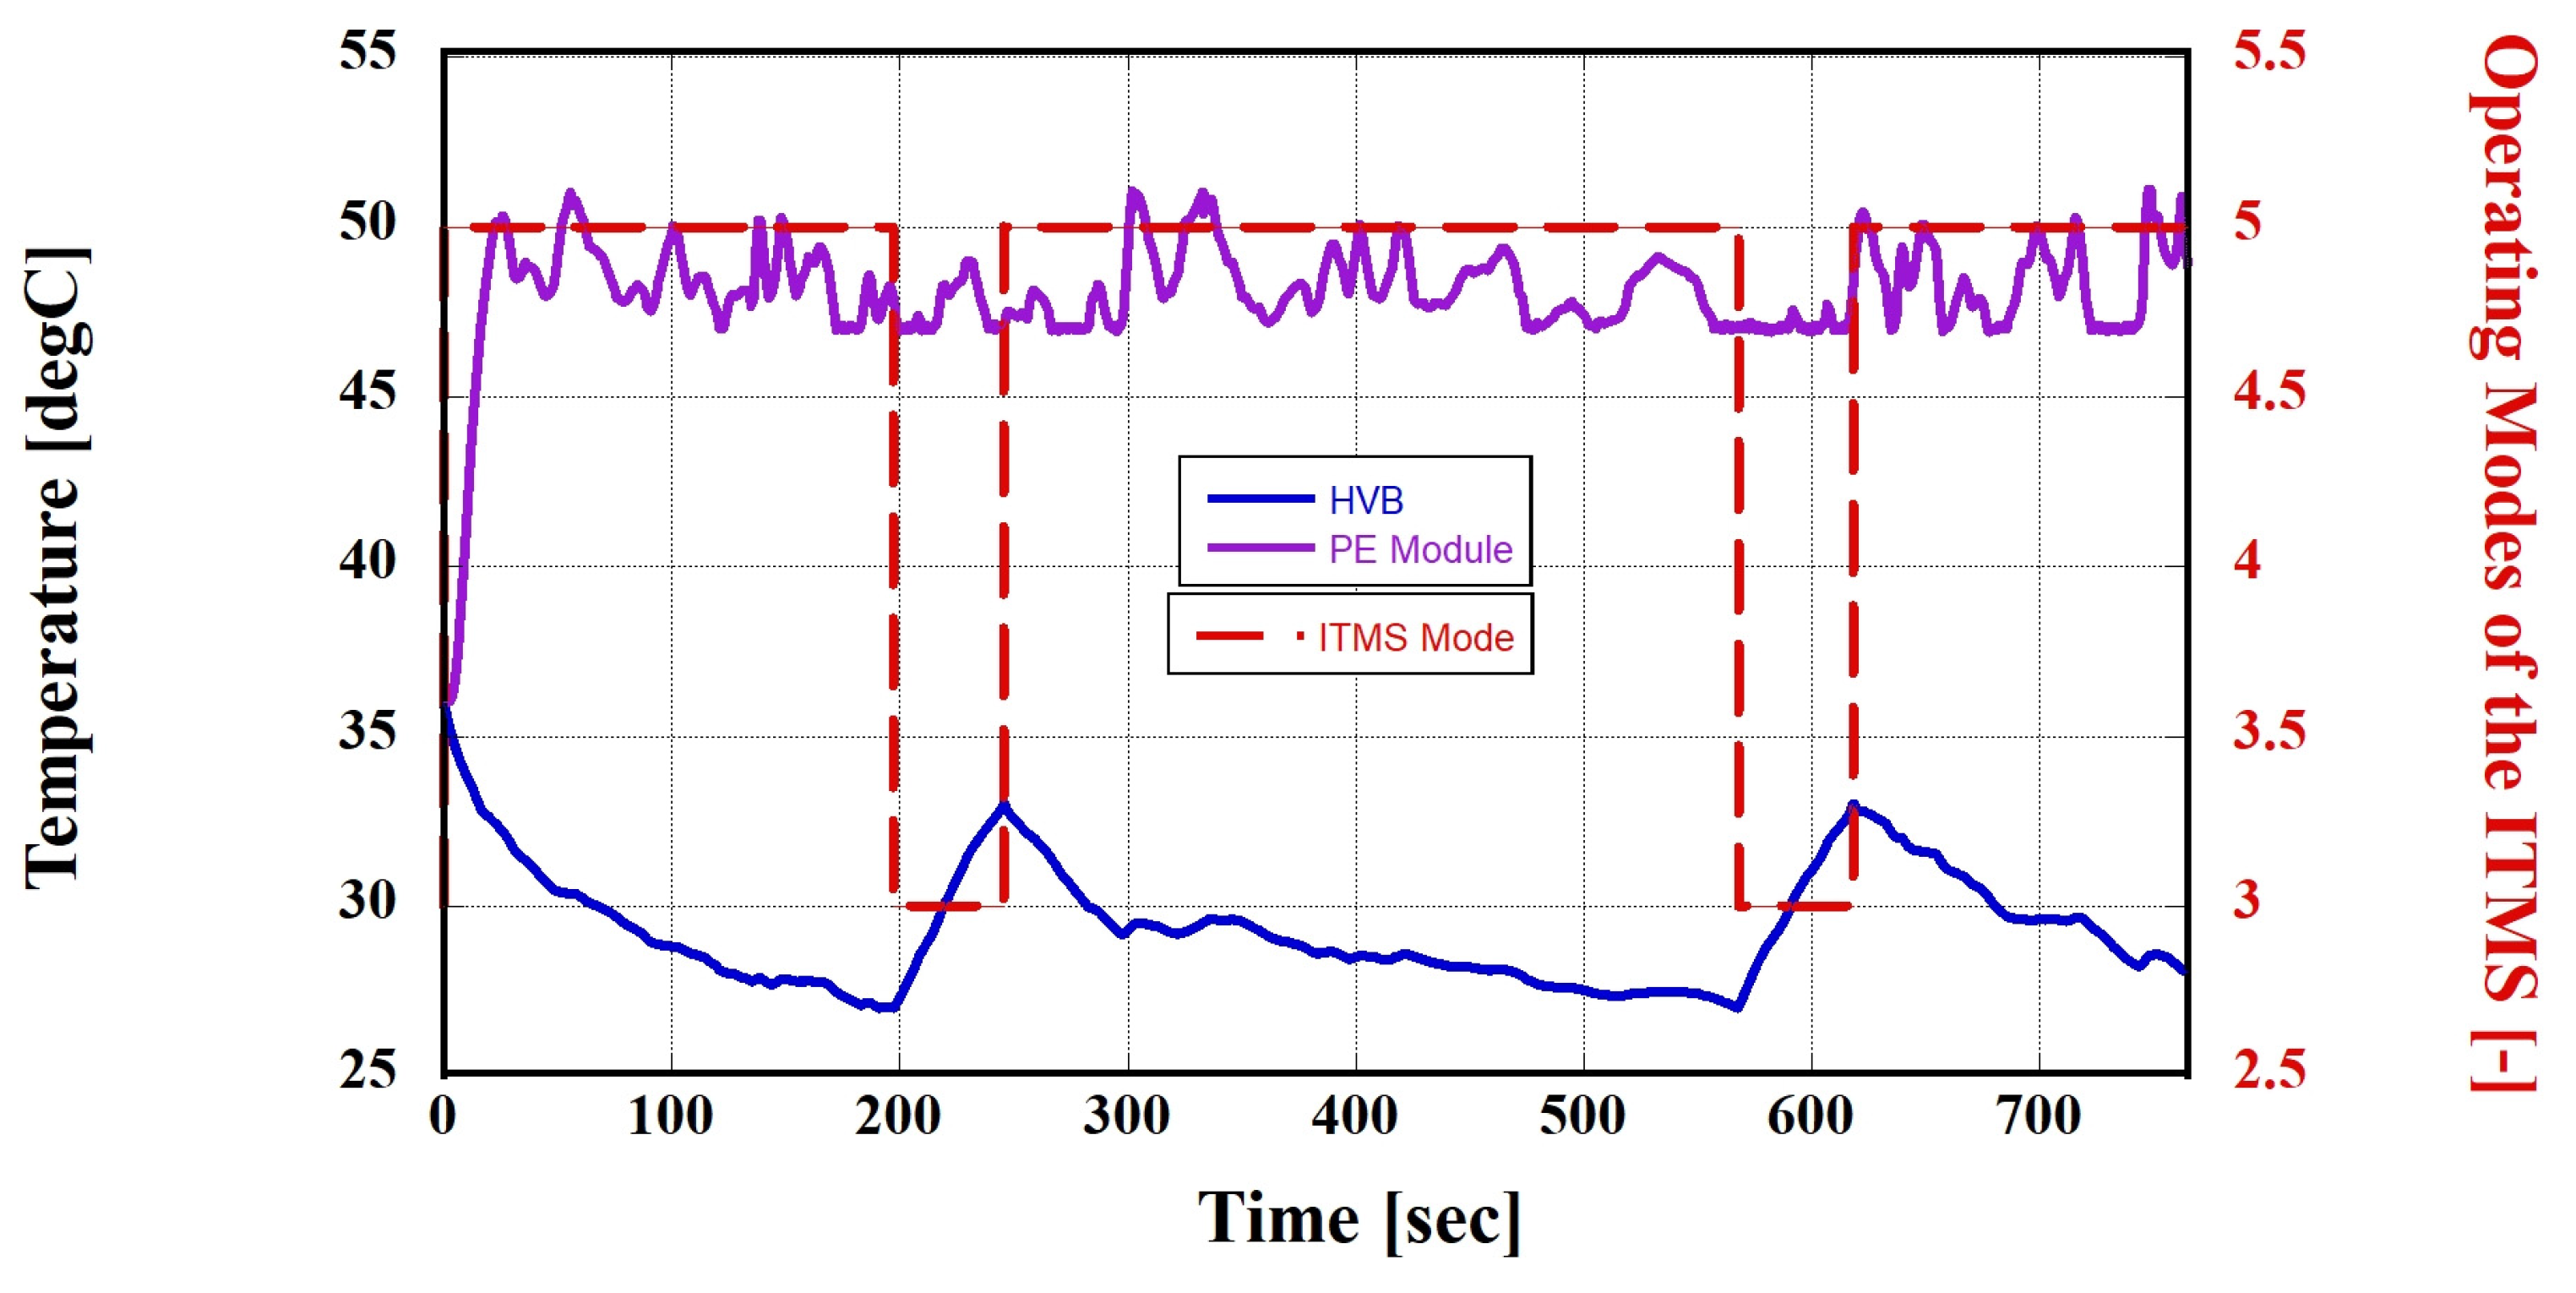
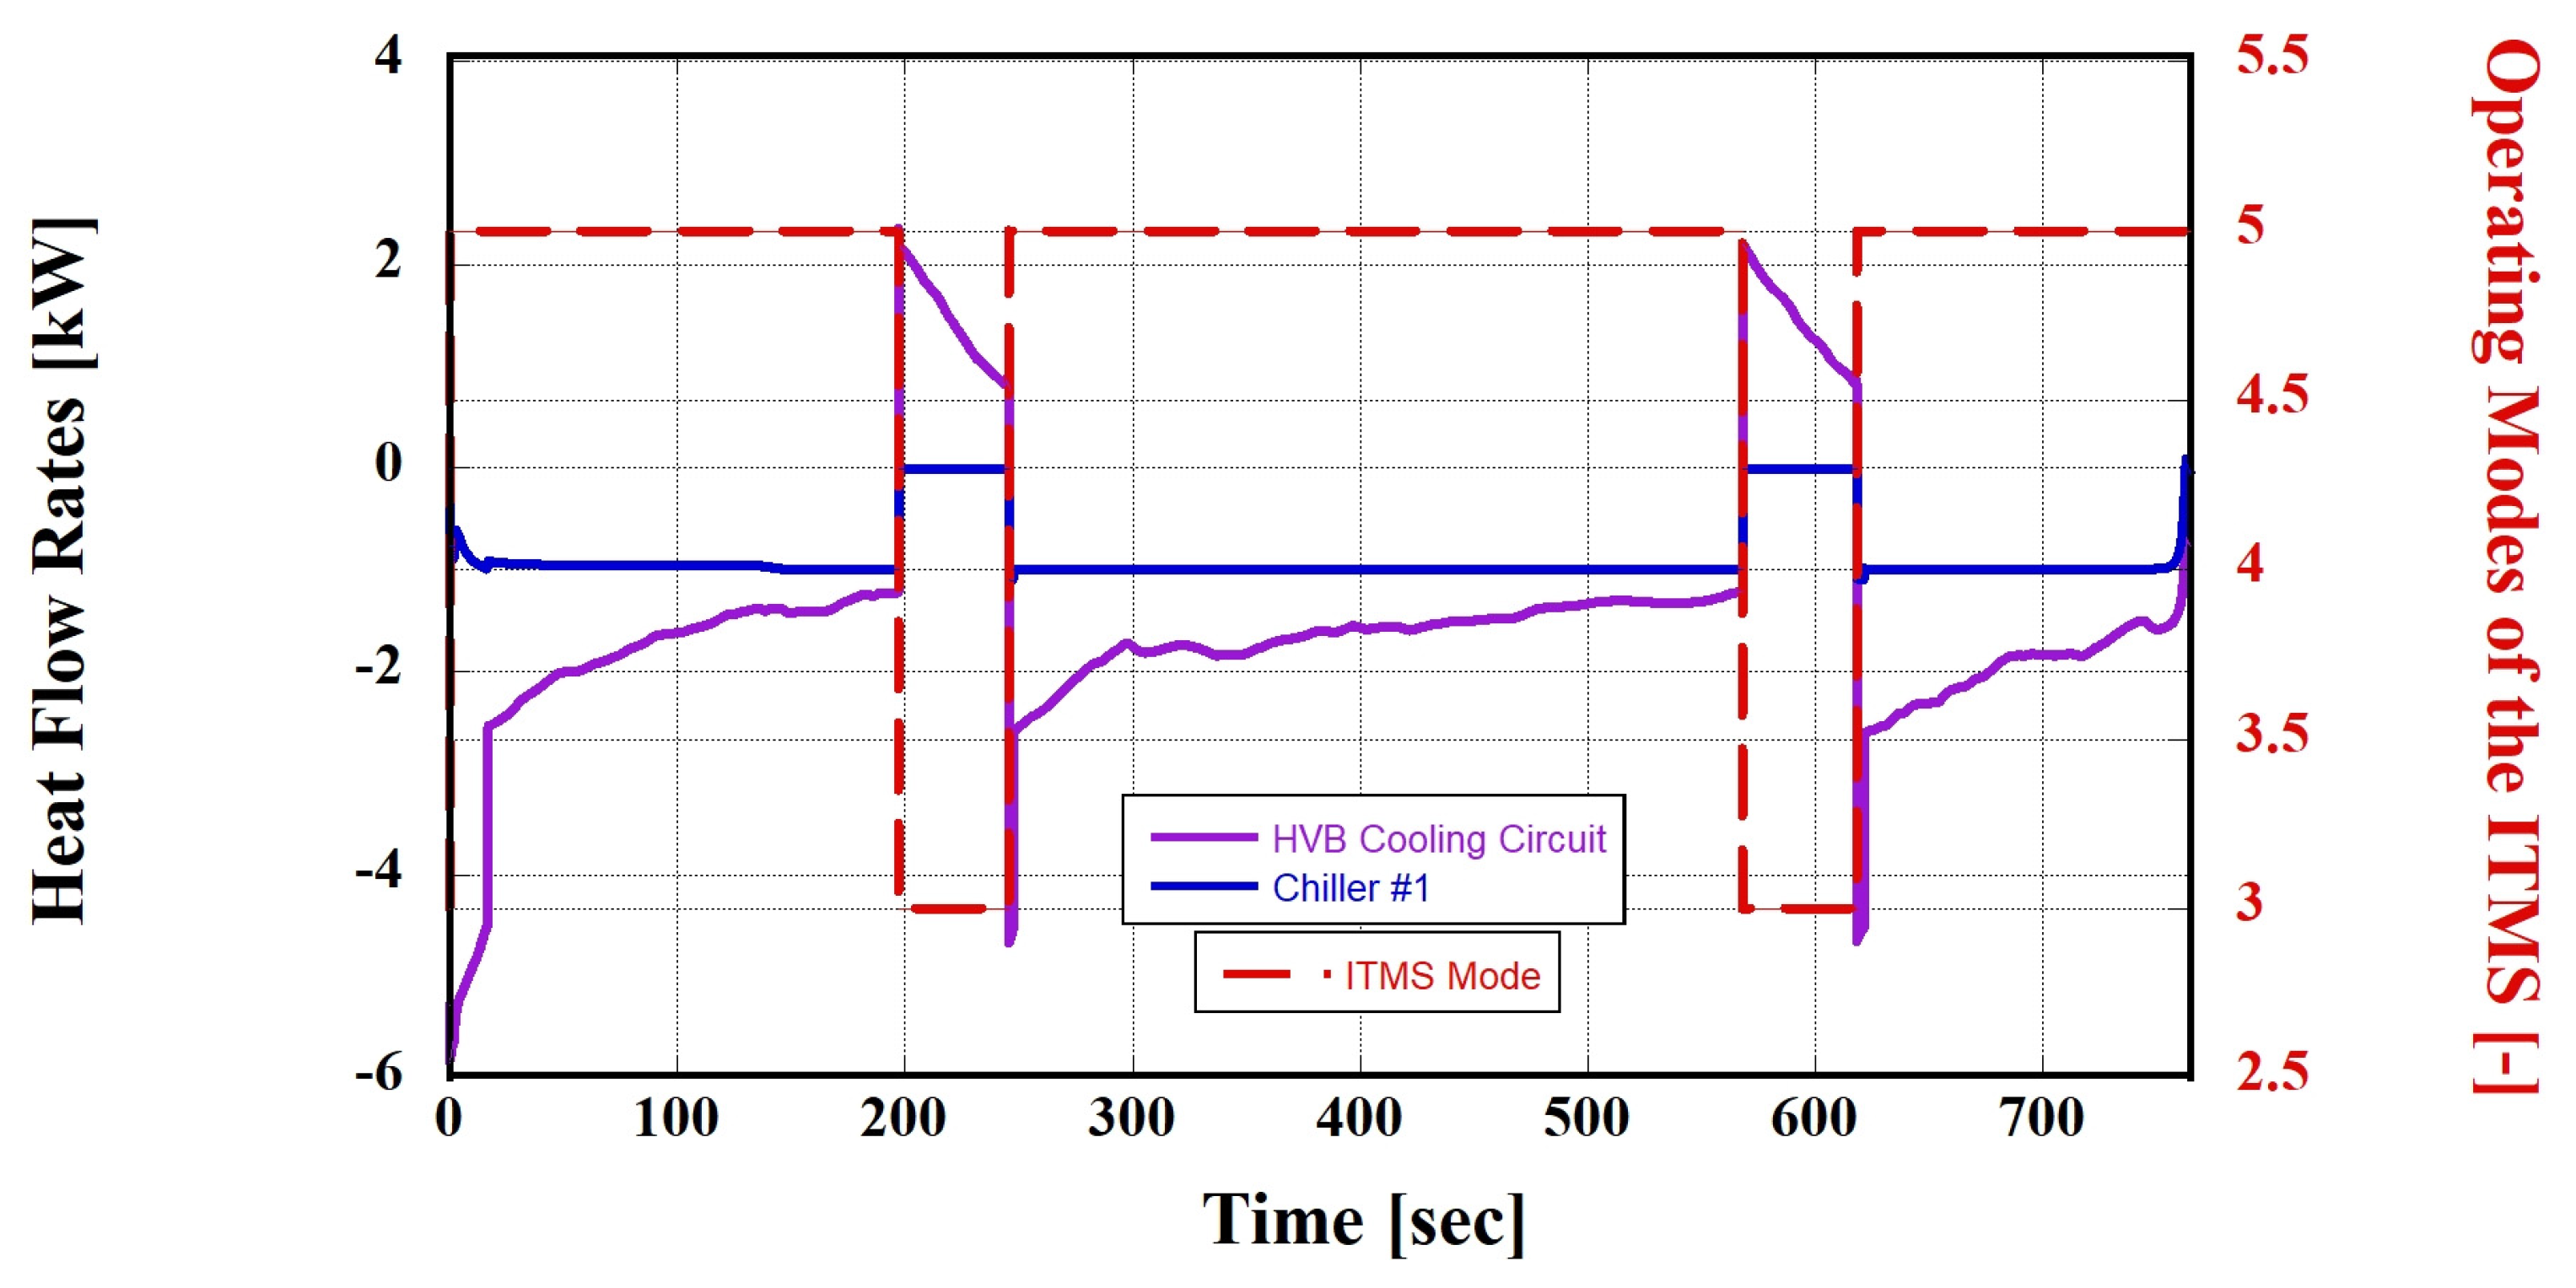
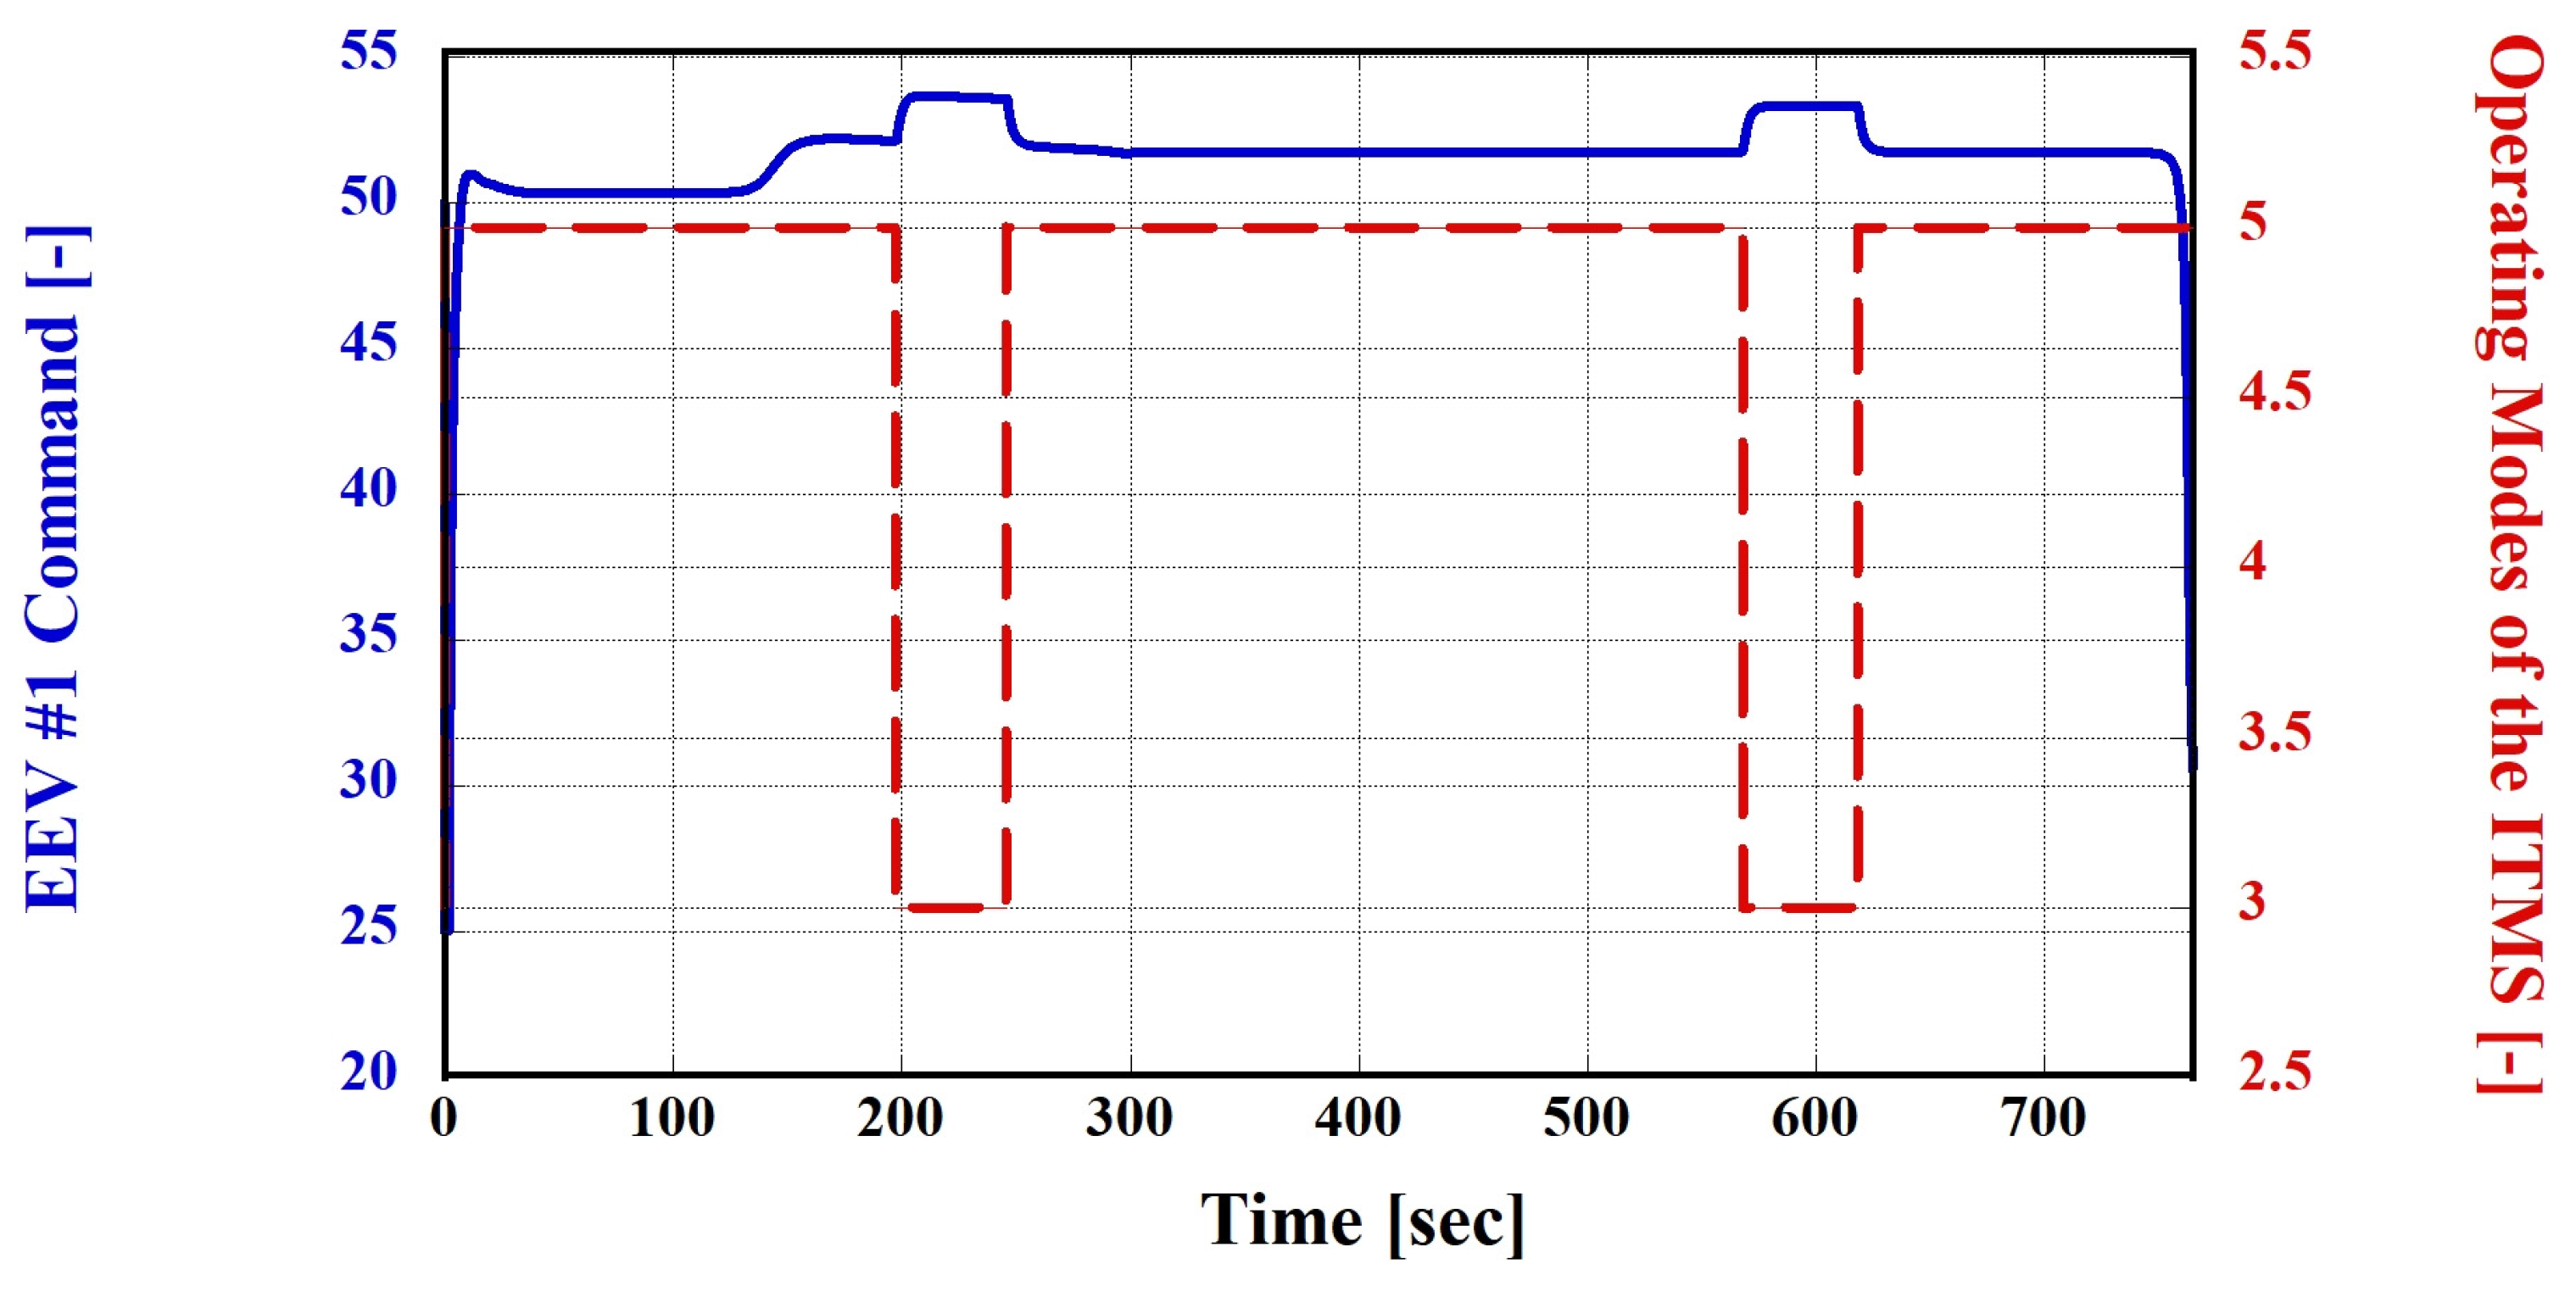
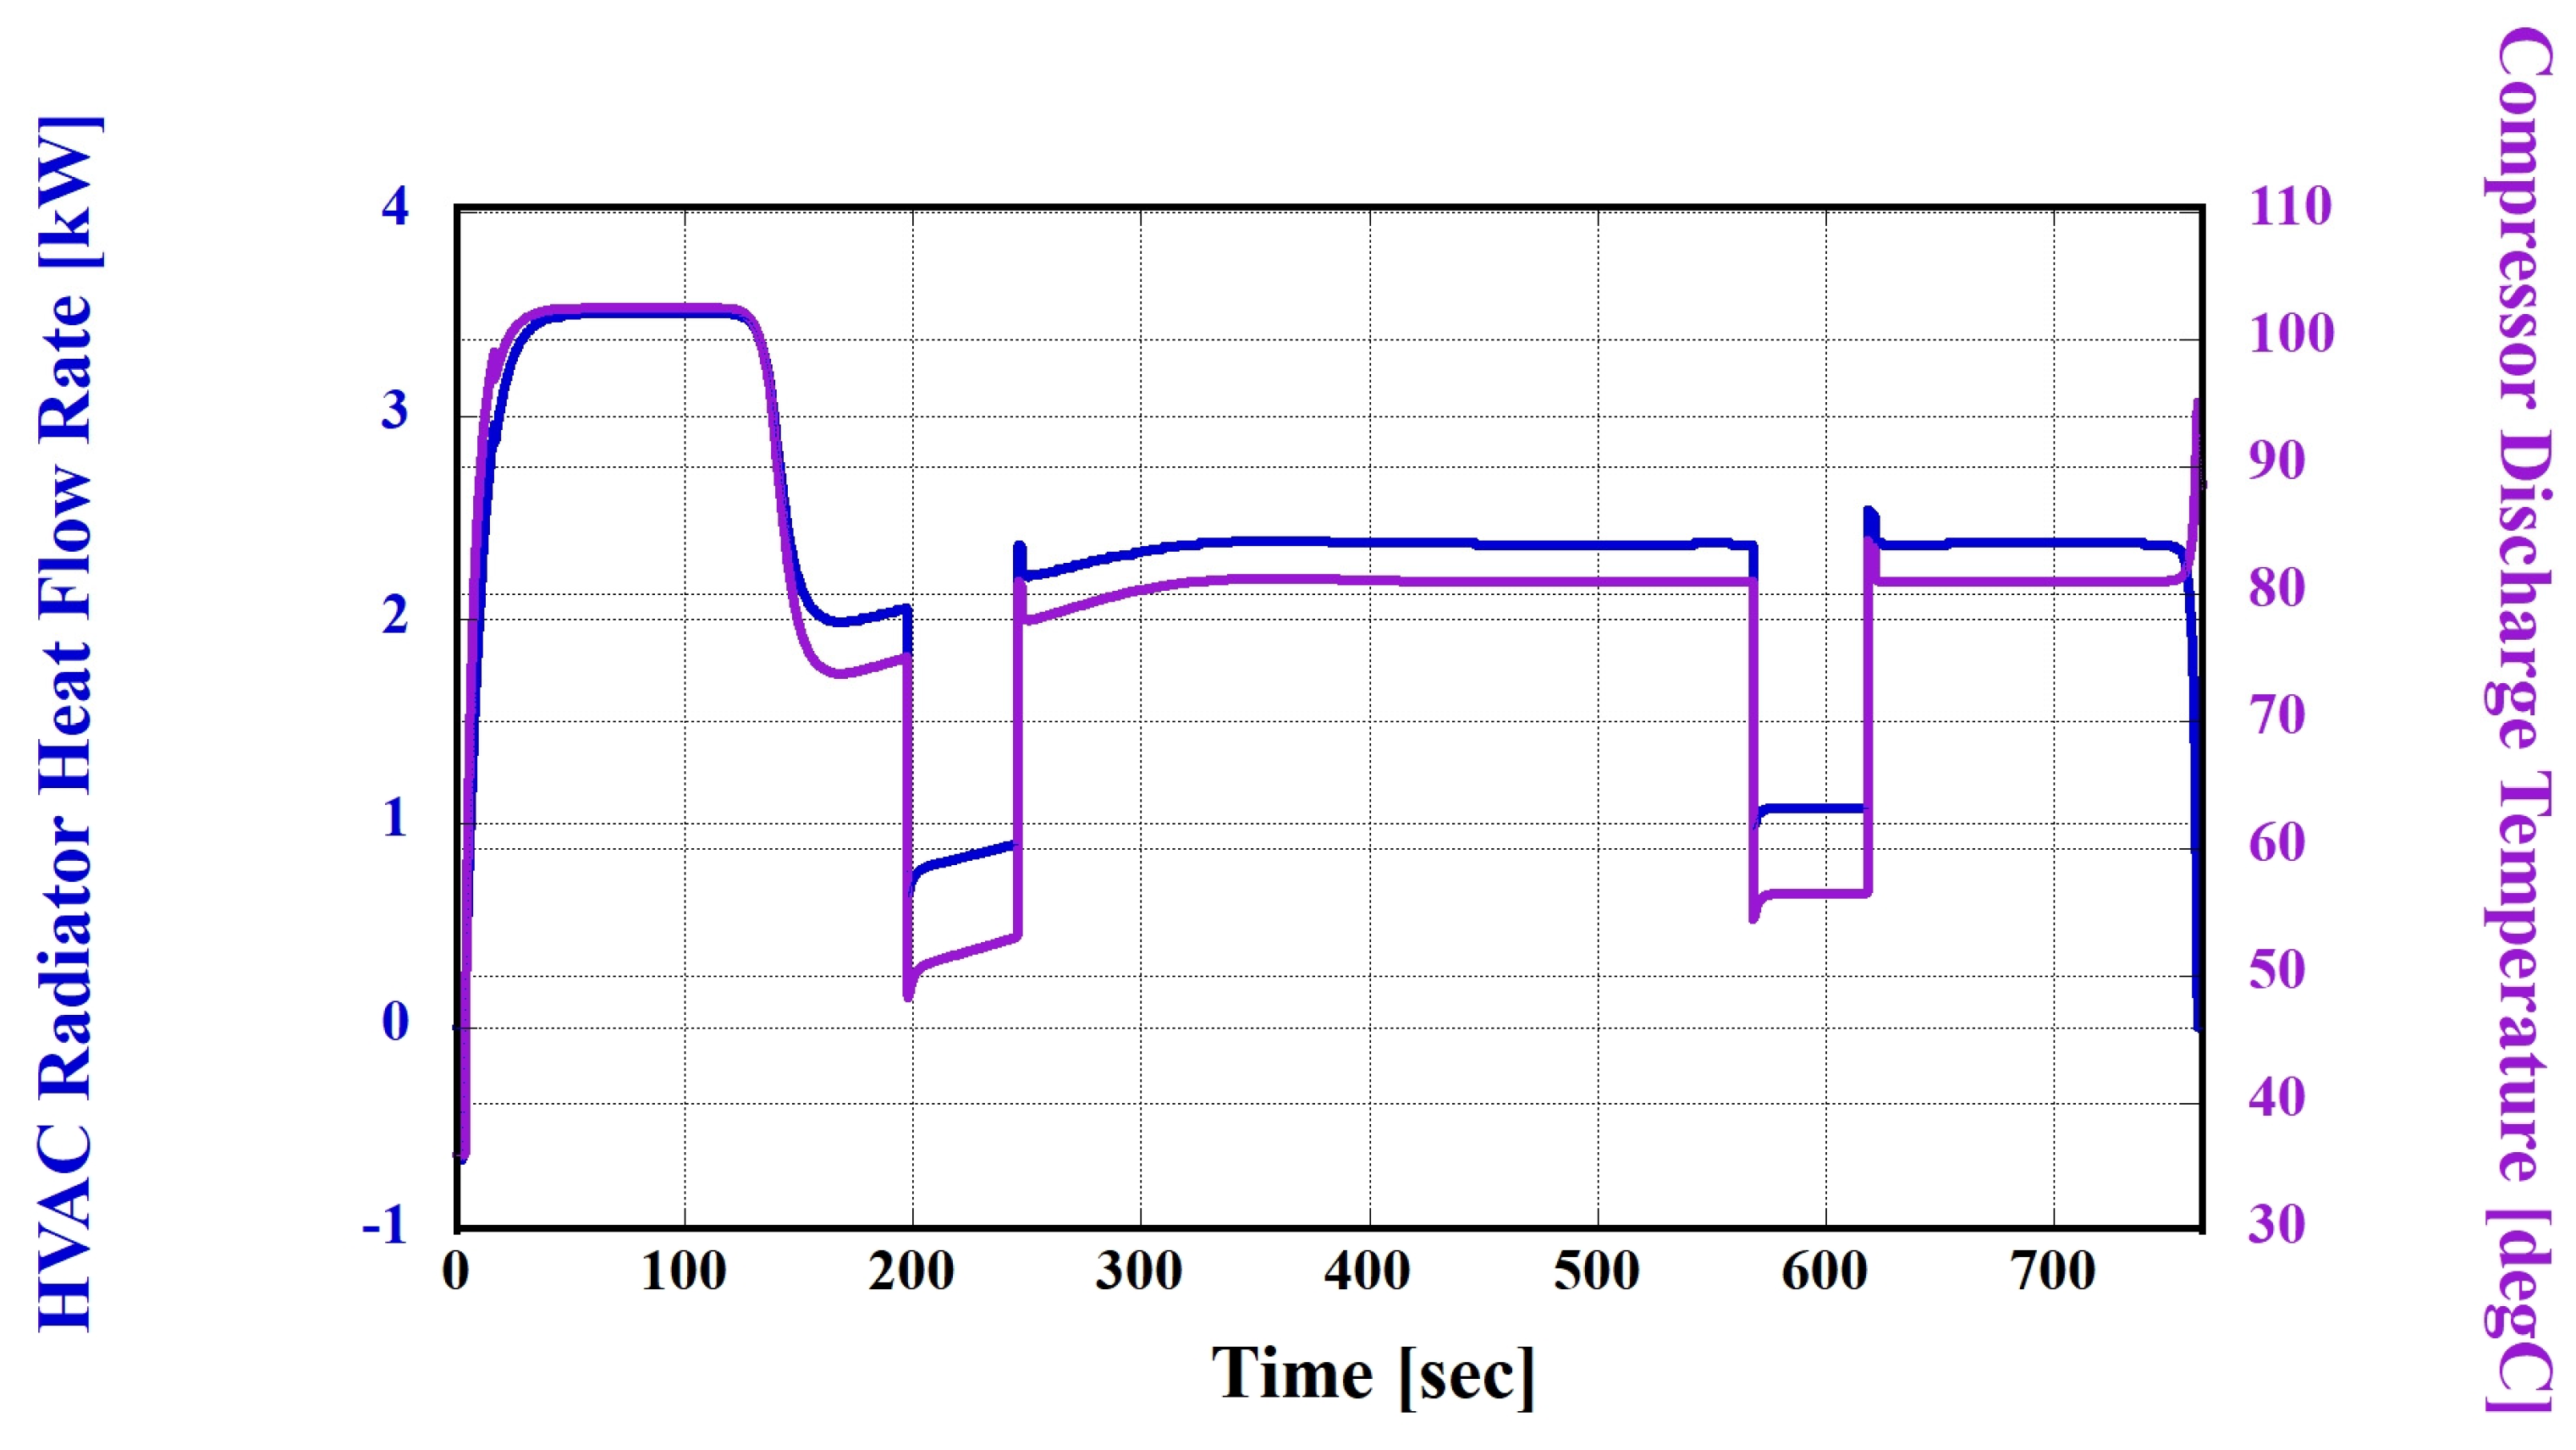
3.3.1. Simulation Case 1 (Hot Climate): Using Nos. 3 and 5 Thermal Management Modes

In this section, the designed ITMS was evaluated to assess its ability to cope with high-temperature conditions using the third and fifth thermal management modes. Thermal management modes are generally switched based on the ambient, cabin, and HVB operating temperatures. However, in this section, the simulations were assumed to be conducted under high-temperature conditions. Therefore, the transition was considered based on the operating temperature of the HVB. In other words, both the third and fifth thermal management modes inherently perform cooling of the cabin, and, in the fifth mode, cooling of the HVB is performed, leading to an increased cooling load. Under high-temperature conditions, the initial operating temperature of the HVB and PE module was 36 °C, as shown in Figure 12, which was the same as the ambient temperature. Therefore, the relatively high operating temperature of the PE module can be cooled through ambient air; however, to cool the HVB, which has a lower set temperature than the ambient air, the simulation must initially operate in the fifth thermal management mode, as depicted in Figure 12. The fifth thermal management mode, as illustrated in Figure 13, cools the HVB coolant through chiller #1 and transfers the cooled coolant to the HVB cooling circuit to perform the thermal management of the HVB under high-temperature conditions. In addition, the ITMS should be capable of cooling cabins. The cabin temperature starts at the same 36 °C as the ambient temperature. For cabin cooling, as shown in Figure 14, the air flowing through the blower is cooled through the evaporator. In this process, to facilitate effective heat transfer in the evaporator, EEV #1, depicted in Figure 15, was used to expand the refrigerant. Consequently, the cabin temperature reaches the target value, as shown in Figure 16. Furthermore, to repeat the cooling cycle introduced earlier, the heat absorbed by the refrigerant in chiller #1 and the evaporator acted as a load on the HVAC system under high-temperature conditions. The heat was then discharged from the HVAC-side radiator, as illustrated in Figure 17, after being drawn into the compressor and expelled at a high temperature and pressure.

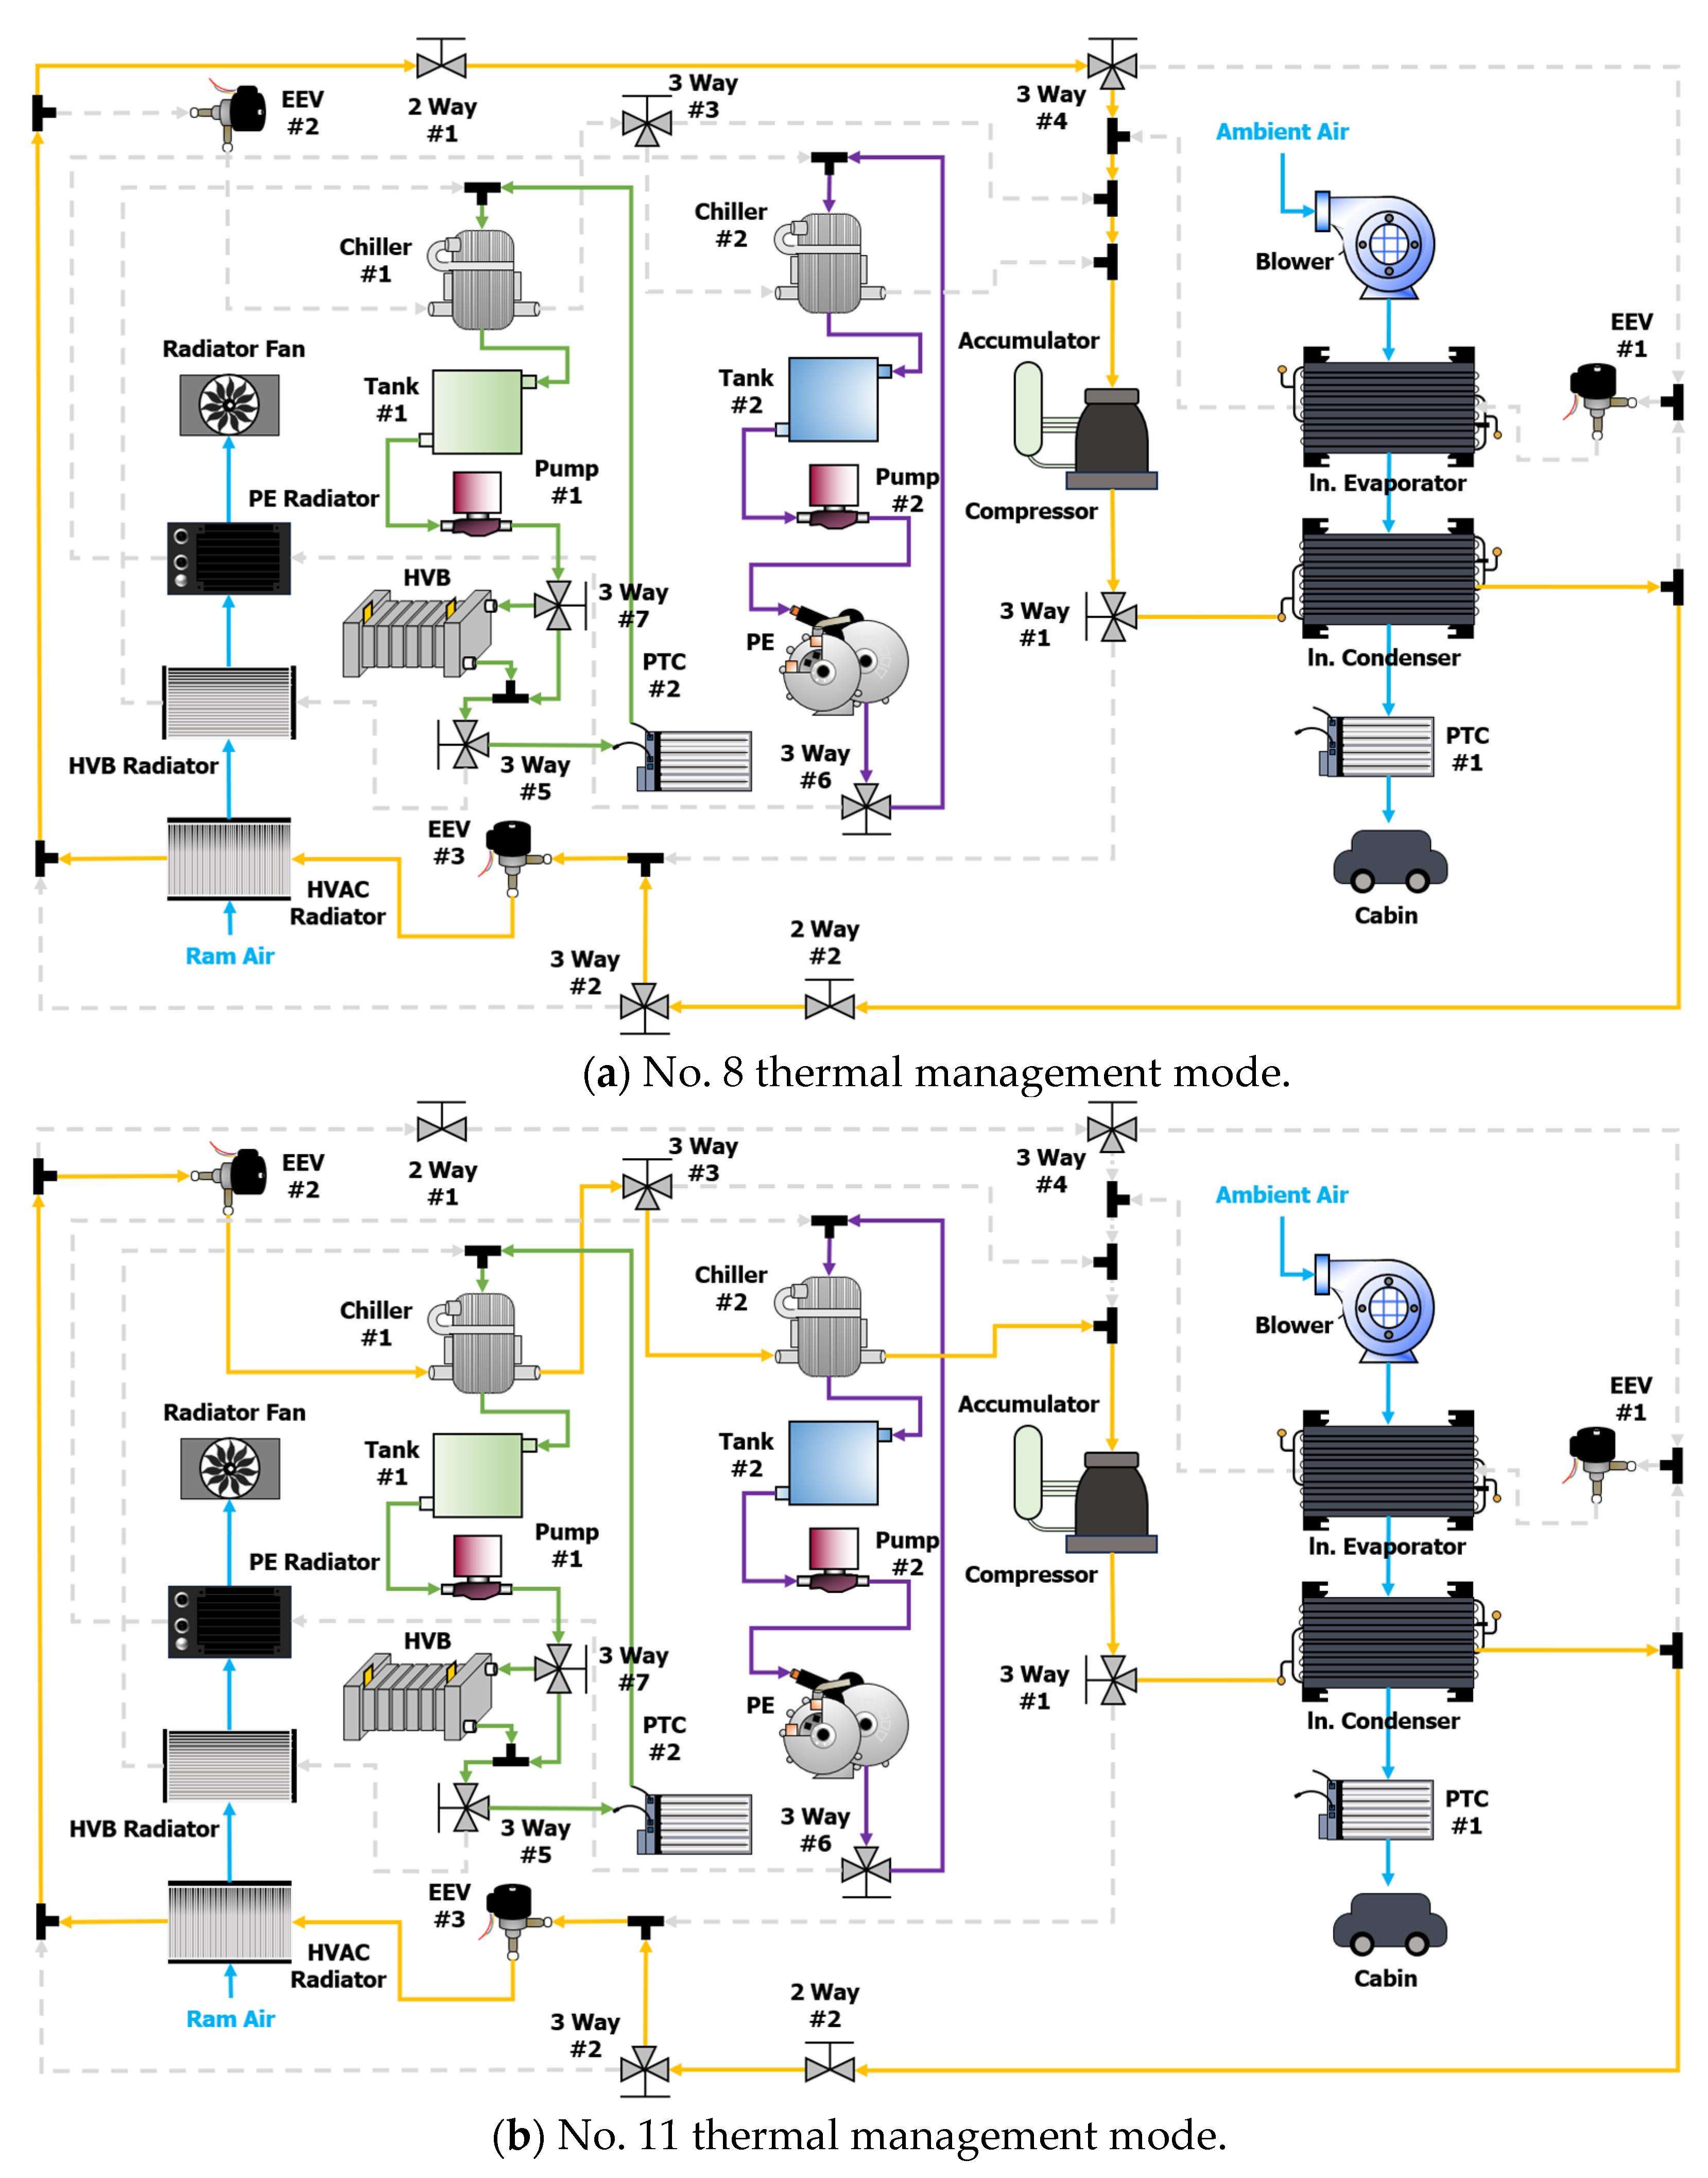
3.3.2. Simulation Case 2 (Cold Climate): Using Nos. 8 and 11 Thermal Management Modes

In this section, the designed ITMS was evaluated to assess its ability to cope with low-temperature conditions using the 8th and 11th thermal management modes. The thermal management modes are generally switched based on the ambient, cabin, and HVB operating temperatures. However, in this section, the simulations were assumed to be conducted under low-temperature conditions; therefore, the transition is considered based on the operating temperature of the HVB. In other words, both the 8th and 11th thermal management modes inherently performed cabin heating. In the 8th mode, the outdoor air is used as a heat source, whereas, in the 11th mode, outdoor air and waste heat obtained from the cooling HVB and PE are utilized as heat sources. Under low-temperature conditions, the initial operating temperatures of the HVB and PE module were −10 °C, as shown in Figure 18, which was the same as the ambient temperature. Initially, during low-temperature operation, the PE module naturally heats because its performance and durability are not significantly compromised, even at relatively low operating temperatures. However, for the HVB, as the energy capacity and efficiency significantly decrease during operation at low temperatures, as shown in Figure 18 and Figure 19, it is rapidly heated up to 25 °C using PTC heater #2. Subsequently, similar to the PE module, it naturally heats up; when it reaches the maximum allowable operating temperature, it transitions to the 11th thermal management mode. In this mode, chiller #1 was used to cool the HVB coolant, and the cooled coolant was transferred to the HVB cooling circuit to perform the thermal management of the HVB under high-temperature conditions. In addition, the ITMS should be capable of heating the cabin. The cabin temperature was −10 °C, the same as the ambient temperature. For cabin heating, as shown in Figure 20, the air flowing through the blower is heated through the condenser. Subsequently, the heat released by the refrigerant in the condenser is absorbed in the eighth thermal management mode through the outdoor air and compressor, whereas, in the 11th thermal management mode, it was absorbed through the outdoor air, compressor, and the HVB and PE modules. To facilitate the absorption process, EEV #3 was operated as shown in Figure 21, expanding the refrigerant to facilitate the smooth execution of the absorption process. Consequently, the cabin temperature reaches the set target, as illustrated in Figure 22.

4. Conclusions

In this study, a powertrain system model capable of calculating thermal loads resulting from BEV operation was developed to conduct a detailed evaluation of an ITMS based on a heat pump system. Subsequently, the developed powertrain system model and the ITMS were integrated into the simulation. Consequently, the proposed ITMS demonstrated the capability of performing integrated thermal management for the cabin, HVB, and PE module of a BEV not only under high-temperature conditions during HWFET driving but also under low-temperature conditions. The following conclusions were drawn:
  • The powertrain system of the BEV was modeled to calculate thermal loads as it tracks the HWFET driving cycle, and a precise thermal load was generated with a speed-tracking error of less than 0.0005%.
  • Through this study, the designed and modeled ITMS based on a heat pump system for BEV was able to cool the HVB using the HVAC system under high-temperature conditions with an outside air temperature of 36 °C. Additionally, under low-temperature conditions with an outside air temperature of −10 °C, it could perform cabin heating using not only the outside air as a heat source but also waste heat from the HVB and PE module components.
  • In this study, the designed and modeled heat-pump-system-based ITMS was evaluated under high-load conditions, specifically the HWFET driving cycle. It demonstrated stable thermal control for the cabin, HVB, and PE module, effectively adapting to both high-temperature conditions with an outside air temperature of 36 °C and low-temperature conditions with an outside air temperature of −10 °C.
Ultimately, the proposed heat-pump-system-based ITMS demonstrated the capability to actively manage the thermal conditions of both the cabin and powertrain components in response to the varied thermal loads of a BEV operating under different climate conditions. This suggests that the system can contribute to the stable and efficient operation of BEV, thereby enhancing safety during driving.

Author Contributions

Conceptualization: J.B. and D.H.; investigation: J.B. and D.H.; writing—original draft preparation: J.B. and D.H.; writing—review and editing: D.H. and J.H.; and supervision: D.H. and J.H. All authors have read and agreed to the published version of the manuscript.

Funding

This research was financially supported by the Ministry of Trade, Industry, and Energy (MOTIE), Korea, under the “Project for Research and Development with Middle Markets Enterprises and DNA (Data, Network, AI) Universities” (Development of Integrated Electric Vehicle Thermal Management System Operation Strategy and Efficiency Improvement Technology Using Neural Network-based MRAC Technique) (reference number P0024561), supervised by the Korea Institute for Advancement of Technology (KIAT). This research was supported by the “Regional Innovation Strategy (RIS)” through the National Research Foundation of Korea (NRF) funded by the Ministry of Education (MOE) (2021RIS—004).

Data Availability Statement

Data are contained within the article.

Conflicts of Interest

The authors declare no conflicts of interest.

References

  1. Nonobe, Y. Development of the fuel cell vehicle mirai. IEEJ Trans. Electr. Electron. Eng. 2017, 12, 5–9. [Google Scholar] [CrossRef]
  2. Selleri, T.; Melas, A.D.; Franzetti, J.; Ferrarese, C.; Giechaskiel, B.; Suarez-Bertoa, R. On-Road and Laboratory Emissions from Three Gasoline Plug-In Hybrid Vehicles—Part 1: Regulated and Unregulated Gaseous Pollutants and Greenhouse Gases. Energies 2022, 15, 2401. [Google Scholar] [CrossRef]
  3. Fuinhas, J.A.; Koengkan, M.; Leitão, N.C.; Nwani, C.; Uzuner, G.; Dehdar, F.; Relva, S.; Peyerl, D. Effect of battery electric vehicles on greenhouse gas emissions in 29 European Union countries. Sustainability 2021, 13, 13611. [Google Scholar] [CrossRef]
  4. Office of Energy Efficiency & Renewable Energy. FOTW #1275, 30 January 2023: Monthly Plug-in Electric Vehicle Sales in the United States Exceeded 7% of All New Light-Duty Vehicle Sales for the First Time in September 2022. 2023. Available online: https://www.energy.gov/eere/vehicles/articles/fotw-1275-january-30-2023-monthly-plug-electric-vehicle-sales-united-states (accessed on 30 January 2023).
  5. Falchetta, G.; Noussan, M. Electric vehicle charging network in Europe: An accessibility and deployment trends analysis. Transp. Res. D Transp. Environ. 2021, 94, 102813. [Google Scholar] [CrossRef]
  6. Hao, X.; Wang, H.; Lin, Z.; Ouyang, M. Seasonal effects on electric vehicle energy consumption and driving range: A case study on personal, taxi, and ridesharing vehicles. J. Clean. Prod. 2020, 249, 119403. [Google Scholar] [CrossRef]
  7. Lahlou, A.; Ossart, F.; Boudard, E.; Roy, F.; Bakhouya, M. Optimal management of thermal comfort and driving range in electric vehicles. Energies 2020, 13, 4471. [Google Scholar] [CrossRef]
  8. Park, M.H.; Kim, S.C. Heating performance characteristics of high-voltage PTC heater for an electric vehicle. Energies 2017, 10, 1494. [Google Scholar] [CrossRef]
  9. Zou, H.; Wang, W.; Zhang, G.; Qin, F.; Tian, C.; Yan, Y. Experimental investigation on an integrated thermal management system with heat pipe heat exchanger for electric vehicle. Energy Convers. Manag. 2016, 118, 88–95. [Google Scholar] [CrossRef]
  10. 2011 Nissan LEAF—Repair Manual—High Voltage Cooling System (HCO). 2015. Available online: https://ownersmanuals2.com/nissan/leaf-2011-repair-manual-high-voltage-cooling-system-hco-43099 (accessed on 1 August 2022).
  11. 2011 Nissan LEAF—Repair Manual—Heater & Air Condition (Section HA). 2015. Available online: https://ownersmanuals2.com/nissan/leaf-2011-repair-manual-heater-air-condition-section-ha-43101 (accessed on 1 August 2022).
  12. Al Faruque, M.A.; Vatanparvar, K. Modeling, analysis, and optimization of Electric Vehicle HVAC systems. In Proceedings of the 2016 21st Asia and South Pacific Design Automation Conference (ASP-DAC), Macao, China, 25–28 January 2016; pp. 423–428. [Google Scholar]
  13. Park, C.H.; Jee, Y.J.; Lee, D.W. Development trends of heat-pump system for electric driven vehicles. Auto J. 2011, 33, 29–35. [Google Scholar]
  14. Kang, H.S.; Sim, S.; Shin, Y.H. A numerical study on the light-weight design of PTC heater for an electric vehicle heating system. Energies 2018, 11, 1276. [Google Scholar] [CrossRef]
  15. HYUNDAI Motors. Hyundai and Kia Turn up EV Efficiency with New Heat Pump Technology. 2020. Available online: https://www.hyundai.news/eu/articles/press-releases/hyundai-and-kia-turn-up-ev-efficiency-with-new-heat-pump-technology.html (accessed on 9 June 2020).
  16. Xu, B.; Arjmandzadeh, Z. Parametric study on thermal management system for the range of full (Tesla Model S)/compact-size (Tesla Model 3) electric vehicles. Energy Convers. Manag. 2023, 278, 116753. [Google Scholar] [CrossRef]
  17. Wang, F.; Lin, Z.; Liu, L.; Wei, X.; Lin, S.; Dai, L.; Wei, Y.; Liang, C.C.; Liaw, B. Does polarization increase lead to capacity fade? J. Electrochem. Soc. 2020, 167, 090549. [Google Scholar] [CrossRef]
  18. Aris, A.M.; Shabani, B. An experimental study of a lithium ion cell operation at low temperature conditions. Energy Procedia 2017, 110, 128–135. [Google Scholar] [CrossRef]
  19. Bodenes, L.; Naturel, R.; Martinez, H.; Dedryvère, R.; Menetrier, M.; Croguennec, L.; Pérès, J.-P.; Tessier, C.; Fischer, F. Lithium secondary batteries working at very high temperature: Capacity fade and understanding of aging mechanisms. J. Power Sources 2013, 236, 265–275. [Google Scholar] [CrossRef]
  20. Abada, S.; Petit, M.; Lecocq, A.; Marlair, G.; Sauvant-Moynot, V.; Huet, F. Combined experimental and modeling approaches of the thermal runaway of fresh and aged lithium-ion batteries. J. Power Sources 2018, 399, 264–273. [Google Scholar] [CrossRef]
  21. Chen, Y.L.; Ni, J.; Shao, W.; Azzam, R. Experimental study on the influence of temperature on the mechanical properties of granite under uni-axial compression and fatigue loading. Int. J. Rock Mech. Min. Sci. 2012, 56, 62–66. [Google Scholar] [CrossRef]
  22. Bingyi, Z.; Wei, Z.; Fuyu, Z.; Guihong, F. Design and starting process analysis of multipolar line-start PMSM. In Proceedings of the 2007 International Conference on Electrical Machines and Systems (ICEMS), Seoul, Republic of Korea, 8–11 October 2007; pp. 1629–1634. [Google Scholar]
  23. Sathik, M.H.M.; Sundararajan, P.; Sasongko, F.; Pou, J.; Natarajan, S. Comparative analysis of IGBT parameters variation under different accelerated aging tests. IEEE Trans. Electron. Devices 2020, 67, 1098–1105. [Google Scholar] [CrossRef]
  24. Na, S.I.; Chung, Y.; Kim, M.S. Performance analysis of an electric vehicle heat pump system with a desiccant dehumidifier. Energy Convers. Manag. 2021, 236, 114083. [Google Scholar] [CrossRef]
  25. Miri, I.; Fotouhi, A.; Ewin, N. Electric vehicle energy consumption modelling and estimation—A case study. Int. J. Energy Res. 2021, 45, 501–520. [Google Scholar] [CrossRef]
  26. Hariharan, C.; Gunadevan, D.; Prakash, S.A.; Latha, K.; Raj, V.A.A.; Velraj, R. Simulation of battery energy consumption in an electric car with traction and HVAC model for a given source and destination for reducing the range anxiety of the driver. Energy 2022, 249, 123657. [Google Scholar] [CrossRef]
  27. Singirikonda, S.; Obulesu, Y.P. Adaptive secondary loop liquid cooling with refrigerant cabin active thermal management system for electric vehicle. J. Energy Storage 2022, 50, 104624. [Google Scholar] [CrossRef]
  28. Department of Climate Change, Energy, the Environment and Water. Global Warming Potential Values of Hydrofluorocarbon Refrigerants. Available online: https://www.dcceew.gov.au/environment/protection/ozone/rac/global-warming-potential-values-hfc-refrigerants (accessed on 10 October 2021).
  29. Vikram, S.; Vashisht, S.; Rakshit, D. Performance analysis of liquid-based battery thermal management system for Electric Vehicles during discharge under drive cycles. J. Energy Storage 2022, 55, 105737. [Google Scholar] [CrossRef]
  30. Zou, H.; Jiang, B.; Wang, Q.; Tian, C.; Yan, Y. Performance analysis of a heat pump air conditioning system coupling with battery cooling for electric vehicles. Energy Procedia 2014, 61, 891–894. [Google Scholar] [CrossRef]
  31. Park, I.; Kim, D.; Cha, H. EV car battery charge and discharge simulation verification for implementation and experiments of the bidirectional DC-DC charger. In Proceedings of the KIPE Conference, Seoul, Republic of Korea, 15 November 2013; pp. 35–36. [Google Scholar]
  32. Omar, N.; Van den Bossche, P.; Coosemans, T.; Van Mierlo, J. Peukert revisited—Critical appraisal and need for modification for lithium-ion batteries. Energies 2013, 6, 5625–5641. [Google Scholar] [CrossRef]
  33. Doerffel, D.; Sharkh, S.A. A critical review of using the Peukert equation for determining the remaining capacity of lead-acid and lithium-ion batteries. J. Power Sources 2006, 155, 395–400. [Google Scholar] [CrossRef]
  34. Bernardi, D.; Pawlikowski, E.; Newman, J. A general energy balance for battery systems. J. Electrochem. Soc. 1985, 132, 5. [Google Scholar] [CrossRef]
  35. Zhu, L.; Xiong, F.; Chen, H.; Wei, D.; Li, G.; Ouyang, C. Thermal analysis and optimization of an EV battery pack for real applications. Int. J. Heat Mass Transf. 2020, 163, 120384. [Google Scholar] [CrossRef]
  36. Ahmadou Samba, A.; Omar, N.; Gualous, H.; Van den Bossche, P.; Van Mierlo, J.; Boubekeur, T.I. Development of 2D thermal battery model for Lithium-ion pouch cells. World Electr. Veh. J. 2013, 6, 629–637. [Google Scholar] [CrossRef]
  37. Emission Test Cycles. Available online: https://dieselnet.com/standards/cycles/hwfet.php (accessed on 1 November 2023).
  38. Kim, H.; Kim, D.; Shu, I.; Yi, K. Time-varying parameter adaptive vehicle speed control. IEEE Trans. Veh. Technol. 2015, 65, 581–588. [Google Scholar] [CrossRef]
  39. Nie, L.; Guan, J.; Lu, C.; Zheng, H.; Yin, Z. Longitudinal speed control of autonomous vehicle based on a self-adaptive PID of radial basis function neural network. IET Intell. Transp. Syst. 2018, 12, 485–494. [Google Scholar] [CrossRef]
  40. Xu, S.; Peng, H.; Song, Z.; Chen, K.; Tang, Y. Accurate and smooth speed control for an autonomous vehicle. In Proceedings of the 2018 IEEE Intelligent Vehicles Symposium (IV), Changshu, China, 26–30 June 2018; pp. 1976–1982. [Google Scholar]
Figure 1. Schematic of the powertrain system model.
Batteries 10 00059 g001
Figure 2. Schematic showing the 2-RC equivalent circuit of the HVB model.
Batteries 10 00059 g002
Figure 3. Torque–RPM performance curve of the PMSM model.
Batteries 10 00059 g003
Figure 4. Schematic of the heat-pump-based ITMS.
Batteries 10 00059 g004
Figure 5. Flowchart of the ITMS thermal management mode selection logic.
Batteries 10 00059 g005
Figure 6. Schematic of the thermal management modes to respond to high-temperature climate conditions simulated in this study.
Batteries 10 00059 g006
Figure 7. Schematic of thermal management modes to respond to low-temperature climate conditions simulated in this study.
Batteries 10 00059 g007
Figure 8. Schematic of the cabin model.
Batteries 10 00059 g008
Figure 9. Simulation results of vehicle speed tracking.
Batteries 10 00059 g009
Figure 10. Simulation results of the motor and axle.
Batteries 10 00059 g010
Figure 11. Heat generation by the HVB and PE module.
Batteries 10 00059 g011
Figure 12. Thermal management mode according to the HVB operating temperature (hot climate).
Batteries 10 00059 g012
Figure 13. Heat flow rates for HVB thermal management (hot climate).
Batteries 10 00059 g013
Figure 14. Heat flow rate for cabin thermal management (hot climate).
Batteries 10 00059 g014
Figure 15. EEV #1 command conversion according to the thermal management mode (hot climate).
Batteries 10 00059 g015
Figure 16. Simulation results for the cabin temperature (hot climate).
Batteries 10 00059 g016
Figure 17. Elimination of thermal loads in the HVAC system under hot climactic conditions (hot climate).
Batteries 10 00059 g017
Figure 18. Thermal management mode according to the HVB operating temperature (cold climate).
Batteries 10 00059 g018
Figure 19. Heat flow rates for HVB thermal management (cold climate).
Batteries 10 00059 g019
Figure 20. Heat flow rate for cabin thermal management (cold climate).
Batteries 10 00059 g020
Figure 21. EEV #3 command conversion according to the thermal management mode (cold climate).
Batteries 10 00059 g021
Figure 22. Simulation results for the cabin temperature (cold climate).
Batteries 10 00059 g022
Table 1. Specification setting parameters of the HVB model.
ParametersValueUnit
1 cell capacity56.85Ah
Number of parallel cells
per module
2EA
Number of serial cells
per module
6EA
Number of modules per pack30EA
Number of packs1EA
Table 2. Vehicle specifications.
ParametersValueUnit
Vehicle mass1950kg
Tire rolling radius0.3m
Front area2.3m2
Air drag coefficient0.31-
Gravitational acceleration9.81m/s2
Table 3. Operating modes of the ITMS.
Operating
Environment
NumberHVAC CircuitHVB CircuitPE Circuit
Hot climate1Air conditionCirculationCirculation
2Air conditionRadiator coolingCirculation
3Air conditionRadiator coolingRadiator cooling
4Air conditionChiller coolingCirculation
5Air conditionChiller coolingRadiator cooling
6Air conditionCirculationRadiator cooling
7-Radiator cooling-
Cold climate8Cabin heatingCirculationCirculation
9Cabin heating
(Dehumidification)
CirculationCirculation
10Cabin heatingChiller coolingCirculation
11Cabin heatingChiller coolingChiller cooling
12Cabin heating
(Not air absorption)
Chiller coolingCirculation
13Cabin heating
(Not air absorption)
Chiller coolingChiller cooling
14Cabin heating
(Dehumidification)
Circulation
(HVB heating)
Circulation
15-Circulation
(HVB heating)
-
Table 4. Shape information and heat transfer coefficients of the cabin model.
AreaParametersValueUnit
GlassConvective heat transfer coefficient40W/m2.K
Thermal
conductivity
0.00096W/m.K
Thickness0.002m
Heat transfer area3.5m2
DoorsConvective heat transfer coefficient40W/m2.K
Thermal
conductivity
0.00008W/m.K
Thickness0.03m
Heat transfer area4m2
RoofsConvective heat transfer coefficient40W/m2.K
Thermal
conductivity
0.0008W/m.K
Thickness0.02m
Heat transfer area2m2
CabinVolume3m3
Solar radiation0.9 (Hot climate)W/m2
1.3 (Cold climate)
One Occupant heat source70W
Table 5. Simulation scenarios.
Simulation ConditionsCase No. 1Case No. 2
Operating environmentHot climateCold climate
Ambient temperature36 °C−10 °C
Driving cycleHWFETHWFET
Simulation time765 s765 s
Cabin target temperature23 °C23 °C
HVB target temperature27–33 °C27–33 °C
PE module target temperature47–51 °C47–51 °C
Disclaimer/Publisher’s Note: The statements, opinions and data contained in all publications are solely those of the individual author(s) and contributor(s) and not of MDPI and/or the editor(s). MDPI and/or the editor(s) disclaim responsibility for any injury to people or property resulting from any ideas, methods, instructions or products referred to in the content.

