Article

A Novel Method for Estimating State of Power of Lithium-Ion Batteries Considering Core Temperature

by
Ruixue Zhang
1,2,
Keyi Wang
1,*,
Zhilong Yu
2 and
Gang Zhao
1
1
College of Mechanical and Electrical Engineering, Harbin Engineering University, Harbin 150001, China
2
College of Automation, Harbin University of Science and Technology, Harbin 150080, China
*
Author to whom correspondence should be addressed.
Batteries 2024, 10(12), 409; https://doi.org/10.3390/batteries10120409
Submission received: 20 September 2024 / Revised: 1 November 2024 / Accepted: 20 November 2024 / Published: 22 November 2024
(This article belongs to the Section Battery Modelling, Simulation, Management and Application)

Abstract

:
Operation above acceptable limits in terms of current, voltage, and temperature can lead to lithium batteries overheating, increasing the risk of thermal runaway, which can also degrade battery materials more quickly, reducing overall lifespan. Estimating the state of power (SOP) of a battery is necessary for battery safety control and preventing operation above acceptable limits. However, the SOP is influenced by coupled multiple parameters including the state of charge, state of health, and core temperature, which make it challenging to estimate comprehensively. Based on the electro-thermal model, this study proposes a multi-parameter coupled method for comprehensively estimating the SOP considering the core temperature. This method provides a robust approach to accurately assessing the SOP across varying core temperatures, states of charge (SoC), and voltage levels. The combination of maximum likelihood estimation, adaptive genetic algorithms for parameter identification, and the unscented Kalman filter for state estimation was found to enhance the accuracy and robustness of battery models. The results show that the battery core temperature and terminal voltage are important and the main limitation on the SOP, respectively. This study lays a strong foundation for effective energy management and life extension of lithium batteries, particularly in high-temperature environments.

1. Introduction

The mitigation of CO2 emissions is the key environmental challenge of the coming years. To face this challenge, fossil fuel consumption must be reduced in the transport medium by developing new technologies. Electrification is one of the main current actions to achieve this reduction in road transport [1]. However, for general public acceptance, electrified vehicles require better performance. Lithium-ion battery (LIB) technology is the energy storage method of choice for these vehicles [2,3]. In practical applications, using lithium batteries above acceptable limits seriously reduces their life and may even trigger thermal runaway [4]. Therefore, battery management systems (BMS) need to monitor and control the state of the battery to ensure that it is operating in safe conditions [5,6]. State of power (SOP), defined as the maximum power that can be applied to the battery by charging or discharging in a certain short time horizon, is one of the most important bases for BMS to control the battery operation [7,8,9]. However, SOP cannot be measured directly by BMS and is related to the battery parameters of state of charge (SOC), terminal voltage, and temperature [10,11,12]. Moreover, these parameters are coupled with each other, which makes accurate estimation of SOP very difficult [13,14,15].
The three methods for SOP estimation—characteristic maps, electrochemical model-based methods, and equivalent circuit model (ECM)-based methods—each have distinct advantages and applications [16,17,18,19]. ECM-based methods have the advantages of robustness, adaptability, and computation with satisfactory accuracy, and are the most widely used technology nowadays [20,21]. Ruo et al. [22] developed a multi-constraint SOP estimation algorithm based on ECM with a regression-based algorithm. Their algorithm is superior in a lengthy prediction window. Sun et al. [23] proposed an ECM-based dynamic multi-parameter method for estimating SOP in lithium-ion batteries with the constraints of cell voltage, cell current, and cell SOC. This method calculates the reliable available SOP in real time. Li et al. [24] predicted SOP based on ECM with electrochemical impedance spectroscopy, which can quickly the forecast SOP under the constant load current assumption. Li et al. [25] established a continuous discharge state of power analysis model for lithium-ion batteries with voltage and charge state constraints. Their model shows that the peak discharge power error is less than 80 W over the prediction window of 10 s. While ECM-based methods for state of power (SOP) estimation provide valuable insights, they often overlook the significant impact of temperature on battery performance.
Temperature seriously affects the estimation of SOP in lithium batteries [26]. Ref. [27] developed an electrochemical model-based online state of power prediction algorithm under different time horizons for safer and more reliable operation of lithium-ion batteries, which indicated that inaccurate estimates of SOPs at extreme temperatures can also cause safety issues. Lei et al. [28] constructed a temperature-hysteresis fully coupled model, and analyzed the model parameters under different ambient temperatures, and achieved multi-state joint estimation of SOC and SOP. Wang et al. [29] proposed an adaptive forgetting factor recursive least squares method based on improved bias compensation to achieve SOP estimation with the fusion model considered parameter correction of temperature influence. Their method further improves the accuracy of SOP estimation. Nevertheless, although the effect of temperature on SOP estimation was considered in these studies, they do not present a comprehensive temperature model in conjunction with ECM. This leads to an increase in estimation error with the SOP at different temperatures [8]. Moreover, the core temperature of a battery often exceeds its surface temperature, sometimes by as much as 10 °C or more. This discrepancy can significantly affect SOP estimation and overall battery performance. Addressing the influence of core temperature on SOP estimation is essential for improving battery management systems. By focusing on core temperature in future research, we can enhance the accuracy of SOP predictions.
A thermal-electrical coupling model, which is a powerful tool for understanding the complex interactions between temperature and battery performance, is constructed in this study. The parameters of the electrical model and thermal model are identified by maximum likelihood method (MLM) and adaptive genetic algorithm (AGA), respectively. Then, the SOC, terminal voltage, and core temperature of the battery are estimated by unscented Kalman filter (UKF) based on the thermal-electrical coupling model. Finally, we propose a multi-parameter coupled SOP estimation method including core temperature, SOC, and terminal voltage, which can provide an accurate reference for the BMS to control the battery under high temperature. This improves battery safety at high temperatures. The contributions of this study can be summarized as follows:
(1)
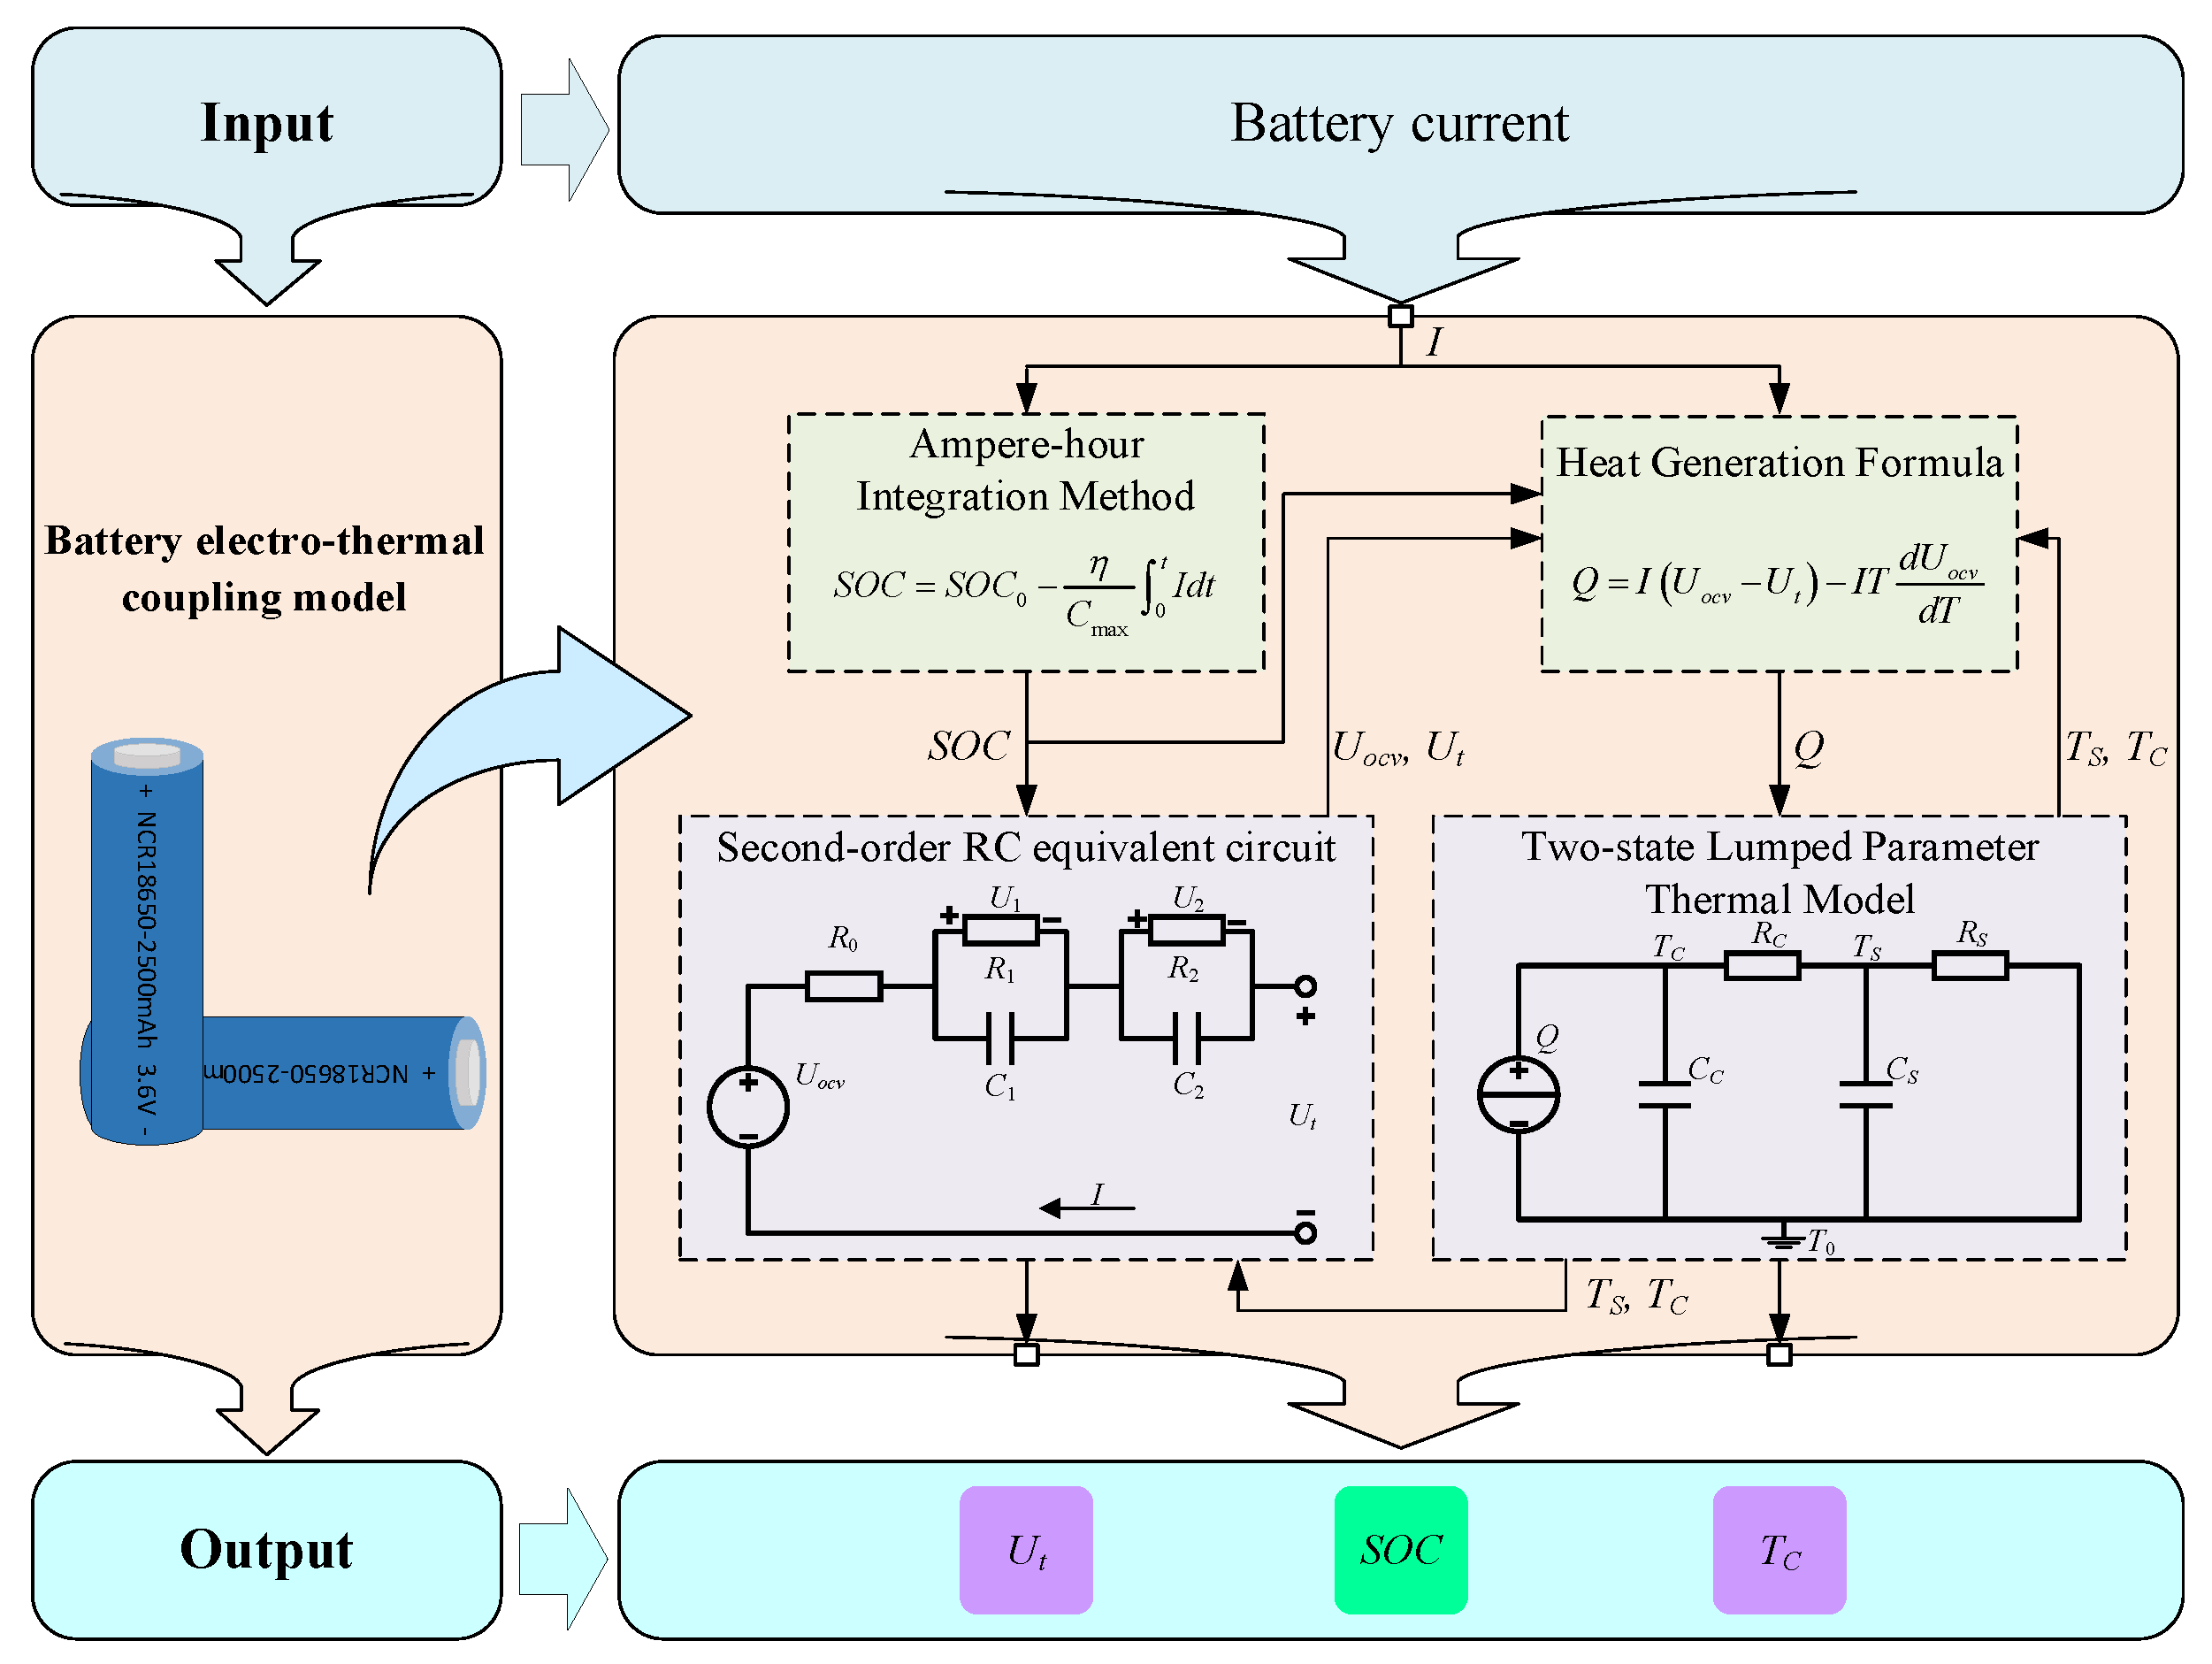
A battery electro-thermal model is developed which accounts for battery core temperature. The parameters of this electrical and thermal model are coupled with each other to accurately characterize the electro-thermal properties of the battery, which are identified by MLM and AGA, respectively. The thermal model also contains the core and surface temperatures of the battery. UKF is used to estimate model results, which ensures that the model is highly accurate.
(2)
Multi-constrained SOP estimation with core temperature is included. A multi-parameter coupled method for estimating SOP is proposed based on the above electro-thermal model. This method is capable of accurately estimating the SOP under multiple constraints throughout the battery charging and discharging process. Constraining core temperature improves battery safety at high temperatures.
The layout of this paper is as follows: in Section 2, the battery electro-thermal model is proposed, and battery charging and discharging data are obtained experimentally to identify the parameters. In Section 3, the battery SOC and state of temperature (SOT), including core and surface temperature (SOTC, SOTS), are jointly estimated by UKF based on the model. Then, multi-constrained SOP estimation including core temperature constraint is performed in Section 4. Finally, conclusions are presented in Section 5.

2. Battery Electro-Thermal Model

In order to describe the electrical and thermal characteristics of the battery, the electro-thermal coupling model is integrated and developed in this study, and is the basis for estimating the SOP. The structure of the model consists of two main parts: electronic and thermotic. The electronic and thermotic parameters are coupled with each other by physical formula. Then, the parameters of the electrical and thermal model are identified by MLM and AGA, respectively. The elaborated development of the model is as follows.

2.1. Model Structure
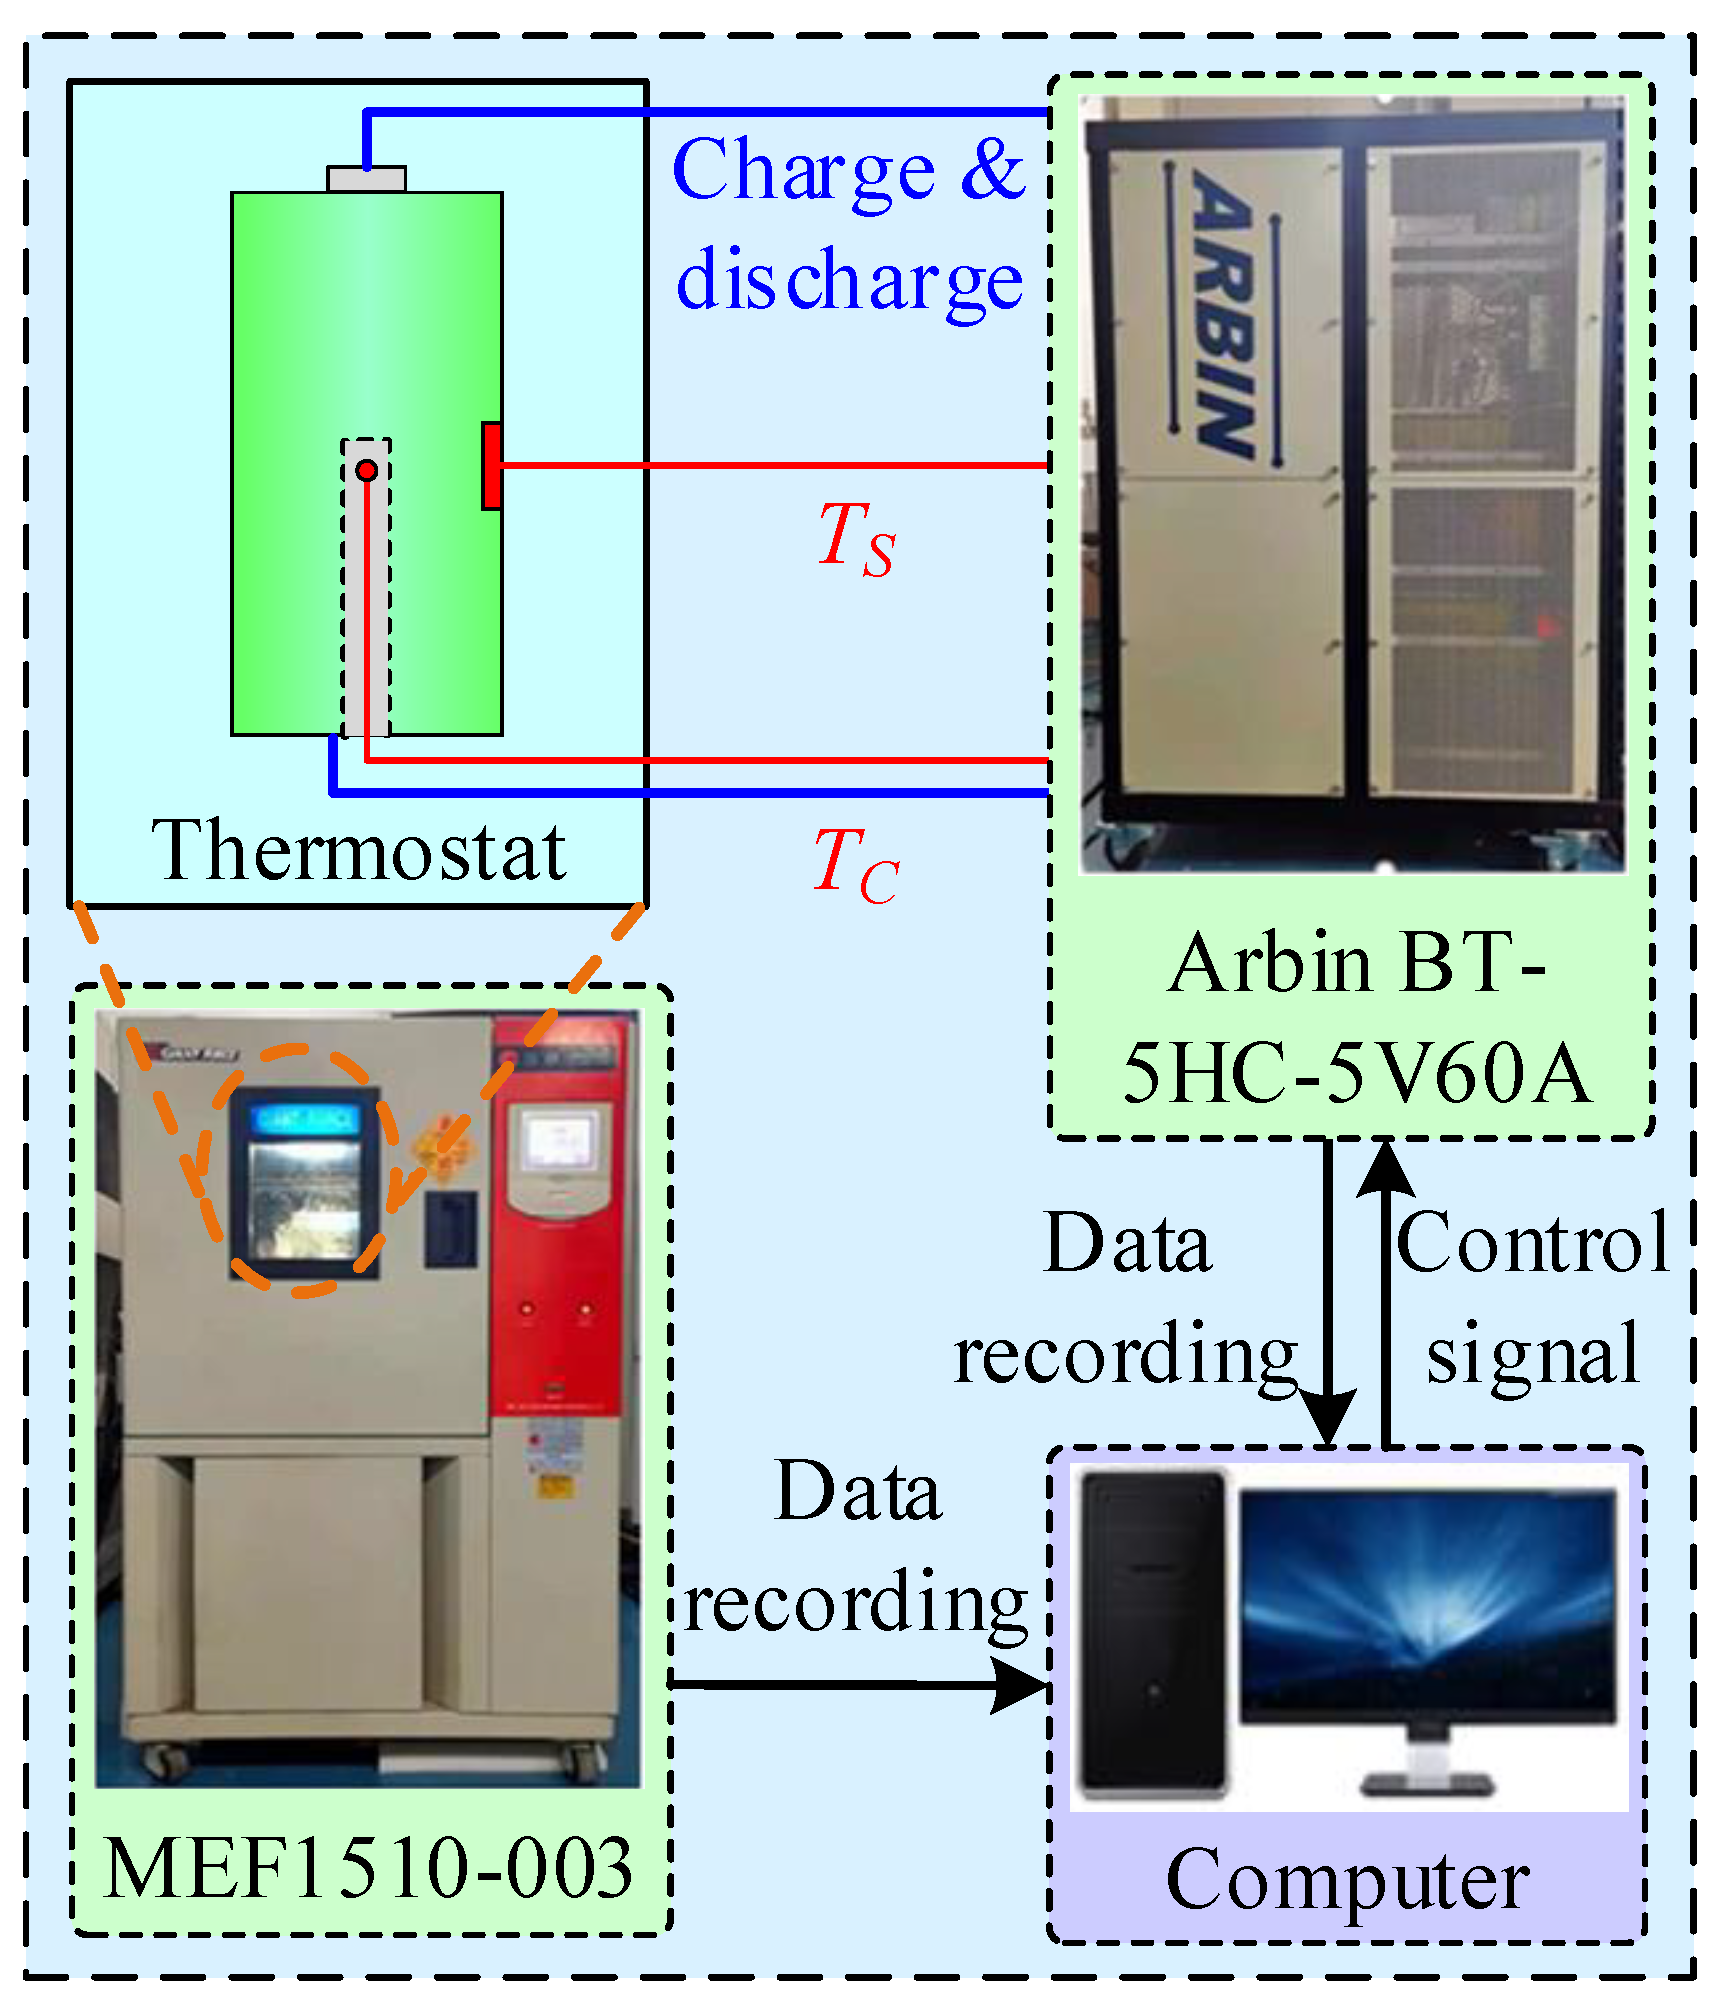
In order to describe the electrical characteristics of the battery, a typical second-order RC equivalent circuit is employed, as shown in Figure 1. The input parameter of SOC for the second-order RC equivalent circuit is provided by the ampere–hour integration method (i.e., Equation (1)).
S O C = S O C 0 0 t I d t C m a x ,
where Cmax indicates maximum available battery capacity. According to Kirchhoff’s law, the relationship between battery terminal voltage and current of the second-order RC equivalent circuit can be expressed as follows:
U t = U o c v U 1 U 2 I R 0 C 1 d U 1 d t + U 1 R 1 = I C 2 d U 2 d t + U 2 R 2 = I ,
where Uocv and Ut represent the open circuit voltage (OCV) and the terminal voltage of the battery, respectively; R0 represents the ohmic internal resistance; R1 and R2 represent the polarization internal resistance; and C1 and C2 represent the polarization capacitance.
Moreover, the two-state lumped parameter thermal model is applied to describe the thermal characteristics of the battery, and incorporates the core and surface temperatures (i.e., Tc and Ts) of the battery. According to the Bernardi model, the total heat output Q of the battery can be equivalent to a direct current source and calculated by Equation (3) [30].
Q g e n = I ( U o c v U t ) I T d U o c v d T ,
where T represents the average temperature of the battery in Kelvin (K), and I (UocvUt) and ITdUocv/dT represent irreversible and reversible heat, respectively. dUocv/dT represents the entropy heat coefficient of the battery. As shown in Figure 1 for the thermal model, RC and CC represent the thermal resistance and capacity between the core and the surface of the battery, respectively. RS and CS represent the thermal resistance and capacity between the battery surface and the air, respectively. TC, TS, and T0 represent the temperatures of the battery core, surface, and the environment, respectively, which can be considered as the voltages in the thermal model. Therefore, the battery heat transfer process can be expressed as follows:
C c d ( T c T 0 ) d t = Q T c T s R c C s d ( T s T 0 ) d t = T c T s R c T s T 0 R s .
Since the electrical and thermal characteristics of a battery interact with each other, we coupled the parameters of the electrical and thermal models, as shown in Figure 1. The Ut and Uocv of the electrical model are passed to the thermal model to calculate the Q, and the TC and TS of the thermal model in turn affect the values of the resistance and capacitance of the electrical model. This parameter passes between both models to form a closed-loop coupling which accurately characterizes the electro-thermal properties of the cell.

2.2. Experiment

The OCV–SOC curve under different battery temperatures is the basis for identifying the model parameters. Therefore, Hybrid Pulse Power Characteristic (HPPC) discharge tests were carried out at the different temperatures [31]. The object of this experiment was a Panasonic NCR18650BD Li-ion battery (Panasonic, Osaka, Japan), and its information is provided in Table 1. In order to obtain the core temperature of the battery precisely, a 1.5 mm hole was drilled in the negative electrode, into which a temperature sensor was inserted. Discharging the battery to the cut-off voltage before drilling is an important safety measure. The hole was then sealed with temperature-rising glue and a catalyst.
The test platform is shown in Figure 2. The thermostat was a JUFU MEF1510-003 (Jufu, China), and the battery charging and discharging equipment was an Arbin BT-5HC-5V60A (Arbin, College Station, America). The discharge rate of the HPPC test was 1 C, and the pulse tests were performed at 5% SOC intervals, as shown in Figure 3. Moreover, the ambient temperature test condition ranged from 0 °C to 40 °C with intervals of 1 °C. Therefore, there were 41 OCV–SOV curves under different battery temperatures.

2.3. Parameter Identification

By using MLM for the electrical model and AGA for the thermal model, we effectively leverage the strengths of both methods. MLM enhances the accuracy of parameter identification through data-driven insights, while AGA provides a robust optimization framework for complex parameter spaces. This dual approach not only improves the precision of a model but also simplifies the identification process, ensuring a more efficient and reliable electro-thermal coupling model. The detailed identification processes are as follows.

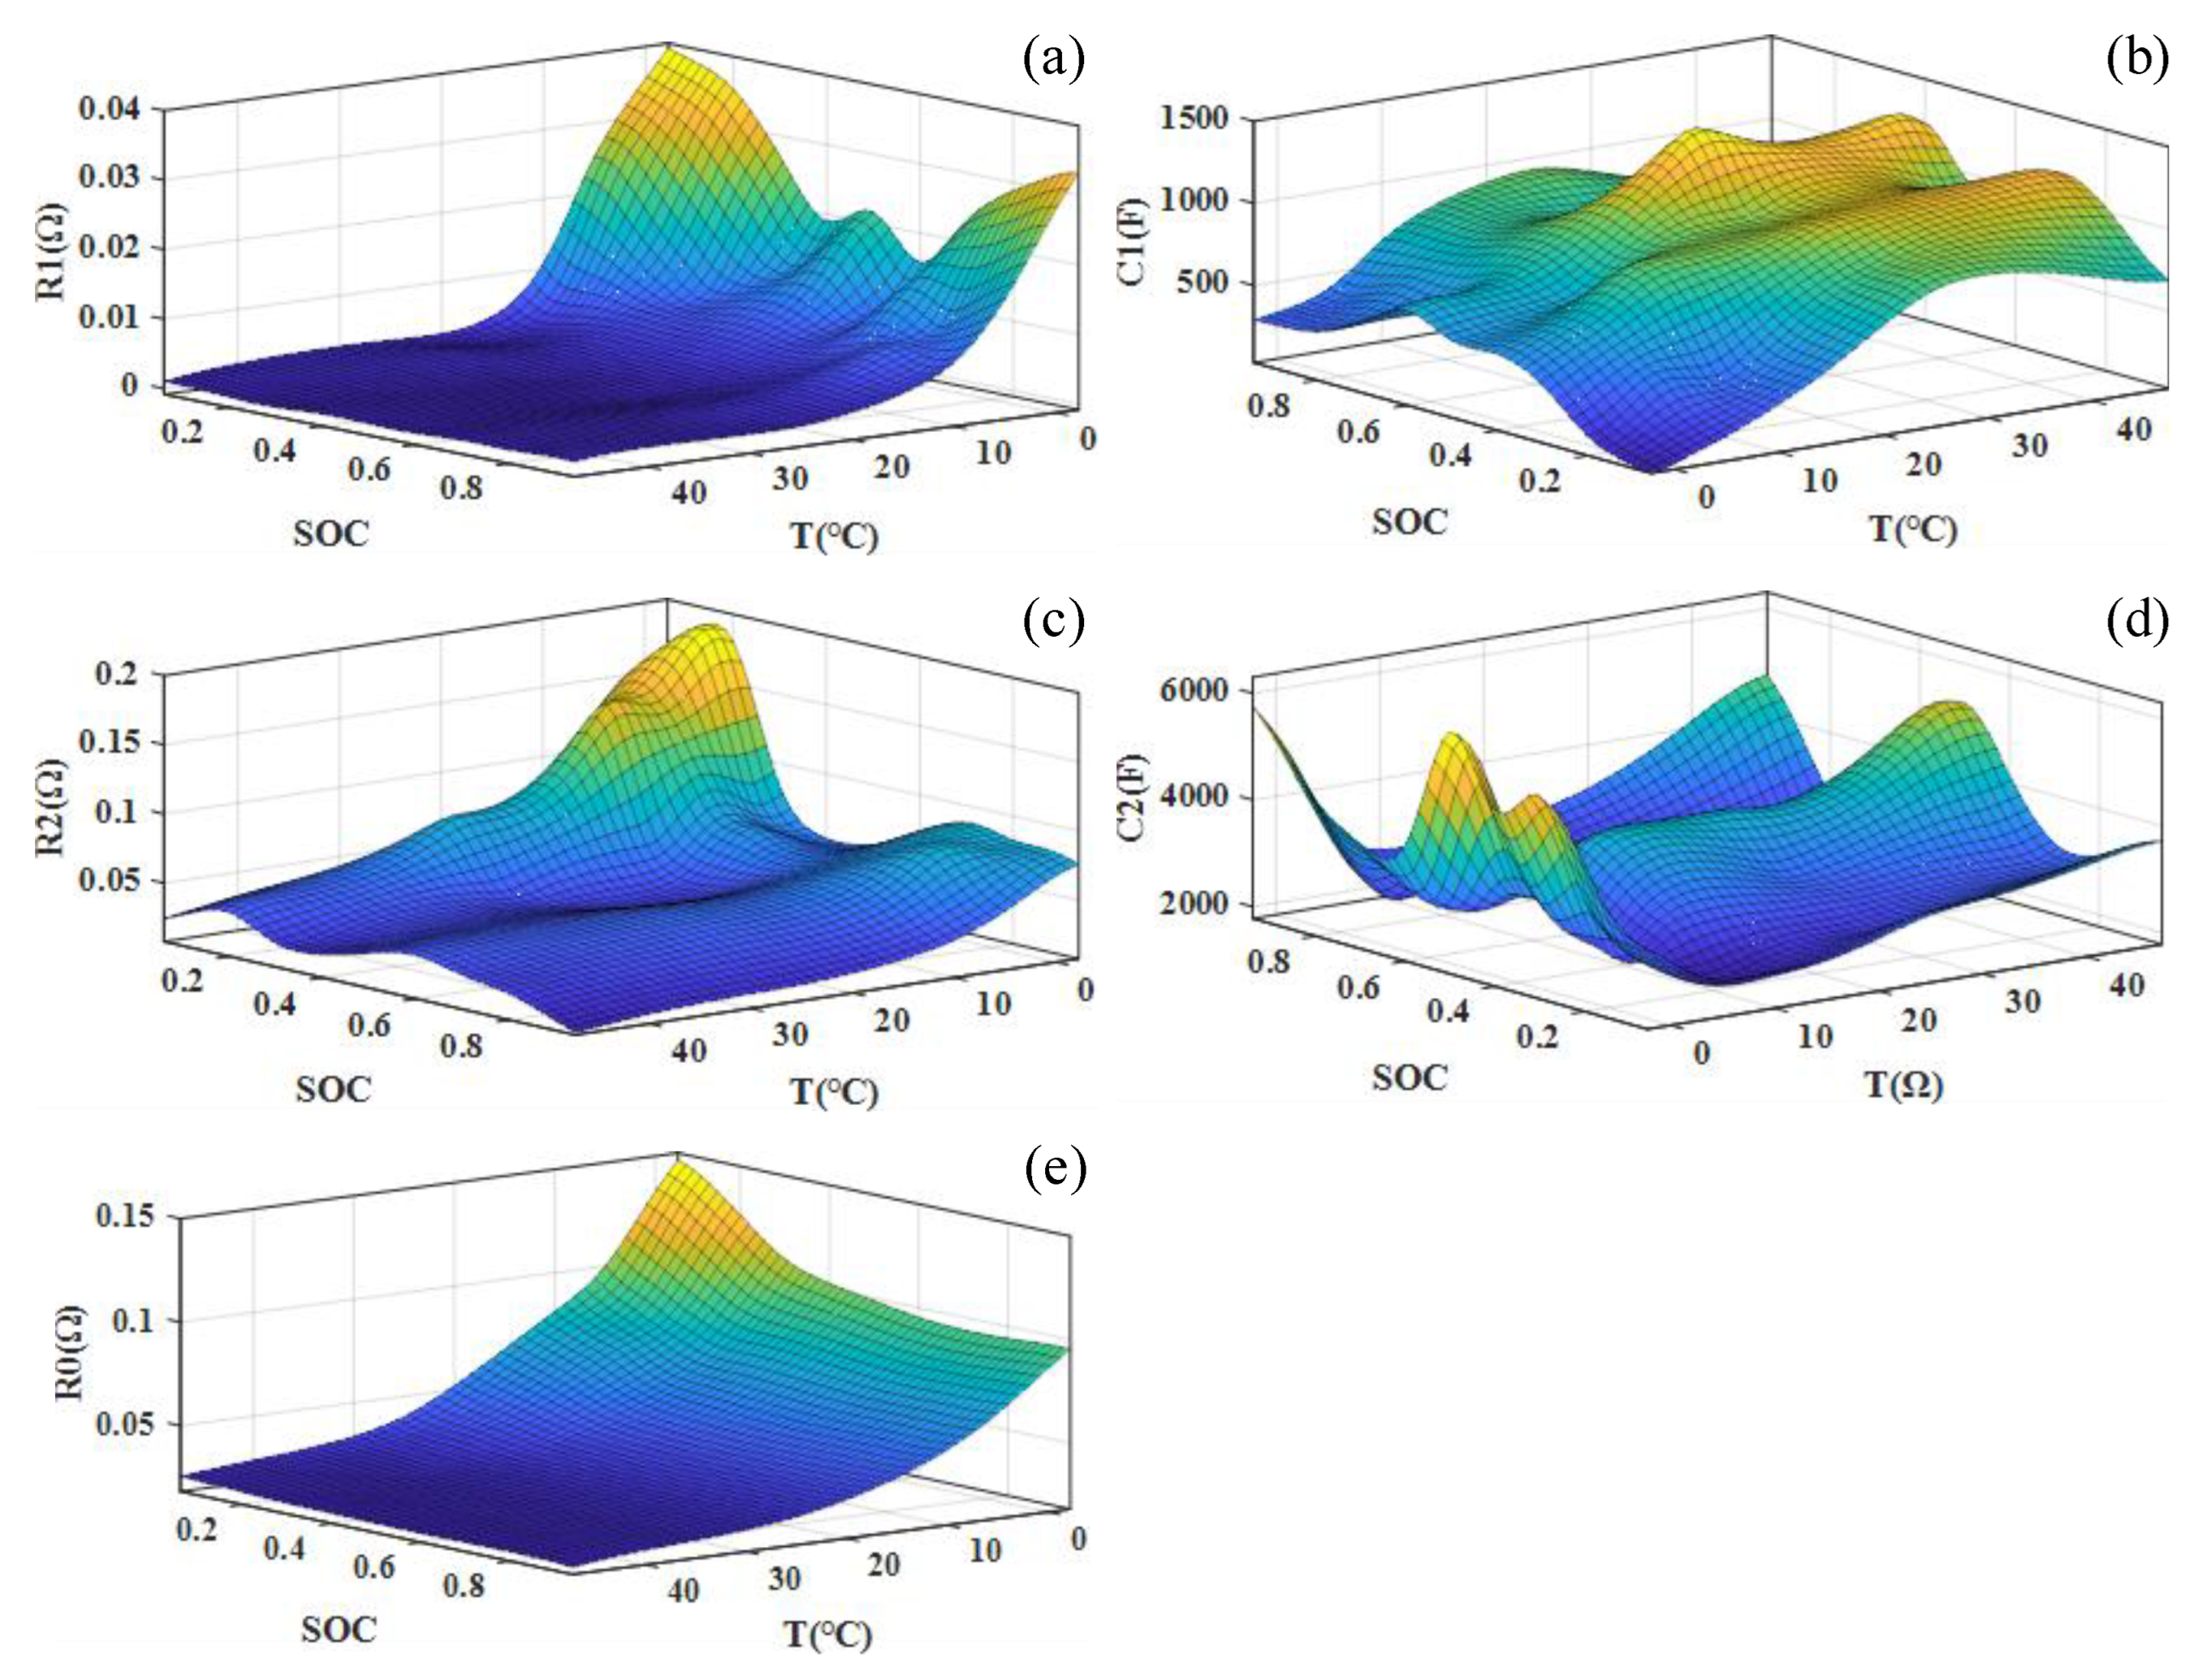
2.3.1. Parameter Identification of Electrical Model

The parameters of the electrical model were identified by MLM. The data basis for identification was a total of 200 units of sampling data at different temperatures around each 5% SOC point, and the obtained results were used as the model parameter values at the current temperature and SOC. The identified results of the model parameters at different ambient temperatures and SOC could then be obtained, as shown in Figure 3.
In order to validate the accuracy of the model, the Ut of pulse discharge obtained by both model and experiment at 25 °C were compared, as shown in Figure 4a. The errors in Ut obtained by the model compared to the experiment are shown in Figure 4a. This demonstrates that the Ut obtained by the model was high-accuracy, and that its errors were less than 40 mV.

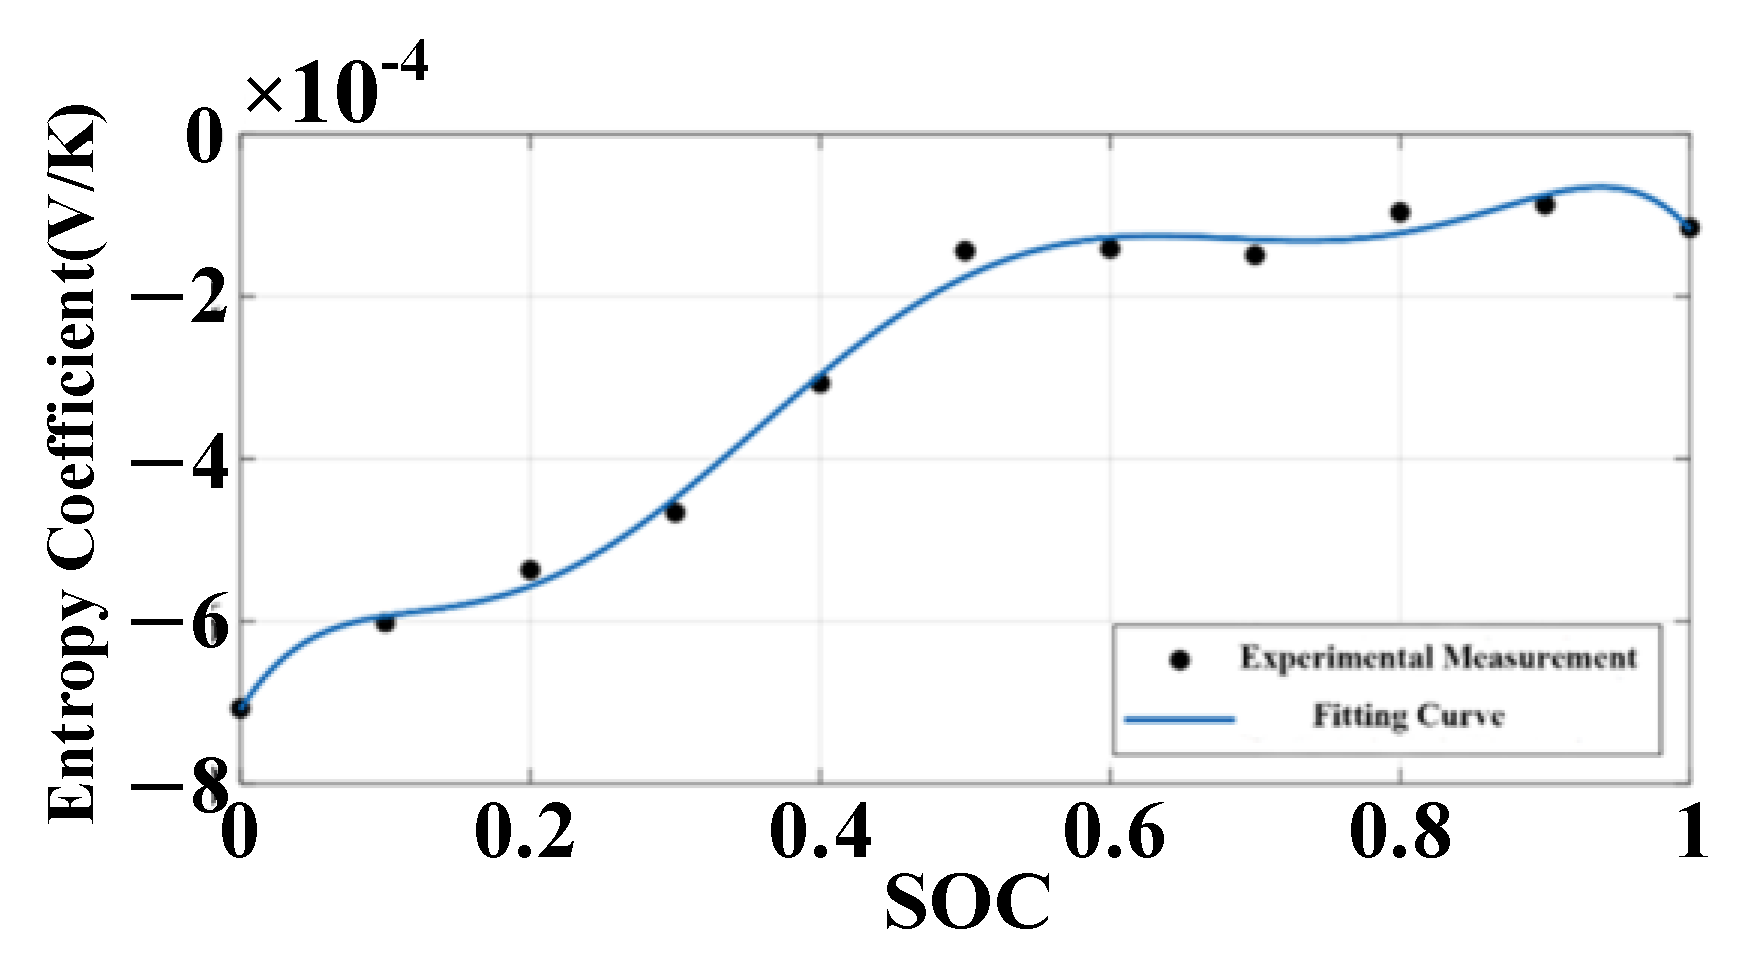
2.3.2. Parameter Identification of Thermal Model

As mentioned earlier, as shown in Figure 1, the thermal model contains the entropy coefficient (i.e., dUocv/dT). Therefore, identifying the entropy coefficient is essential for the parameter identification of the thermal model. The entropy heat coefficient was identified by the presented measurement method [32], and the results are shown in Figure 5.
The other parameters (i.e., Rc, Rs, Cc, and Cs) of the thermal model were then identified by AGA. The specific identification process was as follows. Let Tc0 = TcT0, Ts0 = TsT0, then the state-space equation of the thermal model can be expressed as follows:
C c d T c 0 d t = Q T c 0 T s 0 R c C s d T s 0 d t = T c 0 T s 0 R c T s 0 R s
According to Equation (5), with Q as input and Tc0 as output, the discrete differential equation can be obtained as shown in Equation (6).
T c 0 ( k ) = a T c o ( k 1 ) + b T c 0 ( k 2 ) + c Q ( k 1 ) + d Q ( k 2 )
The specific expressions a, b, c, and d in Equation (6) are shown as follows:
a = 2 Δ T C s R c Δ T C s R s Δ T C c R c b = ( 1 Δ T C c R c ) ( Δ T C s R c + Δ T C s R s 1 ) + Δ T 2 C c C s R c 2 c = Δ T C c d = Δ T C c ( Δ T C s R c + Δ T C s R s 1 ) ,
where ΔT represents the sampling time, and its value is 1 s. Let Equation (6) be the objective function of AGA and use the voltage, current, and temperature data as inputs to AGA. Then Rc, Rs, Cc, and Cs can be identified, and their results are listed in Table 2.
The parameter identified results of the thermal model were verified by the test data of 1 C discharge at 25 °C, as shown in Figure 6; the temperature curves obtained from the model and experiment are in general agreement, and the errors in the temperature curves of the model are less than 1 °C.

3. Joint Estimate of SOC and SOT

Estimating the SOC and SOT of a battery is essential for predicting the SOP. However, the parameters within the battery are intricately coupled, which increases the uncertainty associated with estimating SOC and SOT, particularly the SOTC. To address these challenges, we jointly estimated the SOC and SOT using the UKF based on the electro-thermal model outlined above. This approach leveraged the model’s insights to enhance the accuracy and reliability of our estimations.

3.1. Joint Estimation Algorithm Based on UKF

The UKF algorithm is widely used in the state estimation of lithium-ion batteries due to its advantage of dealing with nonlinear systems with high accuracy [33,34]. The basic theory of UKF is to approach the real results using the sigma point method. The UKF estimation process for the SOC and SOT of the battery is shown in Figure 7.
In order to use the UKF algorithm to estimate the state of a lithium-ion battery, it is necessary to derive the discrete state-space equations of the electrical and thermal models. For the electrical model, its state variables were SOC, electrochemical polarization voltage, and concentration polarization voltage; its inputs were battery charging and discharging current; and its output was battery terminal voltage. Therefore, the state-space equations of the electrical model can be expressed as follows (the sampling time is 1 s):
S O C ( k + 1 ) U 1 ( k + 1 ) U 2 ( k + 1 ) = A × S O C ( k ) U 1 ( k ) U 2 ( k ) + B × I ( k ) + w k U t ( k ) = C × 1 U 1 ( k ) U 2 ( k ) + D k × I ( k ) + v k
where
A = 1 0 0 0 e t R 1 C 1 0 0 0 e t R 2 C 2 ,
B = η t / C max R 1 ( 1 e t R 1 C 1 ) R 2 ( 1 e t R 2 C 2 ) ,
C = U o c v ( T , S O C )     1     1 ,
D = R 0 .
For the thermal model, its state variables were Tc0 and Ts0, its input was Q, and its observed variable was Ts0. Consequently, the state-space equations of the thermal model can be expressed as follows:
T c 0 ( k + 1 ) T s 0 ( k + 1 ) = A × T c 0 ( k ) T s 0 ( k ) + B × Q ( k ) + w k T s 0 ( k ) = C × T c 0 ( k ) T s 0 ( k ) + D × Q ( k ) + v k
where
A = 1 t C c R c t C c R c t C s R c 1 t C s R c t C s R s ,
B = t C c 0 ,
C = 0 1 ,
D = 0 .

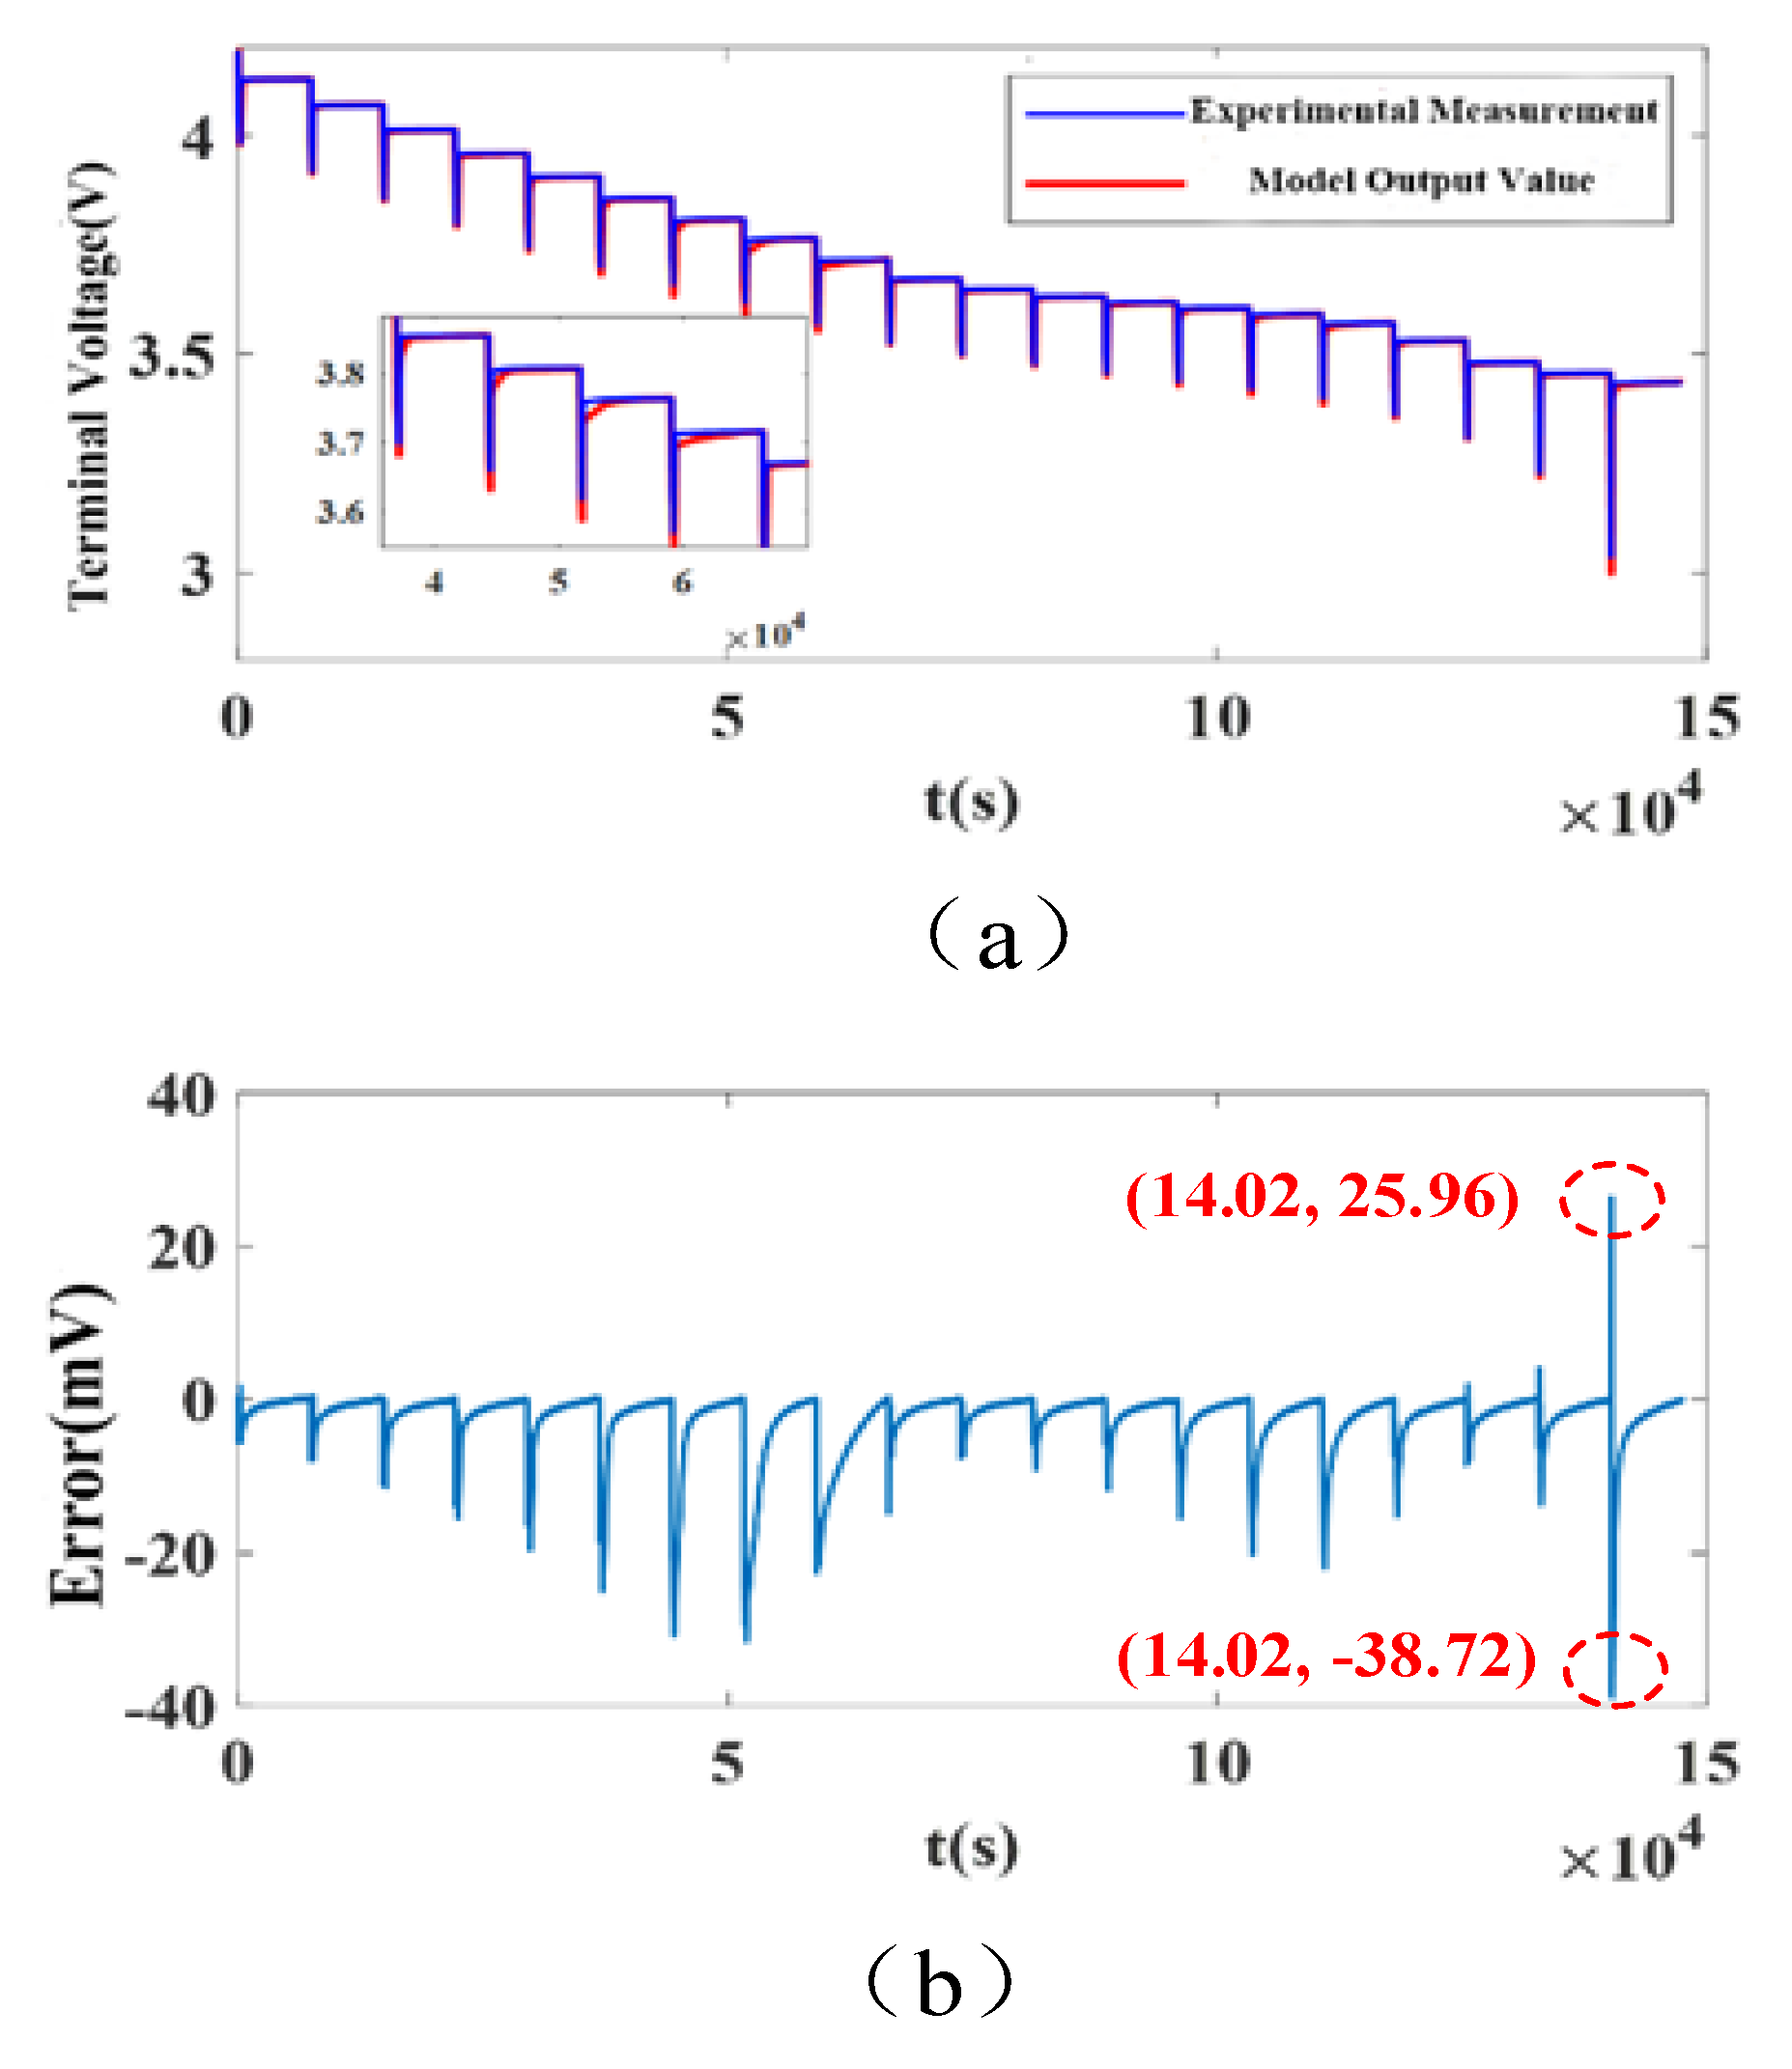
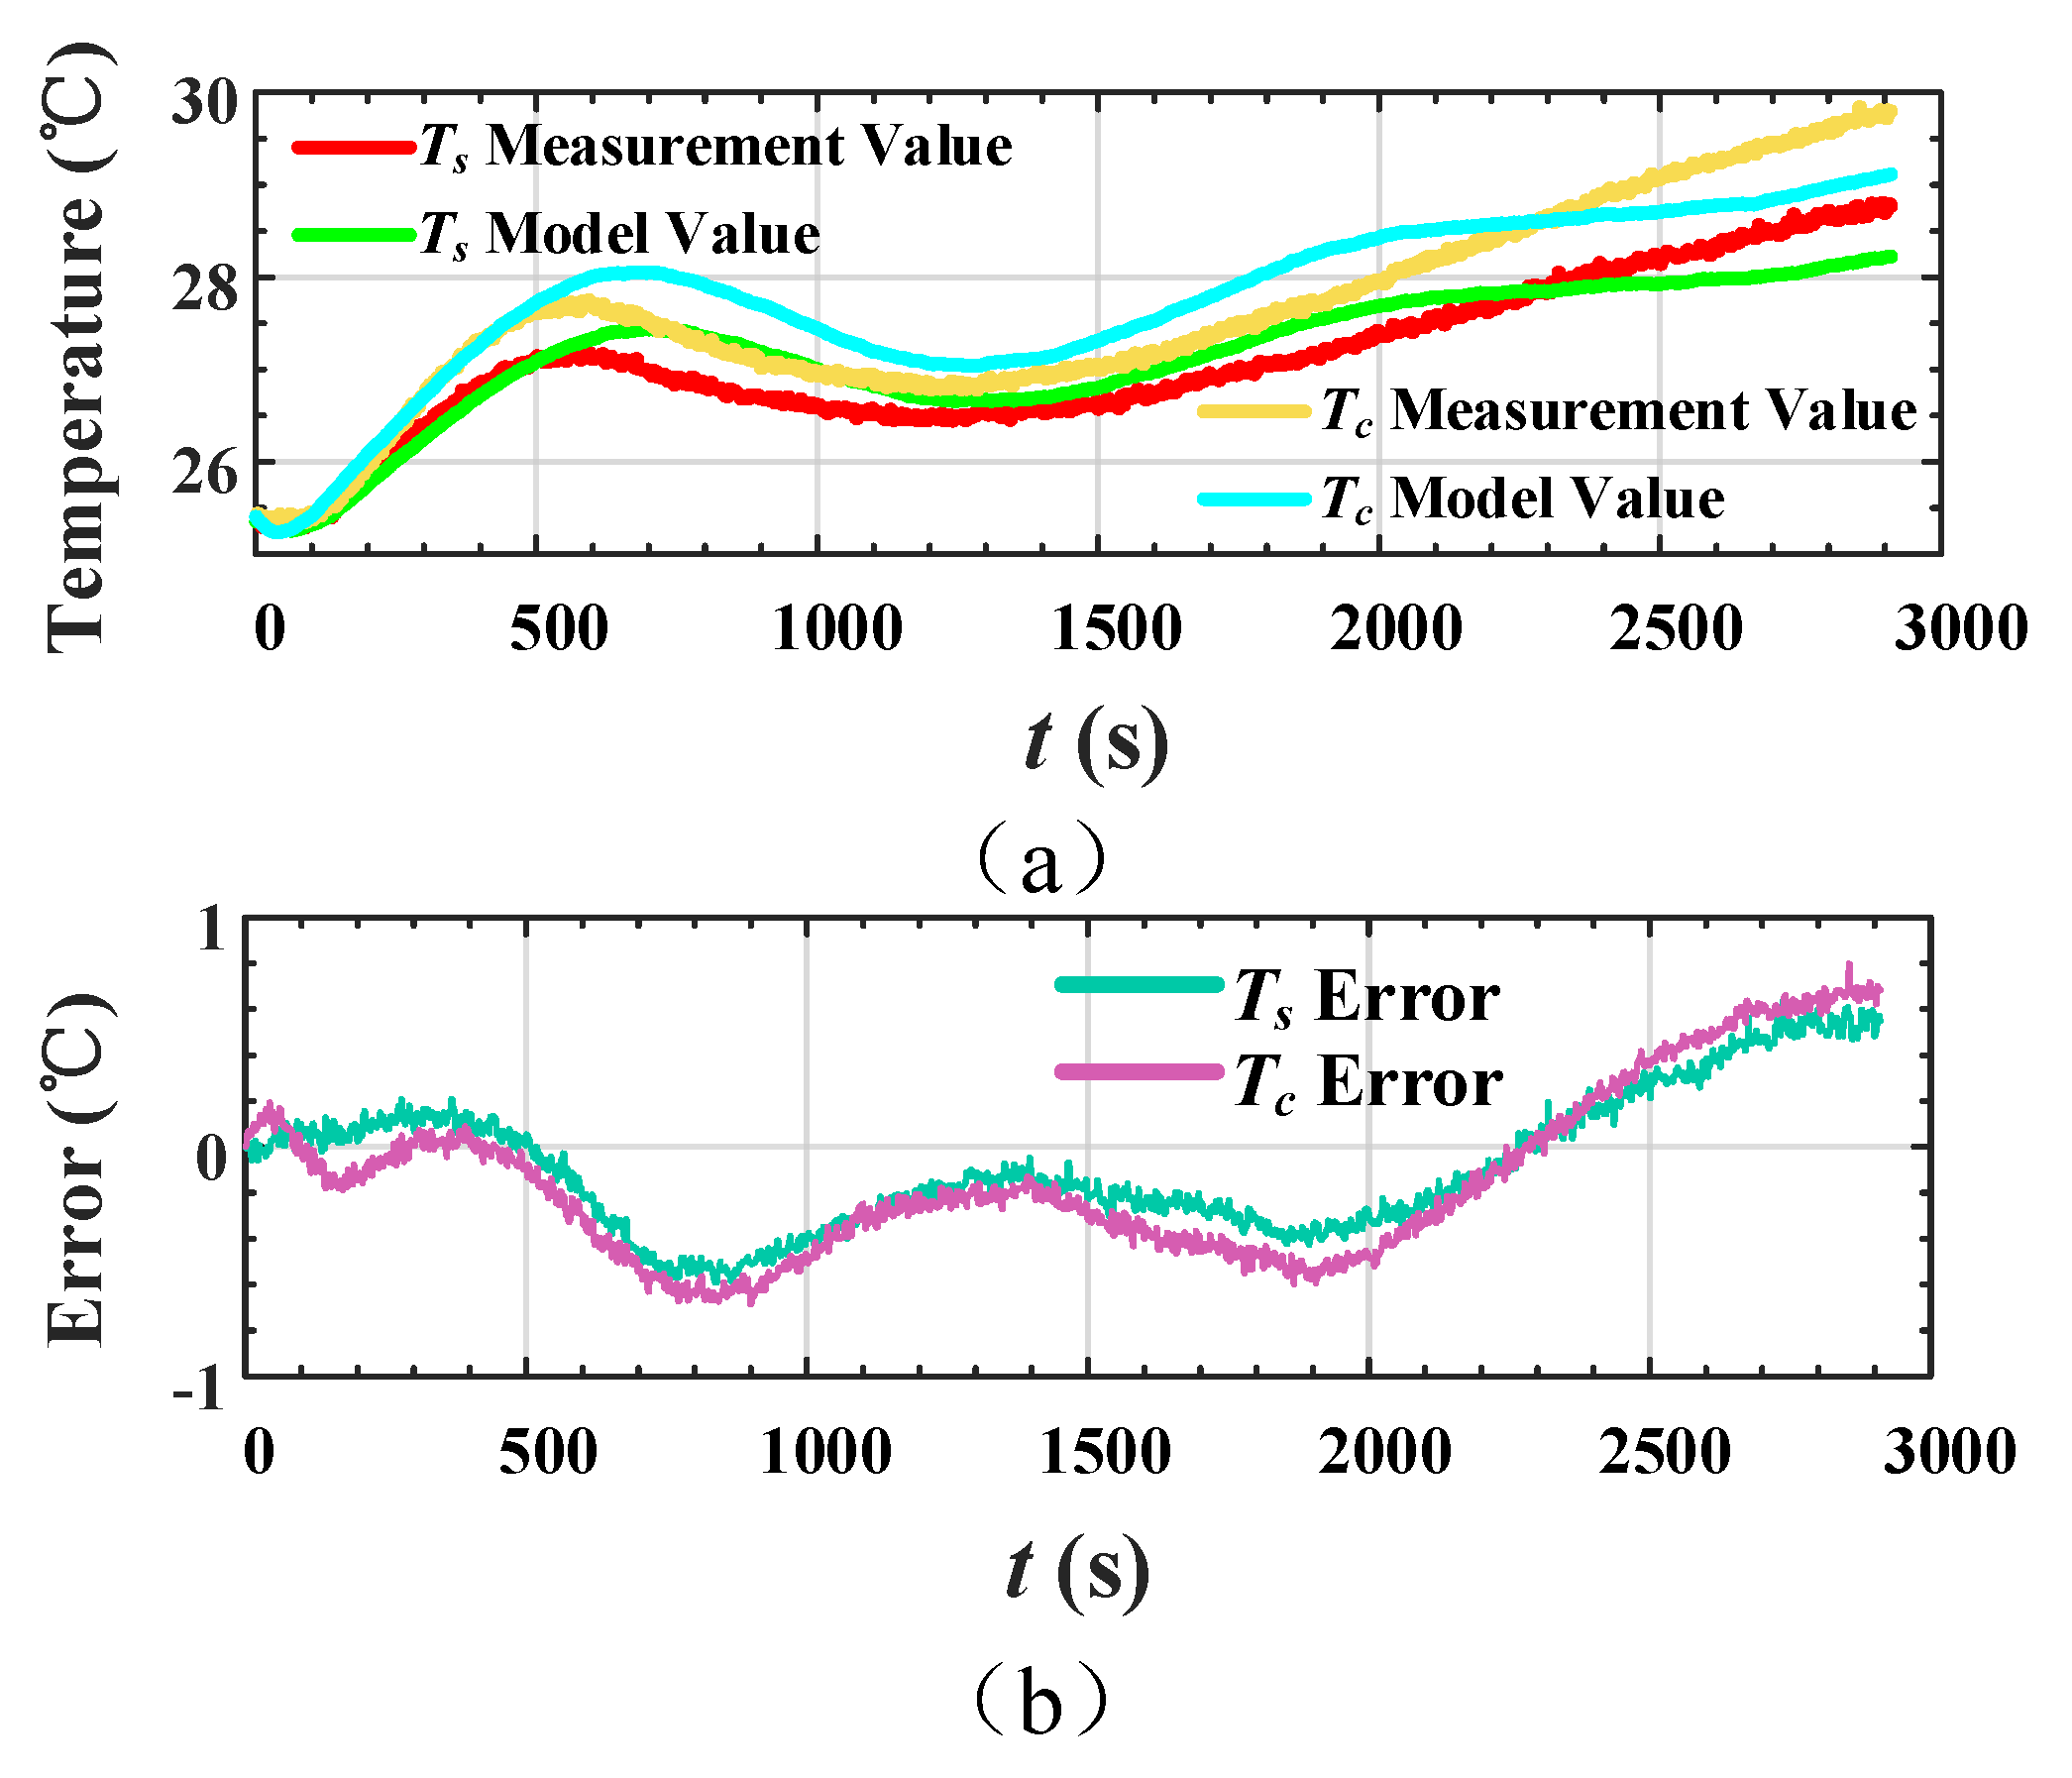
3.2. Results of Estimation for SOC and SOTC

In order to verify the accuracy of the above joint estimation algorithm and its applicability for multiple working conditions, the model results were compared to the battery data for the urban dynamometer driving schedule (UDDS) at different temperatures, as shown in Figure 8. It illustrates that the SOTC and SOC curves obtained by the model at different discharge rates are essentially coincident with those of experiment and their errors are less than 1 °C and 0.15, respectively.
The RMSE and MAE of the battery SOTC and SOC under different ambient temperatures are listed in Table 3. It shows that the RMSE and MAE of the SOTC and SOC are very small, so the developed electro-thermal model in this study is high-accuracy under the UDDS operating conditions.

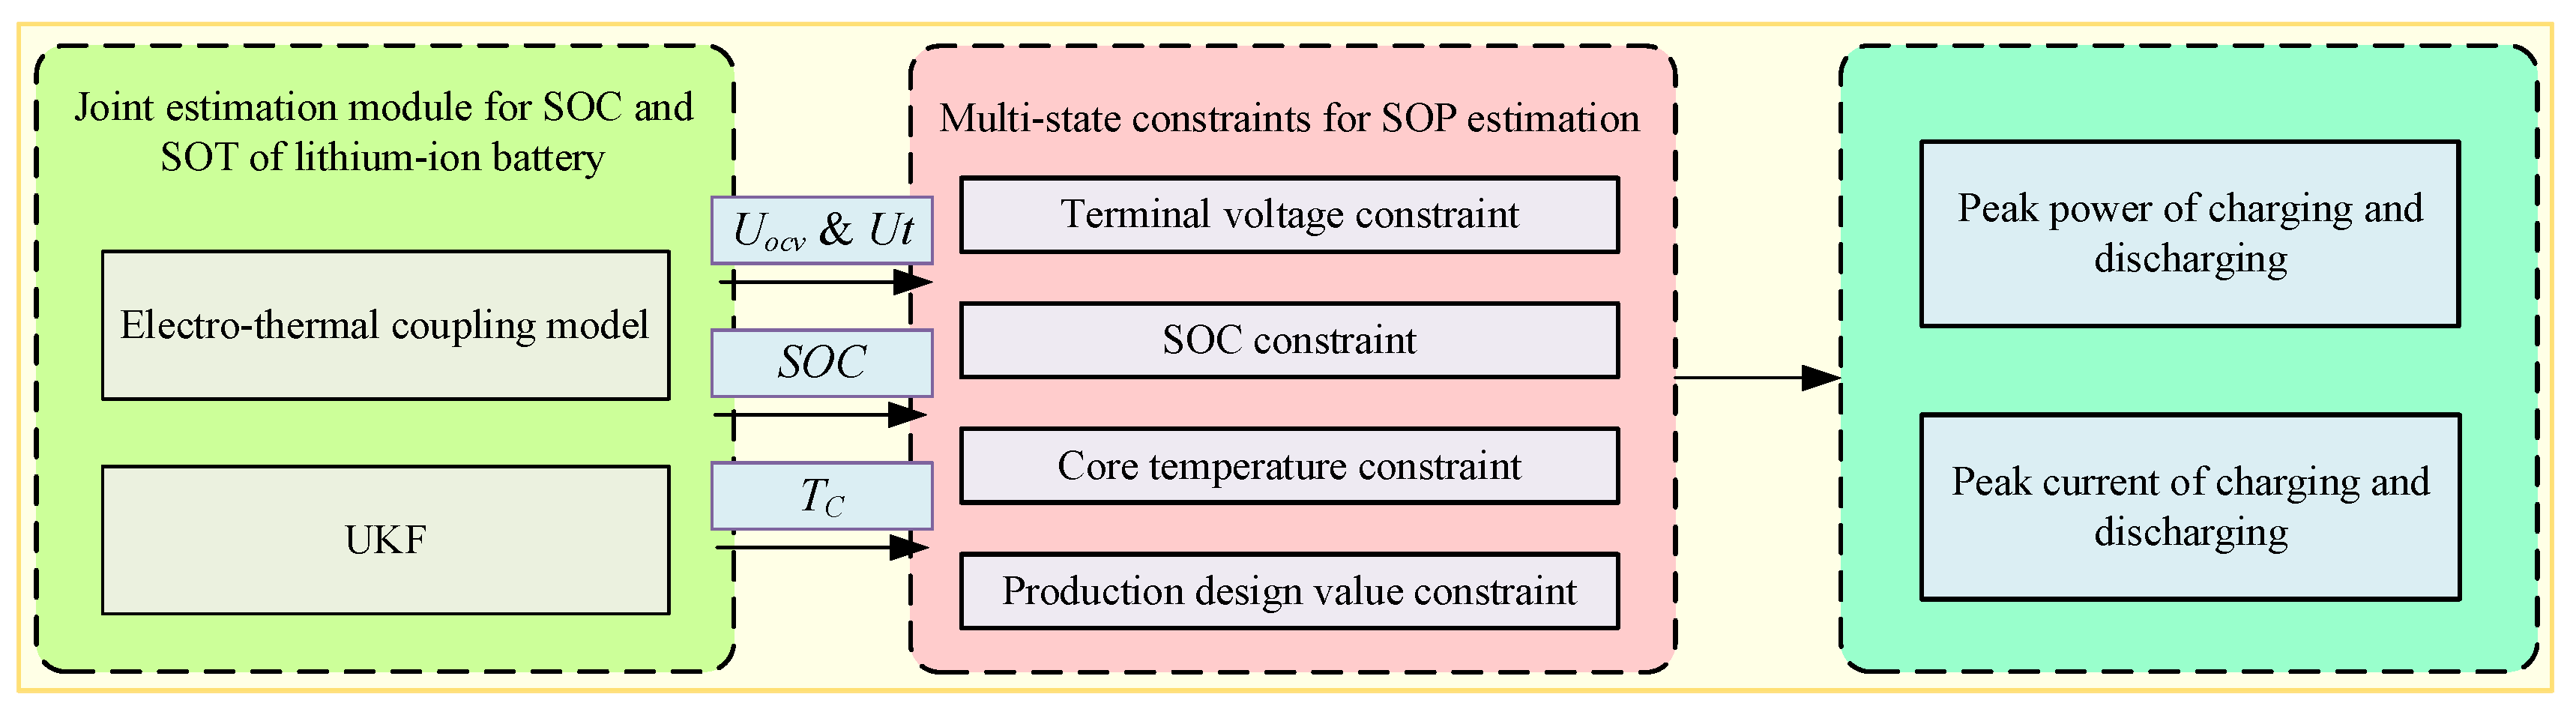
4. SOP Estimation with Multi-State Constraints

Based on the above joint estimation results of SOC and SOT, this section proposes the estimation of the SOP with multi-state constraints, as shown in Figure 9. These constraints for SOP include Ut, SOC, Tc, and production design value. The derivations of these constraints for SOP are as follows.

4.1. SOC Constraint

Considering the upper and lower limits of SOC combined with Equation (1), the minimum charging current and the maximum discharging current of the battery can be expressed as follows:
I min cha , s o c = S O C k S O C max η N Δ T / C max I max d i s , s o c = S O C k S O C min η N Δ T / C max
where SOCk represents the SOC value at different time points, which is provided by the estimated SOC value based on the model, and SOCmax and SOCmin represent the SOC upper limit and lower limit, respectively.

4.2. Terminal Voltage Constraint

The formula of Ut can be discretized according to the battery circuit model. Its result is shown as follows:
U t ( k + N ) = U o c v ( S O C k + N ) U 1 ( k + N ) U 2 ( k + N ) I k + N R 0
The Uocv cannot be directly measured when the battery is working, but it can be regarded as a variable related to SOC. Then it can be decoupled by Taylor series expansion as follows:
U o c v ( S O C k + N ) = U o c v ( S O C k ) I k η N Δ T C max U o c v ( S O C k ) S O C k
Moreover, the polarization voltages U1(k + N) and U2(k + N) at time k + N are as follows:
U 1 ( k + N ) = U 1 ( k ) e N Δ T R 1 C 1 + I k R 1 ( 1 e Δ T R 1 C 1 ) i = 0 N 1 ( e Δ T R 1 C 1 ) i U 2 ( k + N ) = U 2 ( k ) e N Δ T R 2 C 2 + I k R 2 ( 1 e Δ T R 2 C 2 ) i = 0 N 1 ( e Δ T R 2 C 2 ) i
Let
λ j = ( 1 e Δ T R j C j ) i = 0 N 1 ( e Δ T R j C j ) i ,       j = 1 , 2 ,
then
U t ( k + N ) = U o c v ( k ) U 1 ( k ) ( e Δ T R 1 C 1 ) N U 2 ( k ) ( e Δ T R 2 C 2 ) N I k ( η N Δ T C max U o c v ( S O C k ) S O C k + λ 1 R 1 + λ 2 R 2 + R 0 )
Consequently, the constraints of charge and discharge current can be obtained by setting the charging cut-off voltage U t m a x and the discharge cut-off voltage U t m i n as the upper and lower limits of the terminal voltage, respectively, as shown in Equation (24).
I min c h a , v o l t = U o c v ( S O C k ) U 1 ( k ) ( e Δ T R 1 C 1 ) N U 2 ( k ) ( e Δ T R 2 C 2 ) N U t max η N Δ T C max U o c v ( S O C k ) S O C k + λ 1 R 1 + λ 2 R 2 + R 0 I max d i s , v o l t = U o c v ( S O C k ) U 1 ( k ) ( e Δ T R 1 C 1 ) N U 2 ( k ) ( e Δ T R 2 C 2 ) N U t min η N Δ T C max U o c v ( S O C k ) S O C k + λ 1 R 1 + λ 2 R 2 + R 0

4.3. Core Temperature Constraints

According to the state-space equation of the thermal model, Tc0 can be expressed as follows:
T c 0 ( k + 1 ) = a 11 T c 0 ( k ) + a 12 T s 0 ( k ) + b 1 Q ( k )
Then the core temperature of the battery at the time k + N can be calculated as follows:
T c 0 ( k + N ) = a 11 N T c 0 ( k ) + i = 0 N 1 a 11 i a 12 T s 0 ( k ) + i = 0 N 1 a 11 i b 1 Q ( k )
In addition, Q can be approximated as Equation (27).
Q = I U o c v U t I T d U o c v d T I 2 ( R 0 + R 1 + R 2 ) I T d U o c v d T
Assuming that the battery core temperature is maximum T c m a x d i s 0 at moment k + N, then the peak charge and discharge current of battery under the constraint of the core temperature can be expressed as follows:
I min c h a , t e m p = B B 2 4 A C 2 A I max d i s , t e m p = B + B 2 4 A C 2 A
where
A = R 0 + R 1 + R 2 B = d U o c v d T T C = T c max a 11 N T c 0 ( k ) ξ a 12 T s 0 ( k ) ξ b 1 , ξ = i = 0 N 1 a 11 i
According to the above analysis, there are different limits for battery discharge/charge current under the SOC, Ut, and Tc constraint. In order to obtain the SOP, the combined limitations for battery discharge/charge current need to be derived, which is shown in Equation (30).
I max d i s = min ( I max d i s , s o c , I max d i s , v o l t , I max d i s , t e m p , I max d i s , r a t ) I min c h a = max ( I min c h a , s o c , I min c h a , v o l t , I min c h a , t e m p , I min c h a , r a t )
where the battery current is a vector: the discharge current is positive and the charge current is negative. Then the battery SOP can be estimated as follows:
P max d i s = min ( I max d i s U t ( k + N ) , P max r a t ) P min c h a = max ( I min c h a U t ( k + N ) , P min r a t )
where P c h a m a x and P r a t m i n represent the maximum discharge power and minimum charge power of the battery, respectively, and P r a t m a x and Pmin represent the maximum discharge power and minimum charge power, respectively, as specified by the manufacturer.

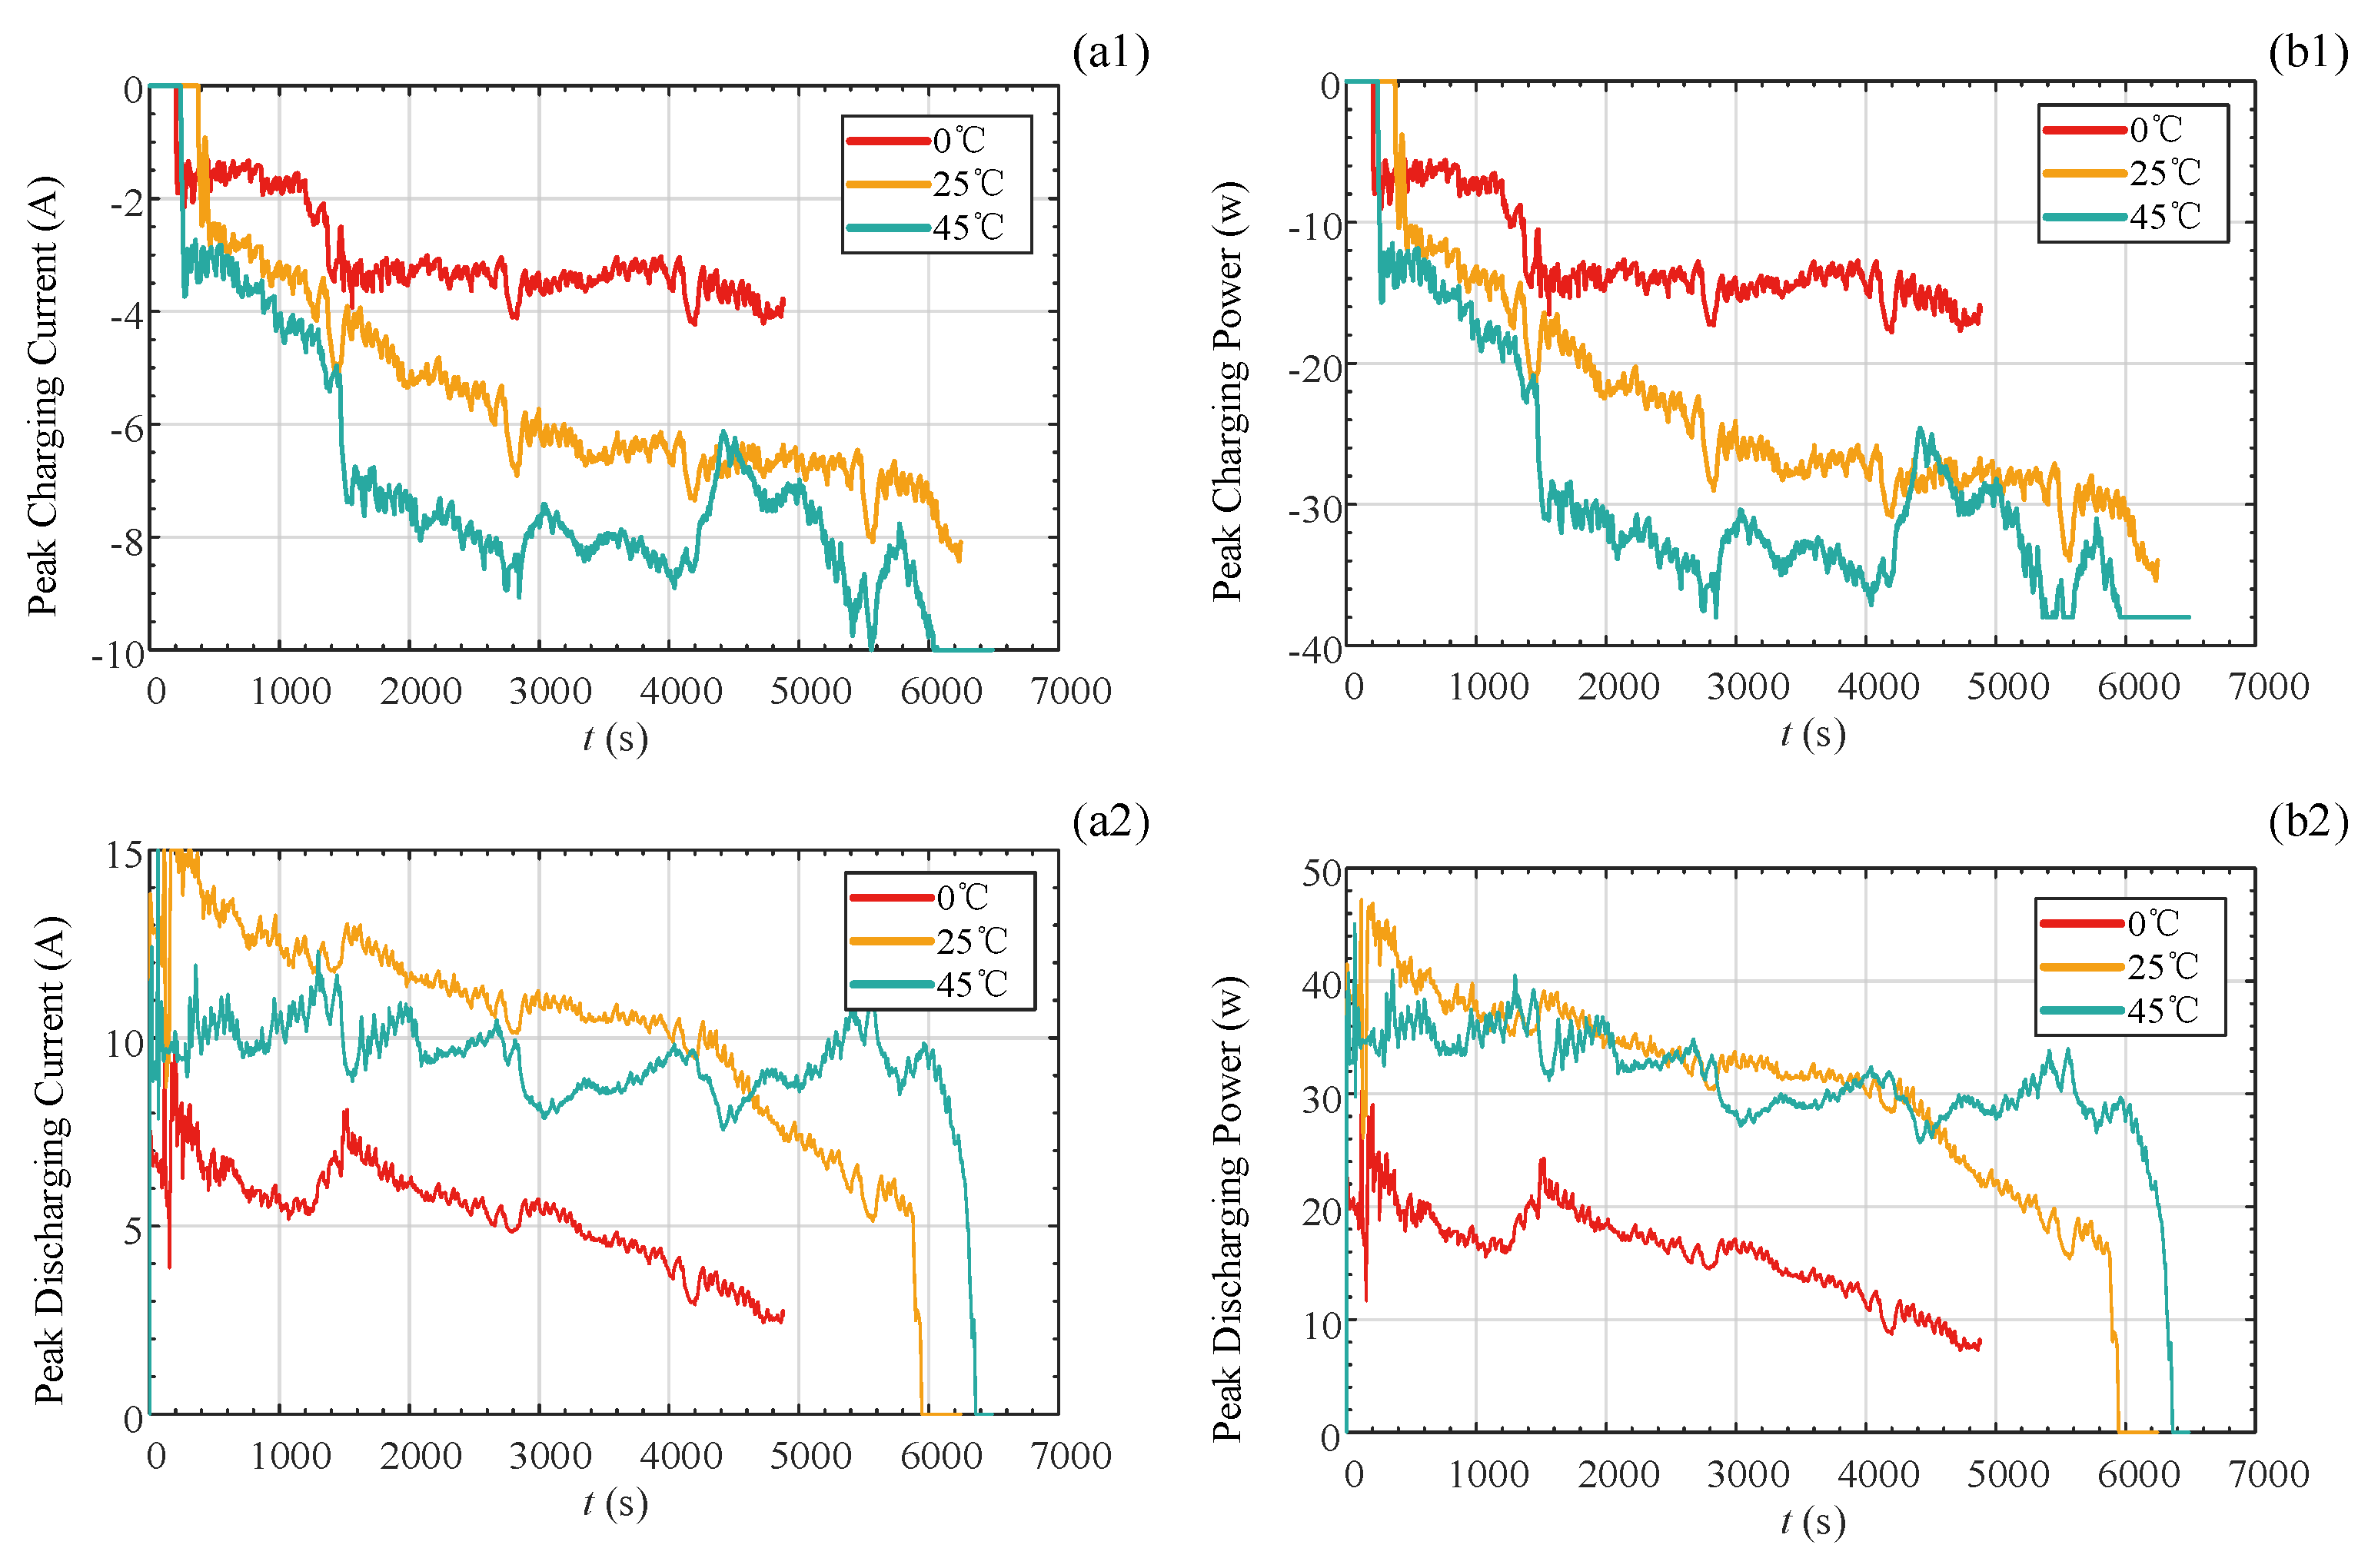
4.4. Results and Analysis of SOP Estimation

Different sampling time intervals under the same temperature. The estimation results for the peak current and peak power under the UDDS at an ambient temperature of 25 °C are presented in Figure 10. Three sampling time intervals are shown: 10 s, 20 s, and 30 s. In Figure 10(a1,b1), it can be observed that both the peak charging current and power are zero at t = 0 s.
This occurs because the SOC of the battery at the start of charging/discharging is 100%. At this point, SOC acts as the primary constraint on battery current and SOP, preventing overcharging. As discharging begins, the terminal voltage (Ut) becomes the main constraint on peak charging current and power. Consequently, both the peak charging current and power gradually increase until they reach the limits set by the manufacturer.
In Figure 10(a2,b2), the limits set by the manufacturer and the terminal voltage (Ut) serve as the main constraints on the SOP during most of the battery’s discharge process. However, after extended discharge, the SOC becomes the limiting factor for SOP. To prevent over-discharging, the peak discharge current and SOP of the battery gradually decrease until they reach zero.
Additionally, it can be observed that a longer sampling time interval results in a smaller battery current and SOP. This indicates that the duration of the sampling affects the peak charge and discharge capabilities of the battery.
The same sampling time interval under different ambient temperatures. The estimated results for battery current and SOP are shown in Figure 11 at different ambient temperatures (0 °C, 25 °C, and 45 °C), with a sampling time interval of 30 s. As illustrated in Figure 11, the peak charging and discharging current and power of the battery gradually increase with rising temperature. This is primarily because temperature significantly influences various battery parameters. At lower temperatures, the battery resistance is higher, resulting in a marked decrease in charge and discharge current at 0 °C compared to higher temperatures.
Near the end of the battery discharge, the core temperature becomes the dominant constraint, as seen in Figure 11(a1,a2). In Figure 11(a2,b2), the peak discharge current and peak power at 45 °C are notably lower than those at 0 °C and 25 °C, primarily due to the constraint imposed by the battery core temperature. Thus, maintaining a reasonable limit on the battery core temperature is crucial for effectively preventing thermal runaway.
In summary, the constraints for battery SOP are alternately dominated by multiple battery parameters during the charging and discharging. The core temperature of the battery has a critical limitation on its SOP during long charging and discharging processes, which is important to avoid excessive battery temperature.

5. Conclusions

In this study, we developed a battery electro-thermal model to estimate the SOP under multi-parameter coupling. The model accounts for the battery core temperature, with electro-thermal parameters coupled together. These parameters were identified using Machine Learning Models (MLM) and Adaptive Genetic Algorithms (AGA), respectively. The model outputs were derived using an adaptive unscented Kalman filter.
The validation of the model and the application of these methods ensured that the estimation errors for SOC and SOTC were both less than 0.15 and 1 °C, respectively. Consequently, the battery SOP was estimated under multiple constraints.
The results indicate that the constraints on battery SOP are influenced alternately by multiple battery parameters during both charging and discharging. Notably, the core temperature of the battery is critical in limiting SOP during prolonged charging and discharging processes, which is essential for preventing excessive temperatures. The multi-parameter coupling method for estimating SOP proposed in this study offers a foundation for battery management systems to accurately assess SOP at elevated temperatures. This approach significantly improves the safety of lithium batteries operating under high-temperature conditions.

Author Contributions

Conceptualization, R.Z. and K.W.; methodology, R.Z.; software, R.Z.; validation, R.Z., Z.Y. and G.Z.; formal analysis, R.Z.; investigation, R.Z.; resources, R.Z.; data curation, R.Z.; writing—original draft preparation, R.Z.; writing—review and editing, R.Z.; visualization, K.W.; supervision, K.W.; project administration, K.W.; funding acquisition, K.W. All authors have read and agreed to the published version of the manuscript.

Funding

This research received no external funding.

Data Availability Statement

Data will be available upon request to the authors.

Conflicts of Interest

The authors declare no conflict of interest.

References

  1. Zheng, L.; Zhang, S.; Huang, H.; Liu, R.; Cai, M.; Bian, Y.; Chang, L.; Du, H. Artificial intelligence-driven rechargeable batteries in multiple fields of development and application towards energy storage. J. Energy Storage 2023, 73, 108926. [Google Scholar] [CrossRef]
  2. Duffner, F.; Kronemeyer, N.; Tübke, J.; Leker, J.; Winter, M.; Schmuch, R. Post-lithium-ion battery cell production and its compatibility with lithium-ion cell production infrastructure. Nat. Energy 2021, 6, 123–134. [Google Scholar] [CrossRef]
  3. Li, M.; Mo, R.; Ding, A.; Zhang, K.; Guo, F.; Xiao, C. Electrochemical technology to drive spent lithium-ion batteries (LIBs) recycling: Recent progress, and prospects. Energy Mater. 2024, 4, 400070. [Google Scholar] [CrossRef]
  4. Guo, F.; Wu, X.; Liu, L.; Ye, J.; Wang, T.; Fu, L.; Wu, Y. Prediction of remaining useful life and state of health of lithium batteries based on time series feature and Savitzky-Golay filter combined with gated recurrent unit neural network. Energy 2023, 270, 126880. [Google Scholar] [CrossRef]
  5. Xiong, R.; Li, L.L.; Tian, J.P. Towards a smarter battery management system: A critical review on battery state of health monitoring methods. J. Power Sources 2018, 405, 18–29. [Google Scholar] [CrossRef]
  6. Pradhan, S.K.; Chakraborty, B. Battery management strategies: An essential review for battery state of health monitoring techniques. J. Energy Storage 2022, 51, 104427. [Google Scholar] [CrossRef]
  7. Farmann, A.; Sauer, D.U. A comprehensive review of on-board State-of-Available-Power prediction techniques for lithium-ion batteries in electric vehicles. J. Power Sources 2016, 329, 123–137. [Google Scholar] [CrossRef]
  8. Han, W.; Altaf, F.; Zou, C.; Wik, T. Sensitivity Analysis of the Battery System State of Power. IEEE Trans. Transp. Electrif. 2022, 8, 976–989. [Google Scholar] [CrossRef]
  9. Liu, F.; Shao, C.; Su, W.; Liu, Y. Online joint estimator of key states for battery based on a new equivalent circuit model. J. Energy Storage 2022, 52, 104780. [Google Scholar] [CrossRef]
  10. Shrivastava, P.; Naidu, P.A.; Sharma, S.; Panigrahi, B.K.; Garg, A. Review on technological advancement of lithium-ion battery states estimation methods for electric vehicle applications. J. Energy Storage 2023, 64, 107159. [Google Scholar] [CrossRef]
  11. Tong Poh, W.Q.; Xu, Y.; Poh Tan, R.T. A Review of Machine Learning Applications for Li-Ion Battery State Estimation in Electric Vehicles. In Proceedings of the 2022 IEEE PES Innovative Smart Grid Technologies—Asia (ISGT Asia), Singapore, 1–5 November 2022; pp. 265–269. [Google Scholar]
  12. Liu, X.; He, Y.; Zeng, G.; Zhang, J.; Zheng, X. State-of-Power Estimation of Li-Ion Batteries Considering the Battery Surface Temperature. Energy Technol. 2018, 6, 1352–1360. [Google Scholar] [CrossRef]
  13. Guo, R.; Shen, W. Lithium-Ion Battery State of Charge and State of Power Estimation Based on a Partial-Adaptive Fractional-Order Model in Electric Vehicles. IEEE Trans. Ind. Electron. 2023, 70, 10123–10133. [Google Scholar] [CrossRef]
  14. Xiong, R.; He, H.; Sun, F.; Liu, X.; Liu, Z. Model-based state of charge and peak power capability joint estimation of lithium-ion battery in plug-in hybrid electric vehicles. J. Power Sources 2013, 229, 159–169. [Google Scholar] [CrossRef]
  15. Guo, R.; Shen, W. A Model Fusion Method for Online State of Charge and State of Power Co-Estimation of Lithium-Ion Batteries in Electric Vehicles. IEEE Trans. Veh. Technol. 2022, 71, 11515–11525. [Google Scholar] [CrossRef]
  16. Fu, S.; Lv, T.; Xie, J.; Wu, L.; Luo, C. A Multiple Time-Scales Based Multi-state Co-estimation Method for Lithium-ion Battery. In Proceedings of the 2021 11th International Conference on Power and Energy Systems (ICPES), Virtual, 18–20 December 2021; pp. 183–189. [Google Scholar]
  17. Zhang, T.; Guo, N.; Sun, X.; Fan, J.; Yang, N.; Song, J.; Zou, Y. A Systematic Framework for State of Charge, State of Health and State of Power Co-Estimation of Lithium-Ion Battery in Electric Vehicles. Sustainability 2021, 13, 5166. [Google Scholar] [CrossRef]
  18. Han, W.; Altaf, F.; Zou, C.; Wik, T. State of Power Prediction for Battery Systems with Parallel-Connected Units. IEEE Trans. Transp. Electrif. 2022, 8, 925–935. [Google Scholar] [CrossRef]
  19. Wang, Y.; Tian, J.; Sun, Z.; Wang, L.; Xu, R.; Li, M.; Chen, Z. A comprehensive review of battery modeling and state estimation approaches for advanced battery management systems. Renew. Sustain. Energy Rev. 2020, 131, 110015. [Google Scholar] [CrossRef]
  20. Li, K.; Gao, X.; Liu, C.; Chang, C.; Li, X. A novel Co-estimation framework of state-of-charge, state-of-power and capacity for lithium-ion batteries using multi-parameters fusion method. Energy 2023, 269, 126820. [Google Scholar] [CrossRef]
  21. Wang, Y. Online estimation of battery power state based on improved equivalent circuit model. IOP Conf. Ser. Earth Environ. Sci. 2021, 651, 022080. [Google Scholar] [CrossRef]
  22. Guo, R.; Shen, W. An enhanced multi-constraint state of power estimation algorithm for lithium-ion batteries in electric vehicles. J. Energy Storage 2022, 50, 104628. [Google Scholar] [CrossRef]
  23. Sun, F.; Xiong, R.; He, H.; Li, W.; Aussems JE, E. Model-based dynamic multi-parameter method for peak power estimation of lithium–ion batteries. Appl. Energy 2012, 96, 378–386. [Google Scholar] [CrossRef]
  24. Li, X.Y.; Sun, J.L.; Hu, Z.H.; Lu, R.G.; Zhu, C.B.; Wu, G.L. A New Method of State of Peak Power Capability Prediction for Li-ion Battery. In Proceedings of the 2015 IEEE Vehicle Power and Propulsion Conference (Vppc), Montreal, QC, Canada, 19–22 October 2015. [Google Scholar]
  25. Li, B.; Wang, S.; Fernandez, C.; Yu, C.; Xia, L.; Fan, Y. A linear recursive state of power estimation method based on fusion model of voltage and state of charge limitations. J. Energy Storage 2021, 40, 10258. [Google Scholar] [CrossRef]
  26. Guo, R.; Shen, W. A Review of Equivalent Circuit Model Based Online State of Power Estimation for Lithium-Ion Batteries in Electric Vehicles. Vehicles 2021, 4, 1–31. [Google Scholar] [CrossRef]
  27. Li, W.; Fan, Y.; Ringbeck, F.; Jöst, D.; Sauer, D.U. Unlocking electrochemical model-based online power prediction for lithium-ion batteries via Gaussian process regression. Appl. Energy 2022, 306, 11811. [Google Scholar] [CrossRef]
  28. Lei, X.; Zhao, X.; Wang, G.; Liu, W. A Novel Temperature–Hysteresis Model for Power Battery of Electric Vehicles with an Adaptive Joint Estimator on State of Charge and Power. Energies 2019, 12, 362. [Google Scholar] [CrossRef]
  29. Wang, J.; Wang, S.; Yu, C.; Li, B.; He, M. An Online Method for Power State Estimation of Lithium-Ion Batteries under the Constraints of the Fusion Model Considering Temperature Effect. Int. J. Electrochem. Sci. 2022, 17, 220764. [Google Scholar] [CrossRef]
  30. Xin, Q.; Xiao, J.; Yang, T.; Zhang, H.; Long, X. Thermal management of lithium-ion batteries under high ambient temperature and rapid discharging using composite PCM and liquid cooling. Appl. Therm. Eng. 2022, 210, 118230. [Google Scholar] [CrossRef]
  31. Lukic, S.M.; Cao, J.; Bansal, R.C.; Rodriguez, F.; Emadi, A. Energy storage systems for automotive applications. IEEE Trans. Ind. Electron. 2008, 55, 2258–2267. [Google Scholar] [CrossRef]
  32. Forgez, C.; Do, D.V.; Friedrich, G.; Morcrette, M.; Delacourt, C. Thermal modeling of a cylindrical LiFePO4 graphite lithium-ion battery. J. Power Sources 2010, 195, 2961–2968. [Google Scholar] [CrossRef]
  33. Lyu, D.Z.; Niu, G.X.; Liu, E.H.; Yang, T.; Chen, G.; Zhang, B. Uncertainty Management and Differential Model Decomposition for Fault Diagnosis and Prognosis. IEEE Trans. Ind. Electron. 2022, 69, 5235–5246. [Google Scholar] [CrossRef]
  34. Hua, Y.; Liu, X.; Zhou, S.; Huang, Y.; Ling, H.; Yang, S. Toward Sustainable Reuse of Retired Lithium-ion Batteries from Electric Vehicles. Resour. Conserv. Recycl. 2021, 168, 105249. [Google Scholar] [CrossRef]
Figure 1. The battery electro-thermal coupling model is supported by a second-order RC equivalent circuit and two-state lumped parameter thermal model.
Batteries 10 00409 g001
Figure 2. Platform with MEF1510-003 and Arbin BT-5HC-5V60A for HPPC test of lithium-ion battery.
Batteries 10 00409 g002
Figure 3. Identified results of the model parameters at different ambient temperatures and SOC: (a) R0, (b) R1, (c) R2, (d) C1, and (e) C2.
Batteries 10 00409 g003
Figure 4. Comparison of the terminal voltages obtained from the model with those obtained from the experiment. (a) The terminal voltages obtained from the model and the experiment at 25 °C. (b) The errors in terminal voltage between model and experiment.
Batteries 10 00409 g004
Figure 5. Identified results of the entropy heat coefficient of the battery thermal model.
Batteries 10 00409 g005
Figure 6. Verification of the battery core and surface temperature curves under 1 C discharge at the ambient temperature of 25 °C. (a) Battery core and surface temperature curves obtained from the model and experiment. (b) The errors in the temperature curve of the model compared to that of experiment.
Batteries 10 00409 g006
Figure 7. UKF estimation process for the SOC and SOT of the battery.
Batteries 10 00409 g007
Figure 8. The estimated results of SOTC and SOC from model and experiment with UDDS. (a) The estimated results of SOT from model and experiment with UDDS at a discharge rate of (a1): 1 C, (a2): 2 C, and (a3): 3 C. (b) The estimated results of SOC from model and experiment with UDDS at a discharge rate of (b1): 1 C, (b2): 2 C, and (b3): 3 C. (c) The errors of SOT curves obtained by the model at different discharge rates compared to the experiment with UDDS at a discharge rate of (c1): 1 C, (c2): 2 C, and (c3): 3 C. (d) The errors of SOC curves obtained by the model at different discharge rates compared to the experiment with UDDS at a discharge rate of (d1): 1 C, (d2): 2 C, and (d3): 3 C.
Batteries 10 00409 g008
Figure 9. Multi-state constraints for battery SOP estimation.
Batteries 10 00409 g009
Figure 10. Battery charge/discharge current and SOP estimation with different sampling time intervals: 10 s, 20 s, and 30 s: (a1) Charge current, (a2) Discharge current, (b1) Charge SOP, (b2) Discharge SOP.
Batteries 10 00409 g010
Figure 11. Battery charge/discharge current and SOP estimation with different ambient temperatures: 0 °C, 25 °C, and 45 °C: (a1) Charge current, (a2) Discharge current, (b1) Charge SOP, (b2) Discharge SOP.
Batteries 10 00409 g011
Table 1. Information of Panasonic NCR18650BD Li-ion battery (Panasonic, Osaka, Japan).
ParametersValue
Nominal capacity2.5 Ah
AnodeGraphite
CathodeLi(NiCoMn)O2
Nominal voltage3.6 V
Max. charge voltage4.2 ± 0.05 V
Min. discharge voltage3.0 V
Table 2. Identification results of parameters of the thermal model.
R c ( K / W ) R s ( K / W ) C c ( J / K ) C s ( J / K )
2.859.7441.7512.87
Table 3. Co-estimation error of UDDS working condition.
Estimate TypeThermal Sensor AccuracyTemperature/°CRMSEMAE
SOTC±0.2 °C00.42 °C0.25 °C
250.52 °C0.23 °C
450.62 °C0.41 °C
SOC/02.06%1.19%
251.15%0.64%
450.88%0.51%
Disclaimer/Publisher’s Note: The statements, opinions and data contained in all publications are solely those of the individual author(s) and contributor(s) and not of MDPI and/or the editor(s). MDPI and/or the editor(s) disclaim responsibility for any injury to people or property resulting from any ideas, methods, instructions or products referred to in the content.

