Article

A Data-Driven Online Prediction Model for Battery Charging Efficiency Accounting for Entropic Heat

1
National Engineering Laboratory for Electric Vehicles, Beijing Institute of Technology, Beijing 100081, China
2
School of Electrical Engineering, Beijing Jiaotong University, Beijing 100044, China
3
Longruisanyou New Energy Automobile Technology Co., Ltd., Beijing 100075, China
*
Author to whom correspondence should be addressed.
Batteries 2024, 10(10), 350; https://doi.org/10.3390/batteries10100350
Submission received: 19 July 2024 / Revised: 19 September 2024 / Accepted: 27 September 2024 / Published: 2 October 2024
(This article belongs to the Section Battery Modelling, Simulation, Management and Application)

Abstract

:
This study proposes a charging efficiency calculation model based on an equivalent internal resistance framework. A data-driven neural network model is developed to predict the charging efficiency of lithium titanate (LTO) batteries for 5% state of charge (SOC) segments under various charging conditions. By considering the impact of entropy change on the open-circuit voltage (OCV) during the charging process, the accuracy of energy efficiency calculations is improved. Incorporating battery data under various charging conditions, and comparing the predictive accuracy and computational complexity of different hyperparameter configurations, we establish a backpropagation neural network model designed for implementation in embedded systems. The model predicts the energy efficiency of subsequent 5% SOC segments based on the current SOC and operating conditions. The results indicate that the model achieves a prediction error of only 0.29% under unknown charging conditions while also facilitating the deployment of the neural network model in embedded systems. In future applications, the relevant predictive data can be transmitted in real time to the cooling system for thermal generation forecasting and predictive control of battery systems, thereby enhancing temperature control precision and improving cooling system efficiency.

Graphical Abstract

1. Introduction

1.1. Background and Motivation

The development of the electric vehicle and energy storage system industry has led to the widespread adoption of lithium-ion batteries (LIBs) with higher energy density and greater storage. Lithium titanate batteries (LTO) are a new type of LIB that utilizes Li4Ti5O12 instead of graphite for the negative electrode material, enhancing safety because of a significant increase in internal resistance during thermal runaway, preventing explosions [1,2,3,4,5]. LTO batteries offer higher theoretical capacity and longer life cycles than conventional graphite-anode lithium batteries. Consequently, LTO batteries have the potential to become the negative electrode material of choice for the next generation of LIBs, finding applications in new energy vehicles, electric motorcycles, and other areas that demand high safety, stability, and durability. The energy efficiency of LIBs has been a crucial focus of recent research [6,7,8]. The accurate prediction of battery heat generation relies on precise computation of the battery’s energy efficiency, enabling the transmission of relevant data to the cooling system (coolant flow rate) for effective heat dissipation control. This approach aims to narrow the temperature control interval of the battery system, enhancing temperature control accuracy and the heat dissipation system’s efficiency. However, during battery charging, factors such as temperature, charging rate (C-rate), state of charge (SOC), and capacity decay affect efficiency. Estimating real-time efficiency becomes pivotal for evaluating and enhancing battery performance under various working conditions [9,10]. In addition, LTO batteries show a temperature drop during charging at room temperature, caused by a negative entropy heat coefficient resulting in heat absorption. In calculating energy loss during this process, it is imperative to consider irreversible heat from polarization and ohmic effects, alongside reversible heat from internal chemical (entropy) and electrochemical reactions. Therefore, a comprehensive analysis of entropy heat variation on battery internal energy is necessary for accurately assessing the energy efficiency of LTO battery charging.
In the current research on battery energy efficiency, the ratio of discharge energy to charge energy is defined, which is used to evaluate energy loss. Coulomb efficiency is the discharge-to-charge capacity ratio and it is crucial for evaluating battery performance. Liu et al. [11] employed a theoretical computational approach to determine the energy conversion efficiency of LTO batteries at various discharge current rates. In practical applications, the battery’s energy efficiency may deviate from theoretical assumptions due to operational conditions. Researchers have investigated the relationship between battery efficiency and factors such as SOC and current. Li et al. [12] studied the energy efficiency of LIBs utilized as microgrid energy storage devices, discovering that the overall energy efficiency depends on the energy efficiency under charging, discharging, and combined charge–discharge conditions. The relationship between energy efficiency and current rate was analyzed through nonlinear curve fitting and polynomial modeling. Meanwhile, Lai et al. [13] investigated the correlation between SOC and Coulomb efficiency, conducting long-term constant voltage charging simulations to simulate the battery’s open-circuit condition. The study accurately measured and analyzed the relationships between battery-side reaction current, SOC, and temperature. Subsequently, the Coulomb efficiency was evaluated under different aging levels, temperature, and SOC. Kang et al. [14] developed a quantitative relationship between the battery’s OCV and SOC to determine the energy efficiency of nickel–metal hydride and LIBs. The study contributed to establishing fundamental test procedures for studying the energy efficiency of LIBs. While these studies define energy and Coulomb efficiencies and their relationship with SOC, the continuous real-time estimation of one-way energy efficiency during battery operation remains unexplored, but it is essential for real-time performance monitoring of the battery.
Wang et al. [15] presented common approaches for studying entropy and heat changes in lithium batteries during operation. As entropy and heat generation fluctuate with battery operating conditions, the authors conducted a quantitative investigation to enhance the management and application of LIBs, particularly high-power batteries. Alkanent et al. [16] demonstrated that at low discharge currents, entropy effects dominate heat loss, resulting in battery cooling. During charging, entropy change occurs with a negative absolute value, leading to additional heat generation in addition to irreversible heat, confirmed through calorimetric experiments. Doh et al. [17] proposed that battery heating primarily depends on the impressed current, internal resistance, temperature, and entropy of the battery. Due to the simultaneous dependence of entropic heat on SOC and temperature, the authors propose a novel approach for entropy measurement and heat generation calculation under adiabatic conditions. However, the existing literature lacks an analysis of the effect of entropy changes on the energy efficiency of battery charging.
Accurate efficiency prediction enhances battery charging performance, provides data support for the charging optimization strategies for high-power lithium-ion batteries, and facilitates the online prediction of charging efficiency under various working conditions, all of which are crucial for enhancing charging efficiency within designated charging durations. However, the nonlinear heat generation that is sensitive to environmental conditions poses challenges for accurate prediction of battery charging efficiency, prompting the use of artificial neural networks (ANNs) [18]. ANN prediction has been widely adopted in LIBs due to its efficacy in addressing highly nonlinear issues such as battery modeling, SOC estimation, load prediction, and battery temperature forecasting [19,20,21,22,23]. From the existing literature, the backpropagation (BP) neural network stands out for its superior nonlinear mapping capabilities, particularly in solving nonlinear prediction and multi-dimensional problems [24]. Neural networks are integrated into embedded systems to enable real-time prediction of charging efficiency in a Battery Management System (BMS). However, these embedded systems have limited computing resources, necessitating neural networks to achieve sufficient accuracy and computational speed while employing fewer computational resources. The BP neural network offers lower computational complexity and memory requirements than other architectures, making it more suitable for implementation in embedded systems. Therefore, our study chooses BP to model the nonlinear relationship between input and output parameters for charging efficiency prediction.

1.2. Contributions and Innovation Points

This study derives a formula for one-way charging efficiency based on the equivalent model of battery internal resistance, incorporating the effects of entropy heat. The formula of entropy heat coefficient is utilized to modify the OCV, enabling a more accurate charging efficiency computation. Given the excellent rate performance and temperature characteristics of lithium titanate batteries, their charging efficiency varies significantly across different conditions. To investigate this phenomenon, we conducted charging experiments and collected data on the batteries, which allowed us to derive charging efficiency curves considering the SOC, current, temperature, and entropic heat. A BP neural network prediction model is then established, with the starting SOC, ending SOC, temperature, voltage, and current as inputs, and the charging efficiency during the SOC charging segment under the given working conditions as the output. The model parameters are optimized by comparing prediction accuracy and computational complexity across various hyperparameter configurations. This real-time prediction of changes in battery heat generation across different time scales could be integrated into future heat dissipation systems, allowing for the transmission of relevant real-time data to the heat dissipation system, predicting and controlling the heat dissipation (coolant flow rate) of the battery system, refining temperature control intervals, and improving both the precision and efficiency of heat dissipation systems.

1.3. Section Arrangement

The remainder of this paper is organized as follows. Section 2 introduces the model construction of a lithium battery considering entropy heat and the derivation computation method of charging efficiency. Section 3 establishes the BP neural network prediction model, compares various model parameters, and proposes the optimal prediction approach. Section 4 summarizes the conclusions and outlines future work. Figure 1 illustrates the overall structural framework of this study.

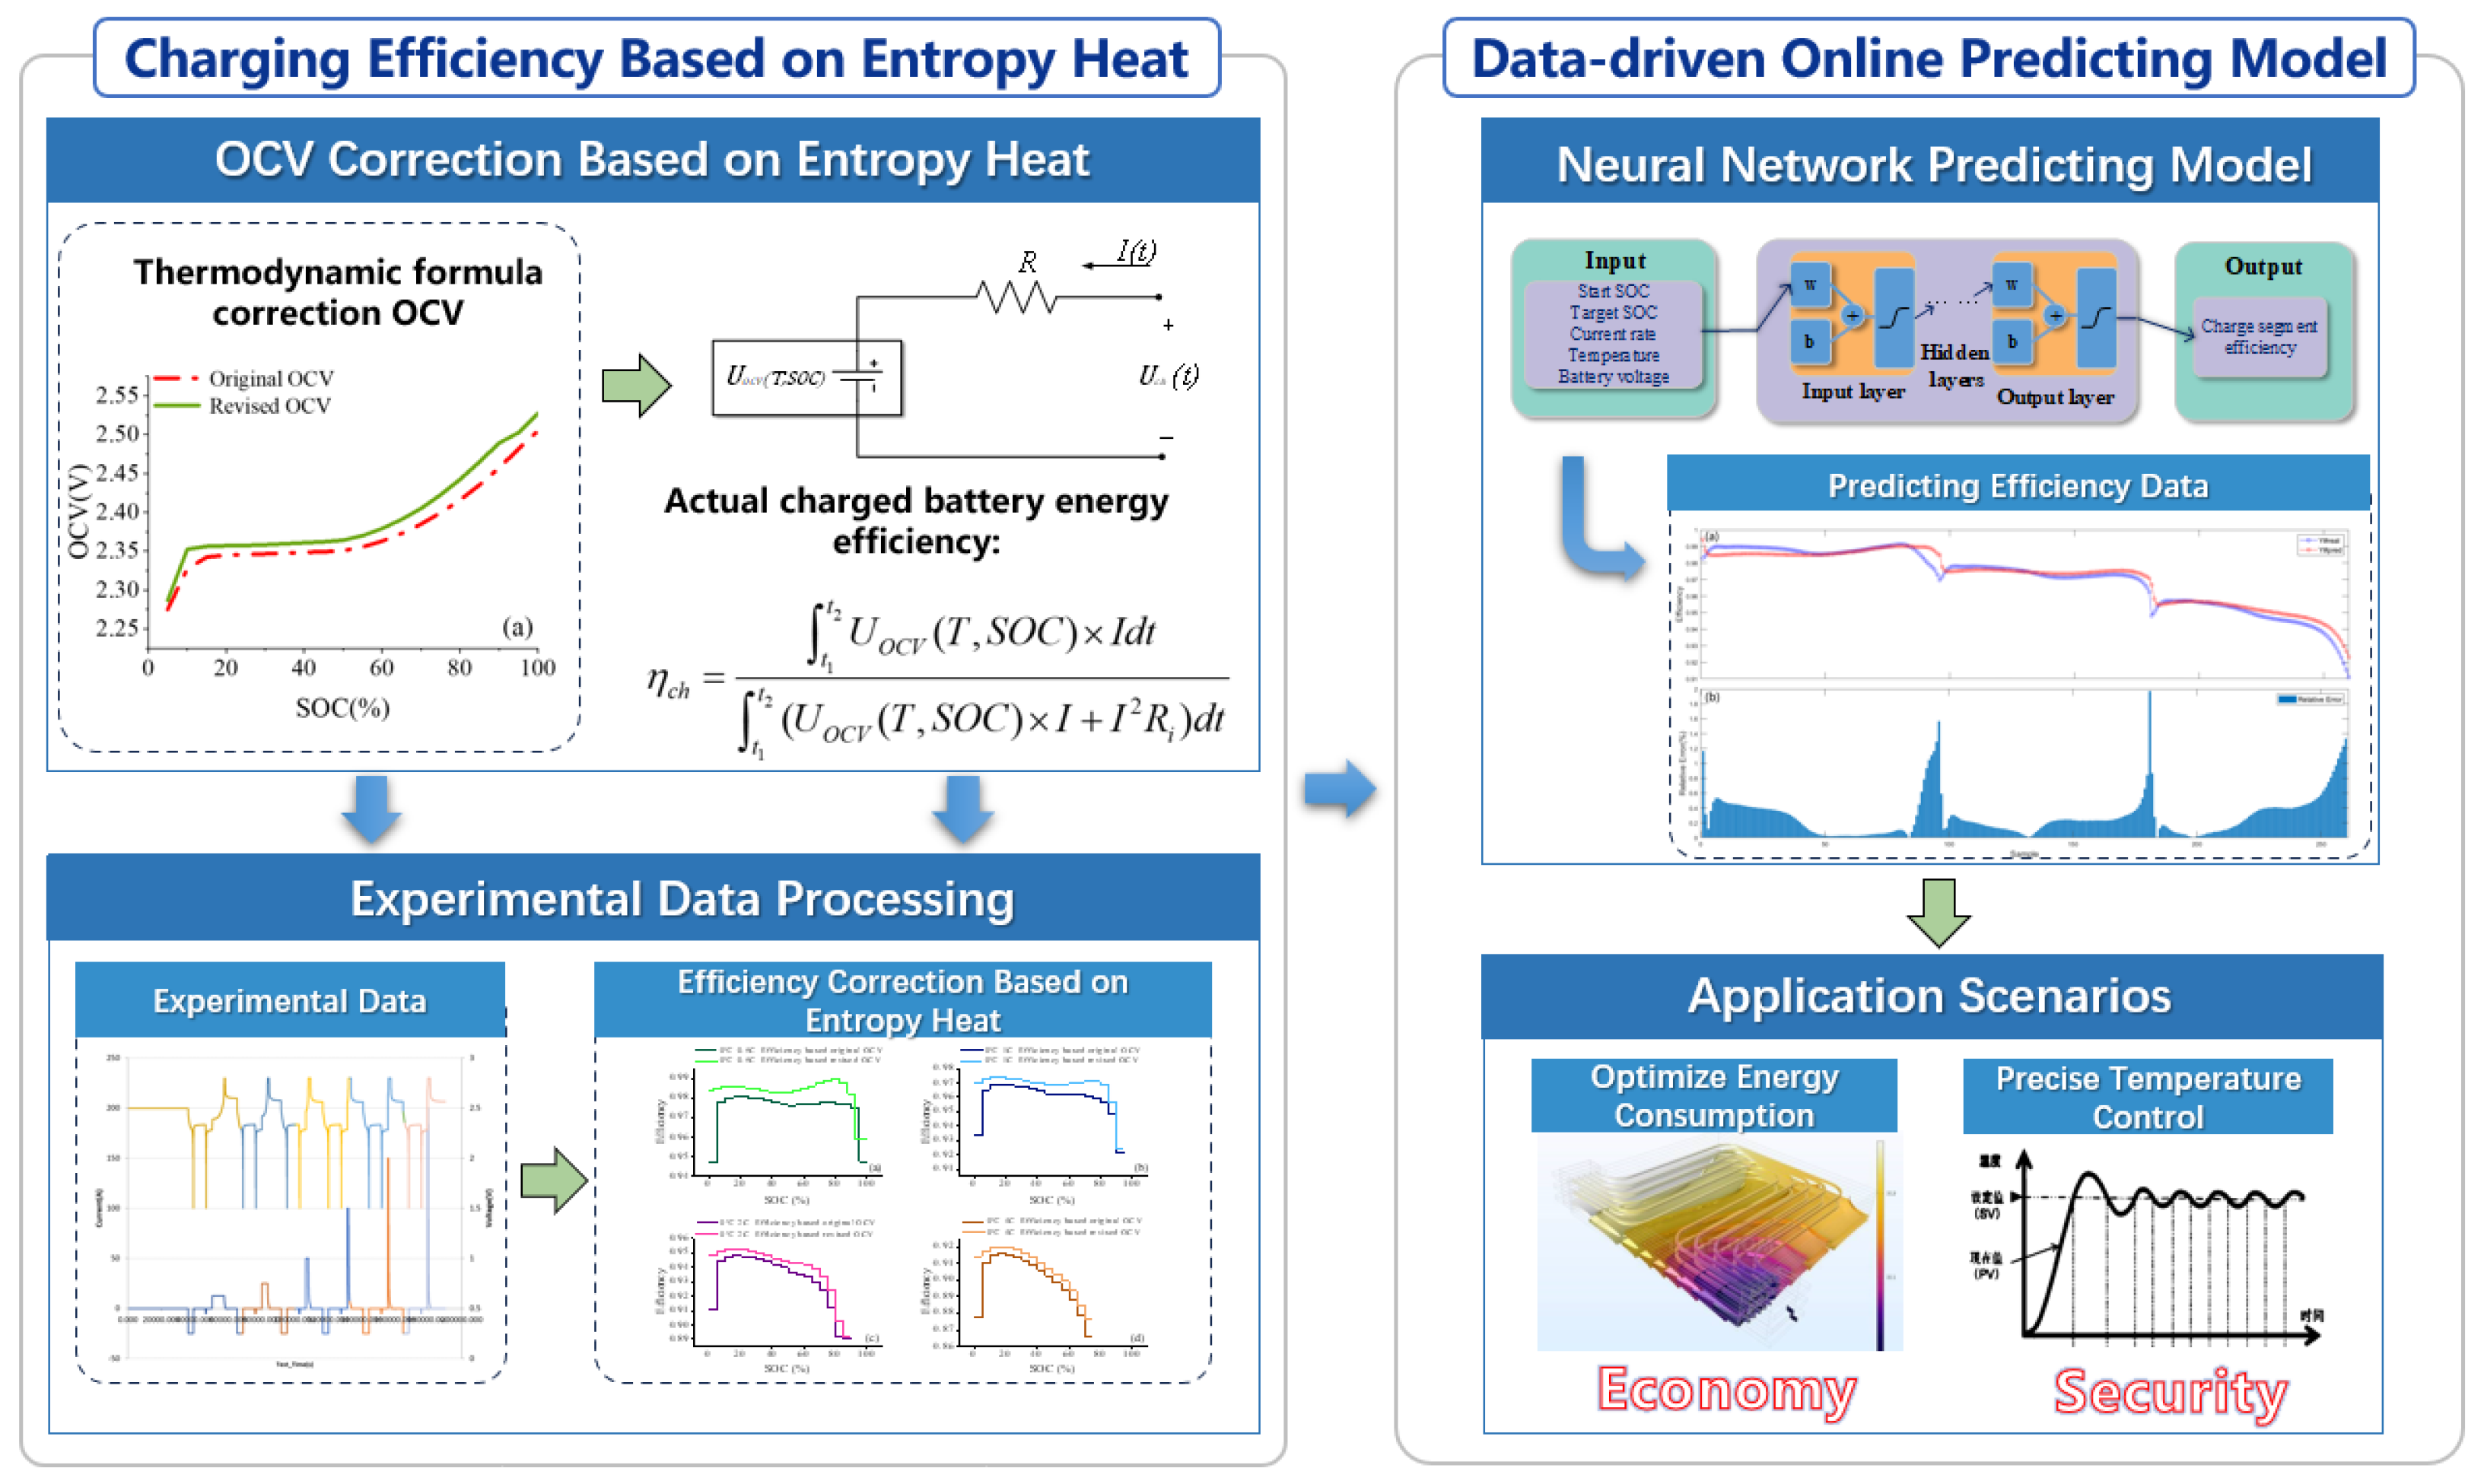
2. A Battery Internal Resistance Model Incorporating Entropic Heat Effects

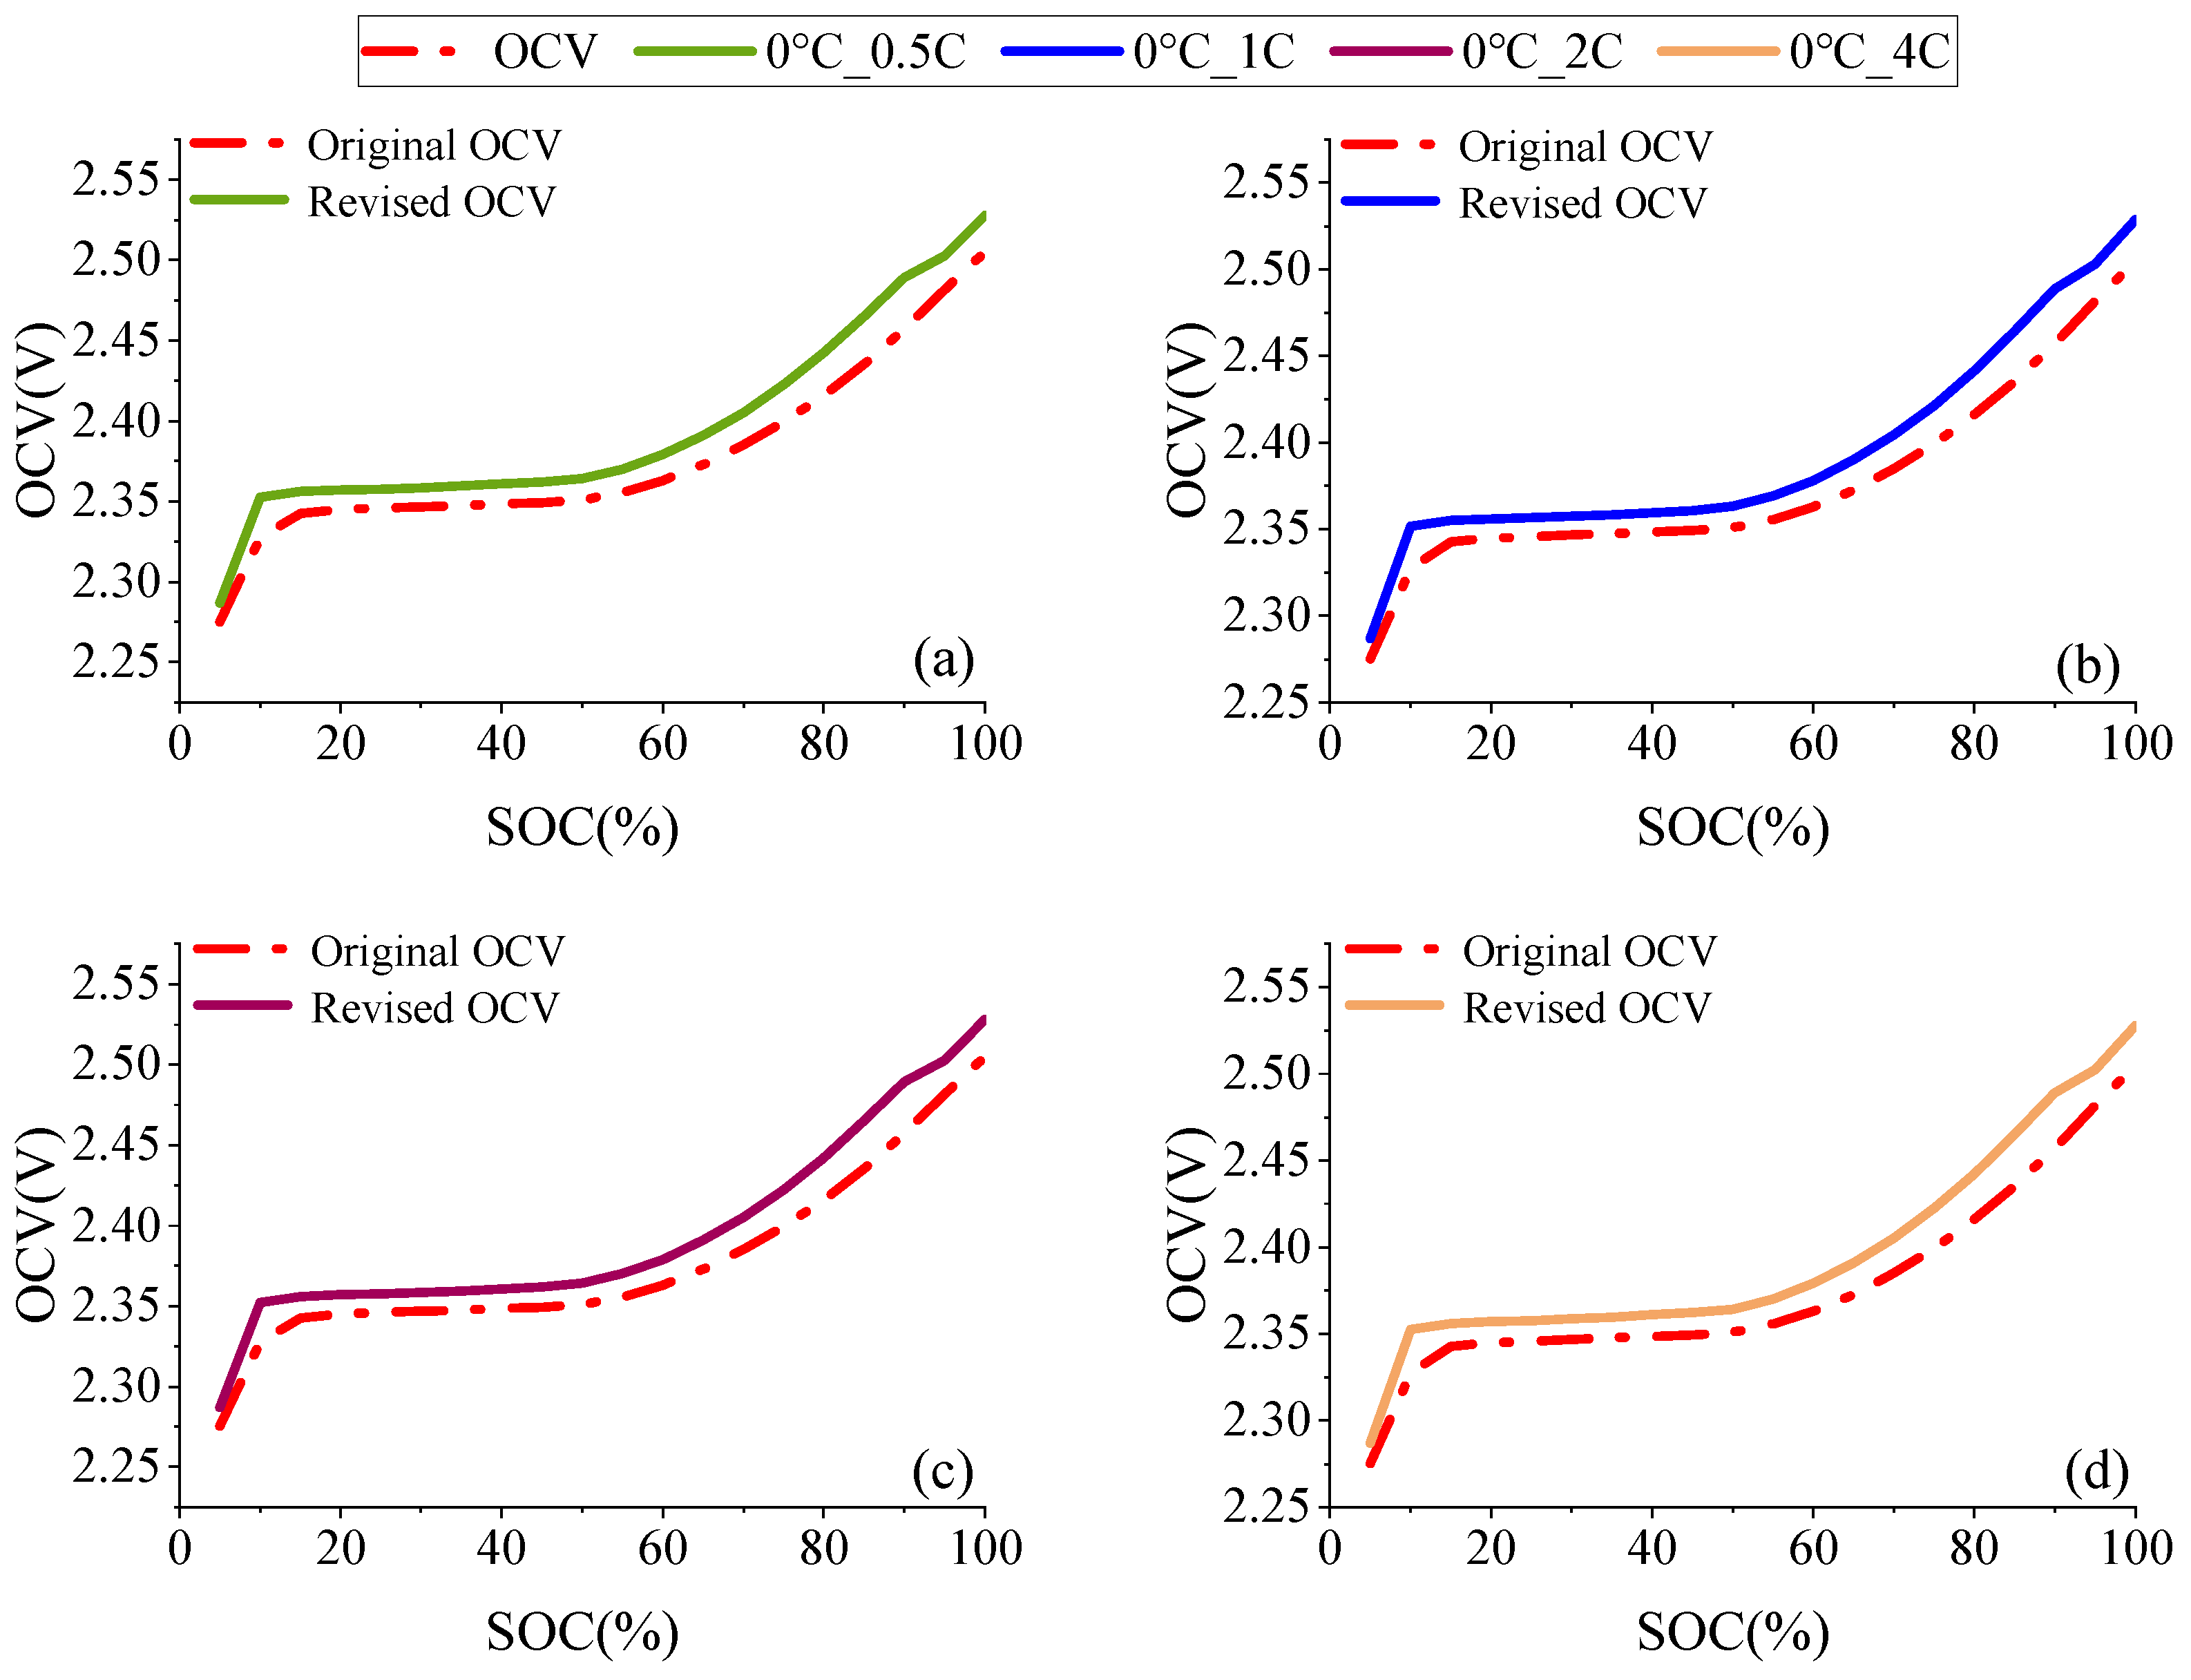
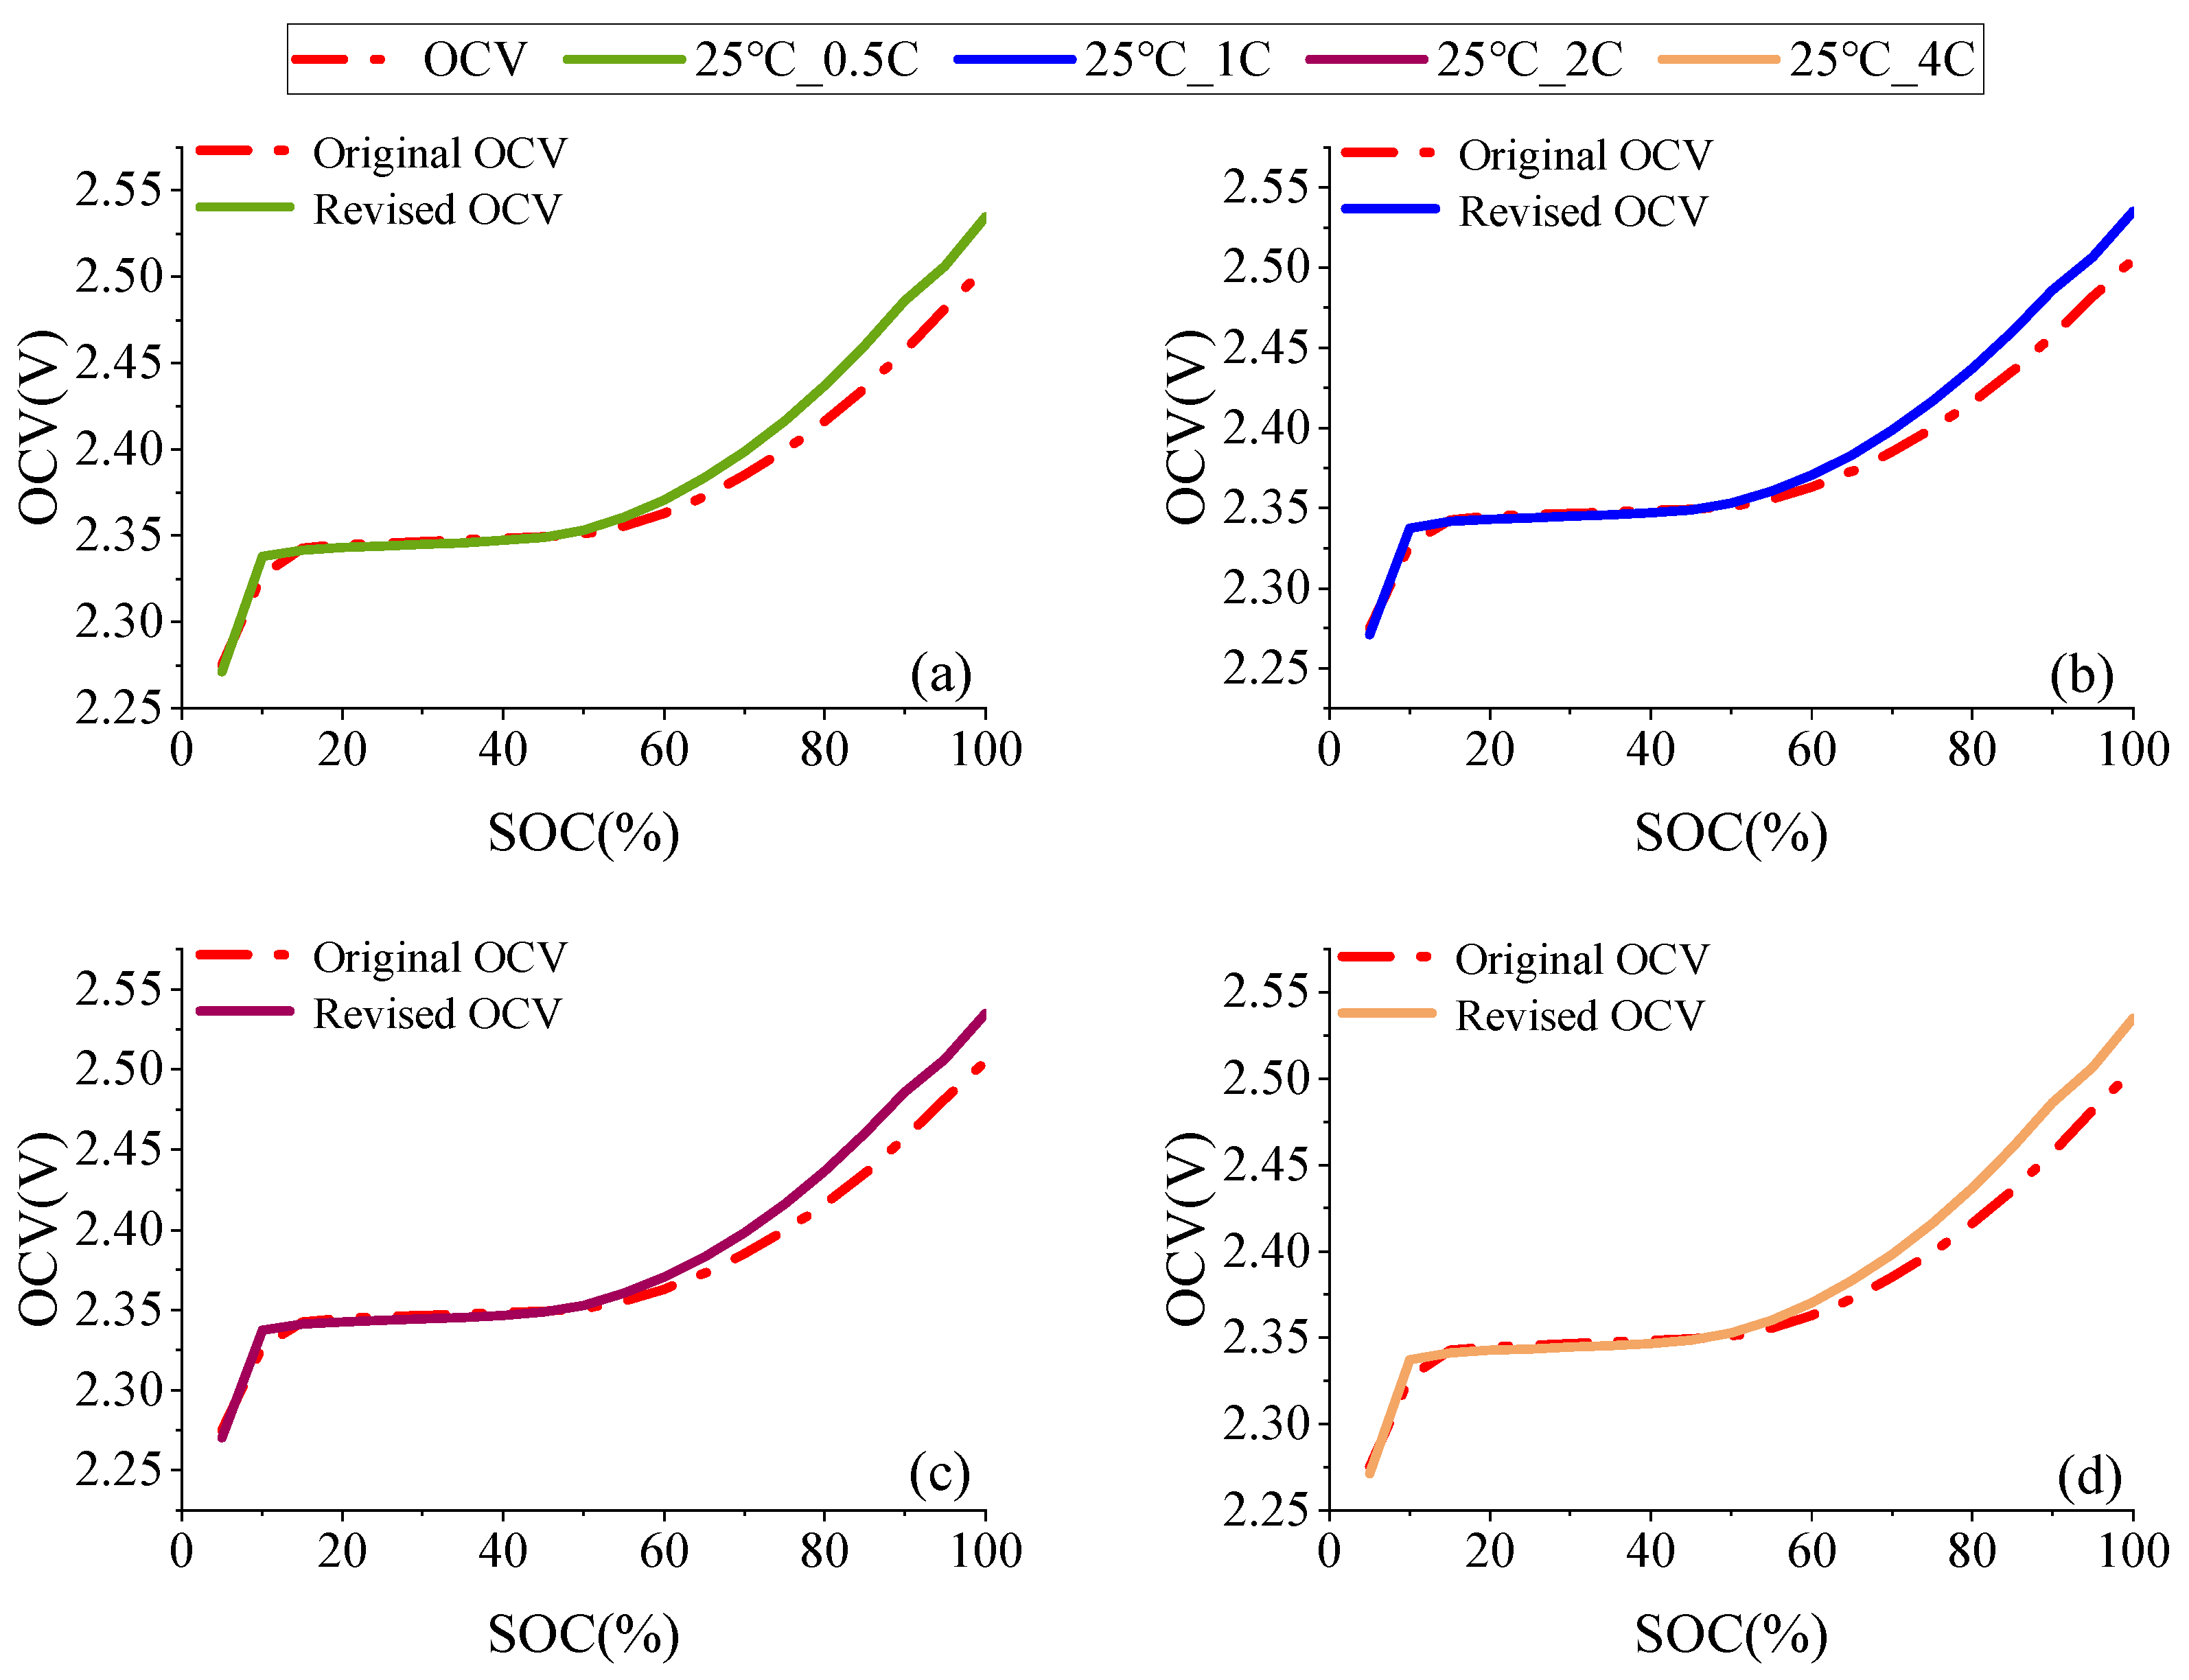
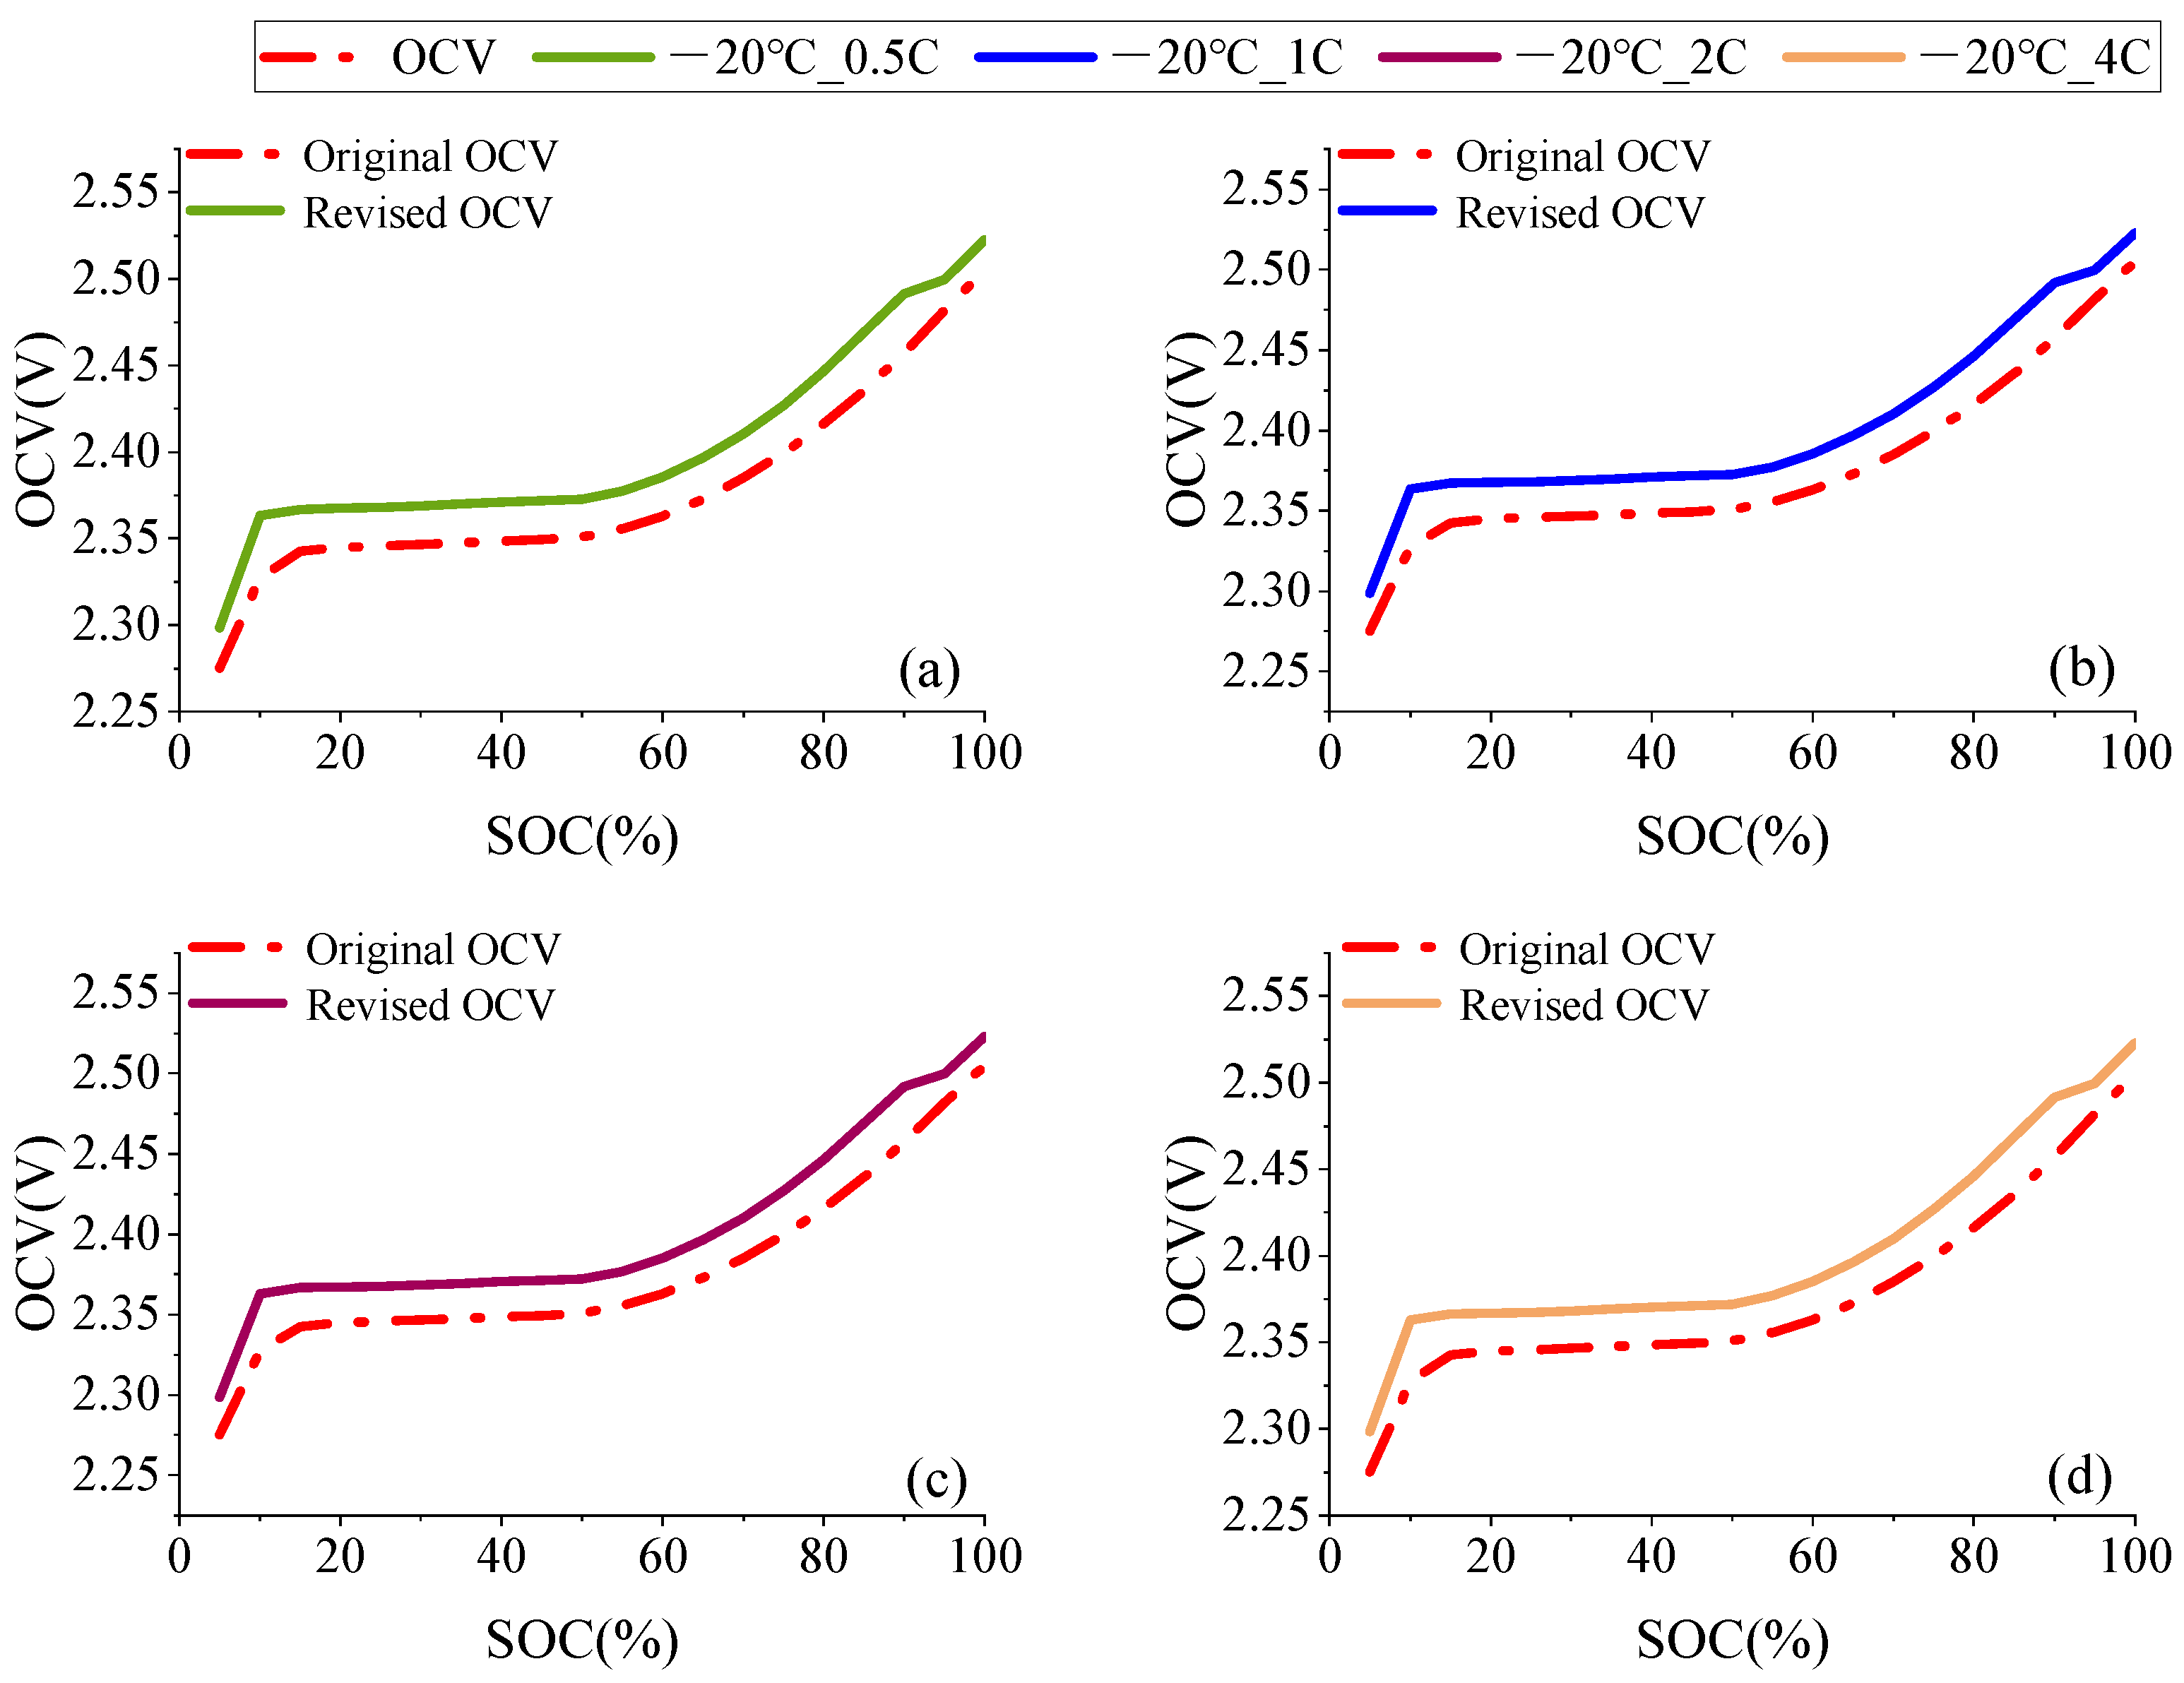
2.1. OCV Correction Based on Entropic Heat

Battery charging efficiency is determined by OCV characteristics, with the efficiency computation formula derived from the equivalent circuit model. Thus, establishing the OCV characteristics is essential when analyzing the equivalent circuit model. OCV depends on the SOC or the state of energy (SOE), represented by OCV-SOC or OCV-SOE characteristics, respectively, in this study. The conventional approach involves averaging measured charge and discharge voltages with low-current charge and discharge. However, the significant temperature variation during LTO battery charging affects its internal energy, reflected in OCV changes with temperature via the entropy heat coefficient. As a result, the OCV-SOC curve changes throughout the charging process. This requires modifying the conventional OCV-SOC curve to account for temperature changes affecting the battery’s internal energy, ensuring accurate efficiency computation. Therefore, the OCV-SOC curve is modified based on the entropic heat derivation formula.
Considering the charging process of a LTO battery, the electric charge migration occurs under the influence of the potential difference applied by the external charging device. This signifies that external work Δ W is performed on the system. At the same time, the LTO battery is affected by entropy heat, leading to a temperature decrease during charging. Assuming the ambient temperature remains constant, a temperature difference arises between the battery system and its surroundings, causing the system to absorb heat Δ q . Consequently, the internal energy of the battery increases. This can be quantified using the mathematical expression of the first law of thermodynamics.
Δ U = Δ q + Δ W
The change in internal energy of the system is represented by Δ U ; the heat absorbed by the system is denoted as Δ q ; and the work carried out on the system by the charging device is denoted as Δ W .
During the charging process, the work carried out on the system primarily consists of the electrical energy input from the charging devices and the work related to the change in the battery’s volume. In consideration of the size of LTO batteries and their operating environment, the work carried out by the system due to volume expansion can be neglected.
For a reversible battery system, when one mole of reaction occurs, the decrease in the molar Gibbs free energy of the system is equal to the maximum work carried out by the system in terms of volume. According to Faraday’s law of electrolysis, the relationship between the standard molar Gibbs free energy of formation and the reversible electromotive force (EMF) of the galvanic cell under conditions of constant temperature and pressure can be established as follows:
Δ r G m = ( G ξ ) T , p = z F E
where z represents the number of charges transferred in the electrode reaction, F denotes the Faraday constant, ξ represents the extent of the electrode reaction, and E is the EMF of the battery.
In a closed system with constant pressure and temperature, where only volumetric work is present, the system is homogeneous, and its composition remains unchanged. According to the fundamental thermodynamic equation S = ( G / T ) p , in a reversible battery reaction, there exists non-volumetric electrical work. However, due to the process-independence of state functions, if the initial and final states of two processes are identical, the change in thermodynamic state functions will be the same, regardless of the presence of non-volumetric work. Therefore, the standard molar entropy of formation for a reversible battery can be calculated analogously to the fundamental thermodynamic equation.
Δ r S m = ( Δ r G m T ) p = z F ( E T ) p
Under constant temperature and pressure conditions, a relationship can be established between the standard molar enthalpy of formation of a reversible battery and its electromotive force.
Δ r H m = Δ r G m + T Δ r S m = z F E + z T F ( E T ) p
where Δ r H m represents the standard molar enthalpy of formation, Δ r S m represents the standard molar entropy of formation, and T denotes the temperature of the battery. The change in the internal energy of the battery during charging can be expressed as follows:
Δ r U m = Δ r H m + m C p d T d t = z F E + z T F ( E T ) p + m C p d T d t
where C p represents the isobaric heat capacity of the battery. By combining this with Equation (1), the heat transfer from the battery system to its surroundings can be determined as follows:
Δ q = Δ U + Δ W 2 = z F E + z T F ( E T ) p + m C p d T d t + I U
where U represents the battery charging voltage, I represents the battery charging current, T is the actual temperature of the LTO battery, and E is the open-circuit voltage ( U o c v ) of the LTO battery. The first term on the right-hand side of equation represents the electrical energy stored in the battery, the second term corresponds to the heat change due to entropy variation during the chemical reaction, and the third term accounts for the heat stored in the battery. In this section, we primarily focus on the charging efficiency of the LTO battery. Therefore, the heat generation rate of the reversible battery system can be further derived as follows:
q = I U o c v + I T ( U o c v T ) p + I U = I ( U U o c v ) + I T ( U o c v T ) p
The battery’s entropy heat coefficient, denoted as ( U o c v / T ) p , is determined by the battery’s SOC. Therefore, within the same SOC range, OCV changes with temperature. During constant current charging, entropy heat varies with temperature, which causes the heat generation rate of the battery to fluctuate accordingly. This is reflected in the temperature dependence of the OCV as determined by the entropy heat coefficient. The entropy heat represents the thermal energy generated by changes in the battery’s internal energy, and this factor must be considered when calculating energy efficiency. To obtain a more accurate estimation of battery efficiency accounting for entropy heat variation, the relationship between the OCV and temperature for LTO batteries can be corrected using the following equation:
U o c v ( T , S O C ) = U o c v ( T r e f , S O C ) + ( T T r e f ) × ( U o c v ( T r e f , S O C ) T ) p
where U o c v ( T , S O C ) represents the battery’s open-circuit voltage at the corresponding temperature, and T denotes the actual temperature of the LTO battery. U o c v ( T r e f , S O C ) is the reference open-circuit voltage measured at a constant temperature of 25 °C, and T r e f is the reference temperature of 25 °C. The corrected open-circuit voltage accounts for the entropy changes in the battery’s open-circuit voltage due to temperature variations.

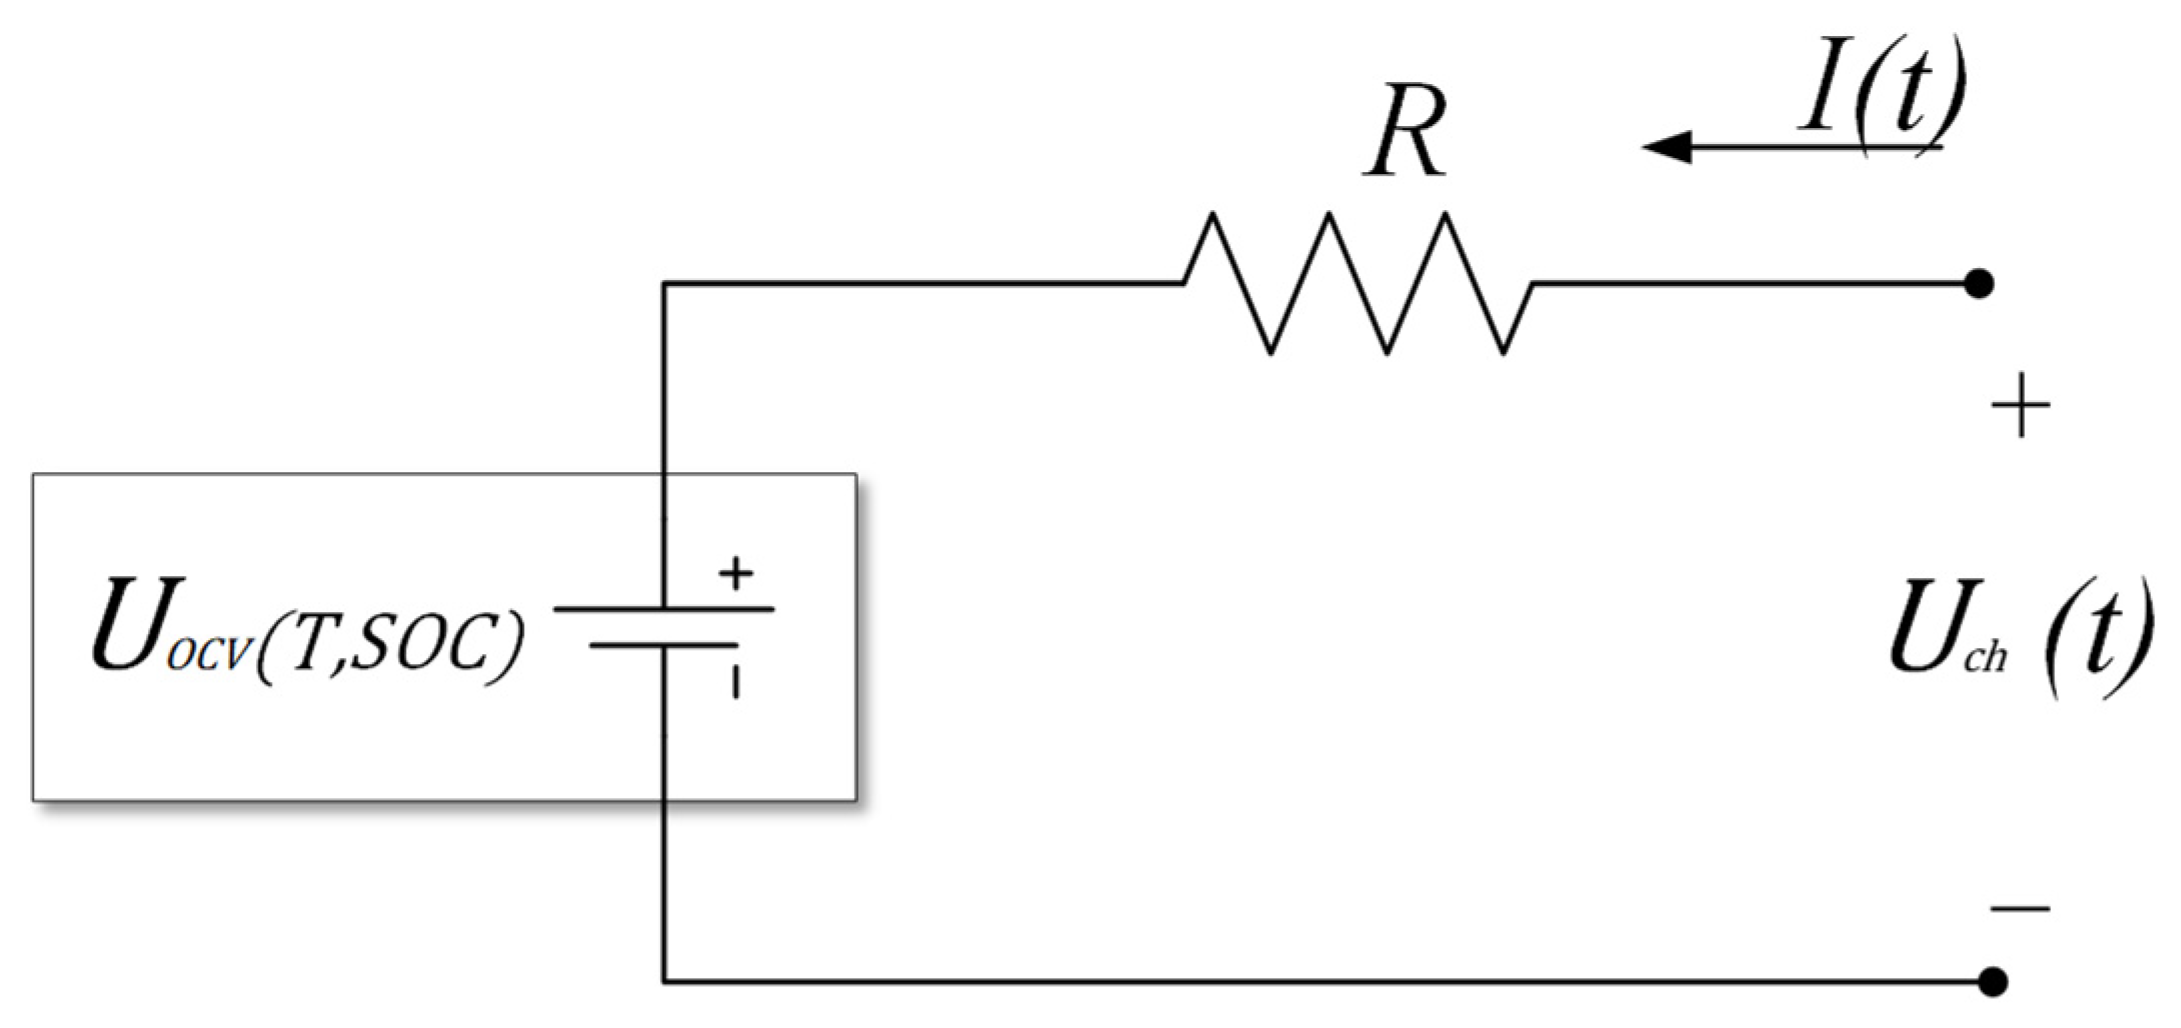
2.2. Improved Internal Resistance Model for Lithium-Ion Batteries

Selecting an appropriate equivalent circuit model is crucial in deriving the charging efficiency equation. Common equivalent circuit models include Rint, Thevenin, PNGV, n-RC, and fractional-order models [25]. Since our study considers the battery charging efficiency within a constant current charging system and the short polarization duration, the internal resistance model is chosen. This model is widely utilized in studying battery charging processes employing the constant current charging mode and the internal resistance model is chosen to examine the effect of internal resistance on battery performance.
As an illustration, we demonstrate the modeling of internal resistance. The internal resistance equivalent circuit model (Figure 2) utilizes Ohm’s law to establish the voltage and current relationship (Equation (9)) in a battery. In constant current charging mode, the current remains constant, and OCV varies with SOC (Section 2.1). The model resistance R reflects the variation in the internal resistance of the battery. The internal resistance of a lithium-ion battery is influenced by a combination of factors, including temperature, SOC, aging, current intensity, and the design and materials of the battery itself [26,27,28]. Based on the experimental conditions in this study, it can be concluded that the internal resistance of the battery changes nonlinearly with respect to battery temperature, charging current, and SOC.
U c h t = U o c v T , S O C + I t × R T , S O C , I
Under constant current conditions, the SOC varies linearly with the runtime. Furthermore, the applied current during constant current charging and discharging is directly proportional to the charging rate, as described in Equation (10). For a 25 Ah LTO battery, a charging current of 25 A corresponds to 1 C-rate.
SOC computation formula at rated capacity C 0 is as follows:
S O C t = S O C t 1 + 100 C 0 t 1 t I t d t
By conducting 0.05 C constant current charge and discharge tests on a LTO battery, the battery’s voltage variation curves were obtained during both the charging and discharging processes. After averaging and inverting the curves, the original OCV curve was derived [29]. The OCV acquired by this approach does not take into account the influence of temperature changes during the actual charging process at different temperatures. Temperature variations during the charge and discharge process affect the reversible electrochemical reactions within the battery, leading to changes in its internal energy. Therefore, when calculating one-way charging efficiency, it is essential to account for these internal energy changes. From the perspective of electrical work, the effect of entropy heat on efficiency is considered through adjustments to the OCV.
Figure 3, Figure 4 and Figure 5 compare the OCV-SOC curves of an LTO battery obtained from a low-current experiment at room temperature (25 °C) and the OCV-SOC curves corrected using the entropy heat coefficient from Equation (8) under 12 different constant current charging conditions.
At ambient temperatures of 0 °C and −20 °C, the corrected OCV curve of the LTO battery across the full SOC range was found to be higher than the original OCV curve, and the difference between them tended to decrease in the high SOC range. This phenomenon occurs because the entropy heat coefficient of the LTO battery is negative in the 0–80% SOC range, and the ambient temperature is lower than the reference temperature, resulting in the corrected OCV being higher than the original OCV. In the high SOC range, the entropy heat coefficient becomes positive, causing the gap between the corrected and original OCV curves to narrow, although the corrected curve remains above the original. It can be inferred that when the battery temperature exceeds the reference temperature, the actual OCV curve shifts downward. Additionally, as the battery temperature deviates further from the reference temperature, the difference between the actual OCV and the experimentally measured original OCV increases. From Figure 4, it is evident that during charging at 25 °C, the difference between the corrected and original OCV is minimal in the low SOC range. However, as charging progresses and the battery continues to accumulate heat, the corrected OCV becomes higher than the original OCV. It is noteworthy that the correction of OCV does not vary significantly with the charging rate. This is because the temperature rise of the battery at different charging rates under the same ambient temperature is much smaller than the impact of ambient temperature changes on the OCV. Under actual charging conditions, the battery temperature differs from that during low-current charge and discharge tests, necessitating corrections to the battery OCV.

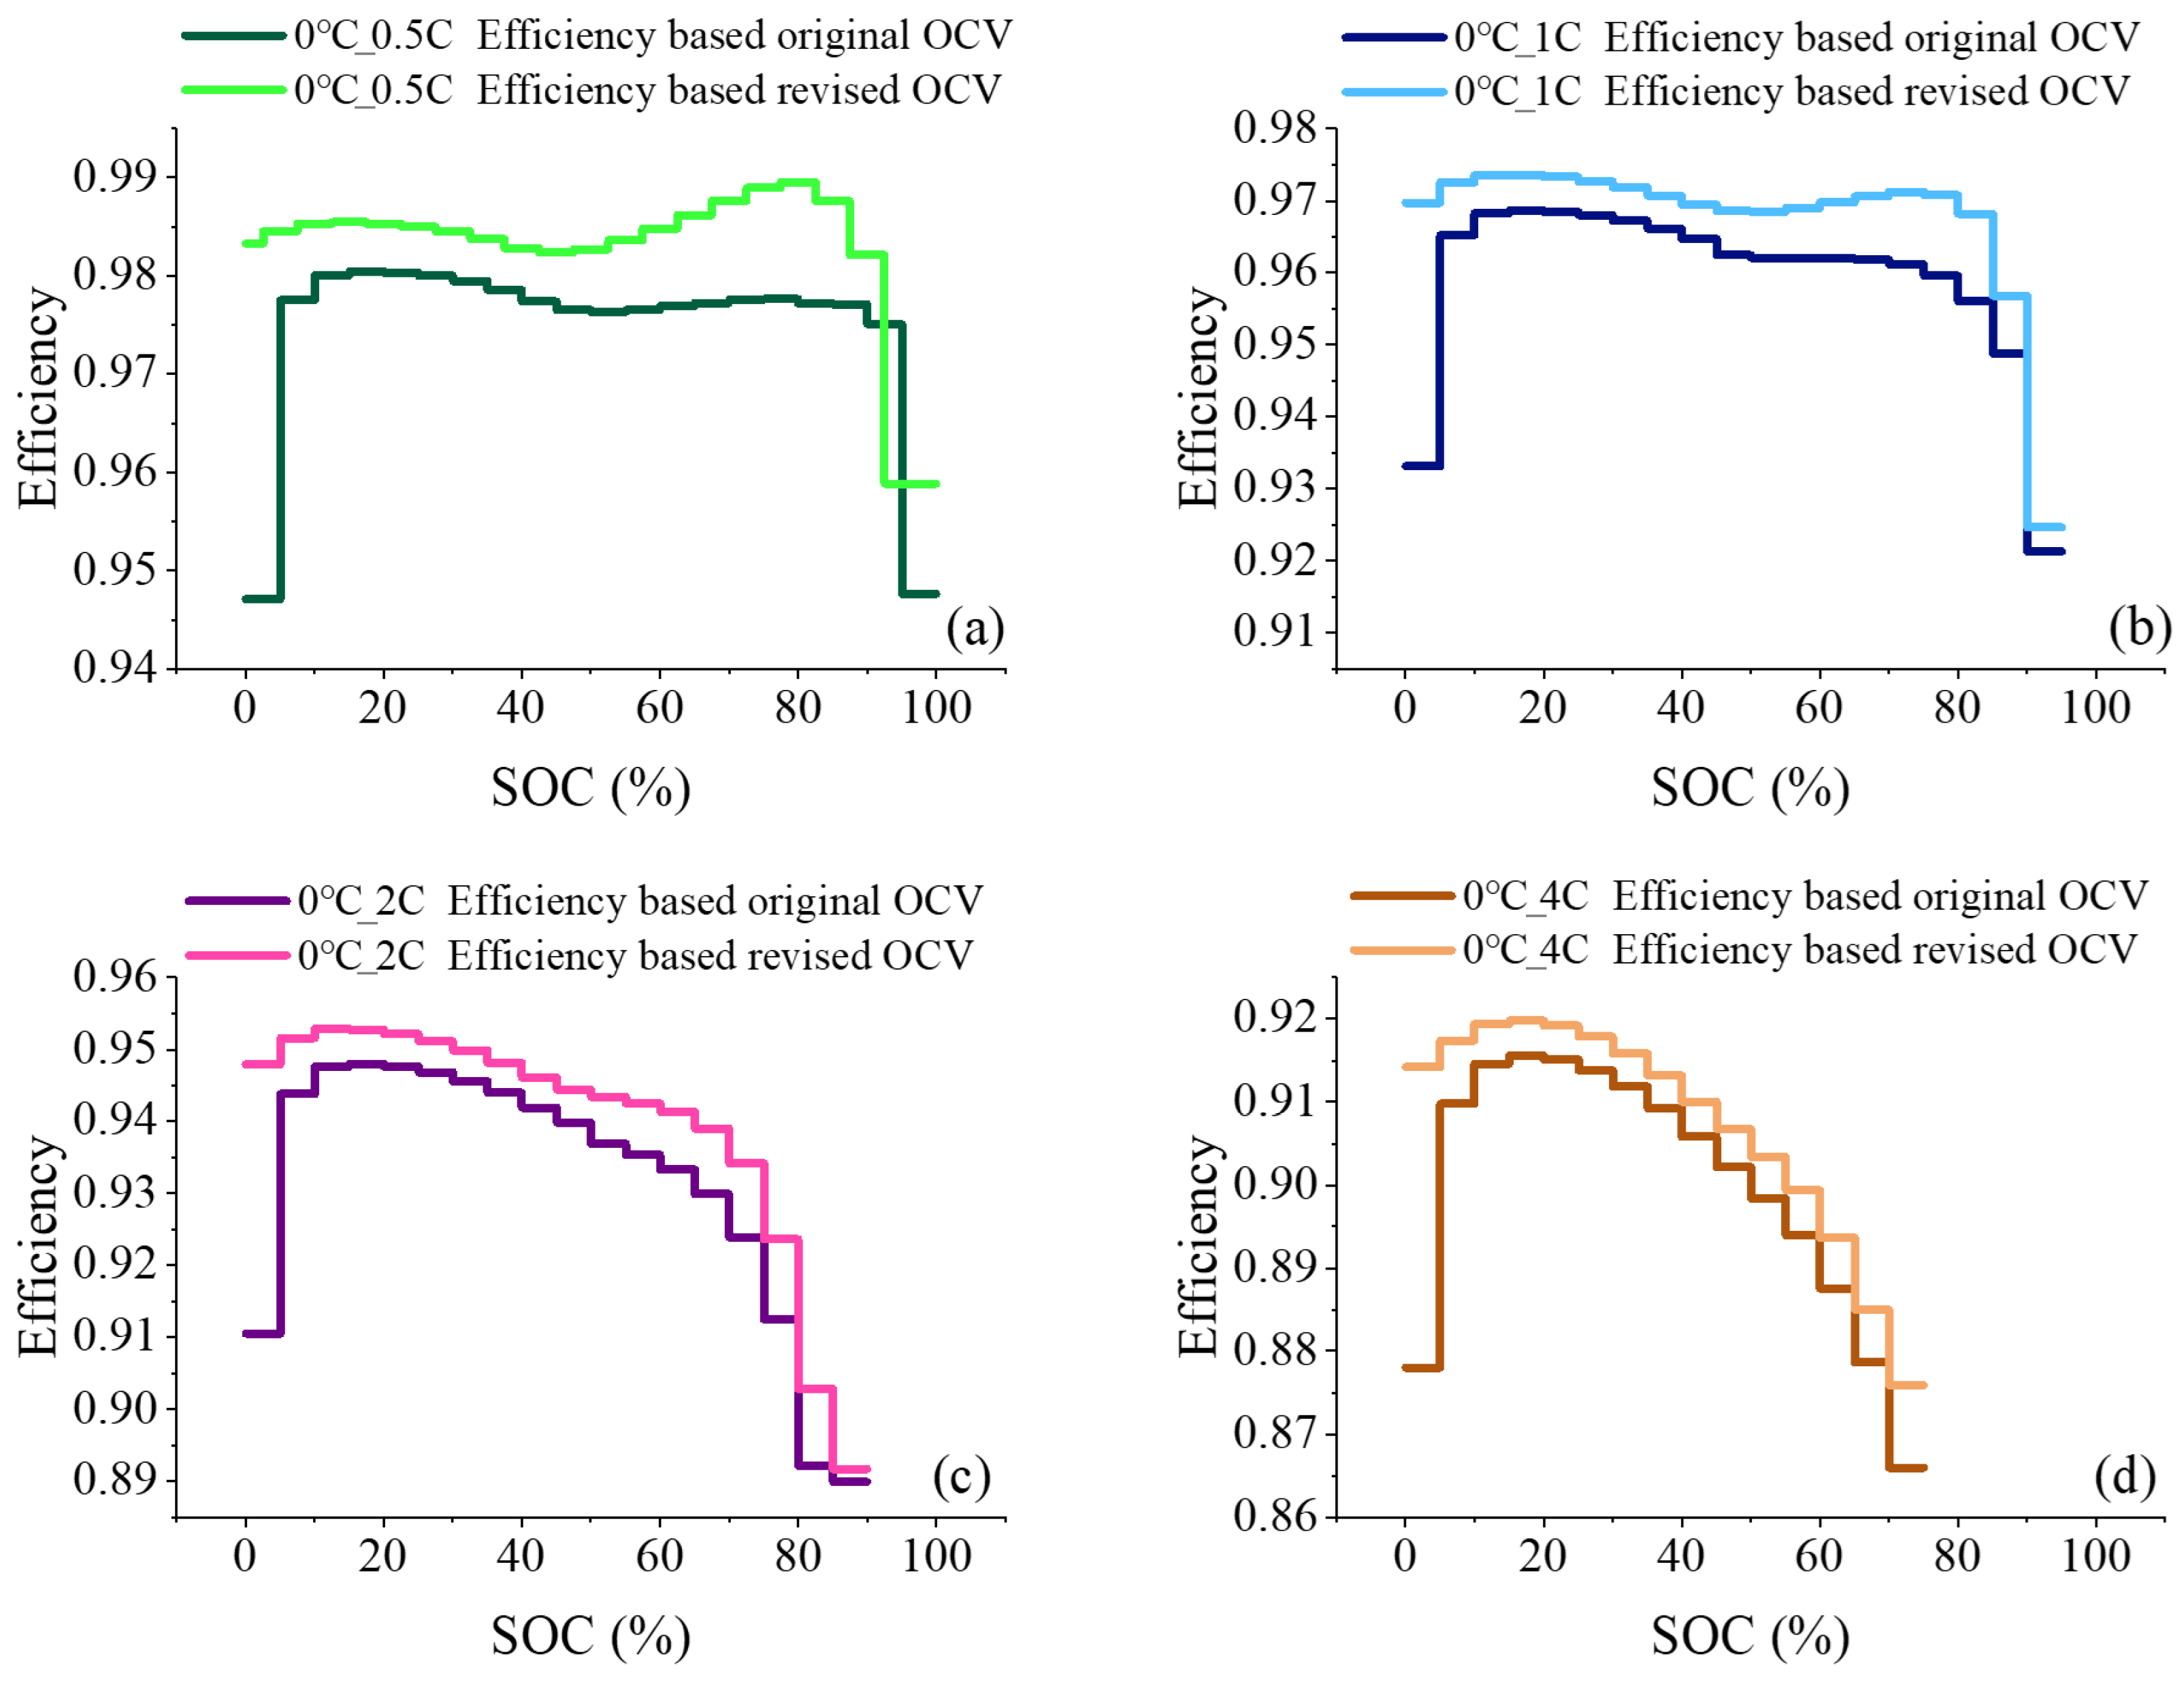
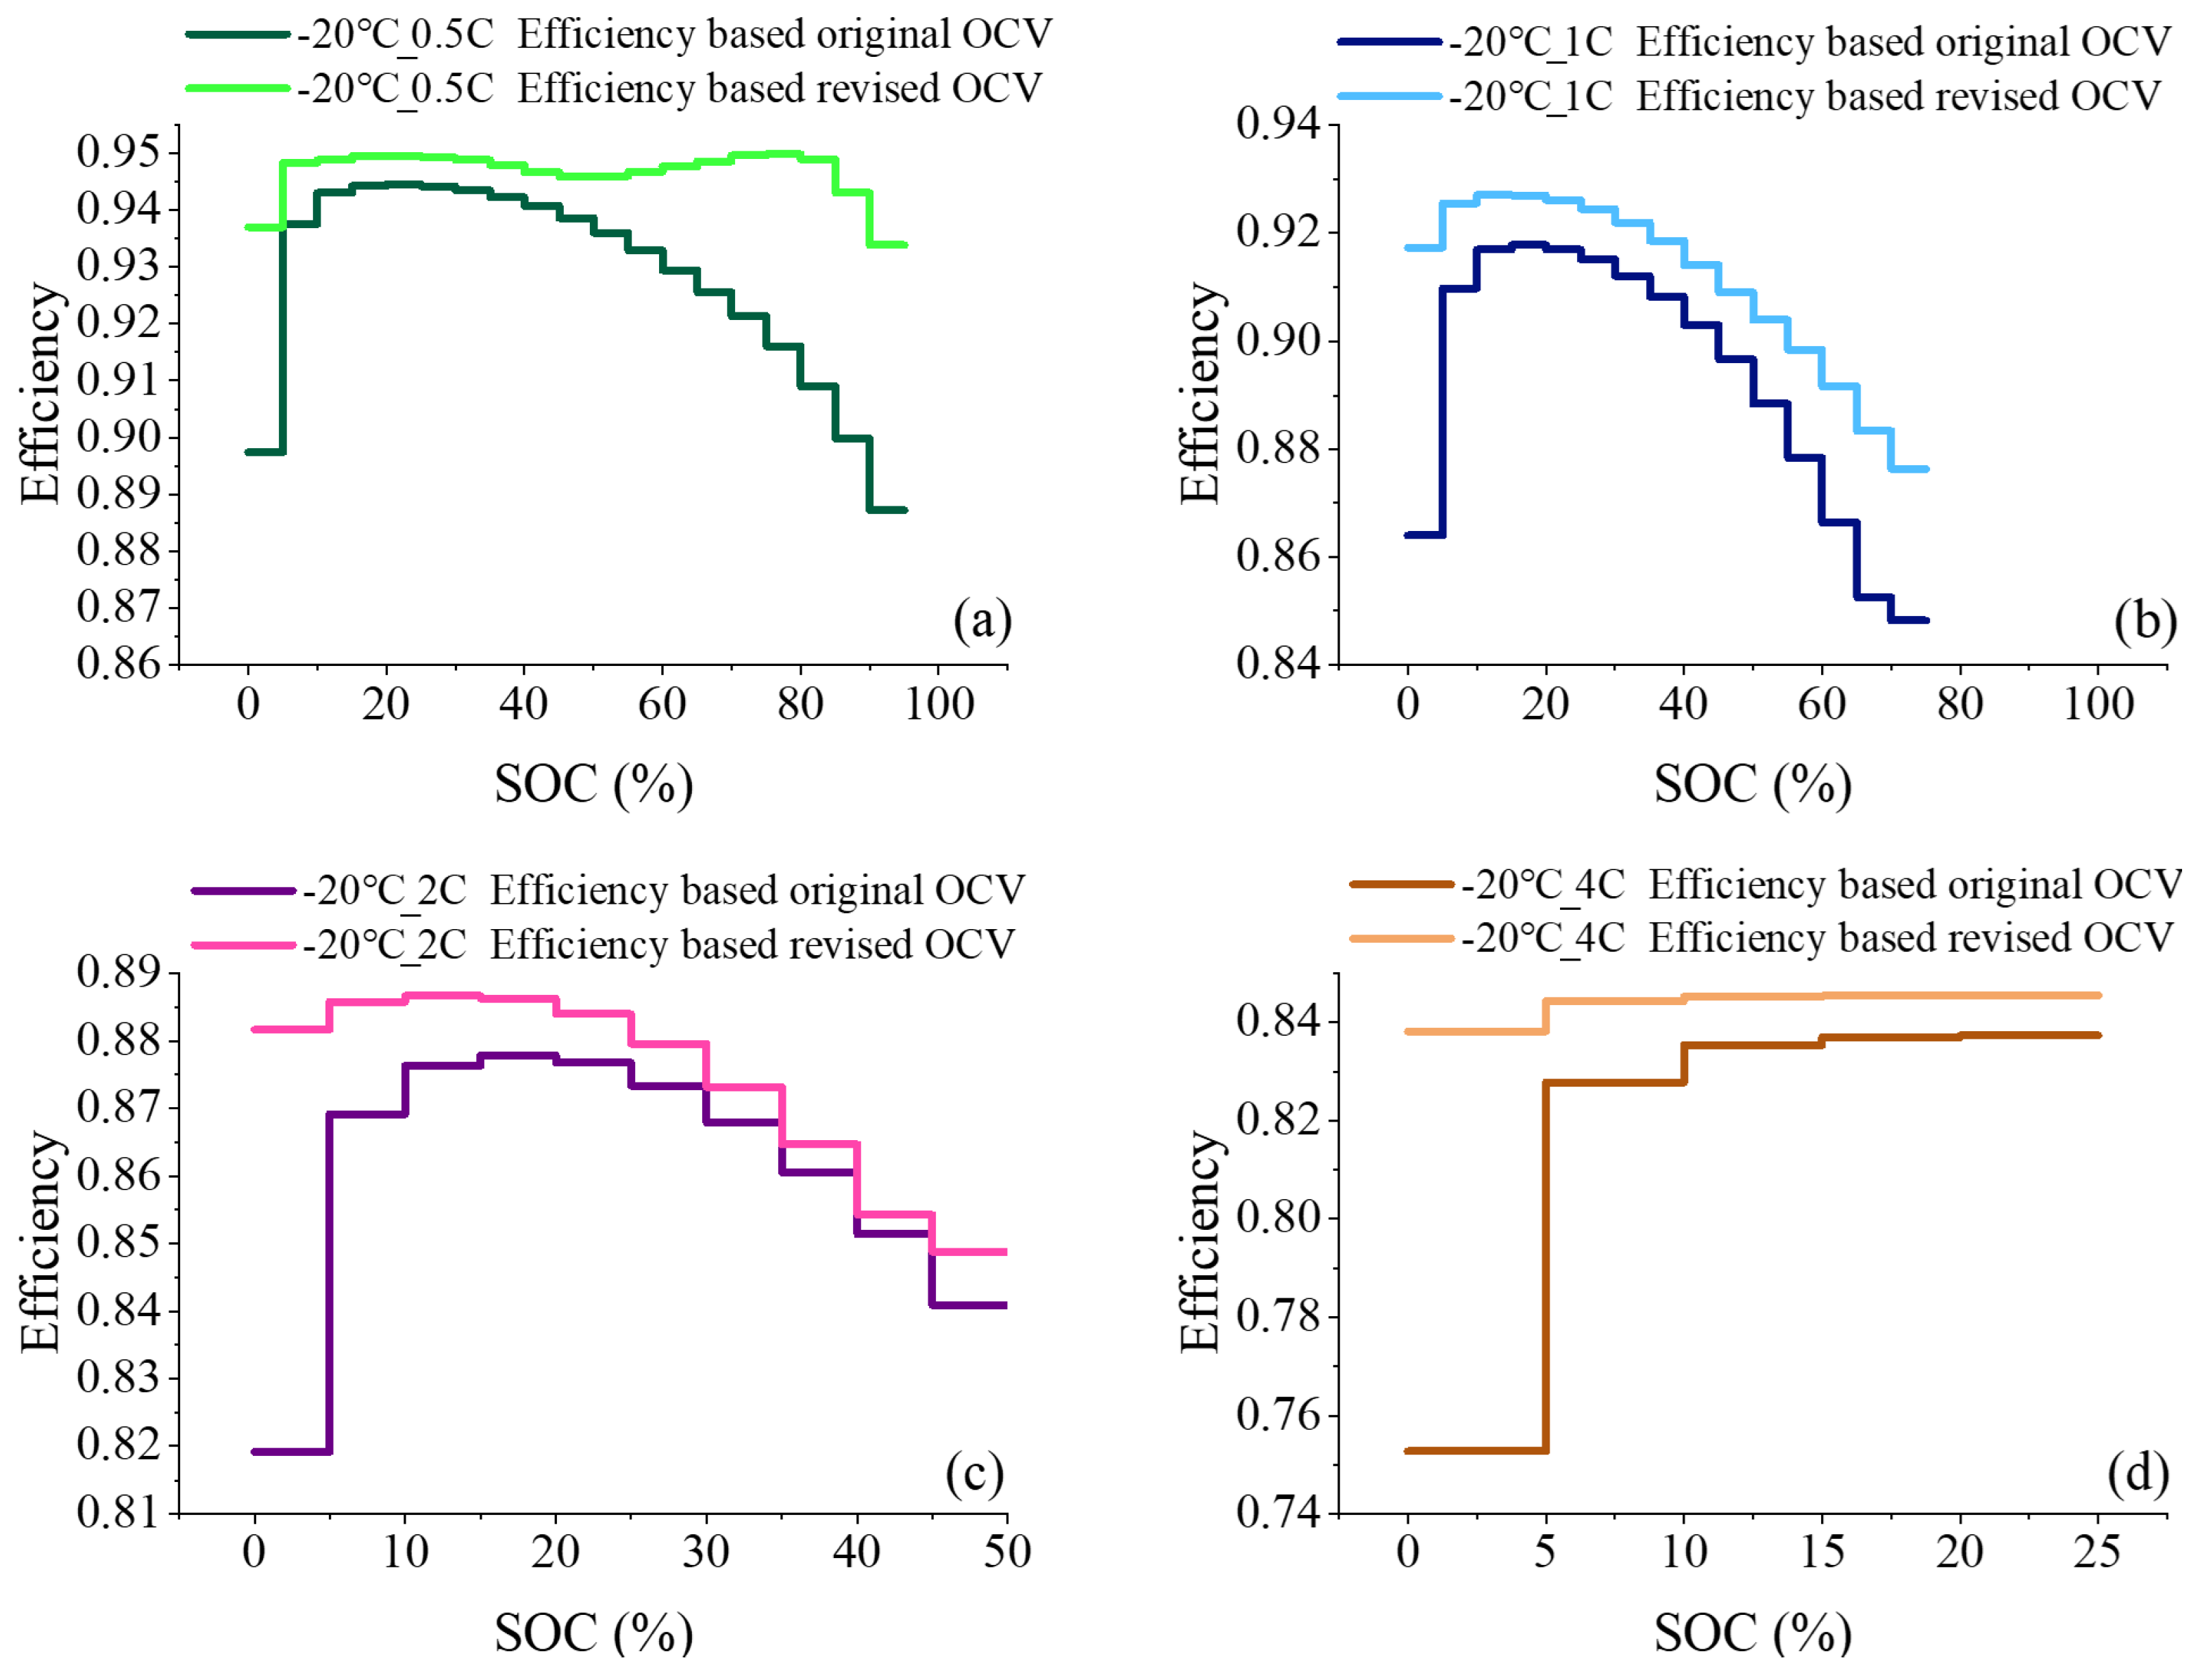
2.3. Derivation of Charging Efficiency Considering Entropic Heat

Battery efficiency mainly includes capacity efficiency, energy efficiency, and voltage efficiency, among others. The battery’s charging/discharging efficiency (energy efficiency) reflects the extent of energy loss during the charging and discharging process. Efficiency can be categorized by the direction of energy flow, including charging, discharging, and round-trip efficiency. One-way efficiency includes both charging and discharging efficiency, while round-trip efficiency refers to charging and discharging within the same SOC range. If the SOC ranges during the charge and discharge half cycles differ, the resulting round-trip efficiency becomes invalid. Round-trip efficiency can be easily determined from the measured current and voltage. In contrast, determining one-way efficiency requires additional data, as it pertains to quantities that cannot be measured directly. Round-trip energy efficiency is expressed as follows:
η c y c l e , E = E d i s E c h
where E d i s and E c h are the discharging and charging energy, respectively, both of which can be calculated from the following general expression:
E = 0 t U t I t d t
where U and I represent the discharge/charge voltage and current, respectively; t represents the charge/discharge time. The round-trip Coulomb efficiency is expressed as follows:
η c y c l e , I = C d i s C c h
where C d i s and C c h represent the amount of discharging and charging charge, respectively, determined as follows:
C = 0 t I t d t
where I represents the measured discharge/charge current; t represents the duration of discharge/charge. The round-trip voltage efficiency is defined as follows:
η c y c l e , U = U d i s ¯ U c h ¯
where U d i s ¯ and U c h ¯ represent the average discharge and charge voltage, respectively. Round-trip efficiency is calculated by multiplying the charging and discharging efficiencies.
η c y c l e = η c h η d i s
One-way efficiency during charging and discharging is heavily influenced by conditions such as charging/discharging current and the SOC range. These conditions often vary significantly between the charging and discharging phases, making it difficult for round-trip efficiency to distinguish between them. Therefore, understanding the loss during each individual cycle (charging or discharging) necessitates knowledge of the one-way efficiency value.
Following the model design in Section 2.2, the efficiency can be determined by calculating the one-way charging voltage relative to the OCV and integrating it over time to obtain the efficiency.
One-way charging voltage efficiency is defined as follows:
η c h = 0 t U O C V d t 0 t U c h d t
One-way discharging voltage efficiency is expressed as follows:
η d i s = 0 t U d i s d t 0 t U O C V d t
When calculating the one-way charging/discharging efficiency, it is important to ensure that the time range for voltage integration is consistent. The calculated efficiency should correspond to the one-way charging/discharging efficiency within this time range.
Based on the internal resistance equivalent model Equation (9) in Section 2.2, the calculation formula for the one-way charging efficiency of the battery in continuous time is derived.
η c h = t 1 t 2 U O C V ( T , S O C ) × I d t t 1 t 2 ( U O C V ( T , S O C ) × I + I 2 R i ) d t
The one-way charging efficiency of a lithium-ion battery is closely related to the OCV and internal resistance at the current charging moment. Using laboratory battery testing equipment, a 25 Ah LTO battery was charged at ambient temperatures of −20 °C, 0 °C, and 25 °C, with charging rates of 0.5 C, 1 C, 2 C, and 4 C, respectively. Data such as charging voltage, current, charging time, and temperature were collected under each charging condition. The battery SOC was calculated using Equation (10), and the corrected OCV data were obtained in conjunction with Section 2.1. The one-way charging efficiency was then computed under 12 orthogonal charging conditions. It is worth noting that, theoretically, battery efficiency changes continuously over the course of charging. However, considering the stability of charging efficiency over short time intervals and the practical significance of efficiency prediction, we discretized the one-way charging efficiency at every 5% SOC increment. The average charging efficiency within each 5% SOC interval was calculated using Equation (19). This efficiency value represents the charging efficiency within the corresponding SOC range.
Figure 6, Figure 7 and Figure 8 compare the charging efficiency of the battery under 12 different charging conditions, before and after OCV correction. As the charging rate increases and the ambient temperature decreases, the charging efficiency across different SOC segments declines significantly. Before OCV correction, the charging efficiency varies noticeably across the different conditions, particularly under the −20 °C_4 C condition, where the average charging efficiency is only 82%. After comparing the battery charging efficiency before and after OCV correction, a marked improvement is observed. This change is attributed to the variation in electrochemical potential (the internal energy of the battery system) caused by temperature during the charging process of LTO batteries. The change in energy efficiency explains the variation in the battery’s internal energy, as the unique thermodynamic entropy heat coefficient of LTO leads to an endothermic reaction during charging. A portion of the reversible heat stored within the battery contributes to improving charging efficiency. Under the 0 °C_0.5 C condition, the charging efficiency increases by nearly 1%. It is evident that OCV correction has a significant impact on the calculation of unidirectional charging efficiency under different operating conditions. However, given that the LTO battery can only charge up to 25% SOC under the −20 °C_4 C condition, the efficiency data are limited, and this condition is excluded from further analysis.

3. Data-Driven Charging Efficiency Prediction Method

The data analysis in Section 2 determined the charging efficiency at each 5% SOC segment under 11 fixed working conditions. However, real-world charging processes involve varying operational conditions and result in dynamic variations in battery temperature. Consequently, a predictive method is necessary to estimate charging efficiency across diverse working conditions. Using the aforementioned data, Section 3 proposes employing a neural network to predict charging efficiency, with consideration of entropy heat changes across various working conditions.
Feedforward Neural Networks (FNNs), Recurrent Neural Networks (RNNs), and Long Short-Term Memory Networks (LSTMs) have been widely applied in battery state prediction. FNNs are primarily used for processing static data, making them suitable for tasks such as pattern recognition and regression. In contrast, LSTMs and RNNs are better suited for time series data, as they can retain historical information [30,31]. Since the efficiency prediction in this study is a one-step forecast that does not rely on previous battery states, and considering the nonlinear relationship between battery efficiency and key parameters such as SOC, current, and temperature, this study adopts a feedforward neural network with the backpropagation (BP) algorithm, i.e., a BP neural network.

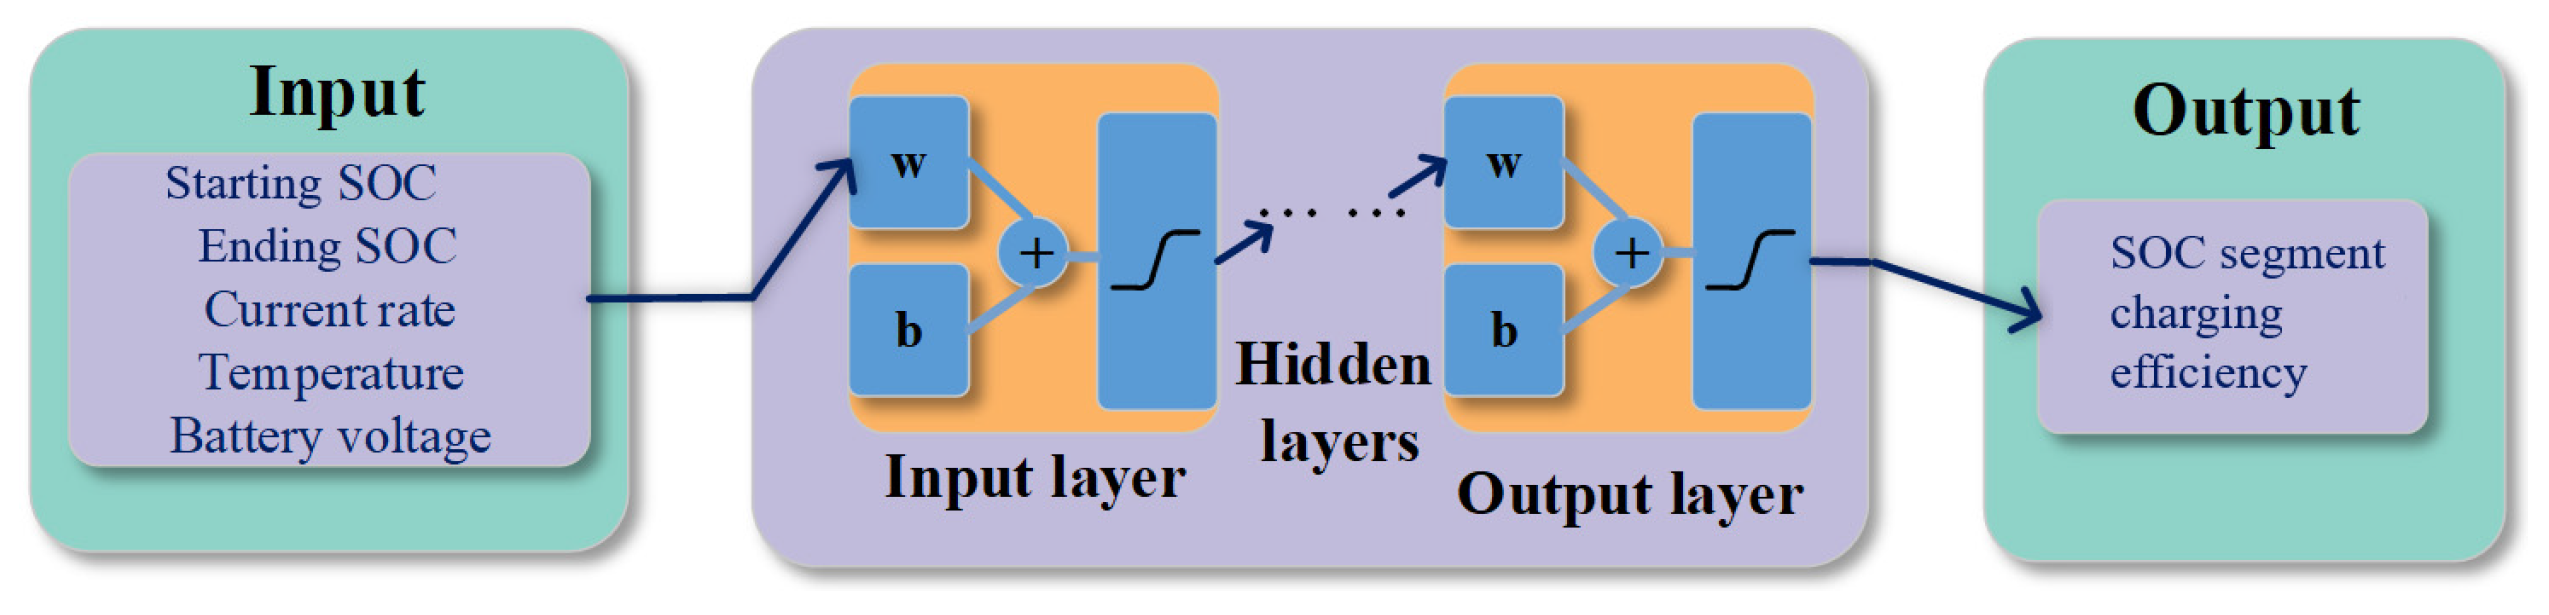
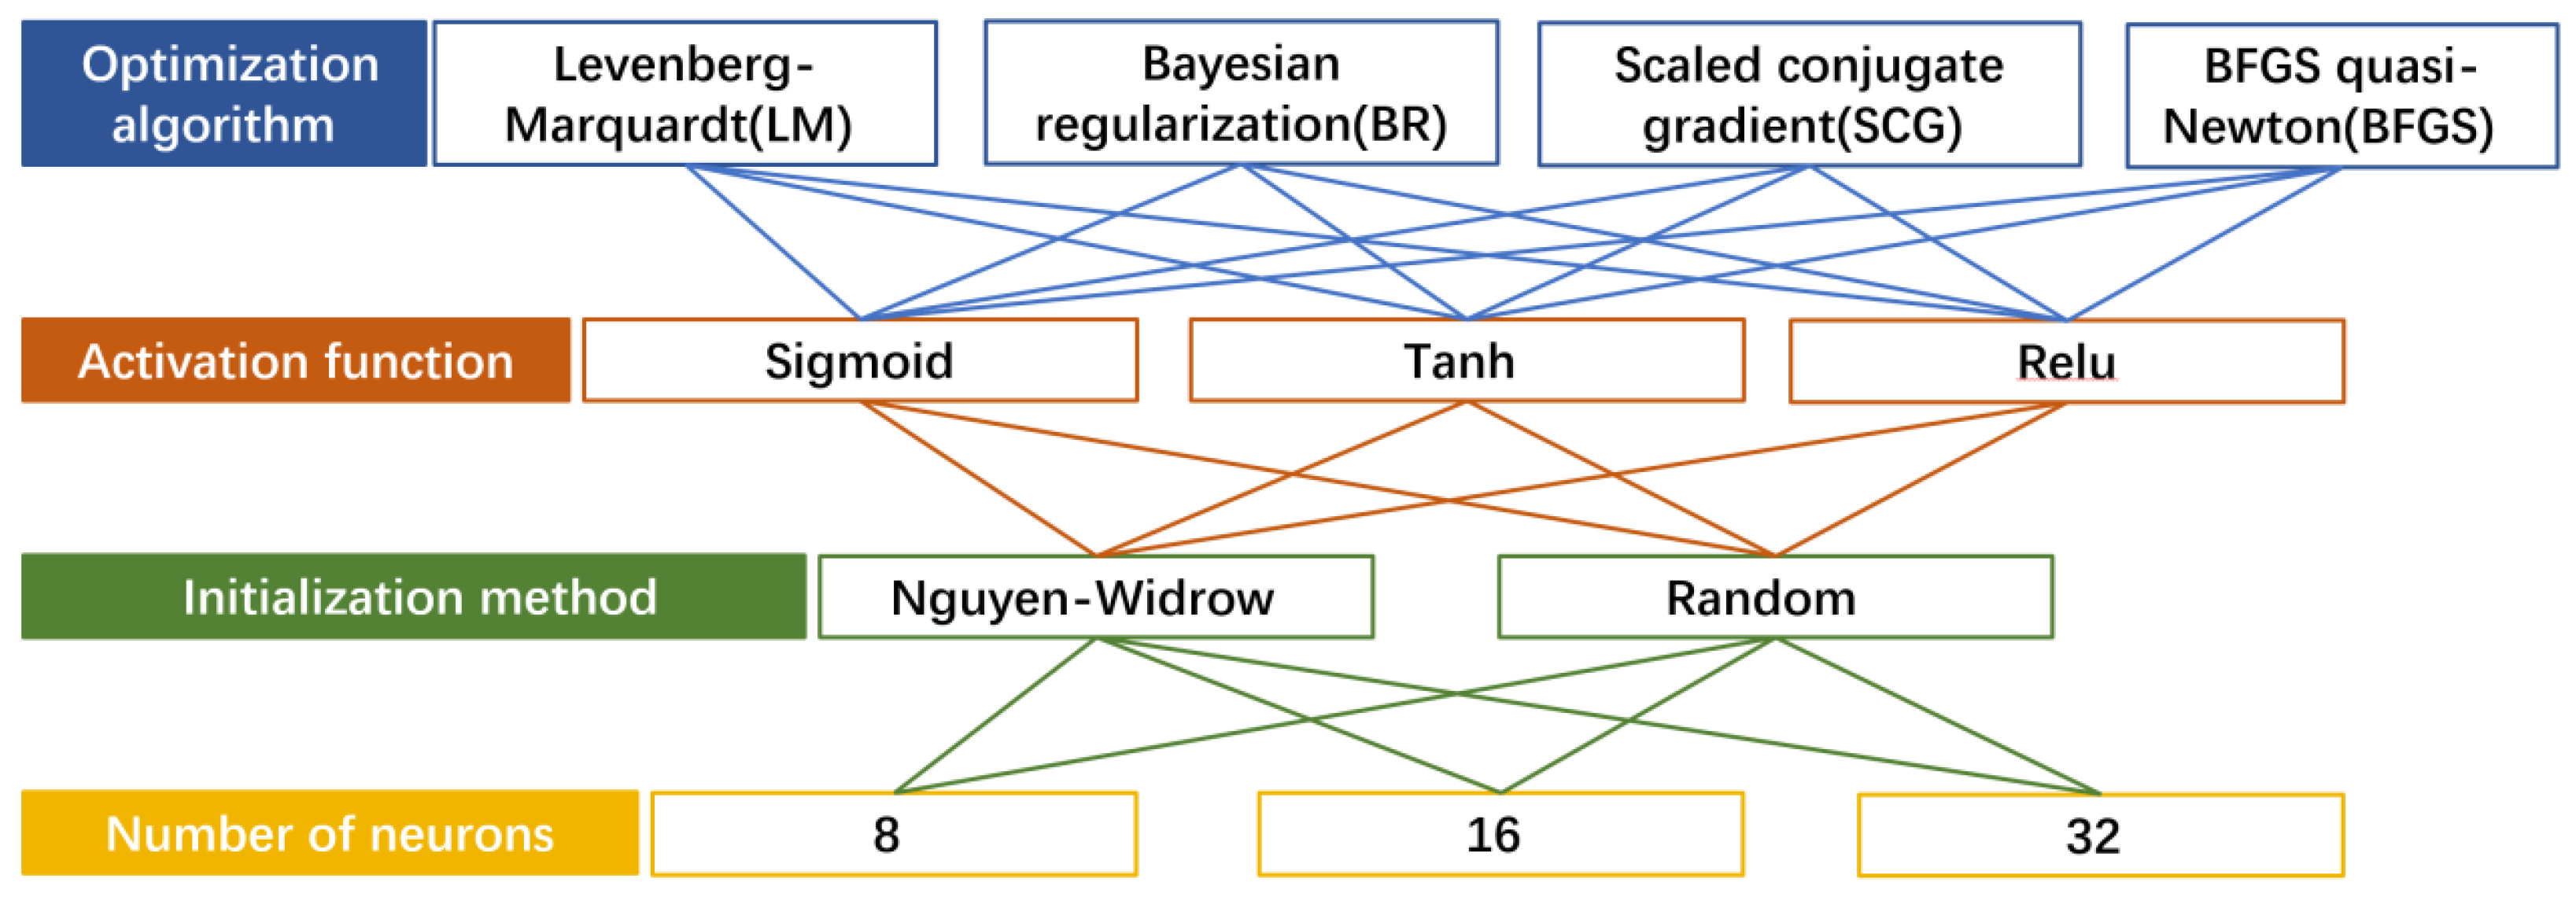
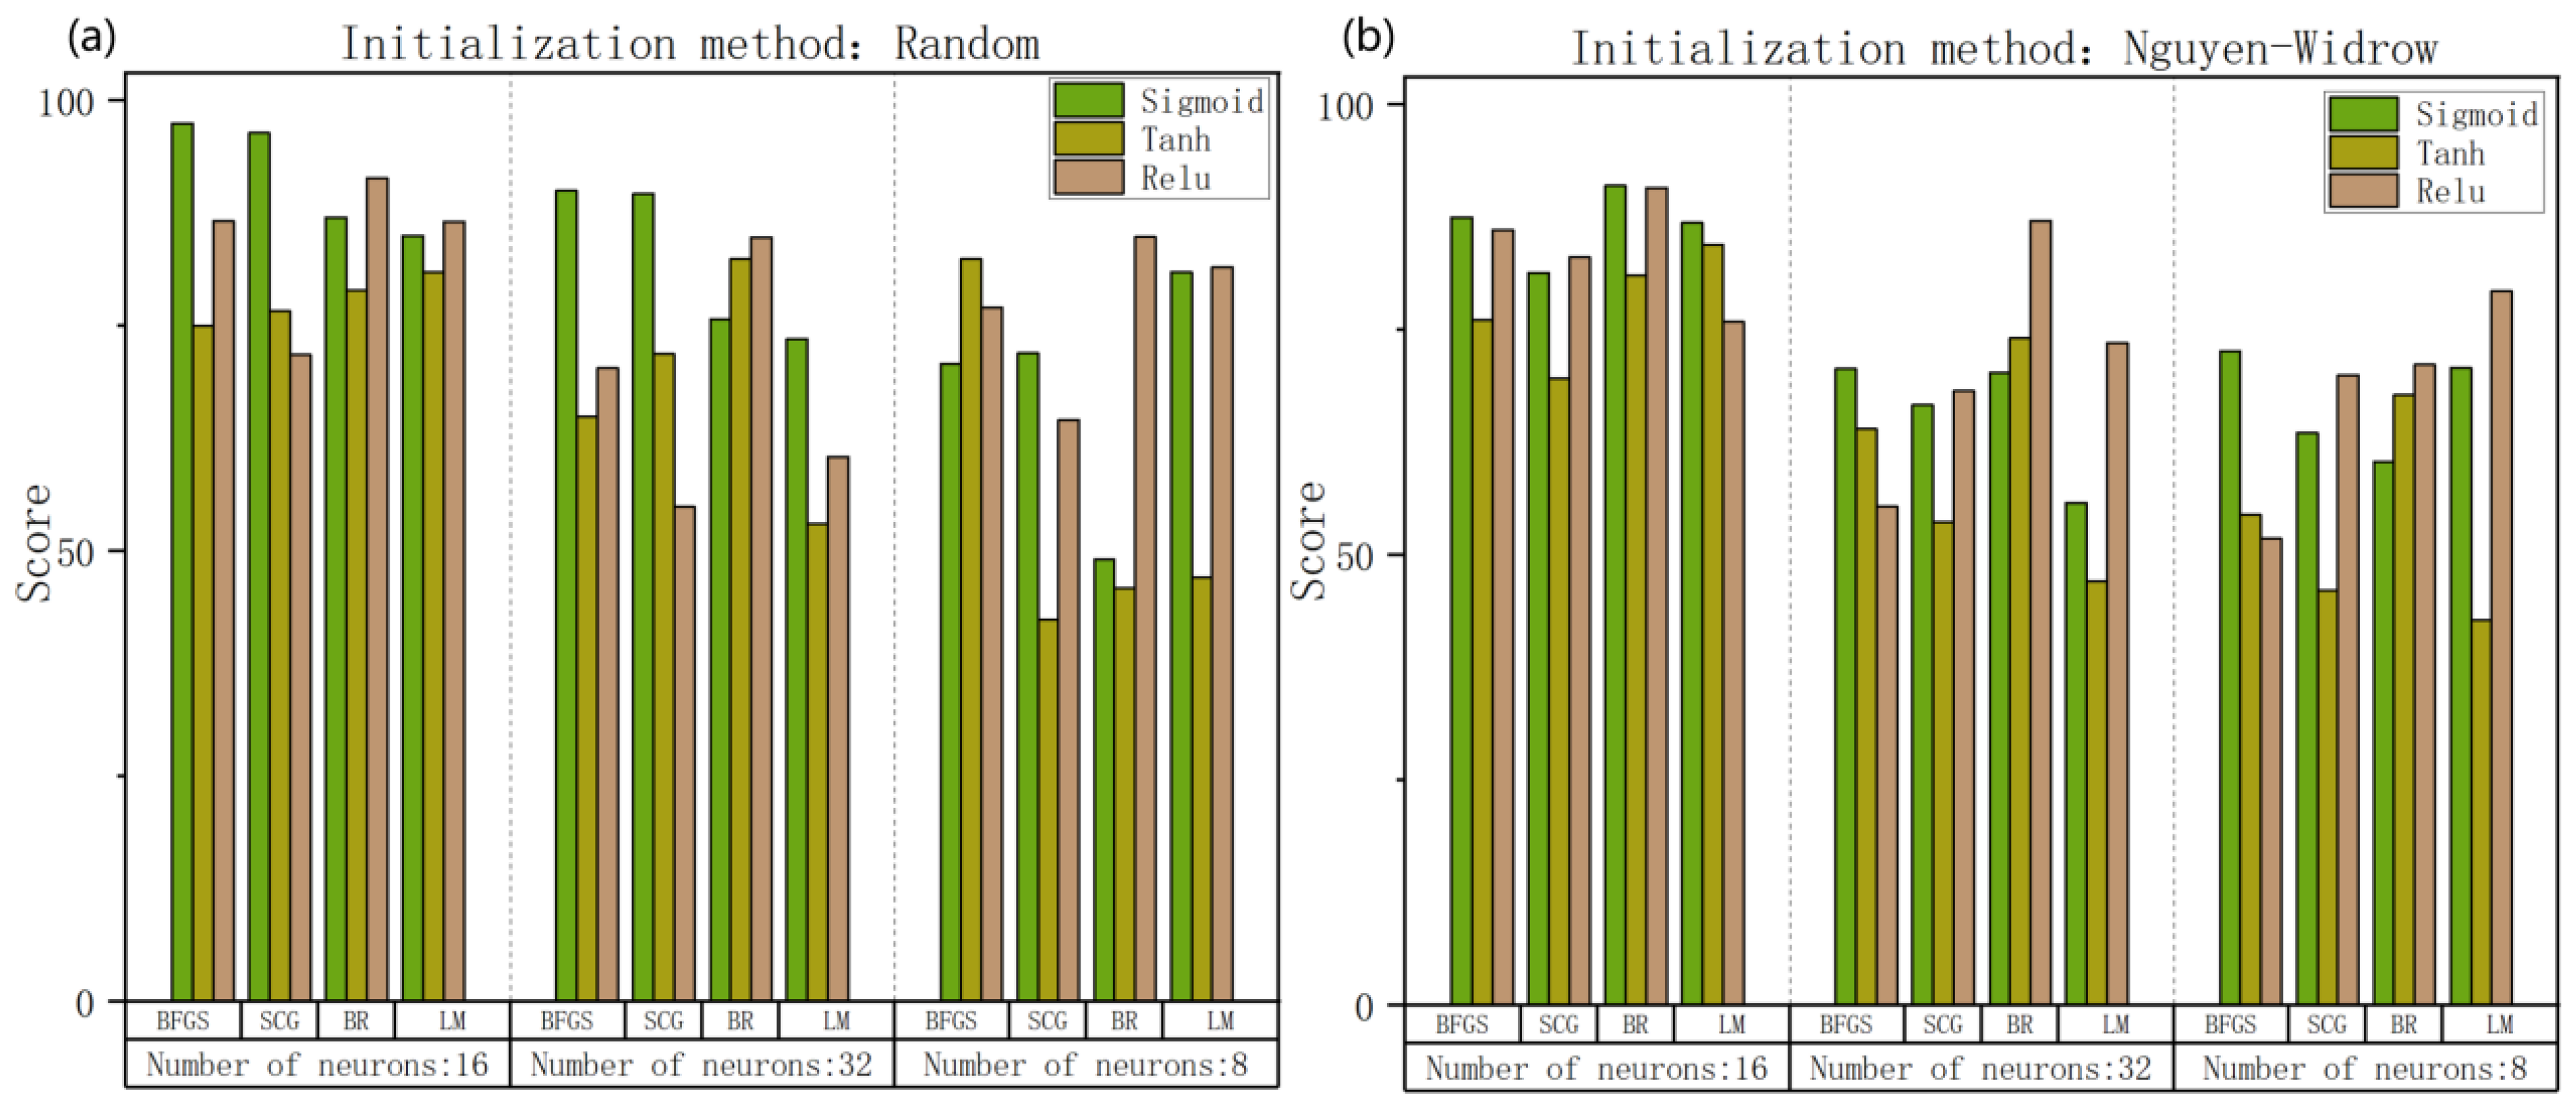
3.1. Model Development and Training Setting

Based on the analysis in Section 2.3, it is evident that battery charging efficiency is closely related to the OCV and internal resistance during the charging process. Internal resistance exhibits a nonlinear relationship with key parameters such as SOC, current, and temperature. Battery terminal voltage, in particular, is a critical parameter for identifying the charging process. The dataset used in this study was collected from battery charging experiments under various conditions, with charging rates of 0.5 C, 1 C, 2 C, and 4 C, and ambient temperatures of −20 °C, 0 °C, and 25 °C. The input parameters for the BP neural network model include starting temperature, charging current, voltage, starting SOC, and ending SOC, while the output parameter is the battery charging efficiency corresponding to 5% SOC segments. Each training dataset spans a 5% SOC interval between the starting and ending SOC, with adjacent training sets sliding by 1% SOC. Based on this configuration, a neural network architecture was developed, consisting of a five-input, single-output BP neural network prediction model, as illustrated in Figure 9.
Considering the diversity of ambient temperature and charging rate in real-world efficiency prediction, studies training neural networks with charging data across all working conditions are limited. This study divides all data (11 groups) under different working conditions into training sets (8 groups) and test sets (3 groups) based on the working conditions to validate the method’s generalization capacity. The practical prediction scenarios of the user usually fall within the working conditions of the battery’s limits (Table 1).

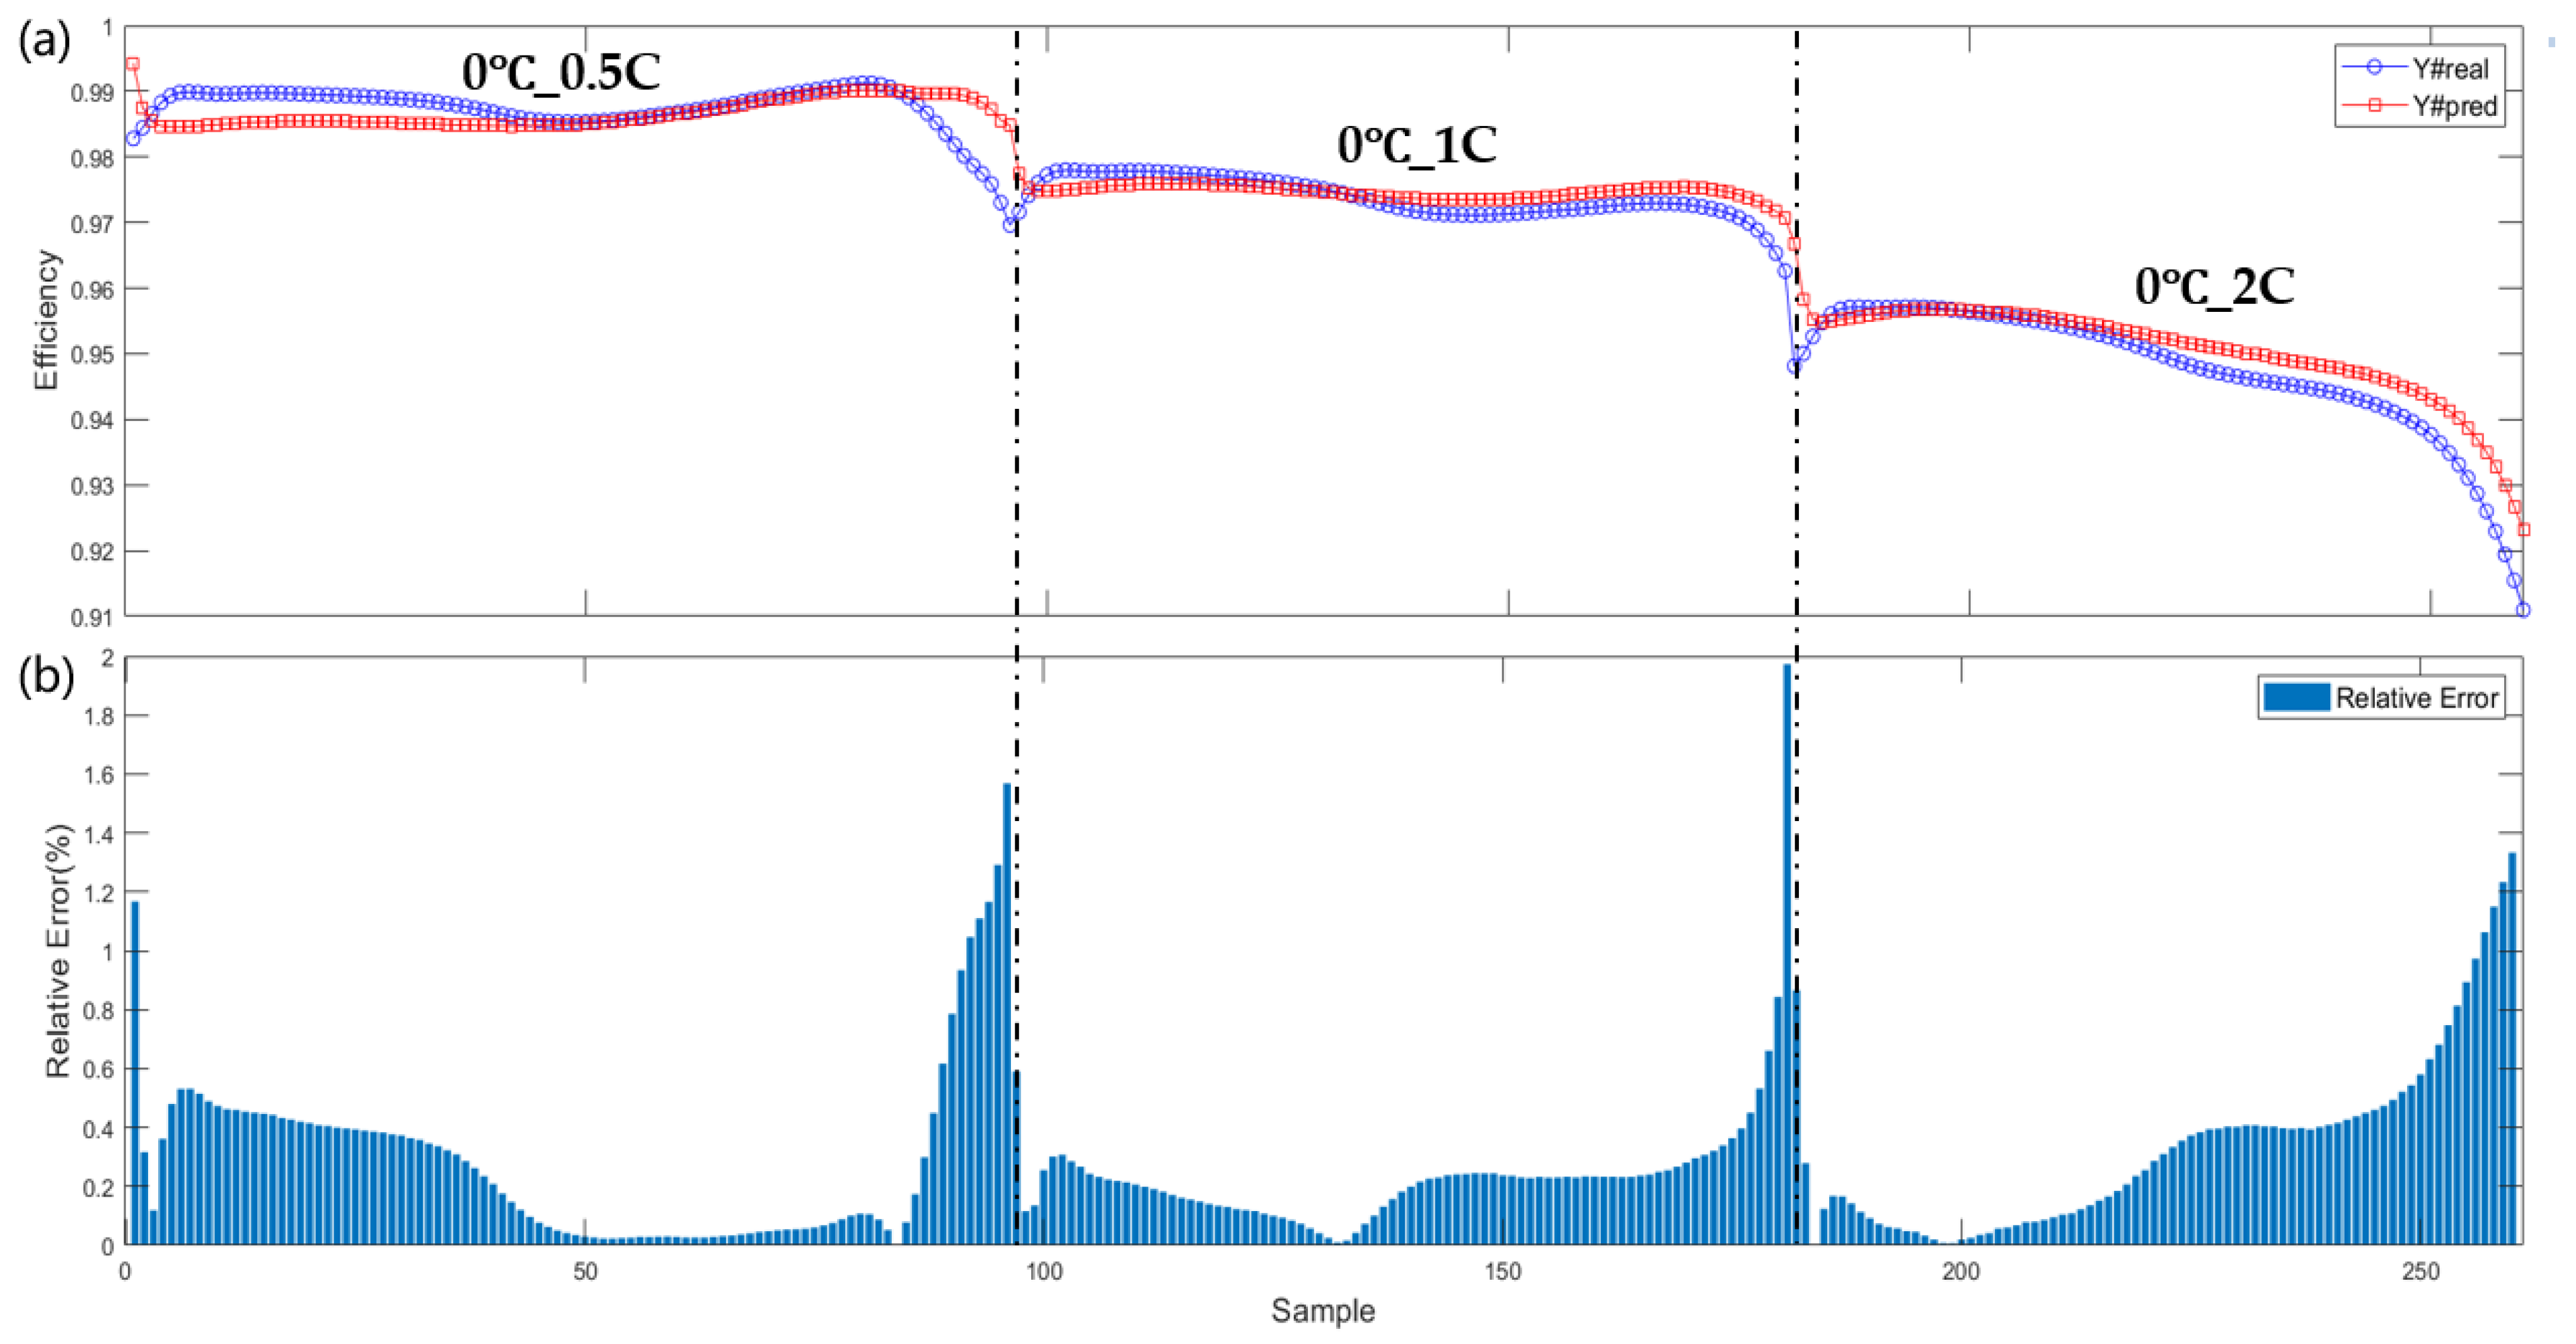
3.2. Comparison of Efficiency Prediction Results

The hyperparameters of a neural network act as control knobs that regulate its structure, functionality, and efficiency. Common hyperparameters include the learning rate, number of iterations, number of hidden layers, number of neurons in hidden layers, activation functions, optimizers, and network initialization methods. Selecting appropriate hyperparameters is crucial for the training and performance of a neural network. For example, the optimization algorithm directly affects the model’s convergence speed and performance, while the number of hidden layers and neurons determines the structural complexity of the model. Given that battery efficiency prediction involves nonlinear function approximation problems [32,33], our study adopts a feedforward neural network with a single hidden layer as the basic framework. We combine four optimization algorithms suited for function approximation problems, three commonly used activation functions, and two initialization methods for neural networks while varying the number of neurons in the hidden layer. This study investigates the impact of different hyperparameters—activation functions, optimization algorithms, number of hidden layer neurons, and initialization methods—on prediction outcomes. Figure 10 illustrates the configuration of various neural network hyperparameters.
In this study, grid search was employed to optimize 72 different hyperparameter configurations. The neural network was trained using a batch learning mode, where the weights were updated after all inputs in the training set were applied. Mean squared error (MSE) was used as the performance function, and an early stopping mechanism was implemented to prevent overfitting. Under two different data partitioning strategies, the average prediction accuracy for each hyperparameter configuration was scored. The prediction error range (5 × 10⁻³, 1 × 10⁻⁵) corresponds to scores between 0 and 100.
Figure 11 illustrates the variation in prediction accuracy across different hyperparameter configurations. Table 2 presents the optimal hyperparameter settings for efficiency prediction. The sigmoid activation function offers the advantage of a limited output range, ensuring data stability during transmission. The scaled conjugate gradient (SCG) algorithm does not require line search in each iteration, which enhances numerical stability. Compared to activation functions, optimization algorithms, and the number of neurons in the hidden layers, the initialization method is less sensitive to prediction error for efficiency. The Nguyen–Widrow initialization method constrains each neuron within a specific range through weight initialization, aiming to accelerate model convergence. However, under unknown training conditions in the test set, the random initialization method improves the generalization and prediction accuracy of the neural network. Using 8 neurons in the hidden layer has proven to be the optimal choice for efficiency prediction, as too many neurons may lead to overfitting, while too few may fail to capture the non-linear relationships of efficiency accurately. For the neural network used in this study, the input layer consists of 5 neurons, the hidden layer has 8 neurons, and the output layer contains 1 neuron. The time complexity can be expressed as O(5 × 8 + 8 × 1) = O(48), indicating that the network performs approximately 48 multiplication and addition operations during each forward pass. The space complexity is O(5 × 8 + 8 × 1 + 8 + 1) = O(57), meaning that the network requires approximately 57 storage units for weights and biases. Given the network’s small size, the computational and storage demands per input remain fixed. Figure 12a,b depicts the predicted efficiency curves, actual curves, and error curves for SOC segment charging efficiency under 0 °C_0.5 C, 0 °C_1 C, and 0 °C_2 C conditions, respectively. The average relative error for efficiency prediction using this approach is 0.29%. Under this optimal hyperparameter configuration, the neural network accurately predicted the battery charging efficiency for the 5% SOC charging segment, confirming the superiority of the feedforward neural network.
Finally, the neural network was integrated into an STM32F407 embedded system, which operates at a clock frequency of 168 MHz and has 192 KB of memory. The neural network model was converted into the TensorFlow Lite format and deployed onto the development board. Upon completing the training of the network, the established prediction model was able to perform real-time predictions. The experimental results demonstrate that the parameter generation and calculation process of the efficiency prediction model, developed in this study, takes approximately 0.034 ms on the embedded system. This process can run within the BMS program, facilitating online predictions in the BMS environment.

4. Conclusions and Final Discussion

The internal energy of the battery is affected by changes in temperature, which directly impact its OCV. This energy component cannot be ignored when calculating battery efficiency. In this study, we derived the battery charging efficiency using relevant formulas from electrochemical and internal resistance models. The results indicate that as the deviation between the battery temperature and the reference temperature increases, the discrepancy between the actual OCV and the experimentally measured OCV becomes more pronounced. After correcting for OCV, the calculated charging efficiency improved by approximately 1% compared to the uncorrected values. The five-input, single-output neural network model developed in this study accurately predicted charging efficiency in 5% SOC segments, with an average relative error of 0.29%. This demonstrates the effectiveness of the feedforward neural network in predicting battery efficiency when the hyperparameters are appropriately configured. Finally, we integrated the prediction model into an embedded system. Our battery efficiency prediction method provides a foundation for further research into heat generation predictions. Future work will focus on real-time prediction of heat generation in battery modules/systems across various time scales, transmitting the predicted data to the cooling system. This enhancement will improve thermal control in battery modules/systems, reduce temperature variation, and increase both temperature control accuracy and cooling system efficiency.

Author Contributions

Conceptualization, W.Z. and Z.W. (Zhenpo Wang); Methodology, X.D.; Software, X.D. and C.Y.; Validation, C.Y., C.G. and X.D.; Data Curation, J.S. and Z.W. (Zhihao Wang); Writing—Original Draft Preparation, C.Y. and C.G.; Writing—Review and Editing, Z.A. and Q.L.; Supervision, Y.B. All authors have read and agreed to the published version of the manuscript.

Funding

This research received no external funding.

Data Availability Statement

The original contributions presented in this study are included in this article; further inquiries can be directed to the corresponding author.

Conflicts of Interest

The authors Zhenjia An and Qiang Liu were employed by the company Longruisanyou New Energy Automobile Technology Co., Ltd. The remaining authors declare that this research was conducted in the absence of any commercial or financial relationships that could be construed as potential conflicts of interest.

References

  1. Yao, L.; Aziz, J.; Kong, P.; Idris, N.; Alsofyani, I. Modeling of lithium titanate battery for charger design. In Proceedings of the 2014 Australasian Universities Power Engineering Conference (AUPEC), Perth, WA, Australia, 28 September–1 October 2014; pp. 1–5. [Google Scholar] [CrossRef]
  2. Yue, Y. Study on Fast Charging Method of Lithium Titanate Battery. In Proceedings of the 2023 8th Asia Conference on Power and Electrical Engineering (ACPEE), Tianjin, China, 14–16 April 2023; pp. 549–553. [Google Scholar] [CrossRef]
  3. Wang, Z.; Zhou, X.; Zhang, W.; Sun, B.; Shi, J.; Huang, Q. Parameter sensitivity analysis and parameter identifiability analysis of electrochemical model under wide discharge rate. J. Energy Storage 2023, 68, 107788. [Google Scholar] [CrossRef]
  4. Zhou, X.; Wang, Z.; Zhang, W.; Sun, B.; Su, X.; Shi, J.; Huang, Q. Construction of simplified impedance model based on electrochemical mechanism and identification of mechanism parameters. J. Energy Storage 2024, 76, 109673. [Google Scholar] [CrossRef]
  5. Liu, S.; Jiang, J.; Shi, W.; Ma, Z.; Wang, L.; Guo, H. Butler–volmer-equation-based electrical model for high-power lithium titanate batteries used in electric vehicles. IEEE T. Ind. Electron. 2015, 62, 7557–7568. [Google Scholar] [CrossRef]
  6. Ahmadi, L.; Fowler, M.; Young, S.; Fraser, R.; Gaffney, B.; Walker, S. Energy efficiency of Li-ion battery packs re-used in stationary power applications. Sustain. Energy Technol. 2014, 8, 9–17. [Google Scholar] [CrossRef]
  7. Xiao, J.; Li, Q.; Bi, Y.; Cai, M.; Dunn, B.; Glossmann, T.; Liu, J.; Osaka, T.; Sugiura, R.; Wu, B.; et al. Understanding and applying coulombic efficiency in lithium metal batteries. Nat. Energy 2020, 5, 561–568. [Google Scholar] [CrossRef]
  8. Lin, Z.; Li, D.; Zou, Y. Energy efficiency of lithium-ion batteries: Influential factors and long-term degradation. J. Energy Storage 2023, 74, 109386. [Google Scholar] [CrossRef]
  9. Yang, F.; Wang, D.; Zhao, Y.; Tsui, K.; Bae, S. A study of the relationship between coulombic efficiency and capacity degradation of commercial lithium-ion batteries. Energy 2018, 145, 486–495. [Google Scholar] [CrossRef]
  10. Zhu, W.; Zhu, Y.; Davis, Z.; Tatarchuk, B. Energy efficiency and capacity retention of Ni–MH batteries for storage applications. Appl. Energy 2013, 106, 307–313. [Google Scholar] [CrossRef]
  11. Liu, C.; Wang, S.; Zhang, C.; Fu, H.; Nan, X.; Yang, Y.; Cao, G. High power high safety battery with electrospun Li3V2(PO4)3 cathode and Li4Ti5O12 anode with 95% energy efficiency. Energy Stor. 2016, 5, 93–102. [Google Scholar] [CrossRef]
  12. Li, K.; Tseng, K. Energy efficiency of lithium-ion battery used as energy storage devices in micro-grid. In Proceedings of the IECON 2015-41st Annual Conference of the IEEE Industrial Electronics Society, Yokohama, Japan, 9–12 November 2015; pp. 005235–005240. [Google Scholar]
  13. Lai, X.; Zhou, L.; Zhu, Z.; Zheng, Y.; Sun, T.; Shen, K. Experimental investigation on the characteristics of coulombic efficiency of lithium-ion batteries considering different influencing factors. Energy 2023, 274, 127408. [Google Scholar] [CrossRef]
  14. Kang, J.; Yan, F.; Zhang, P.; Du, C. Comparison of comprehensive properties of Ni-MH (nickel-Metal Hydride) and Li-ion (lithium-ion) batteries in terms of energy efficiency. Energy 2014, 70, 618–625. [Google Scholar] [CrossRef]
  15. Wang, S. Entropy and heat generation of lithium cells/batteries. Chin. Phys. B 2016, 25, 010509. [Google Scholar] [CrossRef]
  16. Jalkanen, K.; Aho, T.; Vuorilehto, K. Entropy change effects on the thermal behavior of a LiFePO4/graphite lithium-ion cell at different states of charge. J. Power Sources 2013, 243, 354–360. [Google Scholar] [CrossRef]
  17. Doh, H.; Ha, Y.; Eom, S. Entropy measurement of a large format lithium ion battery and its application to calculate heat generation. Electrochim. Acta 2019, 309, 382–391. [Google Scholar] [CrossRef]
  18. Lai, Y.; Du, S.; Ai, L.; Ai, L.; Cheng, Y.; Tang, Y.; Jia, M. Insight into heat generation of lithium ion batteries based on the electrochemical-thermal model at high discharge rates. Int. J. Hydrogen Energy 2015, 40, 13039–13049. [Google Scholar] [CrossRef]
  19. Shi, J.; Zhang, W.; Bao, Y.; Gao, D.; Wang, Z. Load Forecasting of Electric Vehicle Charging Stations: Attention Based Spatiotemporal Multi-Graph Convolutional Networks. IEEE Trans. Smart Grid 2023, 15, 3016–3027. [Google Scholar] [CrossRef]
  20. Nascimento, R.; Corbetta, M.; Kulkarni, C.; Viana, F. Hybrid physics-informed neural networks for lithium-ion battery modeling and prognosis. J. Power Sources 2021, 513, 230526. [Google Scholar] [CrossRef]
  21. Wang, F.; Zhi, Q.; Zhao, Z.; Zhai, Z.; Liu, Y.; Xi, H.; Wang, S.; Chen, X. Inherently Interpretable Physics-Informed Neural Network for Battery Modeling and Prognosis. IEEE Trans. Neural Netw. Learn. Syst. 2023, 1–15. [Google Scholar] [CrossRef]
  22. Dong, C.; Wang, G. Estimation of power battery SOC based on improved BP neural network. In Proceedings of the 2014 IEEE International Conference on Mechatronics and Automation, Tianjin, China, 3–6 August 2014; pp. 2022–2027. [Google Scholar] [CrossRef]
  23. Wang, Y.; Chen, X.; Li, C.; Yu, Y.; Zhou, G.; Wang, C.; Zhao, W. Temperature prediction of lithium-ion battery based on artificial neural network model. Appl. Therm. Eng. 2023, 228, 120482. [Google Scholar] [CrossRef]
  24. Liu, Y.; Zhang, L.; Jiang, J.; Wei, S.; Liu, S.; Zhang, W. A Data-Driven Learning-Based Continuous-Time Estimation and Simulation Method for Energy Efficiency and Coulombic Efficiency of Lithium Ion Batteries. Energies 2017, 10, 597. [Google Scholar] [CrossRef]
  25. Xiong, R.; Cao, J.; Yu, Q.; He, H.; Sun, F. Critical review on the battery state of charge estimation methods for electric vehicles. IEEE Access 2017, 6, 1832–1843. [Google Scholar] [CrossRef]
  26. Chen, Y.; Yang, G.; Zhu, H.; Sun, X. An open circuit voltage and internal resistance estimation method of lithium-ion batteries with constant current tests. Trans. China Electrotech. Soc. 2018, 33, 3976–3988. [Google Scholar]
  27. Liu, X.; Chen, Z.; Zhang, C.; Wu, J. A novel temperature-compensated model for power Li-ion batteries with dual-particle-filter state of charge estimation. Appl. Energy 2014, 123, 263–272. [Google Scholar] [CrossRef]
  28. Chen, L.; Zhang, M.; Ding, T.; Wu, S.; Li, Y.; Liang, G.; Li, H.; Pan, H. Estimation the internal resistance of lithium-ion-battery using a multi-factor dynamic internal resistance model with an error compensation strategy. Energy Rep. 2021, 7, 3050–3059. [Google Scholar] [CrossRef]
  29. Plett, G. Extended Kalman filtering for battery management systems of Li PB-based HEV battery packs, Part 2. Modeling and identification. J. Power Sources 2004, 134, 262–276. [Google Scholar] [CrossRef]
  30. Hu, Y.; Wang, Z. Study on SOC Estimation of Lithium Battery Based on Improved BP Neural Network. In Proceedings of the 2019 8th International Symposium on Next Generation Electronics (ISNE), Zhengzhou, China, 9–10 October 2019; pp. 1–3. [Google Scholar] [CrossRef]
  31. Shrestha, A.; Mahmood, A. Review of Deep Learning Algorithms and Architectures. IEEE Access 2019, 7, 53040–53065. [Google Scholar] [CrossRef]
  32. Sheng, L.; Zhang, Z.; Su, L.; Zhang, H.; Zhang, H.; Li, K.; Fang, Y.; Ye, W. Experimental and numerical approach for analyzing thermal behaviors of a prismatic hard-cased lithium-ion battery. J. Energy Storage 2021, 35, 102313. [Google Scholar] [CrossRef]
  33. Foresee, F.; Hagan, M. Gauss-Newton approximation to Bayesian learning. In Proceedings of the International Conference on Neural Networks (ICNN’97), Houston, TX, USA, 9–12 June 1997; Volume 3, pp. 1930–1935. [Google Scholar]
Figure 1. Structural framework of this study.
Batteries 10 00350 g001
Figure 2. Internal resistance of equivalent circuit model.
Batteries 10 00350 g002
Figure 3. Comparison of OCV-SOC curves before and after OCV correction at (a) 0 °C_0.5 C; (b) 0 °C_1 C; (c) 0 °C_2 C; (d) 0 °C_4 C.
Batteries 10 00350 g003
Figure 4. Comparison of OCV-SOC curves before and after OCV correction at (a) 25 °C_0.5 C; (b) 25 °C_1 C; (c) 25 °C_2 C; (d) 25 °C_4 C.
Batteries 10 00350 g004
Figure 5. Comparison of OCV-SOC curves before and after OCV correction at (a) −20 °C_0.5 C; (b) −20 °C_1 C; (c) −20 °C_2 C; (d) −20 °C_4 C.
Batteries 10 00350 g005
Figure 6. Comparison of efficiency before and after OCV correction at (a) 0 °C_0.5 C; (b) 0 °C_1 C; (c) 0 °C_2 C; (d) 0 °C_4 C.
Batteries 10 00350 g006
Figure 7. Comparison of efficiency before and after OCV correction at (a) 25 °C_0.5 C; (b) 25 °C_1 C; (c) 25 °C_2 C; (d) 25 °C_4 C.
Batteries 10 00350 g007
Figure 8. Comparison of efficiency before and after OCV correction at (a) −20 °C_0.5 C; (b) −20 °C_1 C; (c) −20 °C_2 C; (d) −20 °C_4 C.
Batteries 10 00350 g008
Figure 9. Structure of BP network SOC segment charging efficiency prediction model.
Batteries 10 00350 g009
Figure 10. Hyperparameter optimization space.
Batteries 10 00350 g010
Figure 11. Prediction accuracy score of hyperparameter configuration: (a) random and (b) Nguyen–Widrow.
Batteries 10 00350 g011
Figure 12. Under charging conditions of 0 °C _0.5 C, 0 °C _1 C, and 0 °C _2 C (a) predicted charging segment efficiency of the battery’s SOC based on the optimal neural network hyperparameter configuration; (b) relative error bar chart.
Batteries 10 00350 g012
Table 1. Division of neural network datasets.
Training SetTest Set
−20 °C_0.5 C, −20 °C_1 C, −20 °C_2 C, 0 °C_4 C, 25 °C_0.5 C, 25 °C_1 C, 25 °C_2 C, 25 °C_4 C0 °C_0.5 C, 0 °C_1 C, 0 °C_2 C
Table 2. Optimal efficiency prediction hyperparameter configuration.
Optimal Structure of Neural Network
Optimization algorithmScaled conjugate gradient
Activation functionSigmoid
Initialization methodRandom
Number of neurons8
Neural network structureFeedforward neural network
Disclaimer/Publisher’s Note: The statements, opinions and data contained in all publications are solely those of the individual author(s) and contributor(s) and not of MDPI and/or the editor(s). MDPI and/or the editor(s) disclaim responsibility for any injury to people or property resulting from any ideas, methods, instructions or products referred to in the content.

