Article

Evaluating the Aging-Induced Voltage Slippery as Cause for Float Currents of Lithium-ion Cells

Research Group Electromobility and Learning Systems, Technische Hochschule Ingolstadt, D-85049 Ingolstadt, Germany
*
Authors to whom correspondence should be addressed.
Batteries 2024, 10(1), 3; https://doi.org/10.3390/batteries10010003 (registering DOI)
Submission received: 15 November 2023 / Revised: 18 December 2023 / Accepted: 19 December 2023 / Published: 21 December 2023

Abstract

:
This paper provides a comprehensive exploration of float current analysis in lithium-ion batteries, a promising new testing method to assess calendar aging. Float currents are defined as the steady-state trickle charge current after a transient part. In the literature, a correlation to capacity loss was reported. Assuming the float current compensates for the voltage decay over time and is linked to calendar aging, effects from voltage slippery must be considered. The dU/dQ analysis suggests solely a loss of active lithium. Therefore, we investigate the solid electrolyte interphase (SEI) growth as the general aging mechanism to explain the origin of float currents. Our results show that the voltage slippery theory holds true within the low to middle test voltage ranges. However, the theory’s explanatory power begins to diminish at higher voltage ranges, suggesting the existence of additional, yet unidentified, factors influencing the float current. A shuttle reaction or lithiation of the cathode by electrolyte decomposition are the most promising alternative aging mechanisms at high voltages. The paper proposes a unique voltage slippery model to check for correlations between aging mechanisms, the float current test and the check-up test. For a better understanding, test strategies are proposed to verify/falsify the aging mechanisms beyond SEI.

1. Introduction

With the shift to electric vehicles and renewable energy resources, lithium-ion cells have emerged as one of the most important components in the field of energy. In recent years, lithium-ion cells have been used almost exclusively in electric vehicles as they have a high energy and power density [1]. The aging of lithium-ion cells, however, limits their life span and performance. The growth of solid electrolyte interphase (SEI), lithium plating and loss of active material [2] are generally considered as the most significant degradation mechanisms of lithium-ion cells. The aging is categorized in operation (cyclic aging) and the aging during storage (calendar aging). Regarding applications demanding longevity and premium cells, it is imperative to underscore that primarily calendar aging occurs, which makes the study of calendar aging particularly important [3]. Calendar aging is chiefly influenced by storage temperature and state of charge (SOC).
Excluding very high temperatures and cell voltages, the calendar aging of battery cells is characterized by capacity loss according to the loss of lithium inventory (LLI) and increase in internal resistance due the growth of SEI [4,5,6]. These parameters are measured traditionally through the periodically inserted check-up tests during a long-term storage test [7]. A check-up test normally consists in its simplest form of a capacity test and a pulse test to evaluate capacity loss and growth of internal resistance separately [8]. Ideally, this method can make a good diagnosis of the battery’s calendar aging when the influence of other factors is minimized.
However, capacity and resistance tests reach their limits for low aging rates at lower temperatures and cell potentials, as such experiments can take months or years to complete with only a few data points [6,9]. These inconveniences limit the speed and quality of the research for new materials. One possible solution is to raise the aging rate of the battery by increasing the stress factors temperature and/or cell voltage, which is already employed in most calendar aging tests. However, if the sweet spot of acceleration is surpassed, additional aging mechanisms [10,11], that do not occur under real life application, will be triggered, making modeling a challenge.
A promising alternative characterization method is the float current analysis (also known as voltage hold or potentiostatic hold test). Float current analysis is an innovative method to evaluate calendar aging of batteries proposed first by Lewerenz et al. [12]. This technique is based on the idea that the steady-state current measured under the constant cell voltage will solely return the pure loss of charge that is strongly correlated to loss of capacity or loss of active lithium [12]. Theiler et al. [13] evaluated the steady-state in a similar experiment using five Samsung 25R at different voltages each over two temperature profiles. A high correlation to the capacity fade rate was found.
The calendar aging at constant voltage or open circuit is regarded to have the same aging excluding very high temperatures and SOCs as demonstrated by Käbitz et al. [14] and Streck et al. [15]. Especially at high SOC, overcharging or soft short circuits potentially increase the aging in constant voltage phases [16].
Unlike traditional methods where the aging and the measurement are separated, the float current method attempts to measure the aging in the moment it occurs, reducing experimental time and providing the opportunity for a direct continuous measurement. According to the published papers, the measured float current consists of two parts, the reversible one in the beginning and the irreversible one after a reasonable amount of time [3,4]. However, the reversible and the irreversible part have their own dominant time periods [17]. Before reaching the steady-state, reversible effects like the passive electrode effect (anode overhang [18,19,20]) or electrode polarization dominate. Once the float current reaches a steady state, only irreversible degradation is reported. Irreversible losses include the loss of lithium inventory to the anode SEI, oxygen loss along with the formation of rock-salt in the cathode, as well as side reactions occurring at the cathode surface, and excessive consumption of the electrolyte [15]. The experimental findings of Roth et al. [21] suggested that when using voltage-based self-discharge tests, the estimates for anode overhang balancing were lower. By comparing this with data from early cell aging, it became clear that the self-discharge test results, taken right after the cell production, were influenced by this anode overhang balancing.
According to Lewerenz et al. [12], the steady-state float current and the capacity decay rate of the battery return similar values or at least trends. However, Schulze et al. [22] proposed that the float current under potentiostatic conditions is not necessarily equal to the capacity loss rate, as the recharge current needed to compensate the measured float current is originally caused by the voltage slippery due to aging [5]. The shift of the half-cell voltage curves of the anode and cathode (voltage slippery) leads to a decrease in the full-cell potential, which in turn results in a recharge current. The change caused by voltage slippery due to the shift of the anode curve makes the recharge current of the full-cell potential and capacity decay rate due to SEI not necessarily equal. According to Schulze’s theory, the relationship between the two is related to the scaling factor between the voltage slopes of half-cells and a reasonable SEI formation is only measurable in case the cathode slope is close to zero.
The scope of this paper is to prove or disprove the voltage slippery theory by simulating the influence of the change in full-cell potential induced by anode aging on several commercial lithium-ion battery cells of different types and cell chemistries. Anode aging is primarily associated with a loss of active lithium typically associated with SEI. The fitted data will be further compared with the experimental data to analyze the deviation of the theory from experiments. Possible further aging mechanisms are lastly presented in order to explain possible deviations. First, the measurement procedure and the commercial cells used are described in Section 2. The results are then presented in Section 3 with a special focus on the model for the evaluation of the aging-induced voltage slippery theory and possible origins of the measured float current.

2. Materials and Methods

The tests are performed on three different types of commercial cells as listed in Table 1.
The cells are tested using a 0–5 V/5 A LBTa2030 battery-cycler from Arbin Instruments. The cells are situated in an ACS temperature chamber (DY110) during the float procedure and are initially and intermediately characterized by a check-up. We used the same check-up procedure already presented by Theiler et al. [13]. We evaluated the pulse test at 100% SOC and the capacity test performed at a low C-rate, which is used also for the differential voltage analysis (DVA). The cells were floated at different voltages as mentioned in Table 1, and each float voltage was examined with one dedicated cell. The float procedure consists of a long constant voltage phase after the initial check-up at 30 °C. The voltage hold is obtained by specifying a maximum low current range of +/−1 mA that the cycler should not exceed. The output current during the constant voltage phase is evaluated and corresponds to the float current. The cell voltages with three decimal places represent the cells floated at their initial/storage voltage. The cells underwent a specific test procedure, that is presented in Figure 1.
Every 30 days, the float phases were interrupted by a check-up. Finally, a specific temperature profile concludes the test procedure. The idea of varying temperature is to understand the temperature effect on the float current. This section is greyed out, because there were no check-ups performed, and the scope of the temperature section is to be published separately.

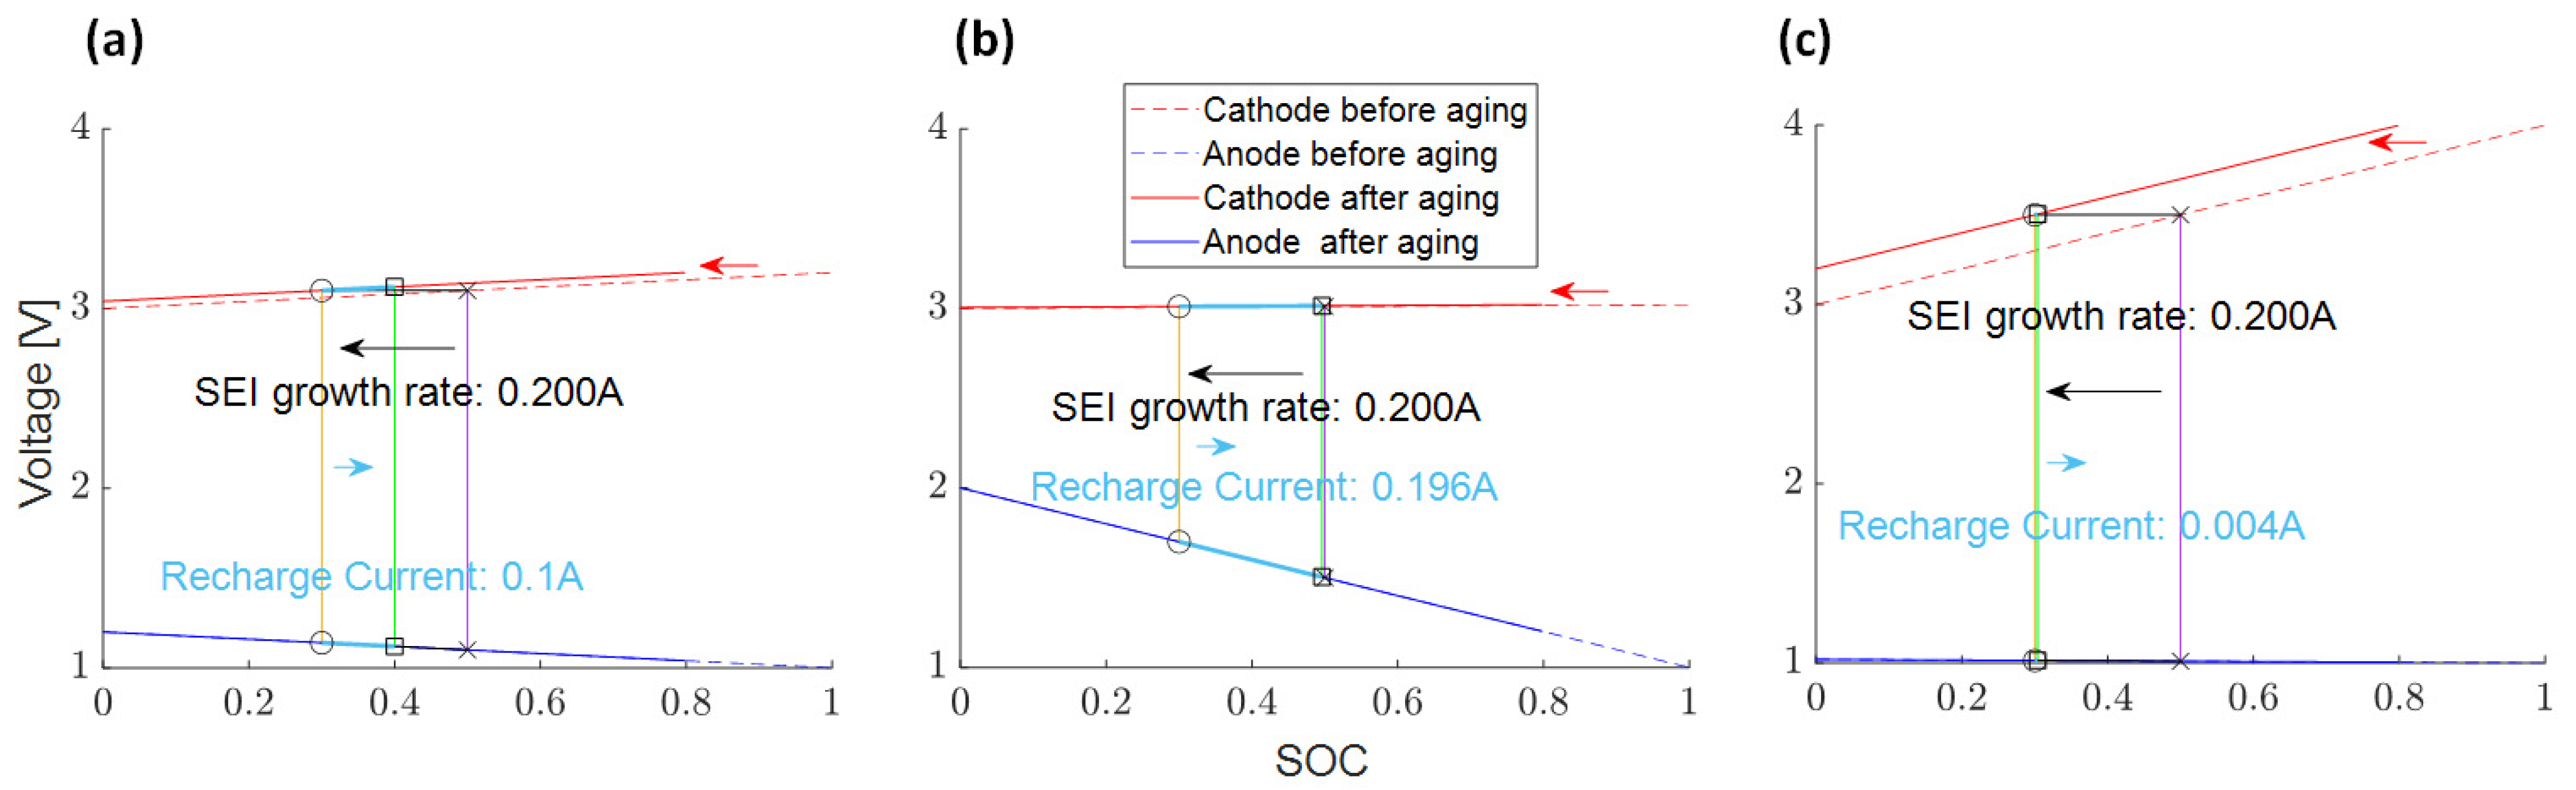
Recharge Current Induced by Voltage Slippery and SEI Growth

It is essential to acknowledge that calendar aging effects on lithium inventory are deeply intertwined with SEI. Therefore, the SEI growth on the anode is the focus point of this subsection in terms of the primary aging mechanism causing LLI. We thus assume continuous SEI formation by passivating active lithium on the anode leading to a decreasing full-cell potential [23]. This voltage decay is supposed to be recharged with the float current. In this case, the measured float current can be fully explained by voltage decay due to voltage slippery caused by SEI; the origin of the float current is SEI formation. To understand how SEI formation leads to voltage decay, we will demonstrate our theory by considering simplified anode and cathode potential curves in the following.
According to the theory and experimental results by Schulze et al. [22], the increase in SEI growth rate would not lead to a larger recharge current if the slope of the cathode voltage is non-zero. In a first step, we assume that the steady-state float current is roughly equal to the SEI growth rate. However, the influence of SEI loss on the recharge current depends on the interplay between the voltage curves of the battery cell’s two electrodes. The details of this process will be illustrated in the following figure.
Figure 2 shows two hypothetical electrodes with simplified linear voltage profiles. The x-coordinate is the SOC of the full cell. The blue lines represent the anode voltage curves and the red lines the cathode voltage curves. The dashed curves refer to the electrode before aging and the solid curves for the electrode after aging, respectively.
To simplify, we split the floating part into two phases: a voltage decay attributed to SEI formation and the subsequent recharge current essential to sustain a constant cell voltage. It is important to note that these two processes—voltage decay from aging and recharge—happen concurrently. For the sake of illustration, we will first consider a specific voltage drop caused by aging. After that, we will calculate the recharge current needed to achieve a consistent voltage again. In the first step, the anode loses lithium to the SEI layer with a current I S E I   growth and, with this, the anode voltage increases following the black arrow. In this step, there is no current flowing in the external circuit and the cathode’s lithiation remains unchanged. Fixing the position of the anode curve, the cathode voltage curve needs to be shifted to the left to match the actual lithiation states of the anode and cathode. The red arrow shows the new state after aging. The increase of anode potential and the remaining cathode potential together result in the decrease of the full-cell voltage.
In the second step, the cell is recharged to keep the voltage constant with the current I R e c h a r g e . Under the potentiostatic condition, due to the voltage decrease, the cell will be recharged until the full-cell voltage is equal to the hold voltage as it is shown by the two light blue arrows. The yellow line represents the decreased voltage after aging, while the purple line corresponds to the hold voltage before aging and the green line to the same hold voltage after recharge.
The loss current I S E I   growth in the first step is higher than the recharge current I R e c h a r g e in the second step. From the geometrical relationship in Figure 2, the following equation can be deduced:
I R e c h a r g e I S E I   g r o w t h = k A n o d e k F u l l   c e l l   = k A n o d e k A n o d e + k C a t h o d e = 1 1 + k C a t h o d e k A n o d e
where k F u l l   c e l l is the full-cell voltage slope and k C a t h o d e and k A n o d e refer to the slope of the cathode and anode voltage curves respectively.
It agrees with the equation that the group of Schulze [22] derived from a physical point of view. It shows that the float current is not equal to the capacity loss rate due to SEI growth in all cases depending strongly on the scaling factor resulting from the anode and cathode slope. The dependency of this relation is shown in Figure 3 for three examples The purple arrow represents the hold voltage points between the anode and cathode voltage curve before the SEI growth, represented as a black arrow. The yellow arrow represents the decreased voltage of both electrodes after the SEI growth. The green arrow represents the new hold voltage points of the anode and cathode after the recharge current, represented as light blue arrow. When the cathode and anode have the same slope value, the recharge current is exactly half of the SEI loss capacity rate as the potential loss is occurring only on the anode while the recharge takes place on both electrodes (Figure 3a). If the anode has a larger slope, the recharge current is quite close to the SEI loss rate as the additional contribution of the cathode during recharge is negligible (Figure 3b). If the cathode slope is significantly larger than the anode slope, the SEI formation leads to hardly any recharge current as the formation of SEI on the anode has hardly any effect on the full-cell voltage (Figure 3c).
In summary, to investigate the voltage slippery effect on float currents, it is essential to determine the voltage slopes of both the anode and cathode, as well as the SEI loss rate, or at least have an estimation of them.

3. Results and Discussion

The float current is used for the analysis of calendar aging. Avoiding reversible effects at the beginning, especially the anode overhang effect, we consider data only from 60 days on. In this way, we measure only the irreversible capacity fade.
At first, we present the evaluation of standard capacity tests and compare the results to the float current to check for potential correlations. In the following sections, we will search for the origin of the float current by comparing it with voltage slippery theory induced recharge current.

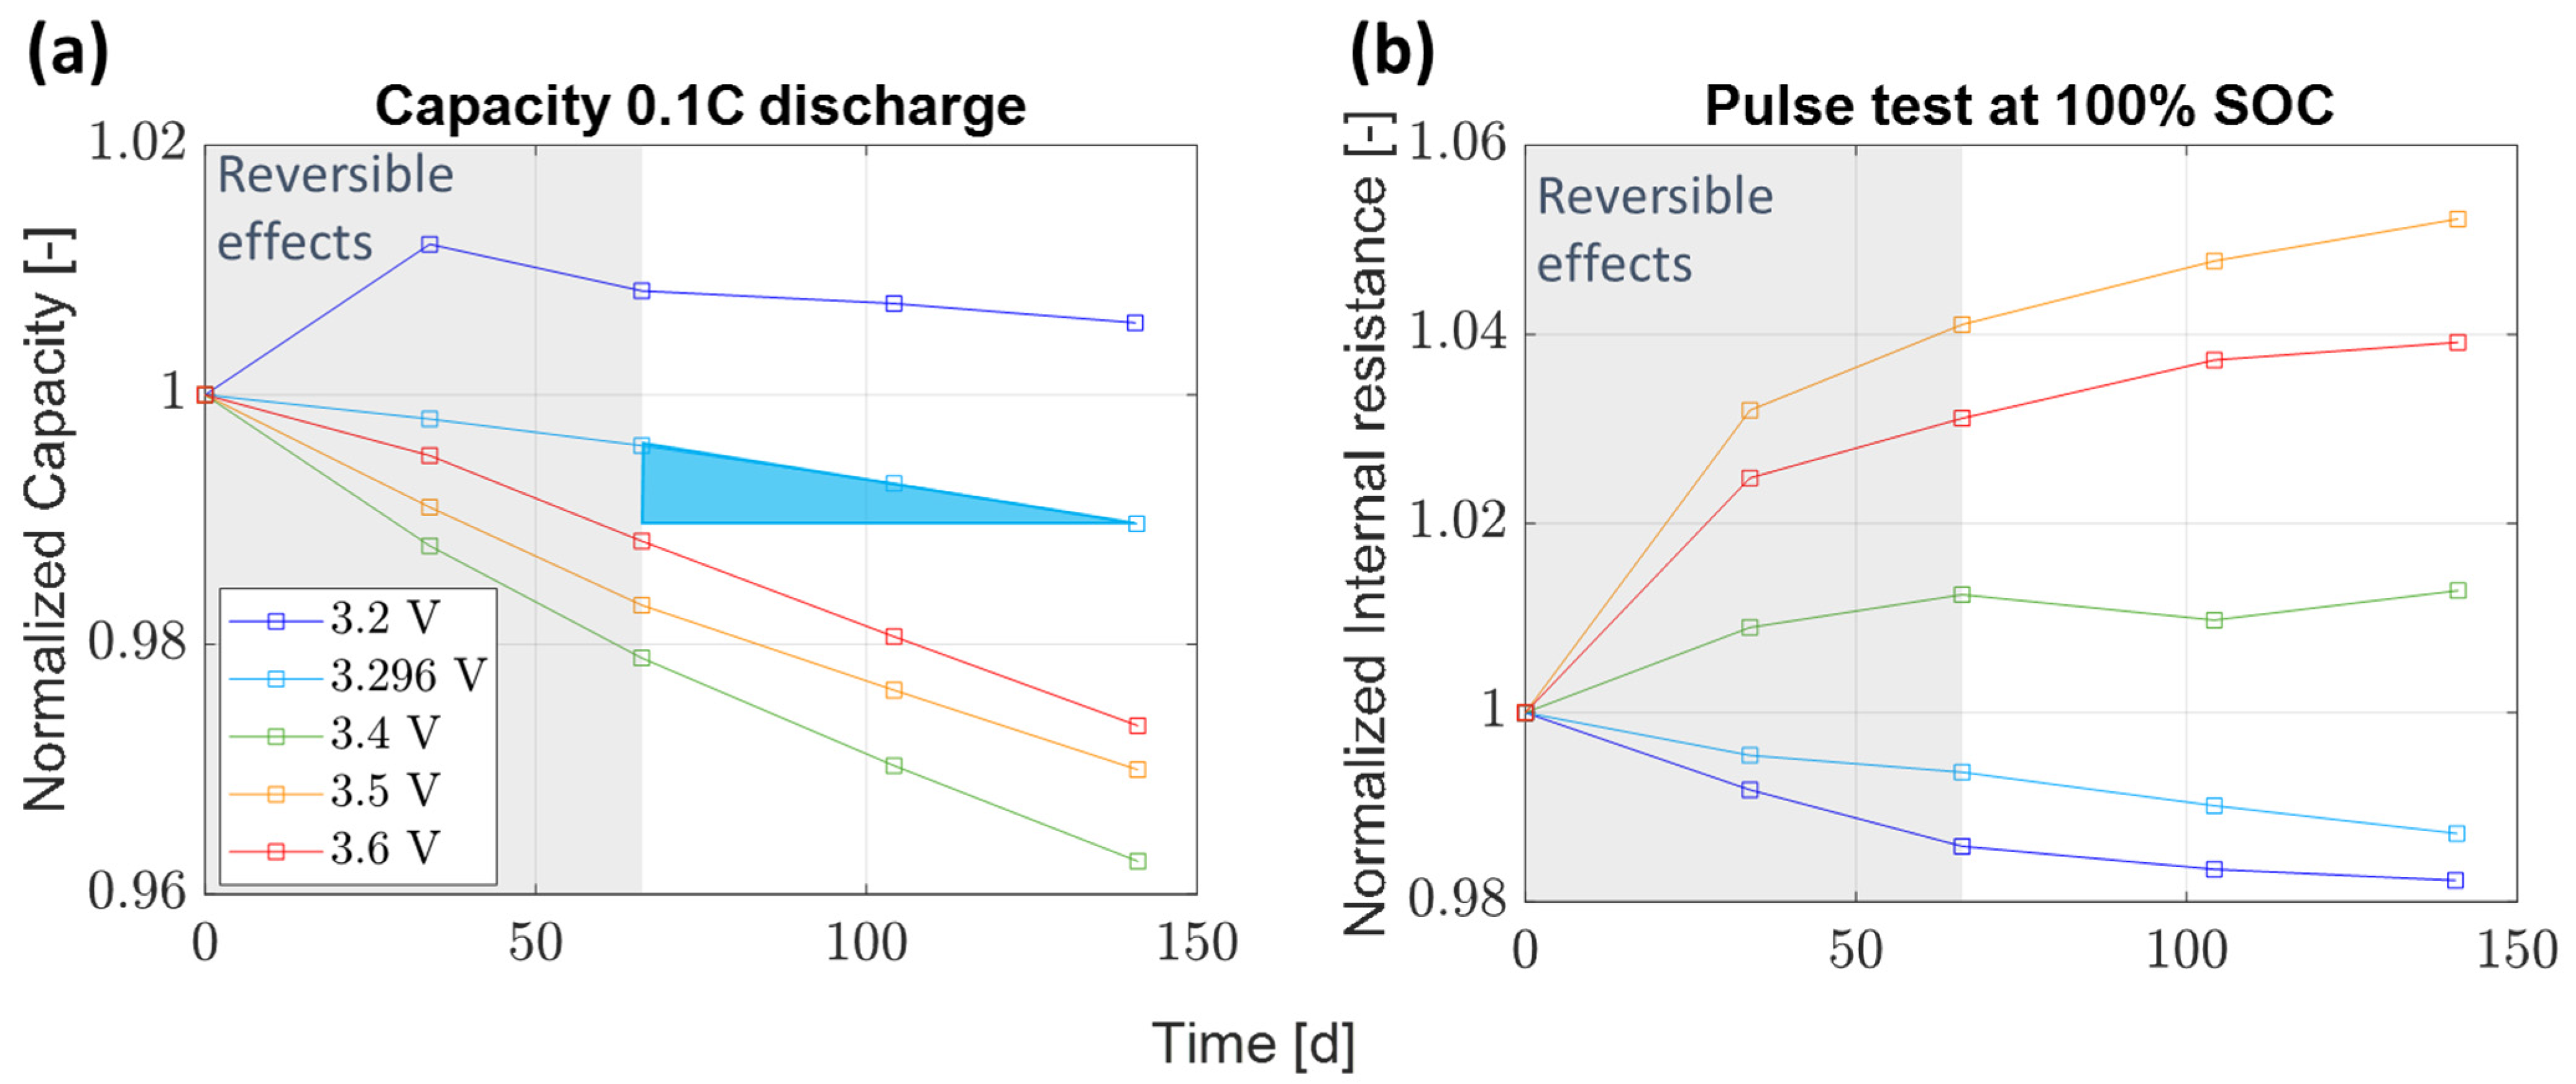
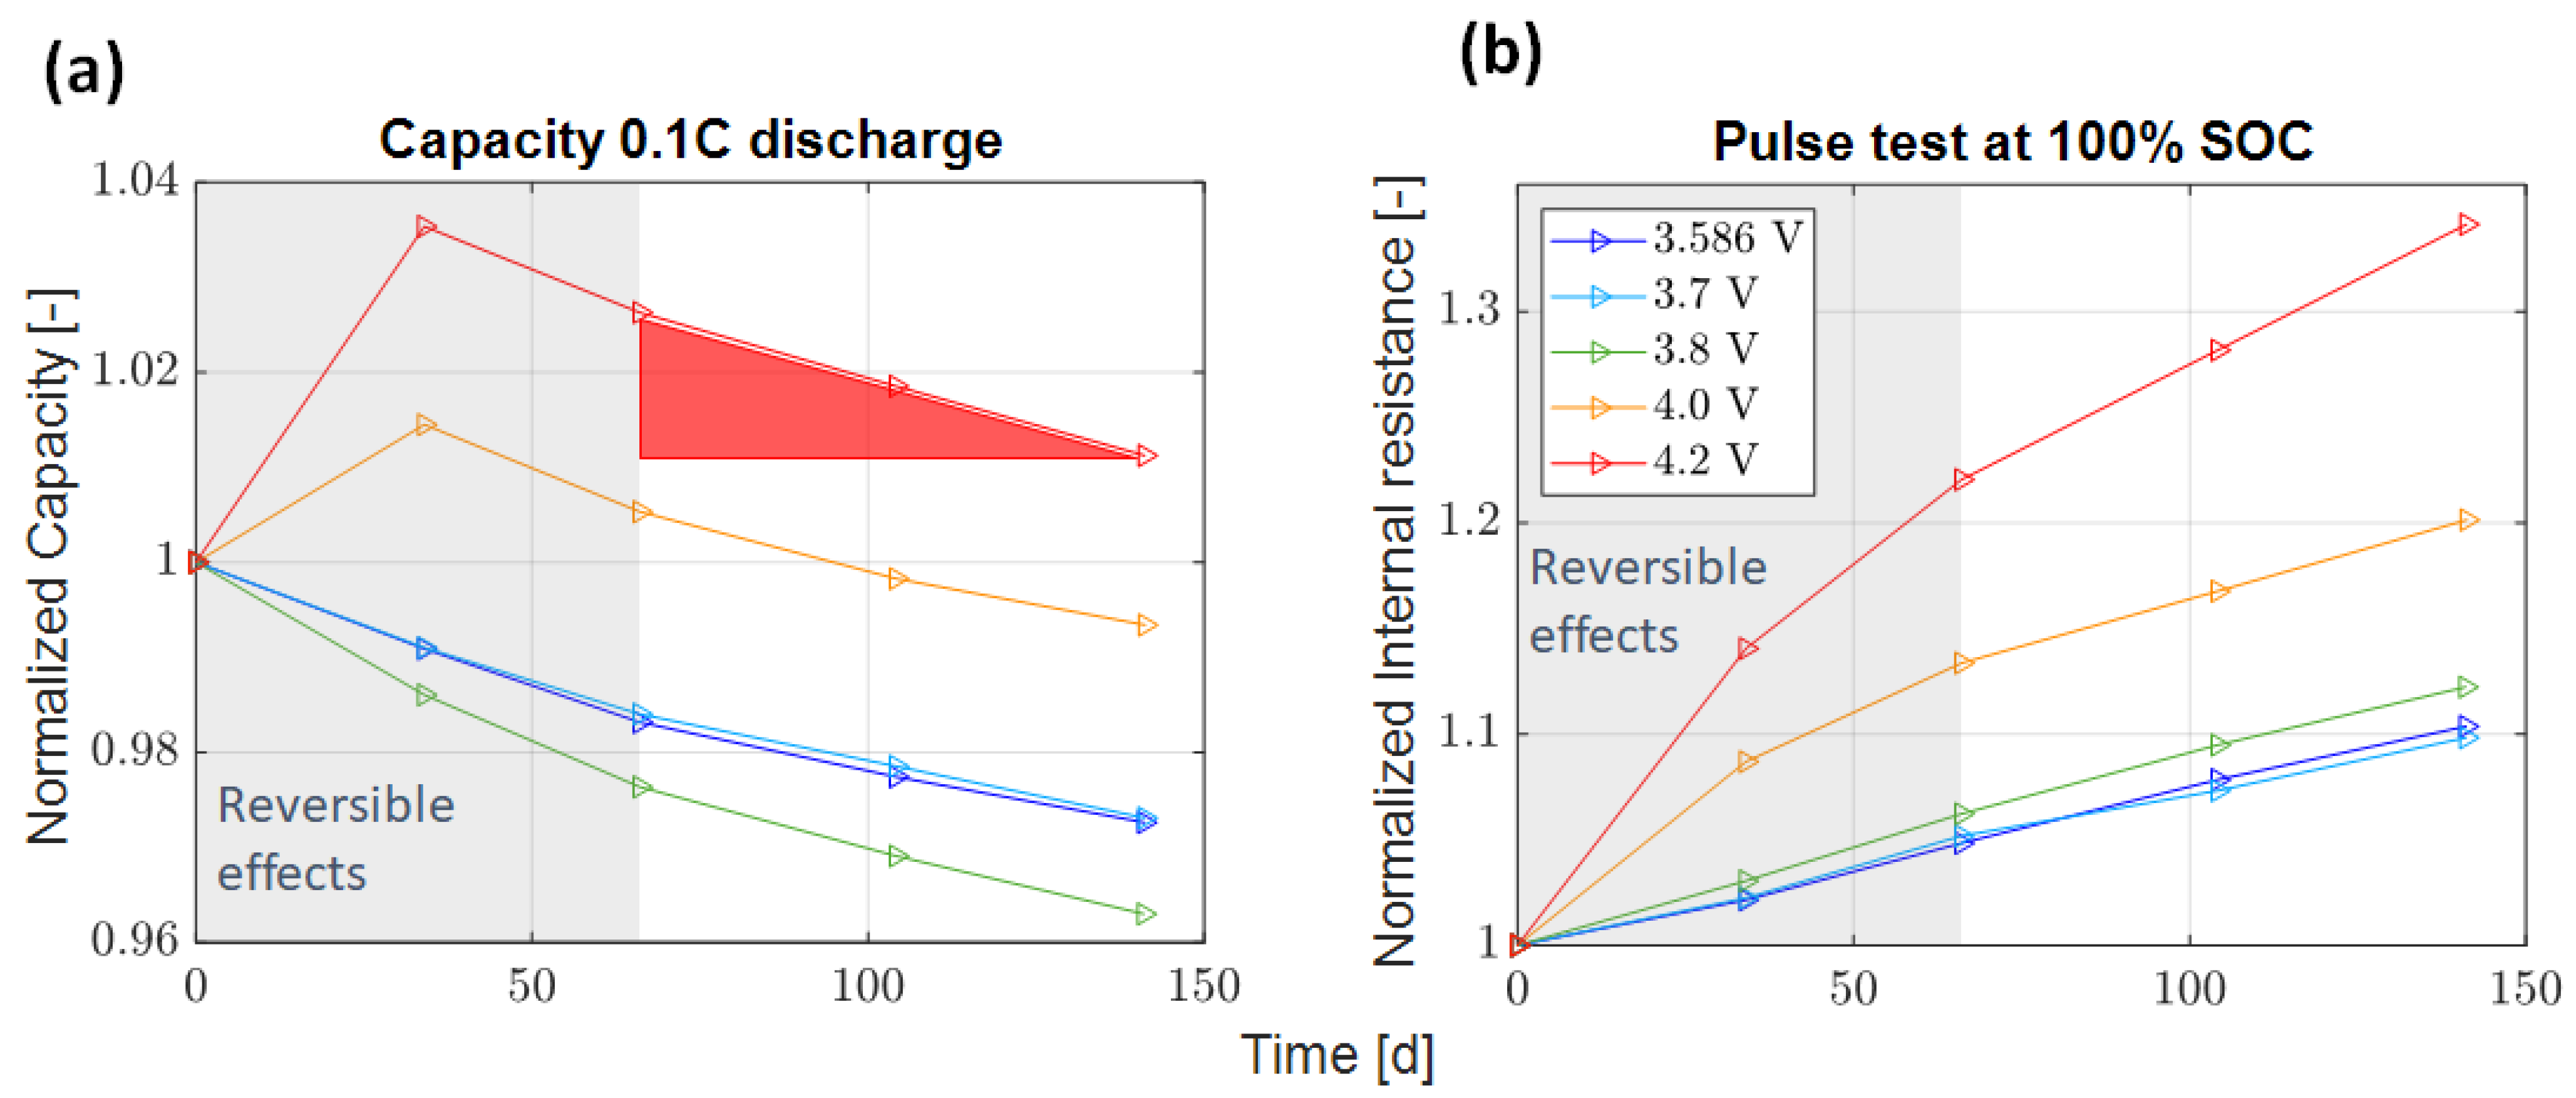
3.1. Capacity Loss Rate and Pulse Resistance

Figure 4 shows the capacity and internal resistance trends measured by check-ups interrupting the float current tests as reference for the A123. In the beginning, the influence of the anode overhang effect is observable. At 3.2 V, an increase even above 100% is measured as here the influence of the overhang effect becomes positive. At 3.296 V, the cell was delivered and no effect from anode overhang is expected. Consequently, a linear trend is visible throughout the test. For higher voltages, higher initial losses are anticipated. However, this is only observed for 3.4 V, while for 3.5 V and 3.6 V this is not the case. A clear reason for this behavior is not known to us. After the influence of the anode overhang diminishes, the trend from the third to fifth check-ups behaves linearly and represents the irreversible capacity loss highlighted with a blue slope triangle. The pulse resistance also exhibits a transient part during the first 60 days that changes to a linear trend afterwards. While a negative trend is apparent for 3.2 V and 3.296 V, the resistance is rising for the higher cell voltages. Unintuitively, the 3.6 V cell has less resistance increase than 3.5 V. The reason is not clear to the authors and cannot be explained as there is only one cell per test condition.
The evaluation of the PAN cell is given in Figure 5. Within the first 30 days, a capacity gain is observed for the cells at 4.0 V and 4.2 V (Figure 5a). This is not the case for the remaining voltages lower than 4.0 V. An anode overhang effect would only lead to a capacity gain if the storage SOC is lower than the SOC the cell is delivered at [17]. Therefore, there must be other mechanisms causing the increase in capacity and smaller capacity loss at high voltage conditions. Similar to the A123 cell, the internal resistance in Figure 5b increases with higher voltage while the capacity loss at 4.0 V and 4.2 V exhibit smaller values.
Figure 6 shows the (a) capacity change and (b) internal resistance change measured by check-ups during the float current test for the SAN cell type. Like the PAN and A123 cells, the internal resistance of the SAN cell increases with higher voltage (except 3.7 V, the reason for the resistance decrease is unknown) while the capacity loss at 4.0 V and 4.2 V exhibits a smaller value. There is a small difference in the change of internal resistance between both SAN cells at 4.2 V. This difference, while not significant, can be attributed to cell-to-cell variations. Nonetheless, the overall trends observed in both cells for capacity change and internal resistance differ from those in the remaining cells. This distinct pattern validates our measurements.

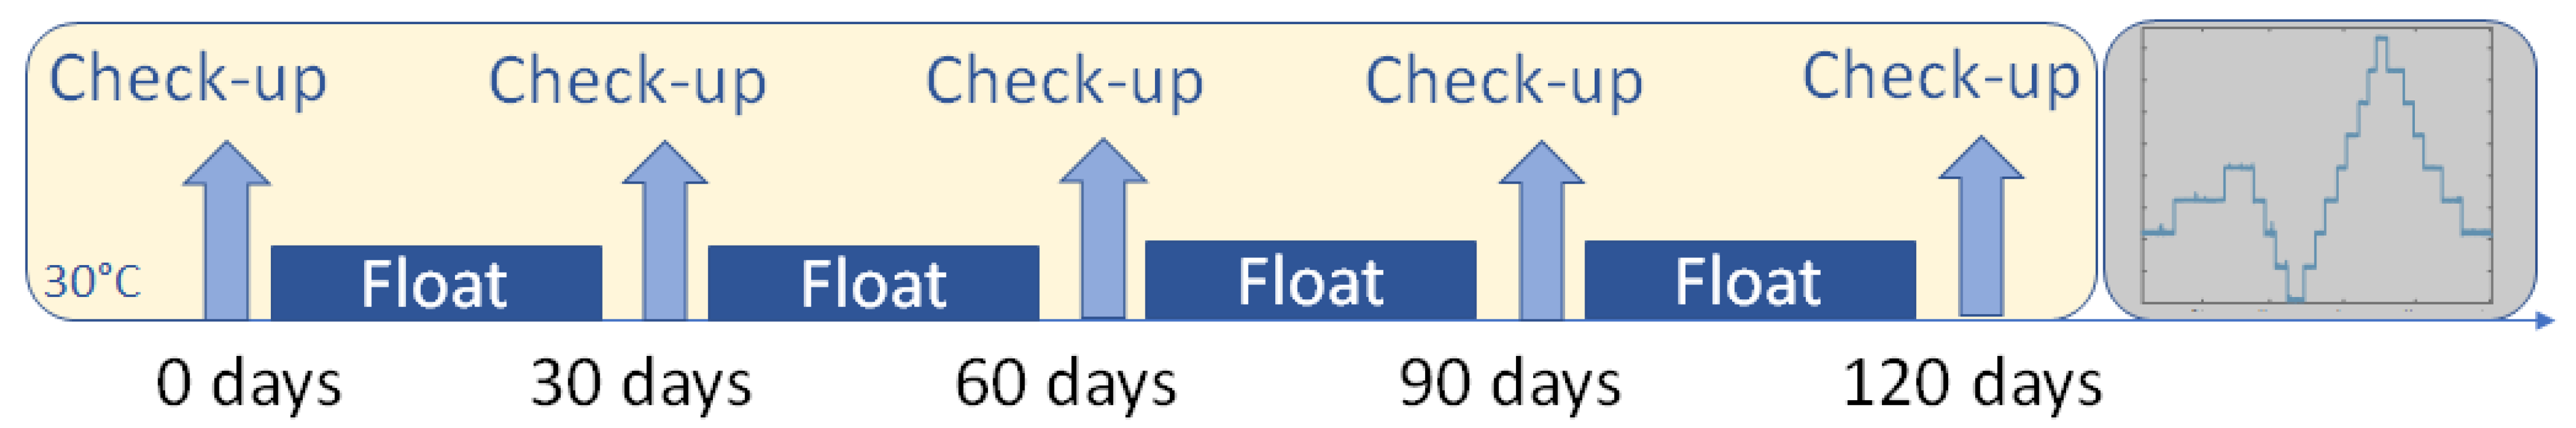
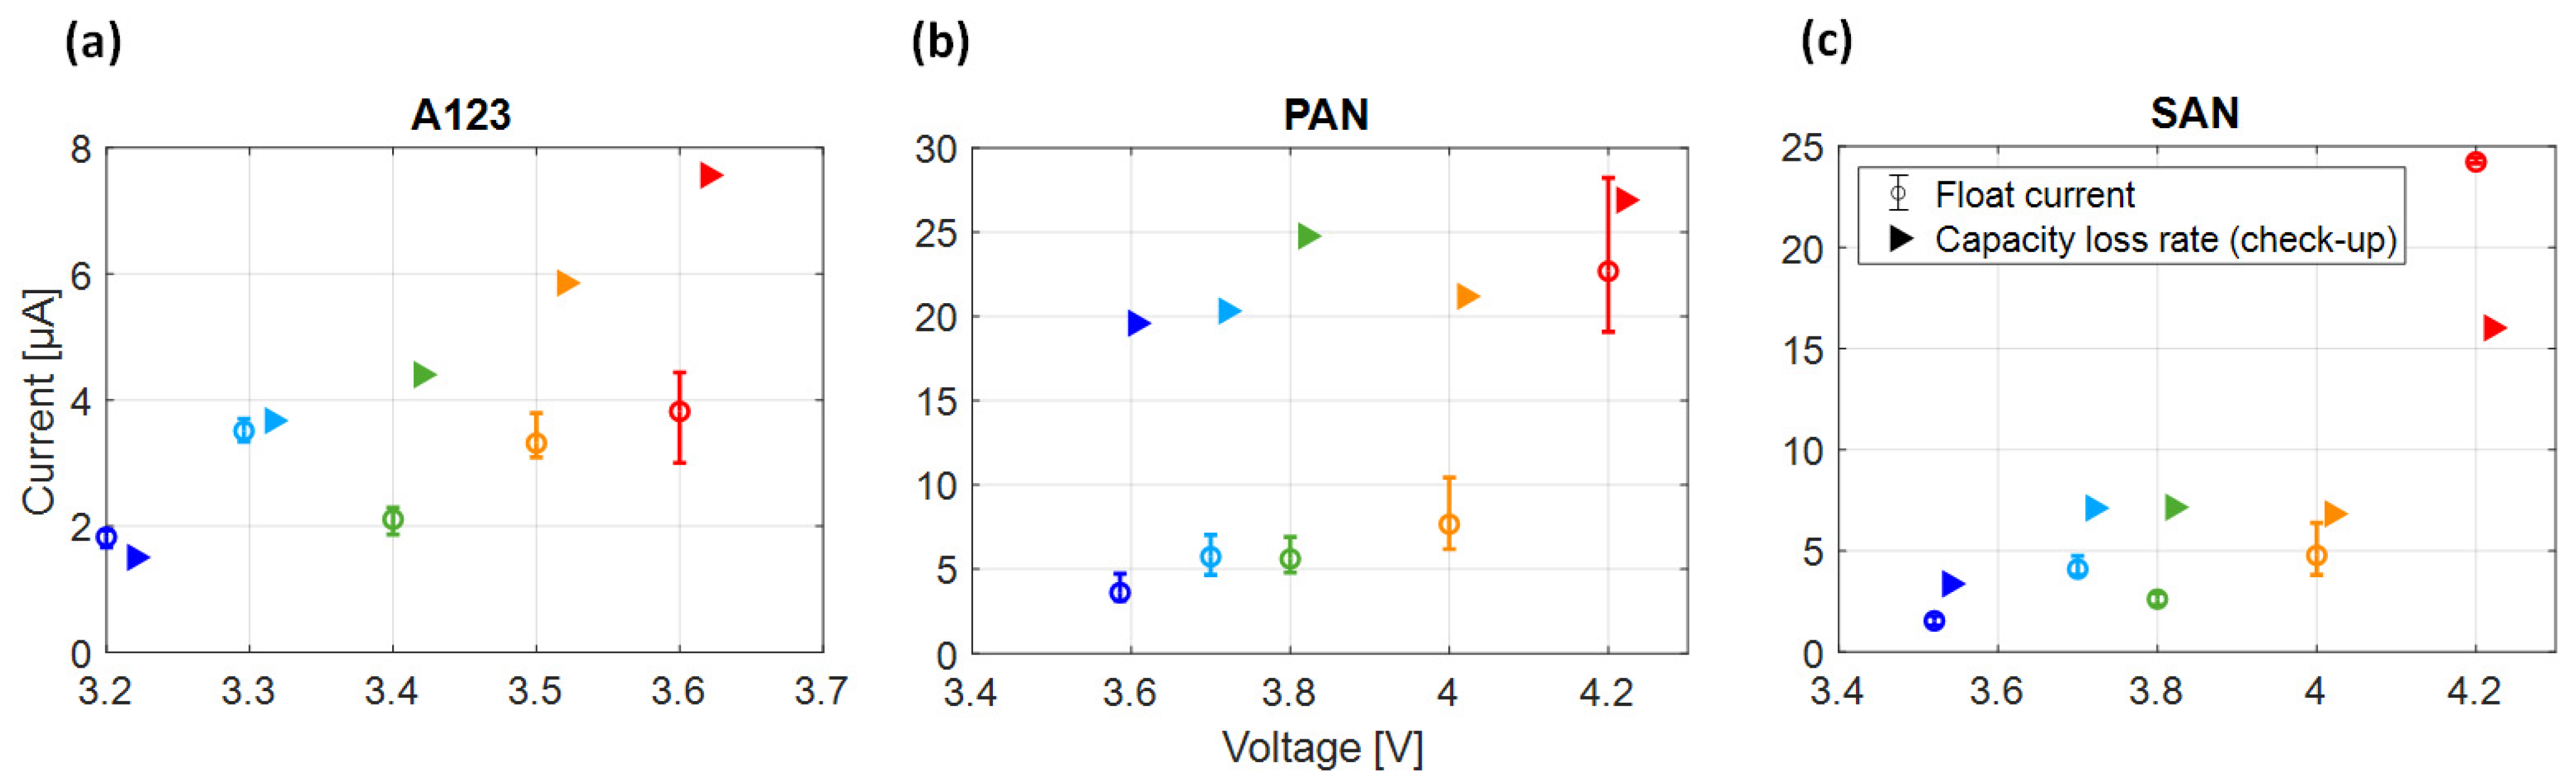
3.2. Correlation between Float Current and the Capacity Loss Rate in Check-Ups

For a better understanding of the float current, a comparison between the steady-state float current as well as the capacity fade of the check-up interruption before and after the float periods is performed. The measurements of the float current and the trend over time are published and discussed in [17]. For the comparison with capacity loss rate, the float current value and error bar values are plotted from 60 days onwards. The error bars highlight whether there are constant or settling values by giving the maximum and minimum values measured in that period. For the capacity loss rate, simply the slope from 60 days on is calculated, which is sketched in Figure 4a.
Figure 7a–c show the results for the steady-state float current and the capacity loss rate of the three cell types. By taking the capacity change between day 60 and day 120 and dividing it by the time difference of 60 days, we derive the current from the capacity loss rate, which corresponds to the calendar aging. In some cases, a high correlation is visible and in others, there are significant deviations between float currents and capacity loss rates. A123 shows a good correlation with respect to low voltages while from 3.4 V on, a significant deviation is measured between the float currents and the capacity test. For PAN the correlation is worse for voltages lower than 4.2 V. Large error bars indicate a non-constant float current that typically fades over time as is the case for PAN 4.1 V and 4.2 V (see already published data [17]). This is associated with the reduction of the active area, which will be the scope of upcoming research. For the SAN, a more pronounced difference is observed at 4.2 V compared to lower voltages. It is crucial to note that upon reaching 60 °C, the cell exhibited a continuous soft short circuit in the range of 10–20 mA, necessitating the termination of the cell test. This anomaly is likely attributable to an overcharge of the cell. During a standard constant current – constant voltage (CC-CV) charge, the open-circuit voltage (OCV) approaches 4.1 V (⇔100% SOC). Consequently, 4.2 V might surpass 100% SOC.
To sum up, we observe at this stage only a part correlation between steady-state float current and capacity loss rate and for some test cases strong deviations. Except for SAN 4.2 V, all capacity loss rates are equal or higher than the measured float currents.

3.3. SEI Growth as the Main Calendar Aging Mechanism

In calendar aging, according to the literature, the main influence on the battery capacity especially at lower aging conditions is LLI caused by SEI growth on the anode side [4]. Therefore, the capacity decay measured by the check-up is generally linked to SEI growth on the anode side [24]. In DVA, peak detection provides insights into aging effects. These effects are associated with the loss of active material (LAM) on either the anode or cathode, or with LLI [25,26].
The DVAs of the A123 at different float voltages during charging are given in Figure 8. They show an overall similar shape in all states and in all peaks, except for the last peak during charging. As mentioned by Vermeer et al. [27], the DVA curve characteristics of the full cell are caused by the DVA curve characteristics of the anode and the cathode, respectively. Peaks PA,1 and PA,2 are associated with the anode, whereas peak PC is linked to the cathode. With the help of PA,1 and PA,2, the anode capacity (CA) is calculated. As for the determination of capacity of LLI (CLLI), the anode peak PA,1 as well as the cathode peak PC are required.
The features retain their shape throughout aging, suggesting a consistent lithium distribution and uniformly distributed aging across the electrode area. Notably, there is no observed loss of active material in the anode, as evidenced by the consistent distance between its two characteristic peaks. In contrast, the cathode remains relatively flat, showing a pronounced voltage increase only at the end-of-charge. Therefore, no definitive conclusions can be drawn about the cathode’s active material. However, a noticeable shift of the cathode curve to the left, attributable to voltage slippery, indicates LLI [28]. Based on DVA results, our initial approach is to consider SEI loss on the anode as the main aging mechanism. SEI loss increases with higher temperature, and cell potential [29,30].
For the PAN cell, Figure 9 shows the change of the DVA curve of the cell during the float current test. The characteristics of the curve in the range of 2.0–3.2 Ah shifts to the left as the battery ages. This is related to the LLI on the anode side, which will lead to the left shift of the cathode DVA curve. CLLI is then calculated by means of the first anode peak PA,1 and the second cathode peak PC,2. At 0.5 Ah (PA,1) and 1.9 Ah (PA,2), the DVA curve of the full cell has two peaks, respectively. These two peaks originate mainly from the anode.
Figure 10 shows the results for the SAN cell. For values larger than 1.3 Ah (PA,2), the full-cell curve shifts to higher slopes during the aging process, which is caused by the shift of the cathode to the left due to the SEI growth. The peak at 0.3 Ah (PA,1) remains basically unchanged, indicating that the DVA curve of the cathode in this part is quite flat. In general, both the SAN and PAN show a very similar DVA course change as the A123. The difference lies within the cathode material and thus the number of peaks detected. Nevertheless, the shift appears significantly in the last peak, which is associated with SEI growth. With that, the SEI growth is assumed to be the main aging mechanism based on the analysis of the DVAs.

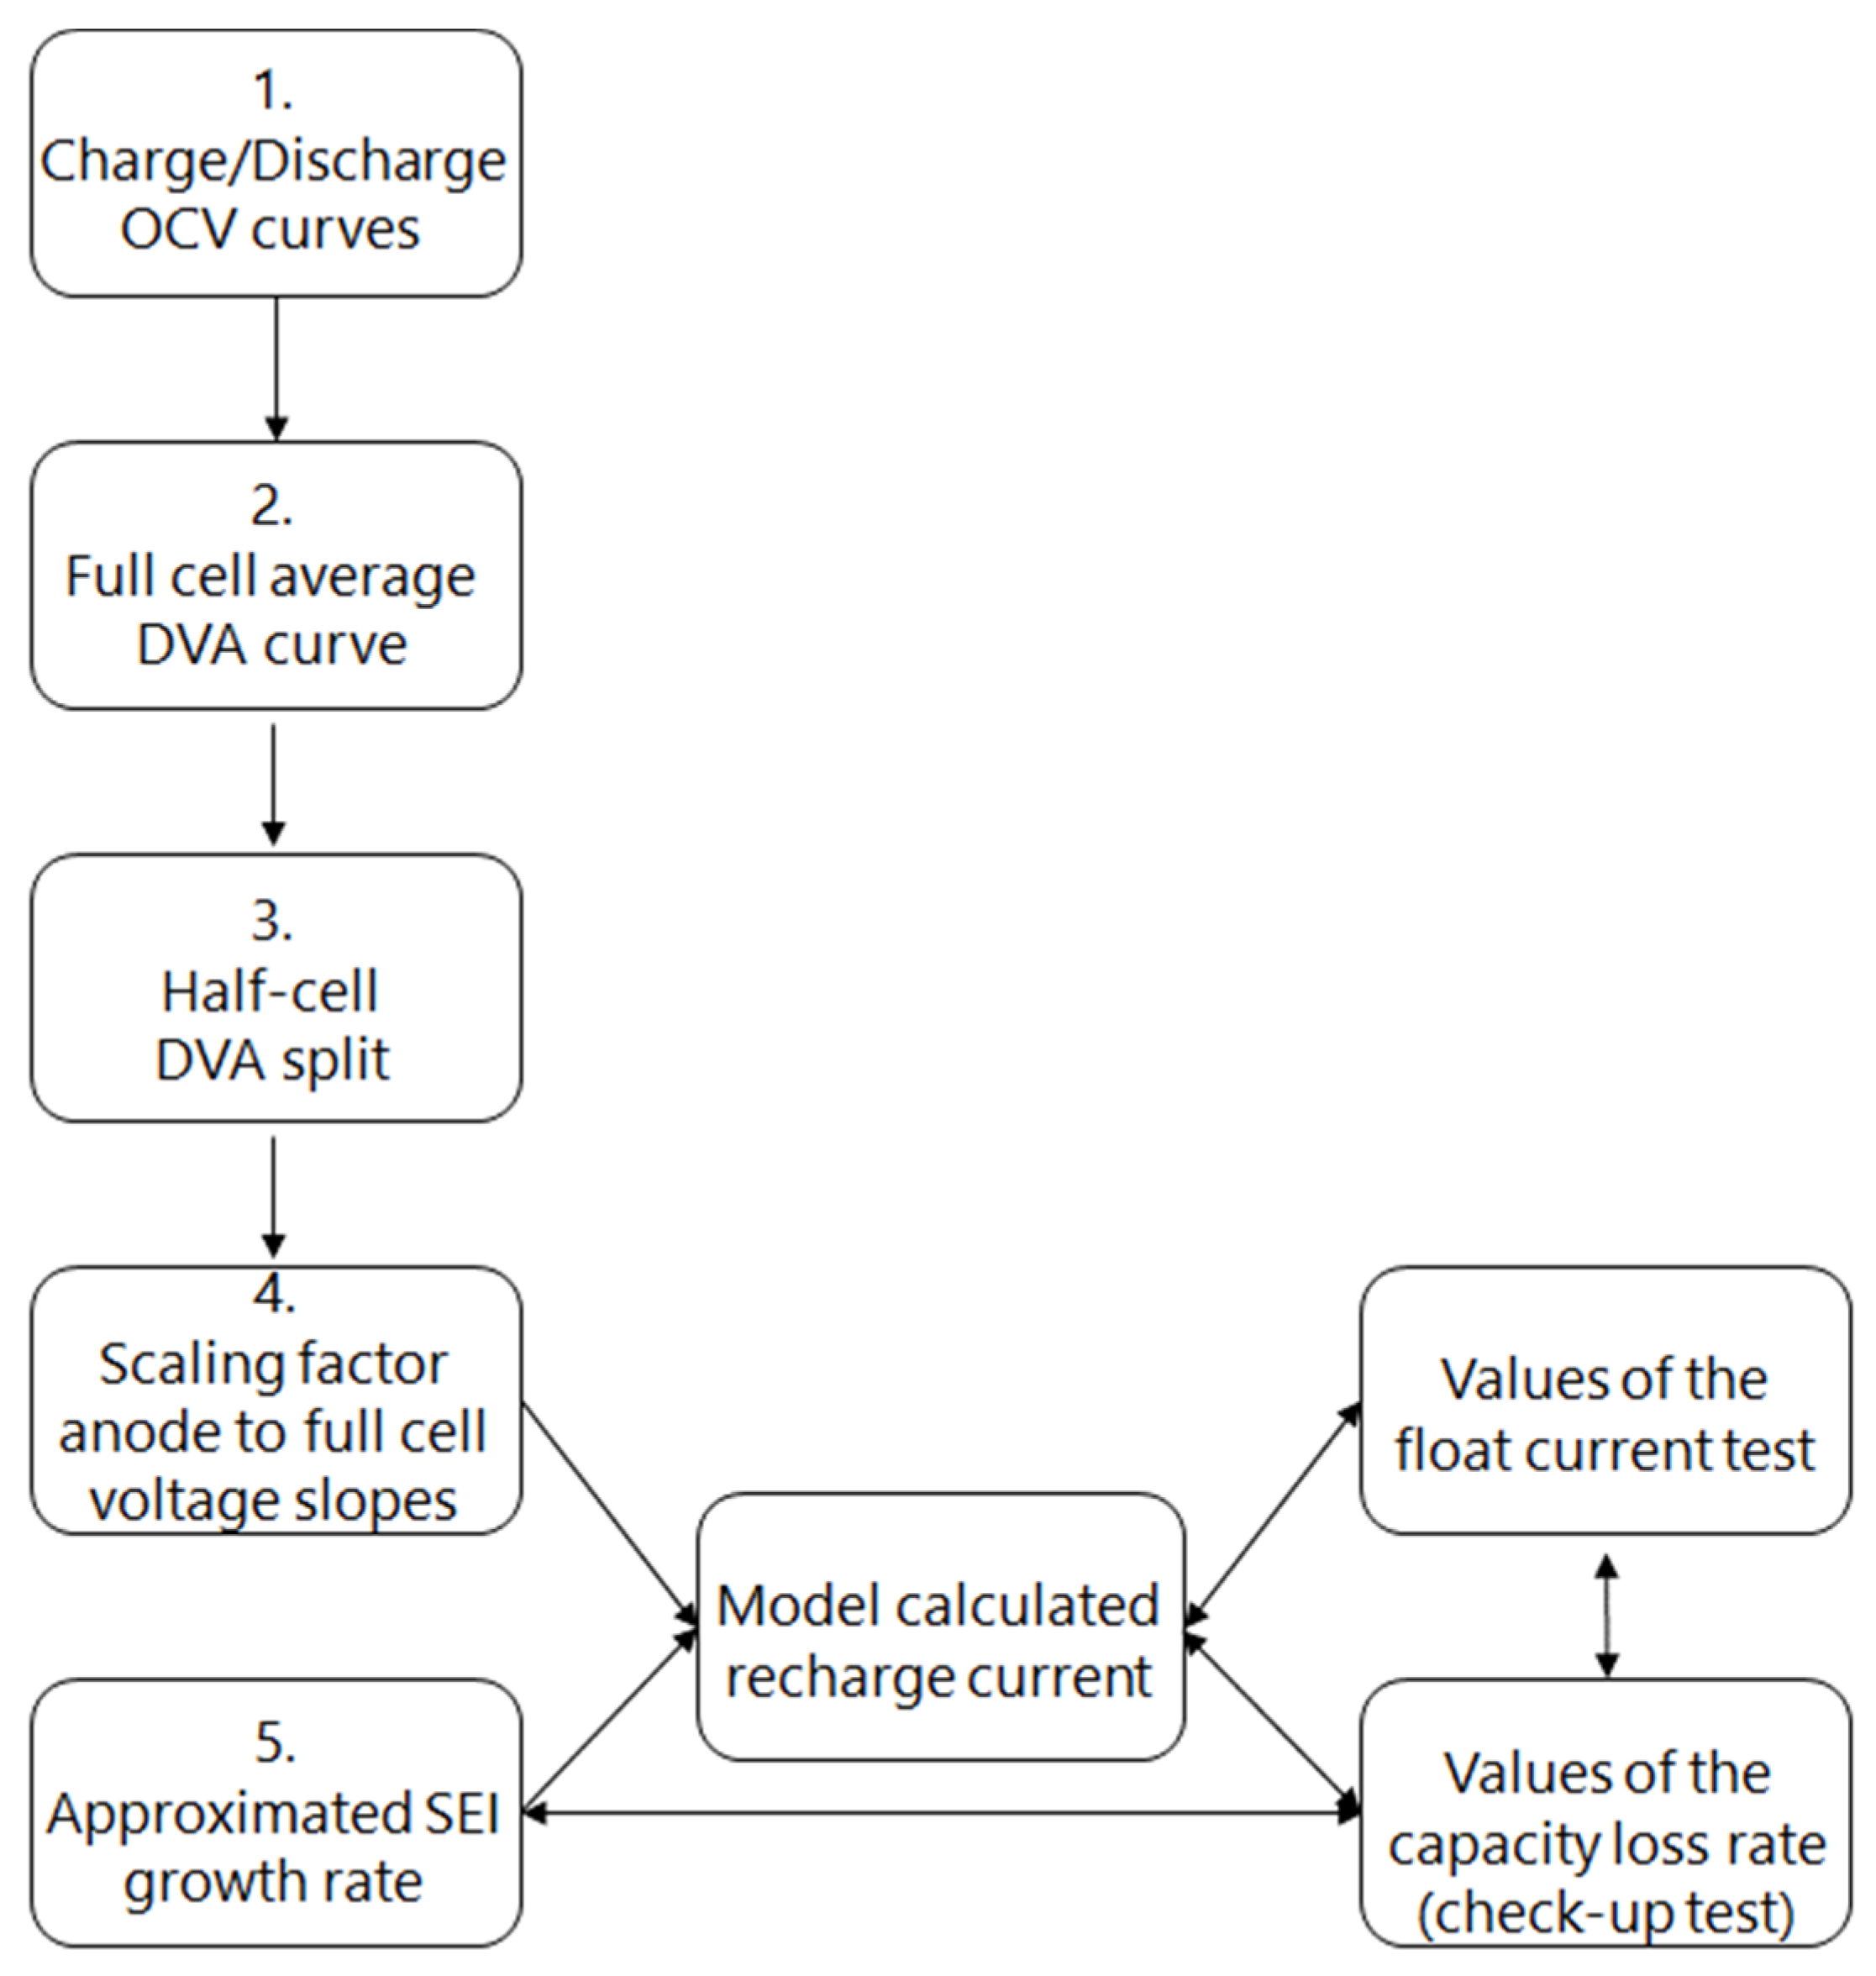
3.4. Model Development for the Voltage Slippery Application

For the validation of the voltage slippery theory, a voltage slippery model is developed in MATLAB2022 to apply the theory related to SEI growth on the three different commercial batteries mentioned in Table 1. Therefore, we need the steady-state float currents and the capacity loss rate from previous sections as input. To vary the slope scaling factor of the anode and cathode, the tests were performed at different cell potentials. The SEI formation rate is varied as well by cell potential, and additionally, by temperature.
According to Equation (1), the voltage curves of the two electrodes of the battery need to be obtained to calculate the recharge current at a given SEI growth rate. Since we investigated commercial batteries without a reference electrode, we adopted a theoretical analysis method to split the DVA curve of the battery full cell into the DVA curves of two half cells. With the help of the split, the voltage curve of each electrode can be calculated separately. The specific steps are shown in Figure 11.
In the initial step, we measure the OCV of the full cell using the galvanostatic intermittent titration technique (GITT) during charge and discharge, which will be presented in Section 3.4.1.
The OCV curve needed as input for the model is obtained by taking the average value of the charge and discharge curves. By deriving both voltage curves and obtaining the DVA for charge and discharge, both DVAs are compared with respect to the x-position of the characteristic features. In case the features appear at the same x-position, an unwanted shift of the anode to cathode curve can be excluded and the average of both curves is feasible to calculate.
In a second step, the full-cell curve is split into a cathode and anode curve using an educated guess method explained in Section 3.4.3. Therefore, the rough curve shape is obtained from half-cell measurements and is verified by the voltage slippery caused solely by LLI as it is shown in Figure 8, Figure 9 and Figure 10. A dedicated MATLAB program, developed in our group, is used to make the educated guess and to check its validity.
In a third step, the scaling factor based on the anode and cathode slope is calculated:
s c a l i n g   f a c t o r = 1 1 + k C a t h o d e k A n o d e
From this, we deduce the slope of the anode in relation to the slope of the full cell. Next, the numerical value for the rate of SEI growth depending on SOC is estimated from the capacity loss rate obtained from the experimental data of check-ups or if not fully available, from related experimental data published in the literature.
With a simple transformation of Equation (1), Equation (3) is derived:
I R e c h a r g e = s c a l i n g   f a c t o r   · I S E I   g r o w t h
Now we are in the position to calculate the expected recharge current and can compare our results with the measured float currents. The detailed steps of the procedure will be demonstrated mainly for the A123, while the figures of the PAN and SAN cells are to be found in Appendix A.1 and Appendix A.2, respectively.

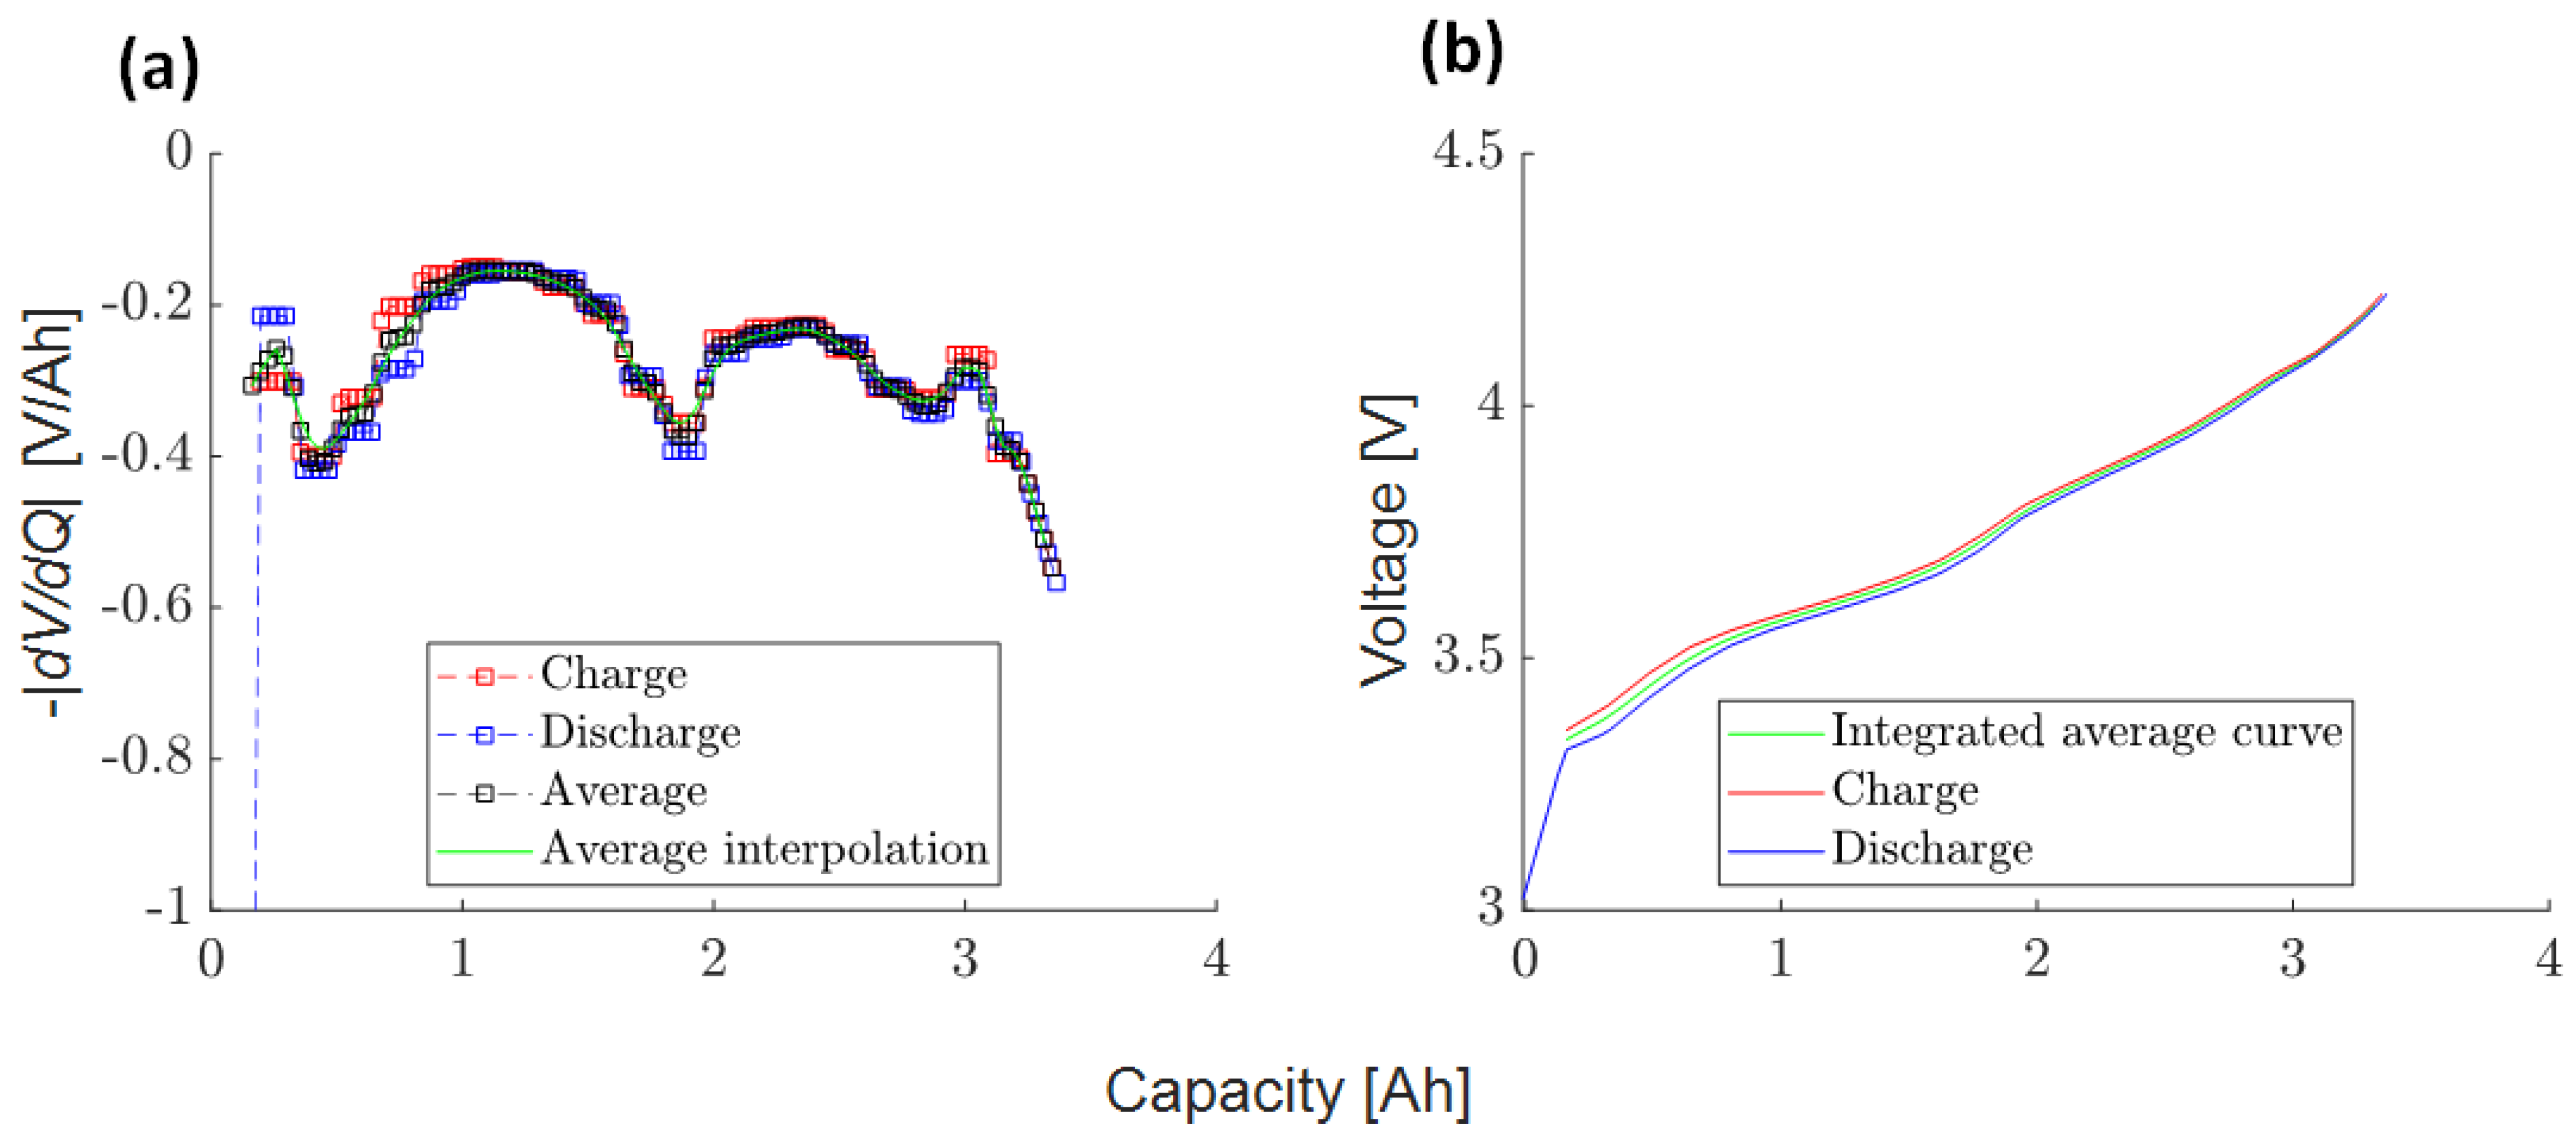
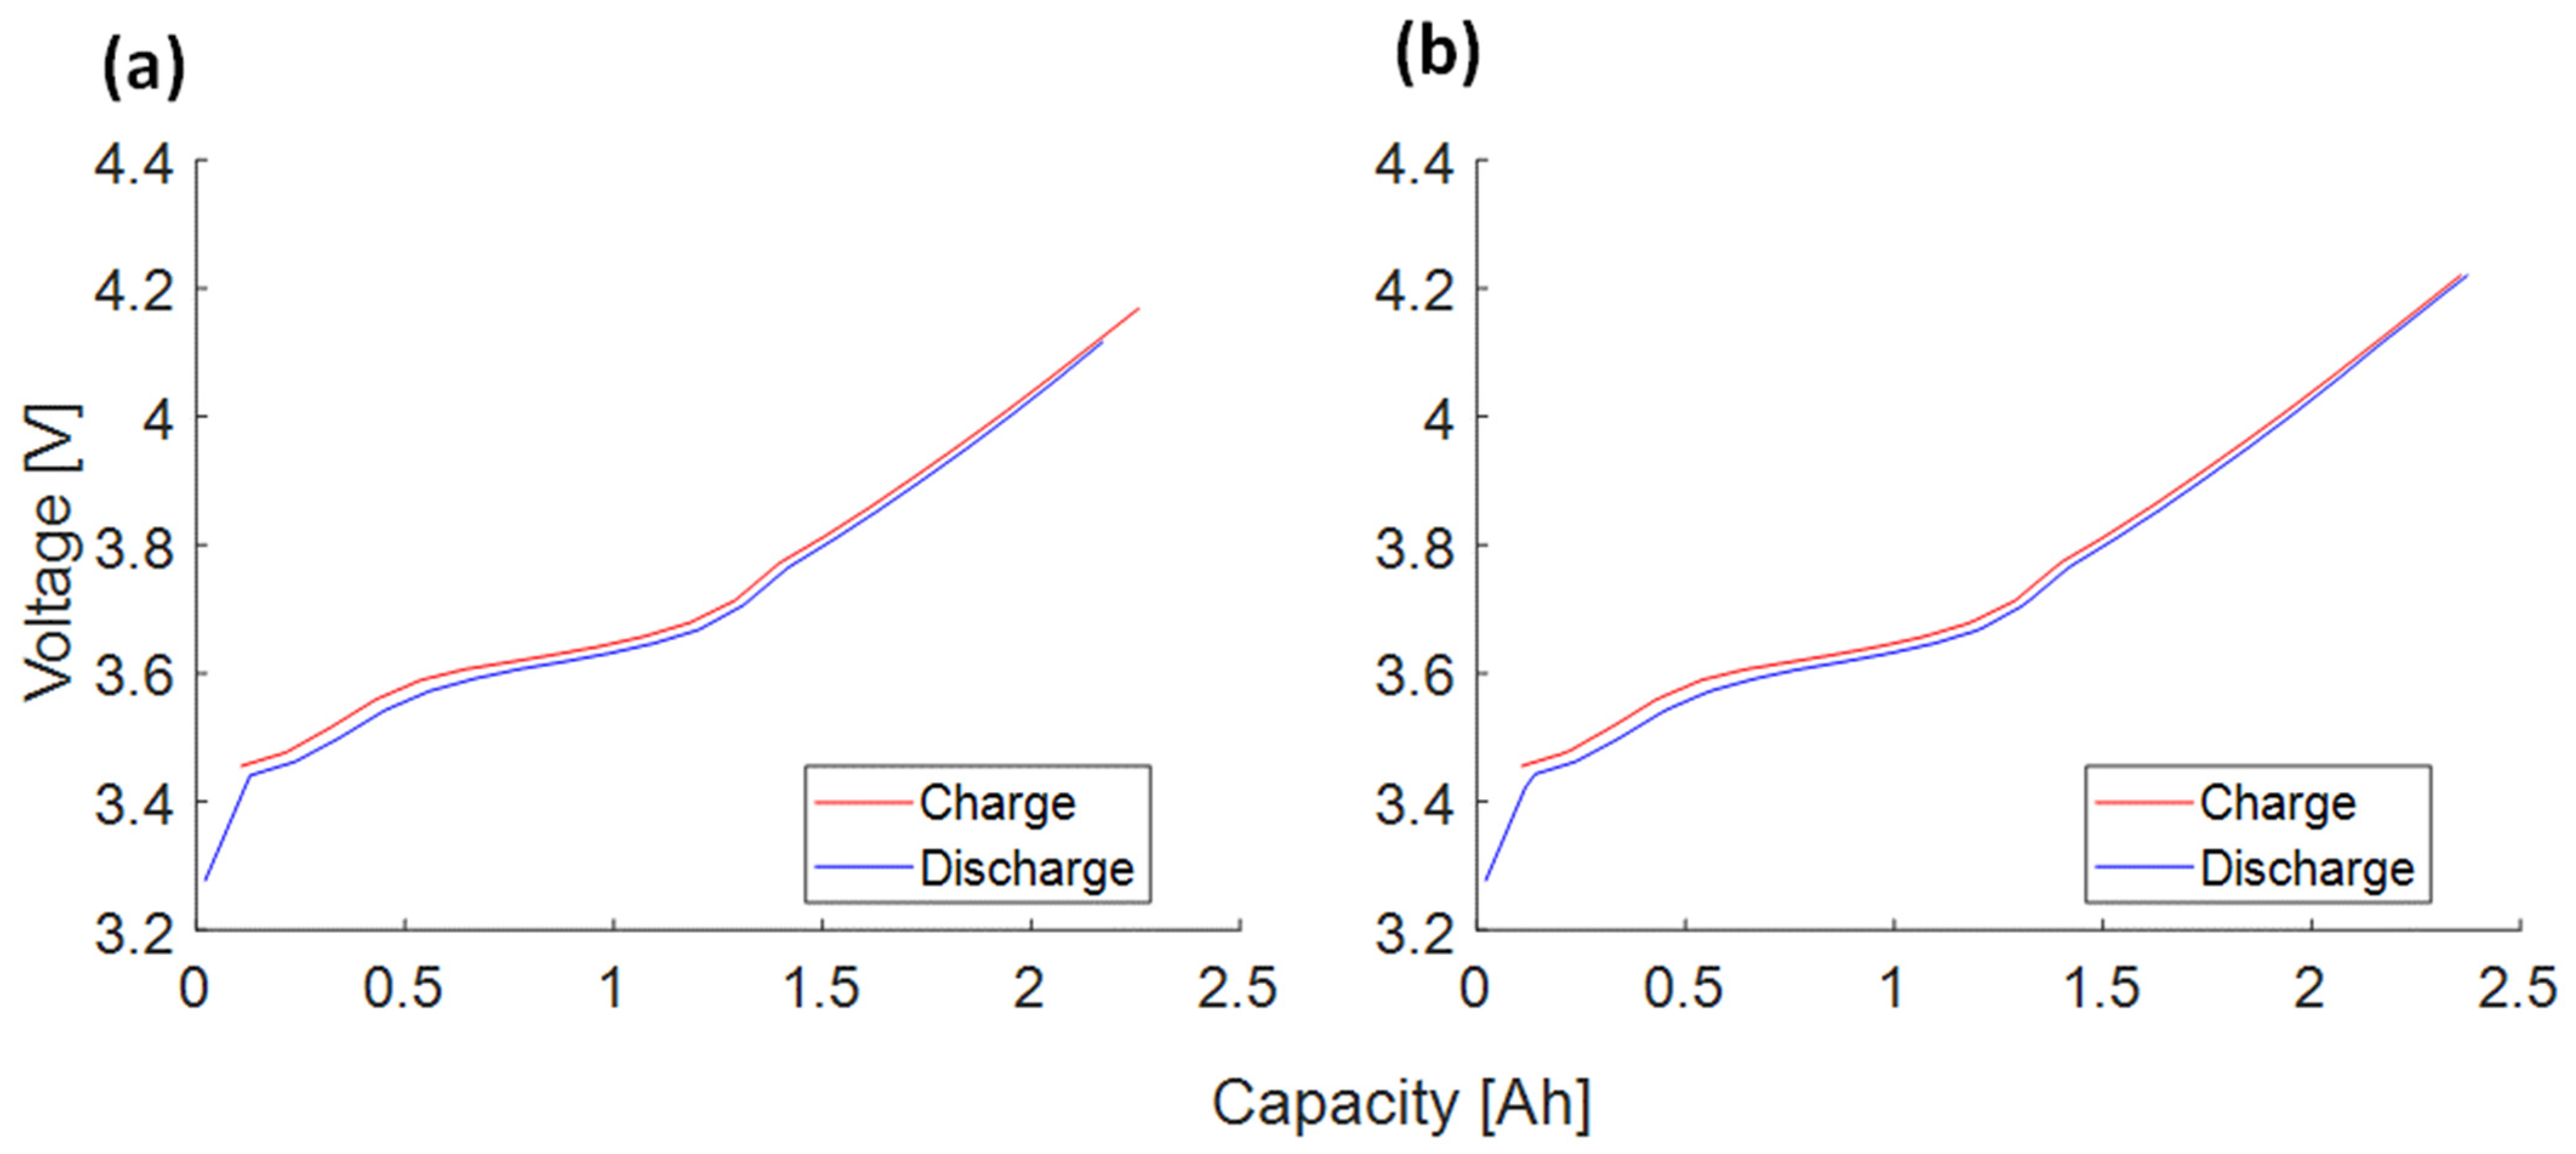
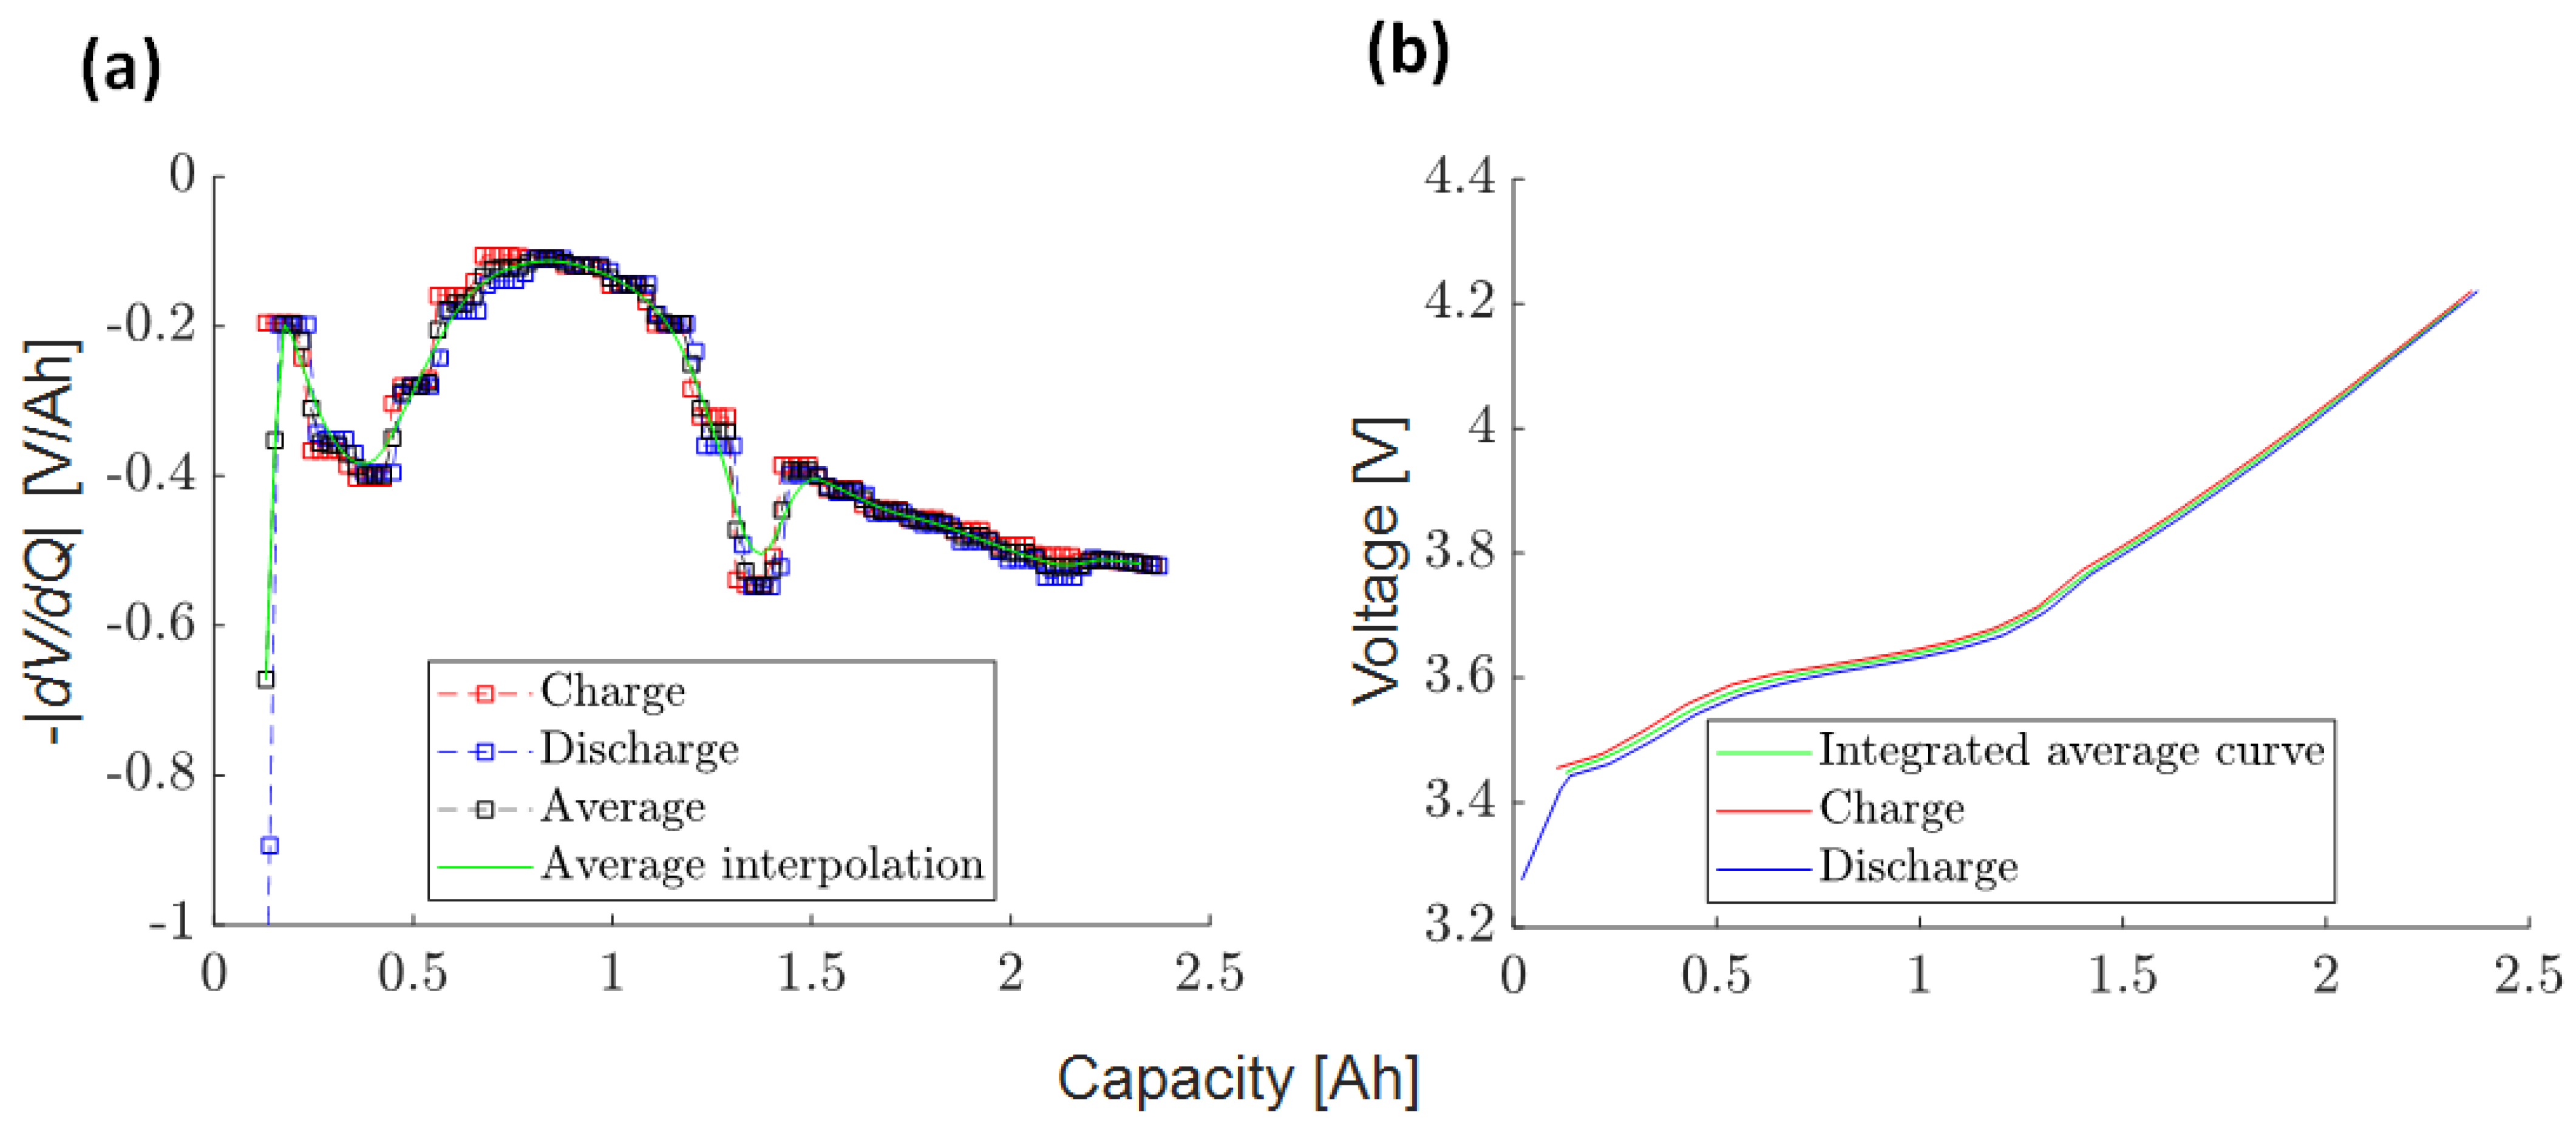
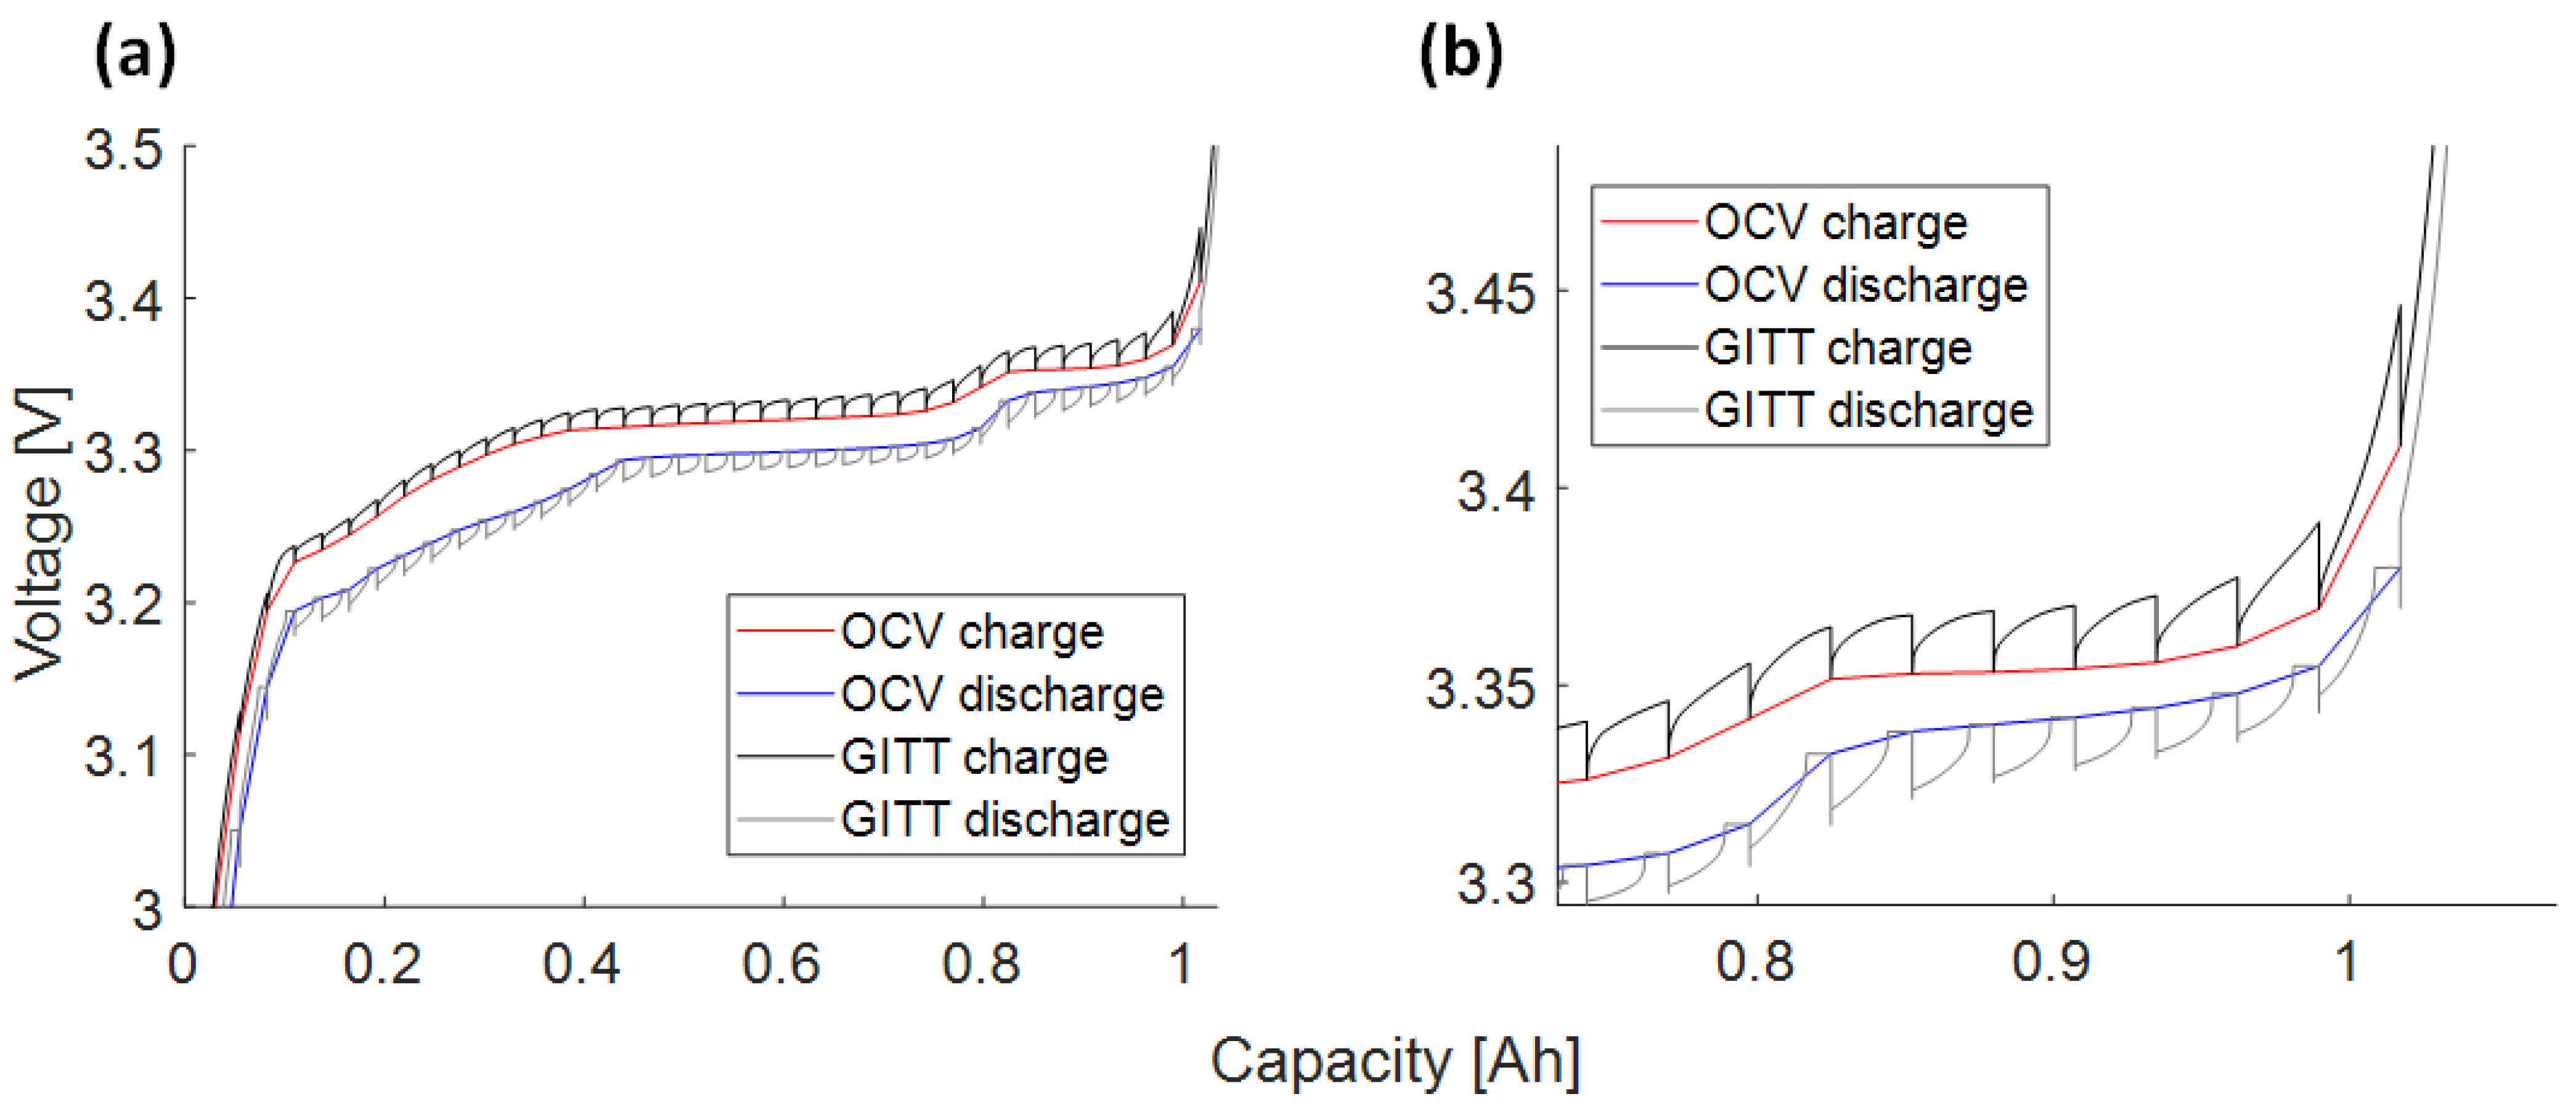
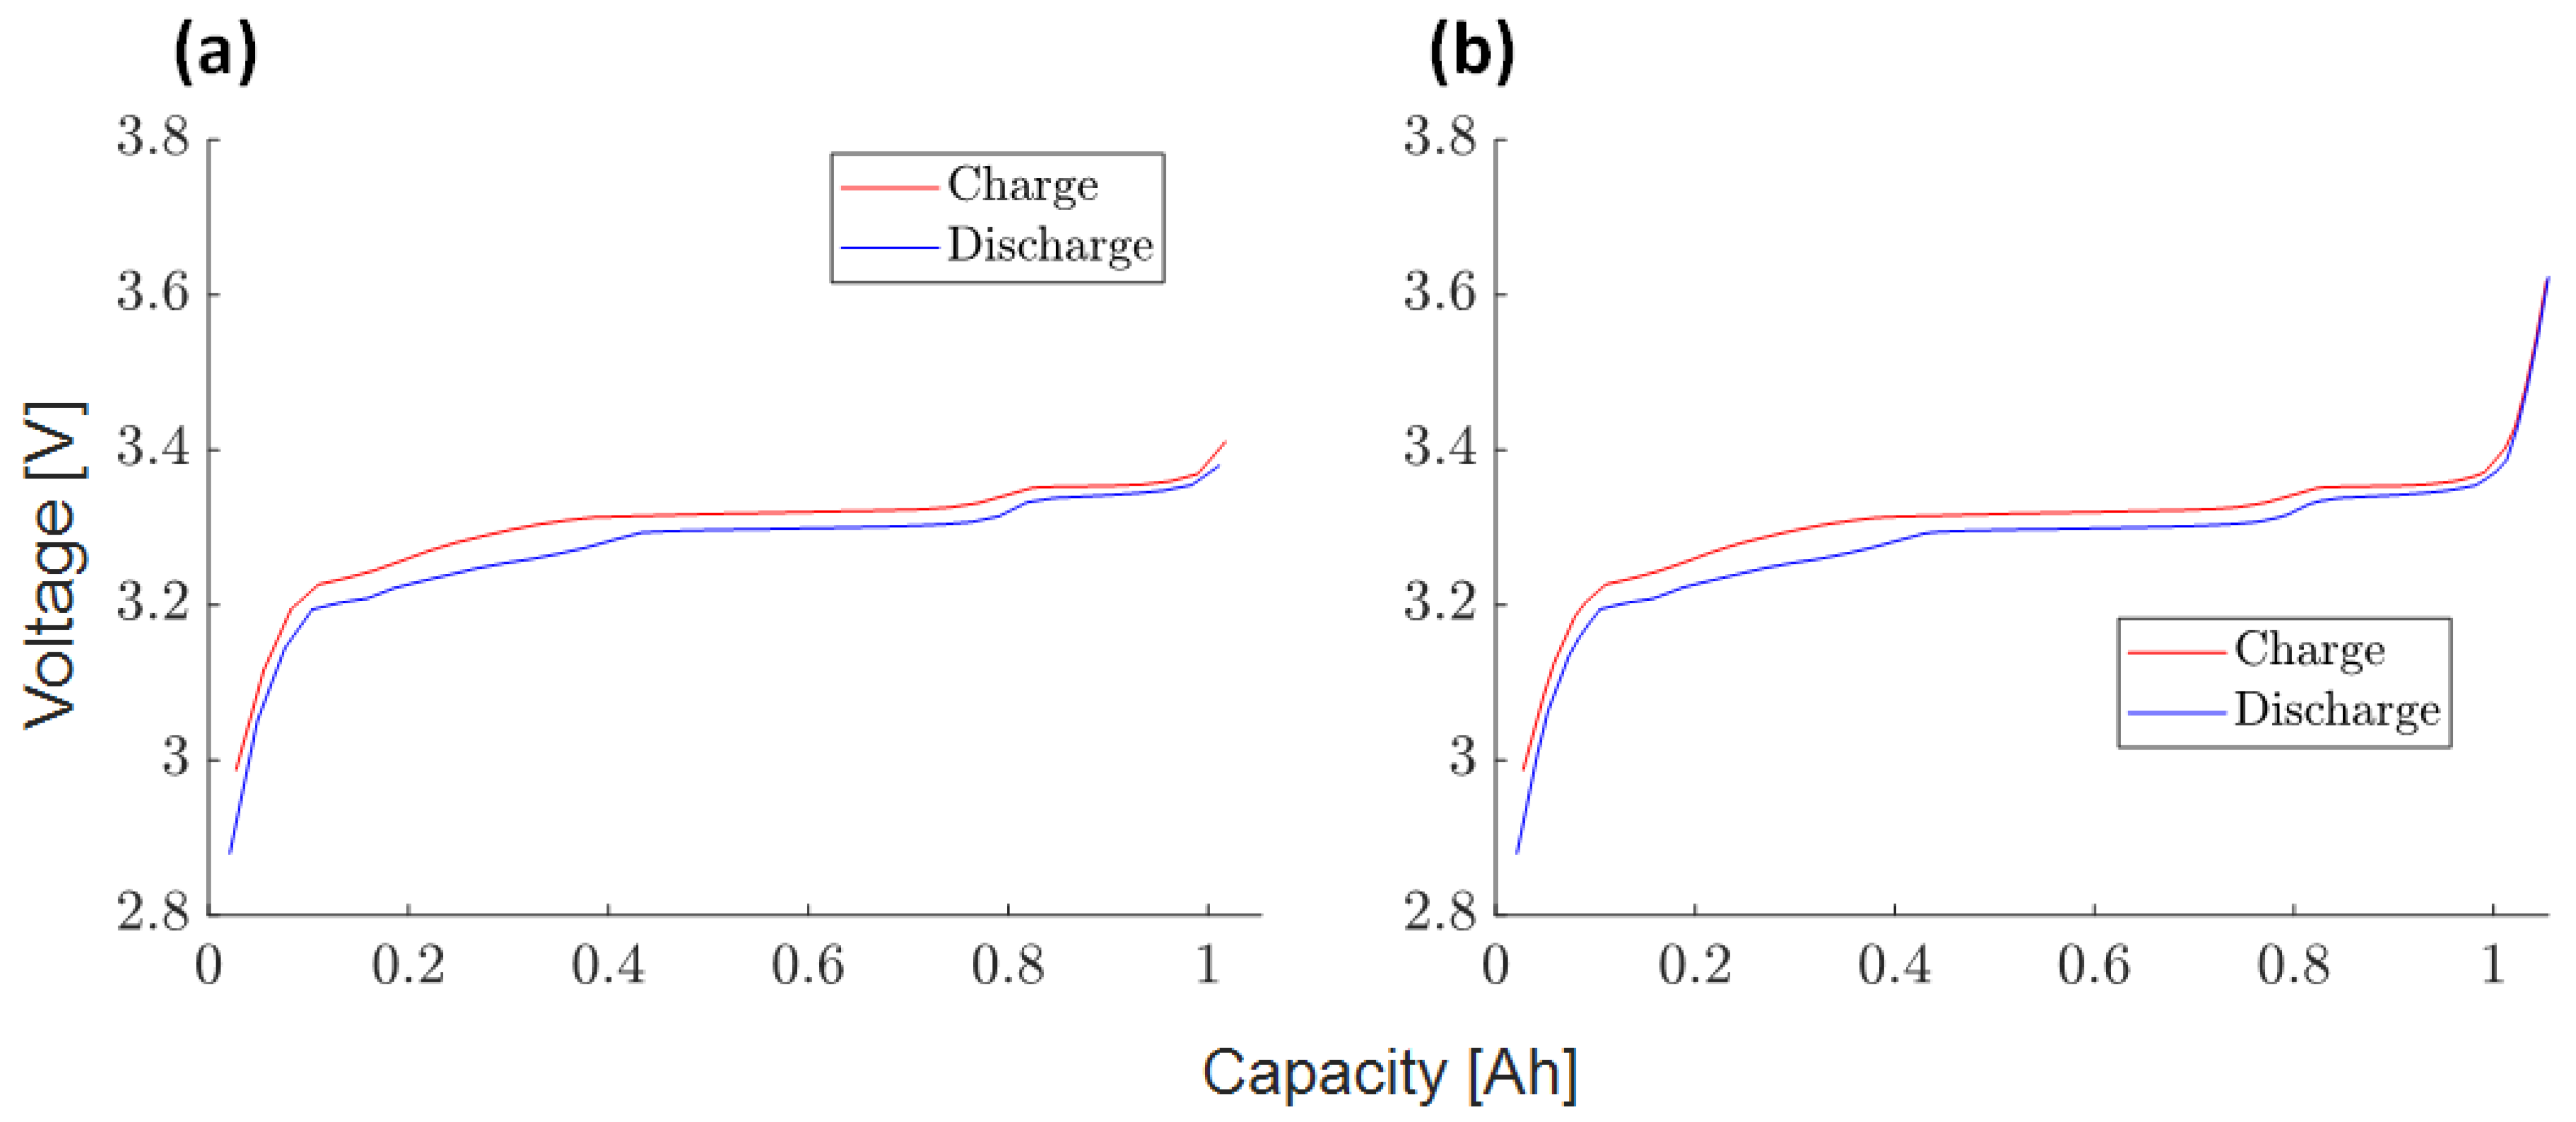
3.4.1. Charge/Discharge OCV Curves (1)

The measurement of the OCV curves is obtained through the GITT [31]. It is a method that adjusts a cell’s SOC by incorporating extended periods of relaxation in between. The change in cell voltage over time primarily occurs due to the concentration gradient and redistribution in the electrolyte and solid phase diffusion, as well as redistribution in the solid phase. Since this technique avoids kinetic contributions, the OCV measurements obtained are considered to be more precise than the quasi-OCV based on low current charge and discharge [32]. The experimental measurements consisted of many small SOC steps in which the battery was charged or discharged and then relaxed under OCV conditions. This aimed to reduce the effect of the battery polarization on the battery voltage. In our GITT tests, the battery cell has undergone 74 SOC steps, each step has had a relaxation time of one hour, and the charge and discharge currents were 0.1 C.
Figure 12a shows the test result of the charge and discharge voltage curve of the A123, respectively, while in Figure 12b a zoomed-in part for higher voltages is highlighted. The cells we utilized for the float current procedure are distinct from those used for the GITT OCV curve of the full-cell procedure. During the charge process (black steps and red line), the voltage increase corresponds to the charge procedure while the decrease part refers to the relaxation part. During the discharge process (light grey steps and blue line), the voltage decrease is the discharge step while the increase is the relaxation step. At the end of the relaxation phase, the curve of the battery voltage versus time is quite flat. The flatter this curve is, the more relaxed the battery is. By connecting the last voltage point of each SOC step, approximate charge and discharge voltage curves are obtained. Figure 12b demonstrates that higher voltages require a longer relaxation period and are therefore extrapolated and not measured with the GITT technique. The same measurement procedure is also performed for the PAN and SAN cells.
Figure 13a shows the experimentally measured charge-discharge voltage curves versus the capacity of the A123. Despite the relaxation phase, there is a clear potential difference between the two curves. This is a typical hysteresis for the LFP cathode in lithium-ion cells [33,34]. Electrode potential hysteresis is commonly attributed to a range of factors, including thermodynamic entropy changes, mechanical strain, and microstructural alterations in the active materials of the electrode that undergo a dual-phase transformation during the lithiation and delithiation processes [35].
The cell potentials above 3.5 V are not measured in the GITT test, as significantly longer relaxation times of up to 30 days are required due to greater overpotential. Therefore, we extrapolated the voltage curve at high voltage based on knowledge from the literature [36].
At high SOC, the half-cell voltage curve of the anode is quite flat, while the voltage potential of the LFP cathode increases rapidly with delithiation [27,37]. Therefore, the voltage curve change of the battery at high SOC is mainly associated with the potential change of the cathode. At high SOC, the LFP voltage change rate increases rapidly and is approximated linearly in the DVA. After integration, this linear approximation is visible as a quadratic voltage curve. The supplemented voltage curve is shown in Figure 13b.
The same procedure was conducted for the two other cell types. For PAN and SAN, no strong hysteresis and strong overpotential at the end of charge are observed. The measured and extrapolated curves obtained are given in Figure A1a,b and Figure A3a,b for the PAN and SAN cells, respectively.

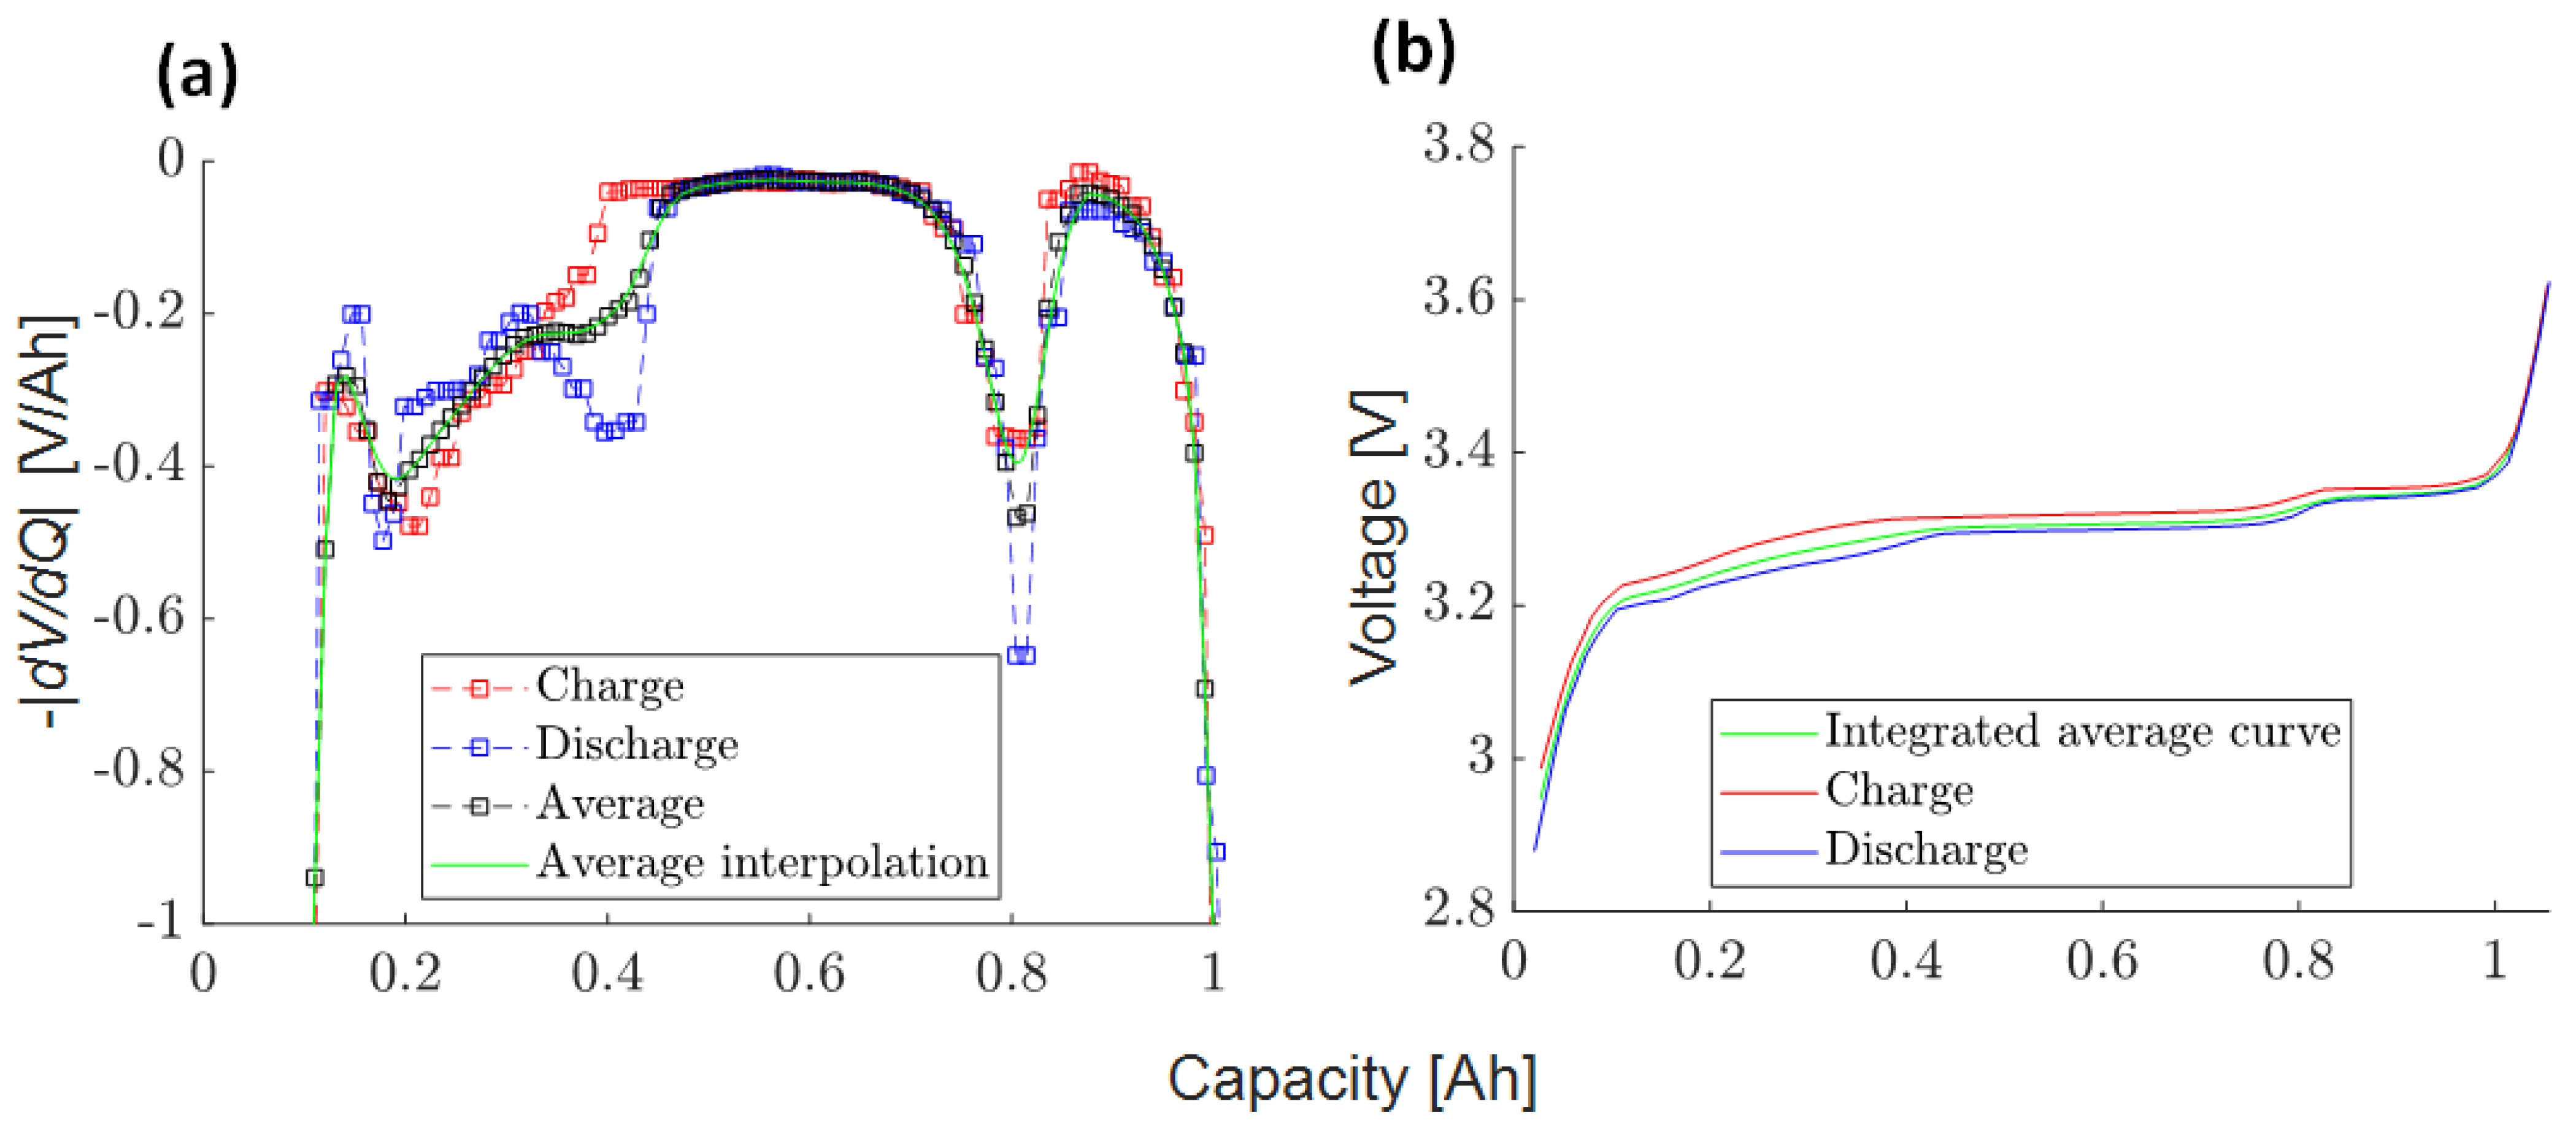
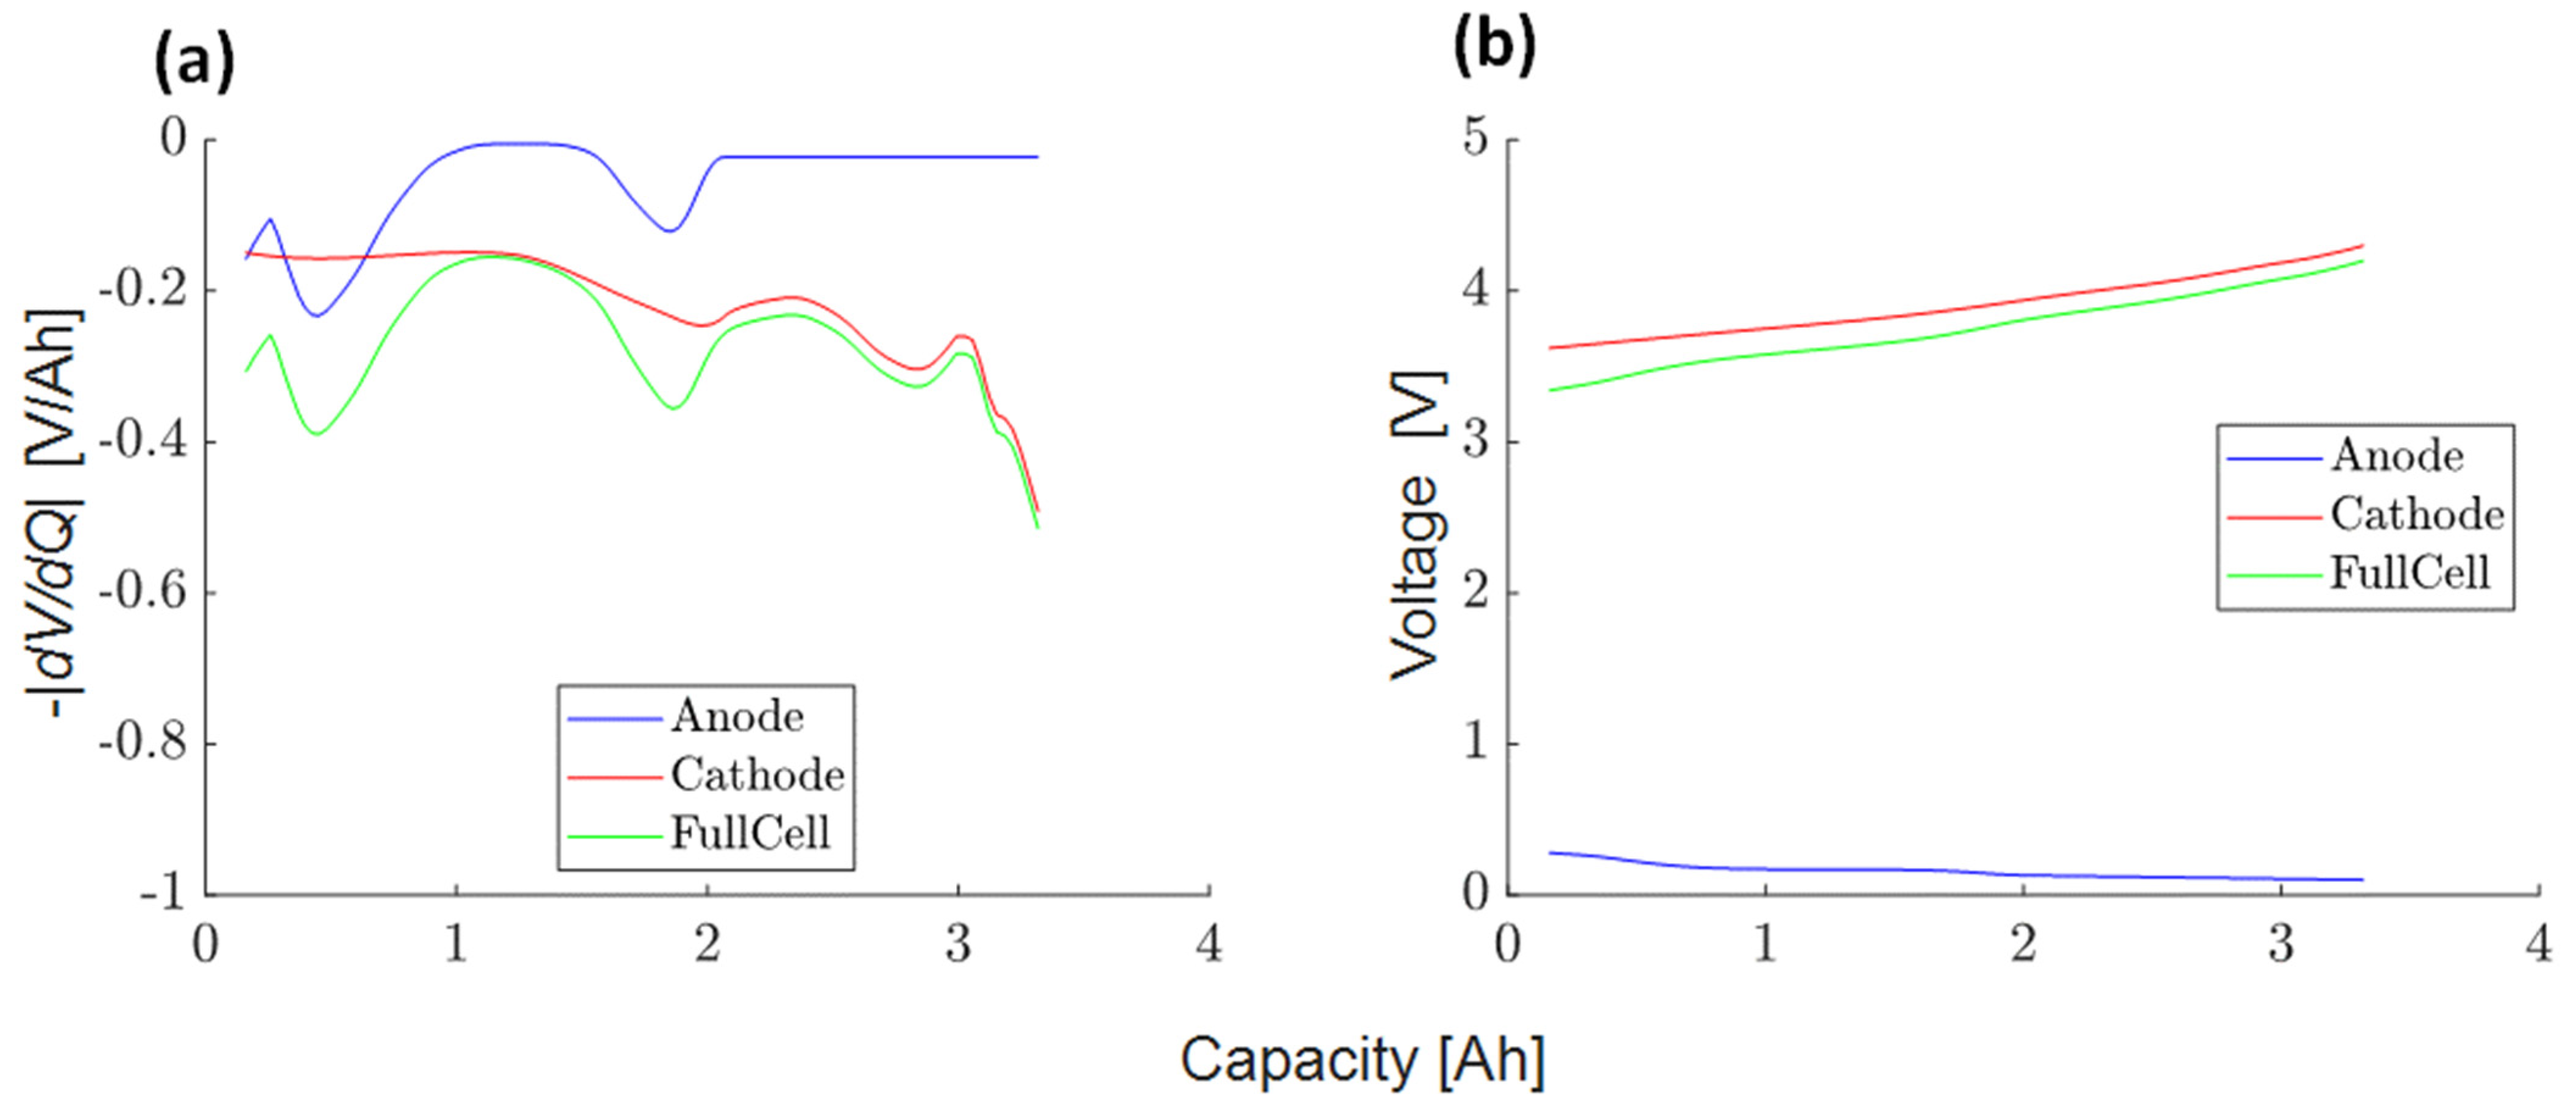
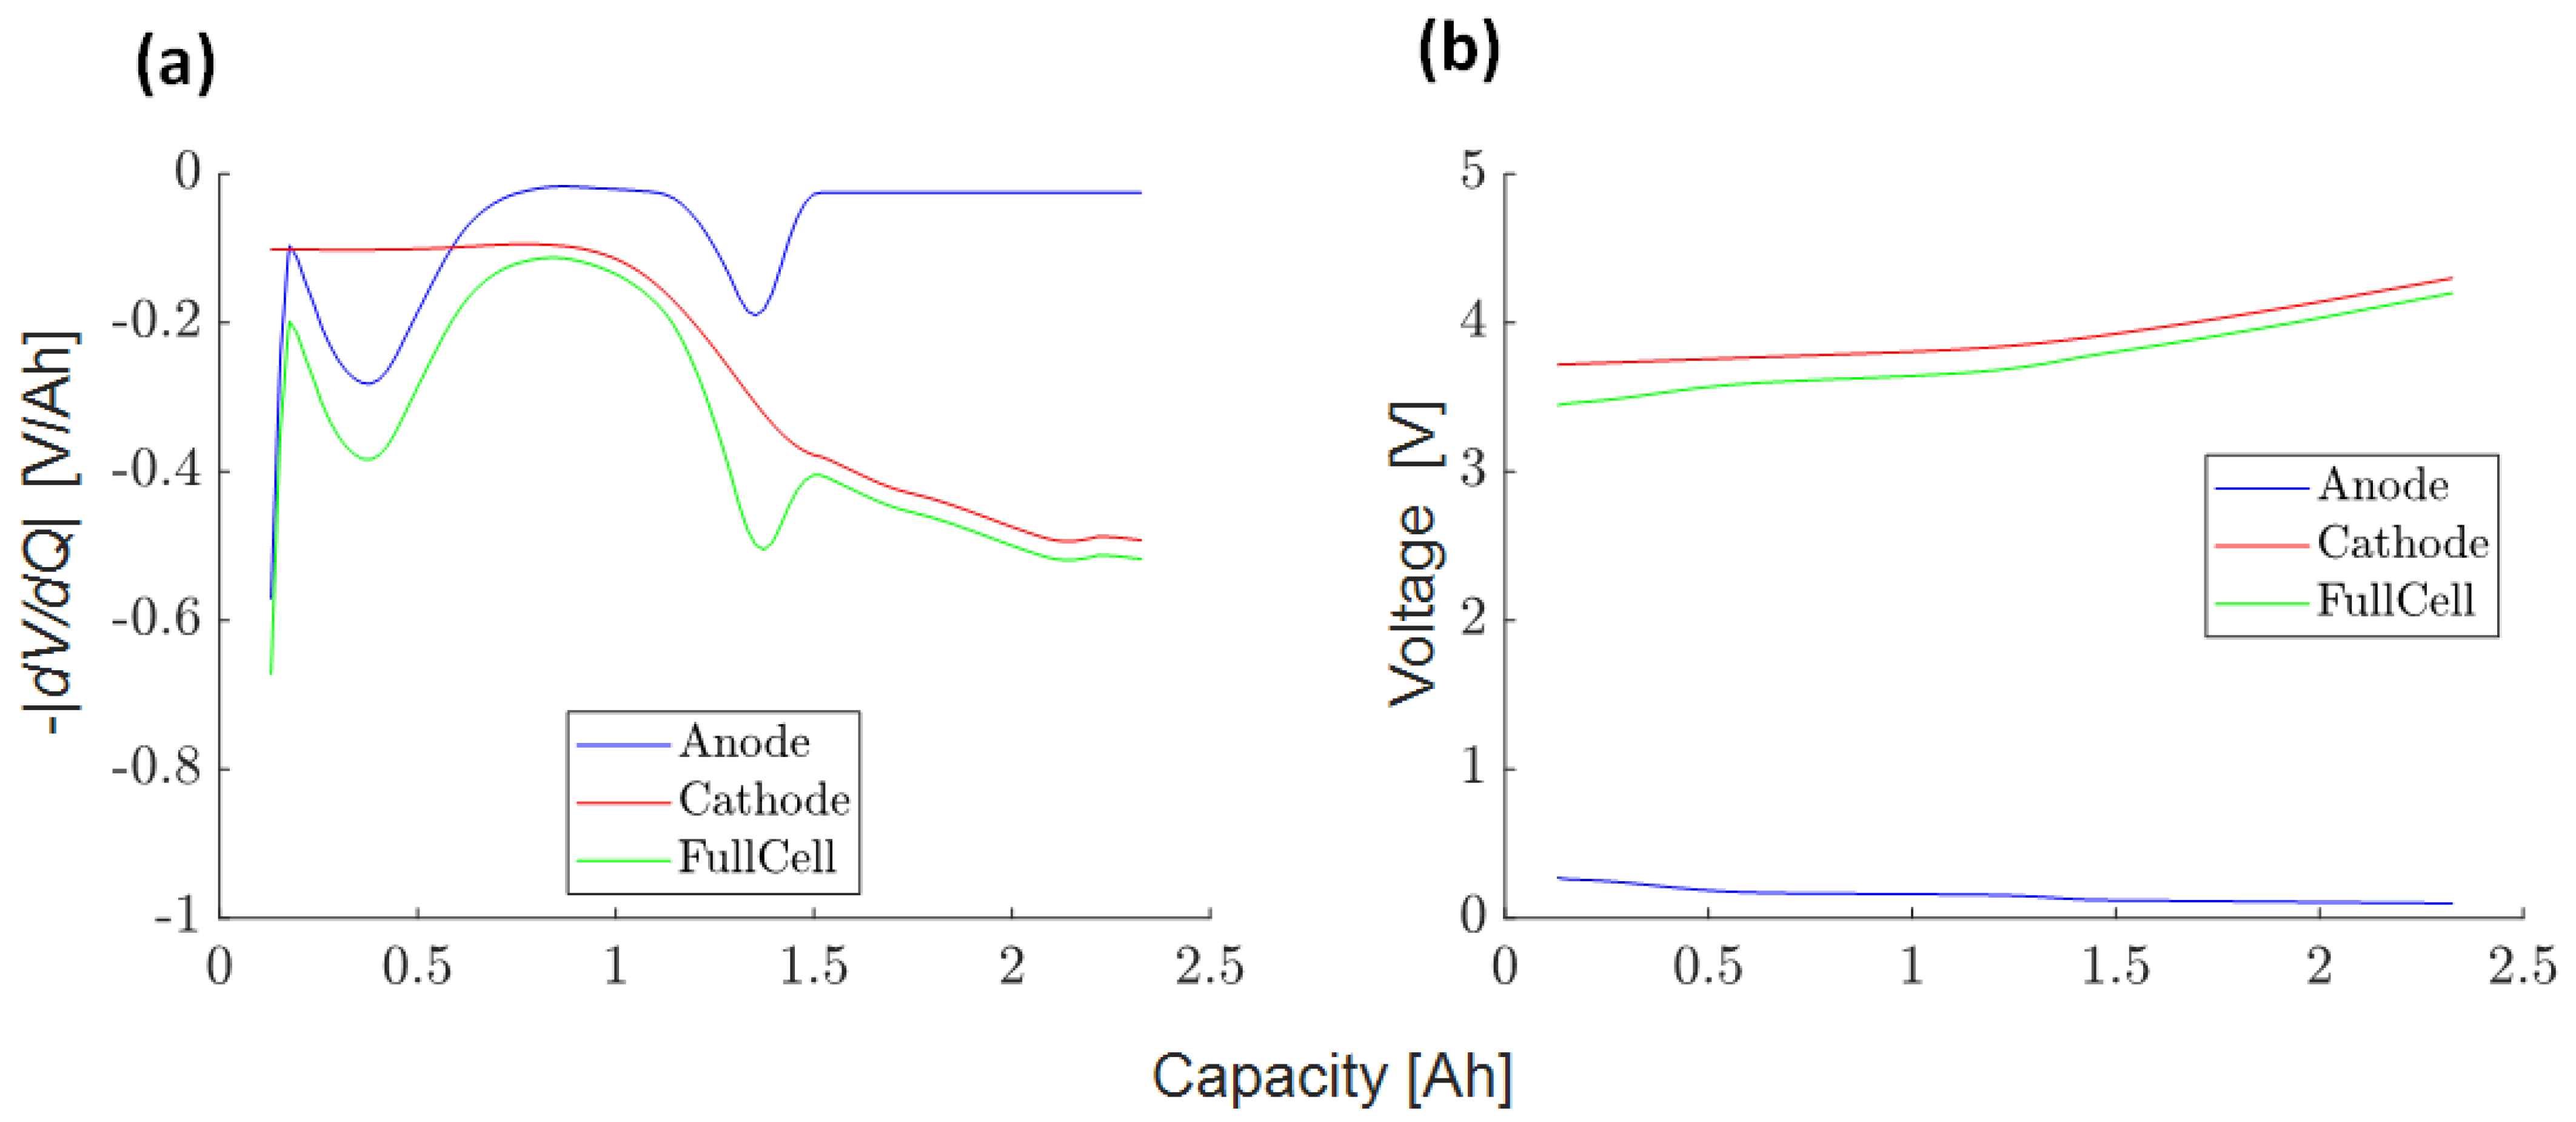
3.4.2. Full Cell Average DVA Curve (2)

For the analysis of the float current test, the measured OCV curve is considered. Therefore, the average of the charge-discharge voltage curves is calculated. However, taking the average of the two curves directly may have a large error or offset. Therefore, we adopt the method of averaging the derivatives of the two curves to obtain a more credible curve.
First, it needs to be checked whether the two curves are aligned in x-direction. Figure 14a shows the DVA of the charge/discharge with respect to capacity. The derivative curve is obtained by calculating the slope of the line connecting the previous point to the current point as the derivative of the current point. By observing the charge and discharge curves on the left and right, one can observe that both curves are not shifted to each other in x-direction and no additional correction is necessary. However, there are some differences between the two curves over the SOC range. At about 0.8 Ah, there is a small peak shift, and the sharpness of the curves is different. This is known in the literature as dynamic difference in charge and discharge, where peaks are sharper during charge and others are sharper during discharge [34]. At about 0.4 Ah, a peak exists in the discharge curve but not in the charge curve. This mismatch might be caused by hysteresis; however, the exact reason for this is still unknown. For this paper, the uncertainty due to the curve mismatch will not generally affect the idea of our voltage slippery model; however, for detailed analysis, the influence of this mismatch on the recharge current must be understood in upcoming papers.
For the PAN cell in Figure A2a, as well as for the SAN cell in Figure A4a, a shift adjustment is not required. The locations of the general features of the two curves are consistent, and therefore the average curve of the two is calculated in a straight-forward manner.
Figure 14a shows the result of averaging the charge-discharge voltage derivative curves and applying interpolation to smoothen the resulting average curve.
Figure 14b confirms the method to obtain the average voltage curve by comparing it with the charge and discharge curves. The same procedure is performed for both remaining cells and the curves are to be found in Figure A4b for the SAN and Figure A2b for the PAN cell, respectively.

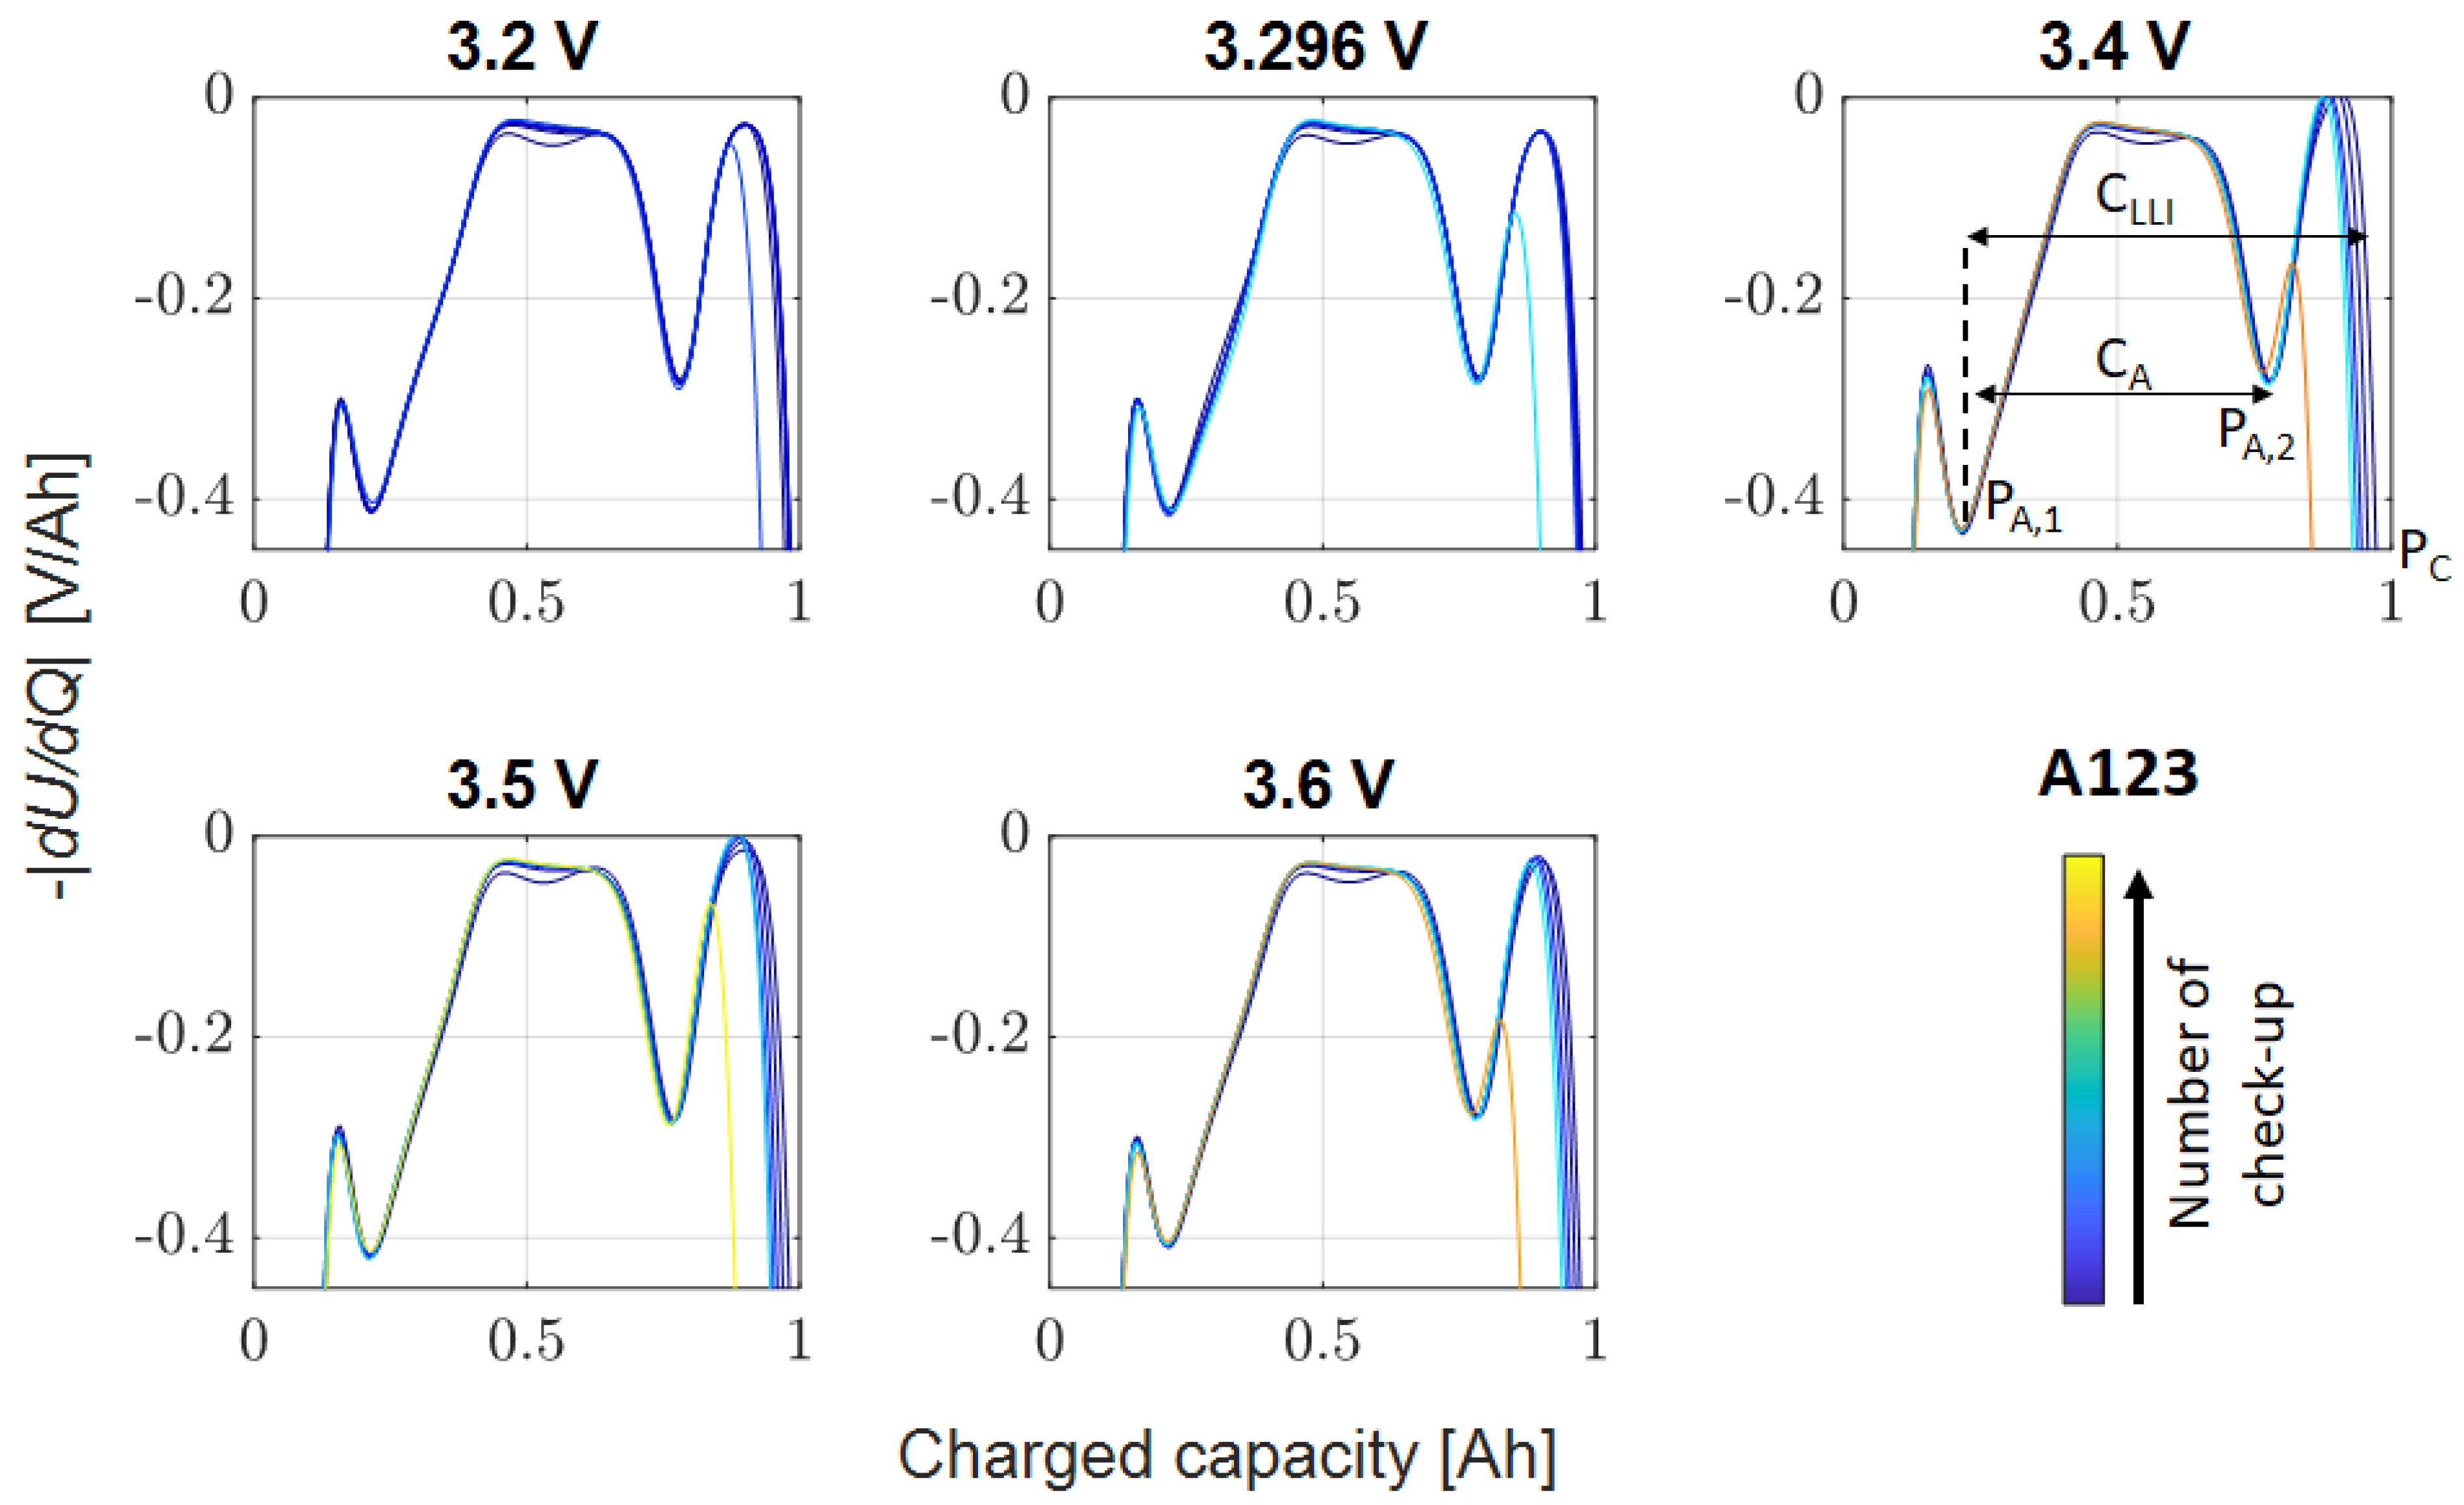
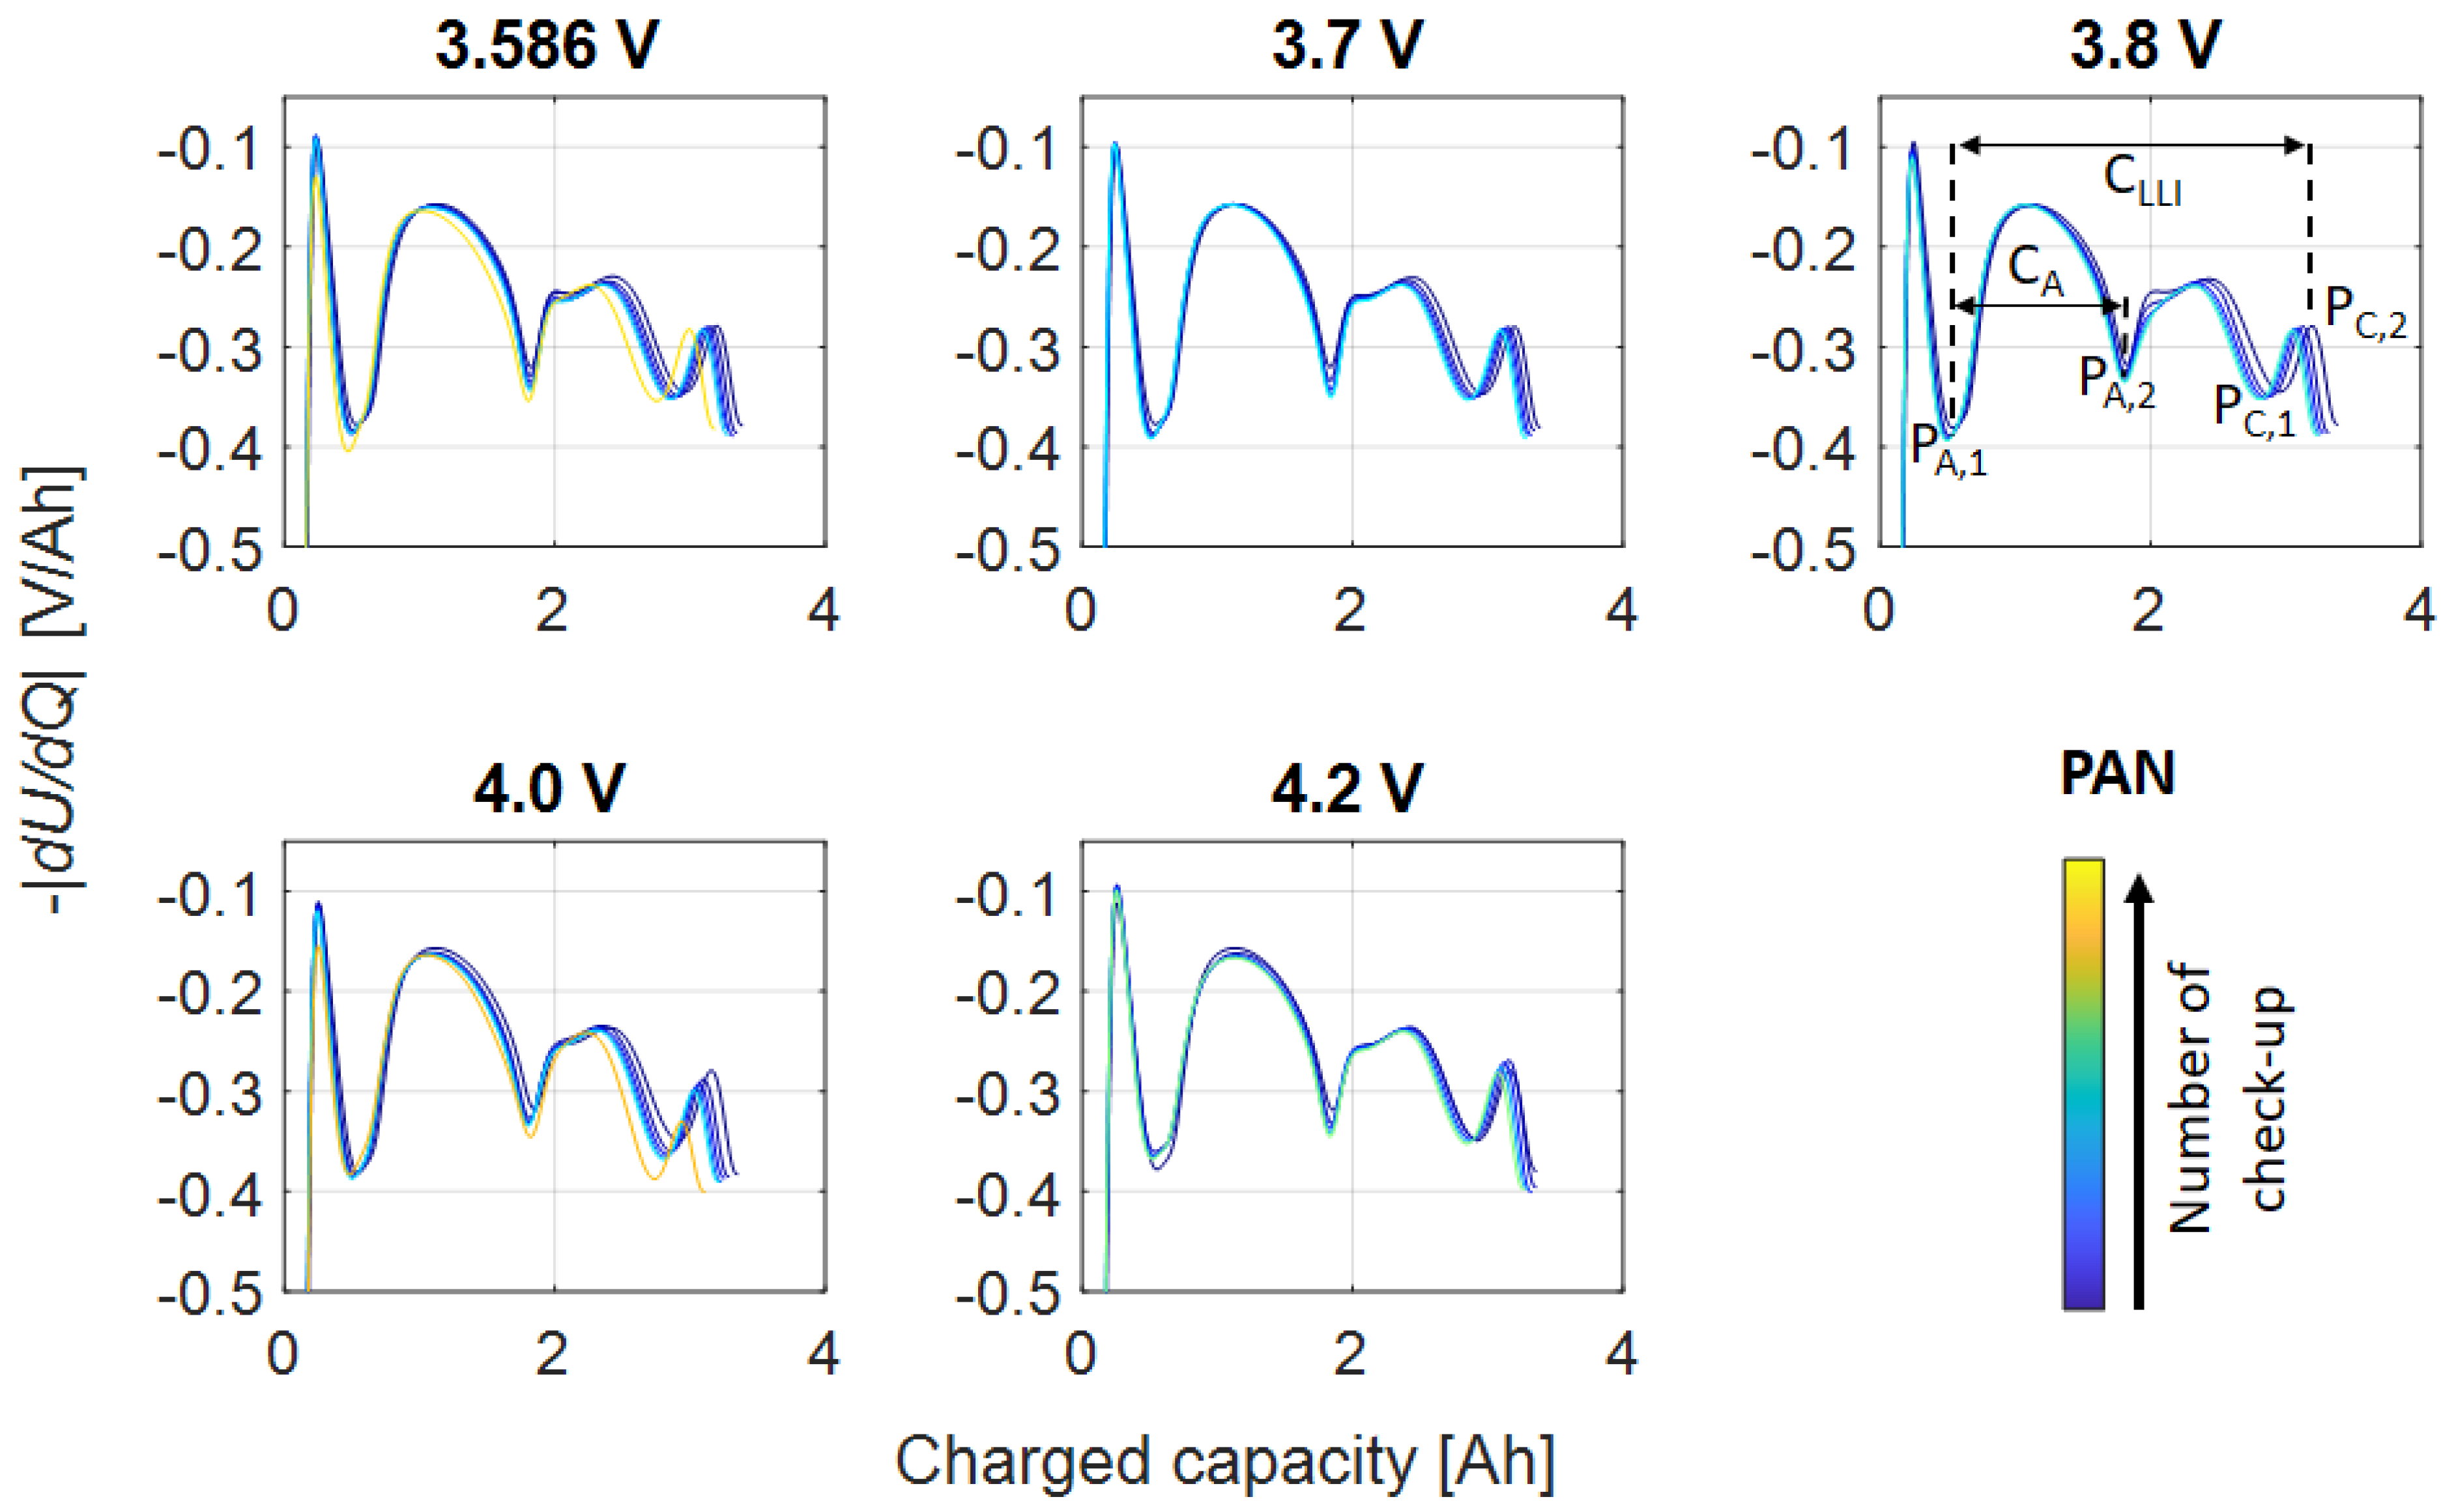
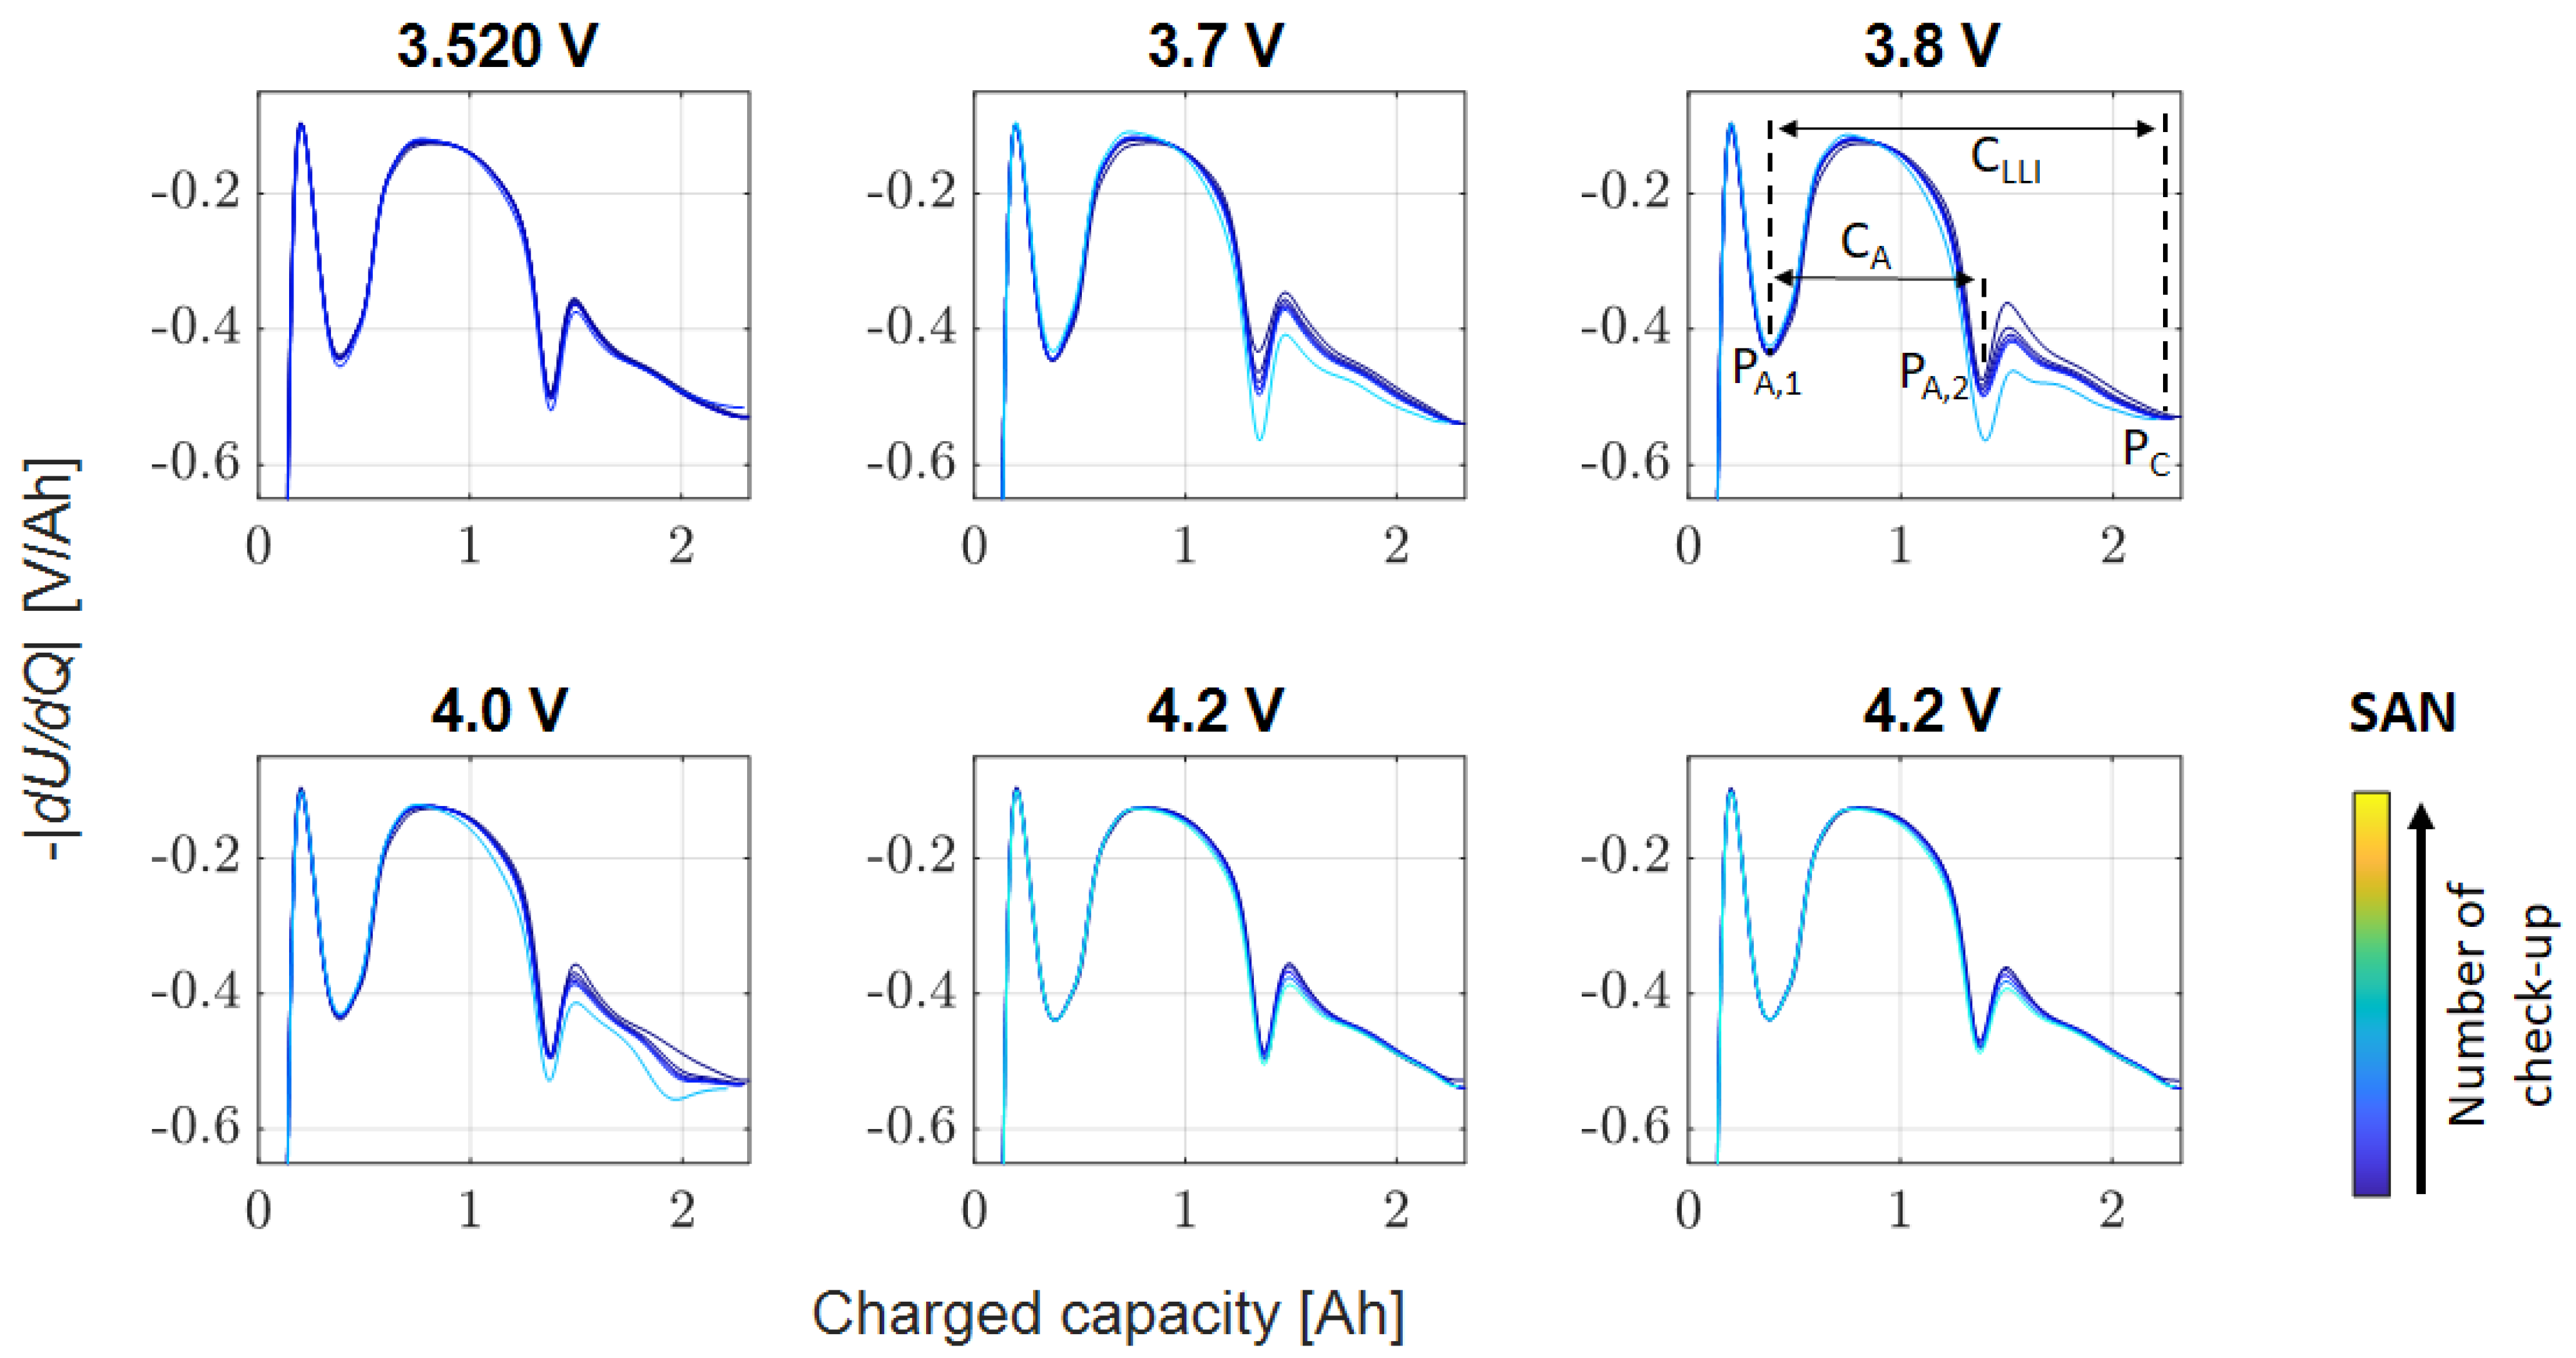
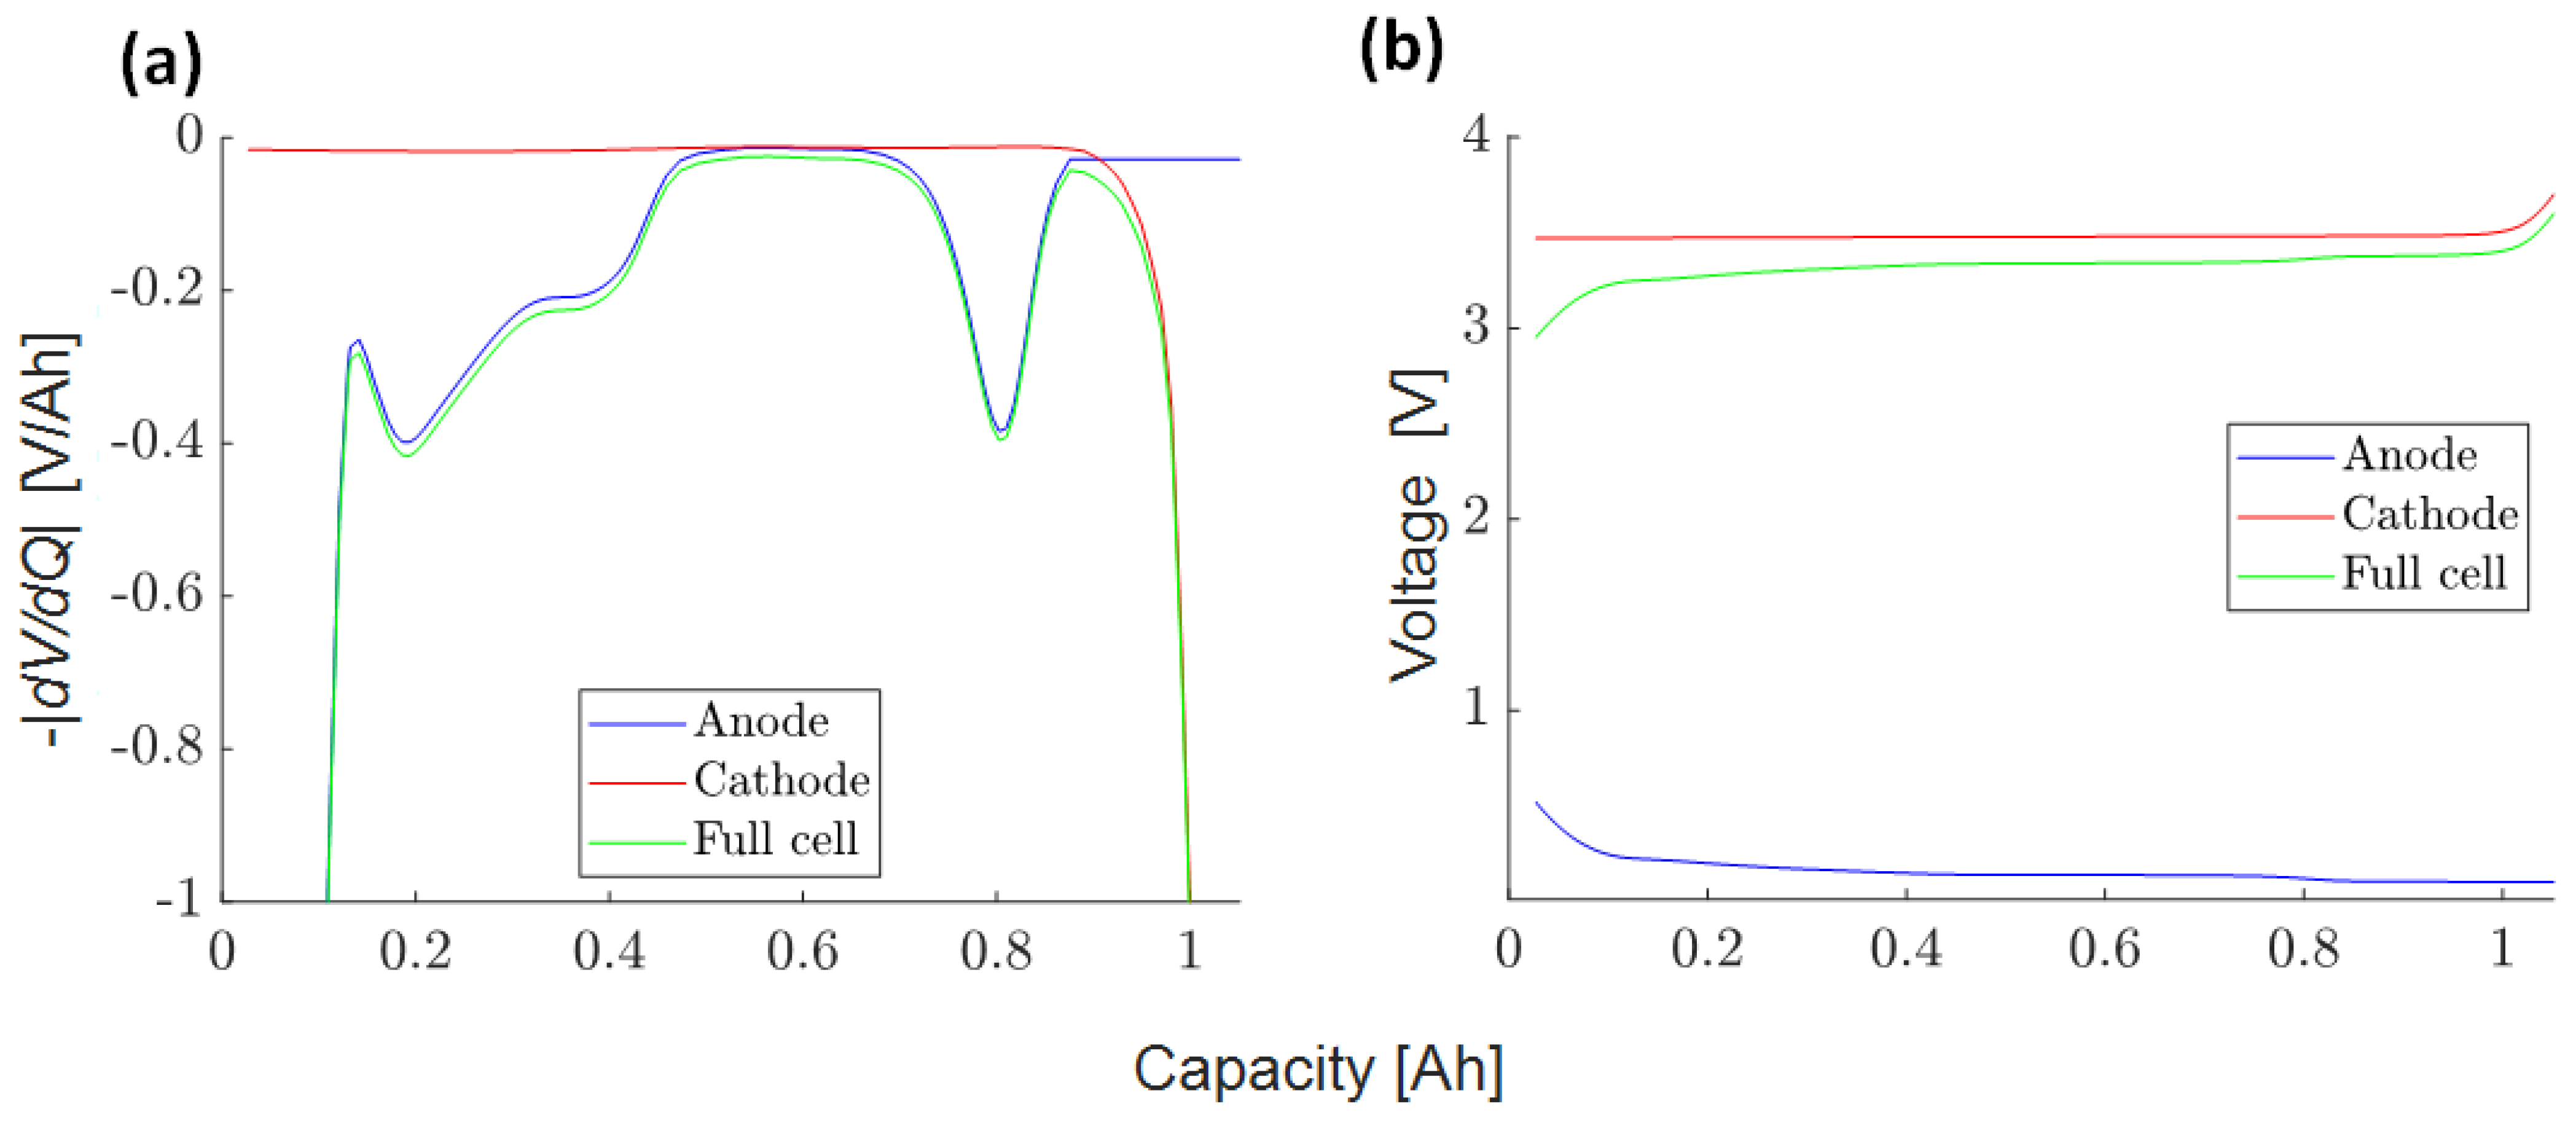
3.4.3. Half-Cell DVA Split (3)

Based on the data obtained above, the DVA split method is utilized to divide the DVA (Figure 8) of the full cell into the DVA of the half cells. From the separated DVA curves, we then calculate the voltage curve of each half cell. Using the obtained full-cell curve and knowledge of the half-cell curves from cell disassembly of A123 and PAN (not shown here), we can make an educated guess about the half-cell behaviors. This guess is based on the analysis of distinct material-specific characteristic peaks [9] and the processes defined for the A123, PAN, and SAN, as illustrated in Figure 8, Figure 9 and Figure 10, respectively.
Figure 15a shows the DVA curves of the anode and cathode after splitting for the A123 cell. The DVA curve values for the LFP cathode are small and constant over a wide range. The last DVA increase in the full cell comes from the cathode. The initial valley and two peaks of the full cell are associated with the anode [36]. This is supported by the DVA curves of the full cells presented before in Figure 8, where the shape of the graphite peaks remains unchanged although LLI occurred, highlighting that the LFP only has a strong contribution at the end-of-charge [9]. Figure 15b shows the integrated voltage curves of the half-cells, obtained from the separation of the DVA.
The corresponding curves for the PAN cell can be found in Figure 16a,b. Until 1 Ah, the main characteristics stem from the graphite anode. The valley at 2 Ah is attributed to the anode with a minor contribution of the NCA electrode. Above 2 Ah, only the strong characteristics of the NCA are dominating [9]. This interpretation is consistent with the results from Figure 9, assuming only an LLI shift of the cathode to the anode curve.
The same also applies to the SAN in Figure 17a,b. The NMC cathode, having a lower Ni content, exhibits only varying slopes without peaks in the DVA, appearing as an envelope curve of the full cell [9]. The graphite characteristics are clearly visible in the full-cell curve.
In general, with the exception of the different cathode curve with its characteristic shape [38,39], the split of the full cell into half-cell curves is performed straight forward for the PAN and the SAN cells in the same manner as for A123.

3.4.4. Scaling Factor Anode to Full-Cell Voltage Slopes (4)

Through Equation (2), the scaling factor between the obtained half-cell voltage slopes is calculated.
Figure 18a shows the anode to full-cell scaling factor with respect to the cell capacity for the A123 cell. A scaling factor of 1 leads to a recharge current equal to the SEI growth rate. Values close to 1 are found in the range of 0–0.4 Ah, since the slope of the anode is much larger than that of the cathode. In the range of 0.4–0.8 Ah, the voltage slopes of the two half-cells are close to each other, and therefore the scaling factor is about 0.5. This means that a hypothetic SEI growth rate of 10 µA will only cause a recharge current of about 5 µA. In the range of 0.8–1 Ah, the scaling factor decreases rapidly. After more than 1 Ah, the SEI growth hardly causes any recharge current as the anode curve is flat and the cathode curve, and with this the full-cell curve, is relatively steep.
Figure 18b shows the scaling factor of the PAN cell with respect to the cell capacity. Unlike LFP, the NCA voltage slope of the PAN cell is rather constant and with a high slope over the entire full-cell range. Therefore, the scaling factor is always below 0.6 and can therefore lead to a maximum recharge current up to 60% of the SEI growth. In the range of 1–1.5 Ah and more than 2 Ah, the recharge current due to SEI is almost zero. Two peaks emerge at about 0.5 Ah and 1.75 Ah due to the graphite peaks.
Similar results are obtained for SAN in Figure 18c for the scaling factor. The differences in the cathode of PAN and SAN appear at higher cell voltage. Since in both cases the gradient of the anode is significantly lower than that of the respective cathode, the scaling factor is close to zero in both cases. Therefore, no strong differences are observed in the scaling factor between PAN and SAN.

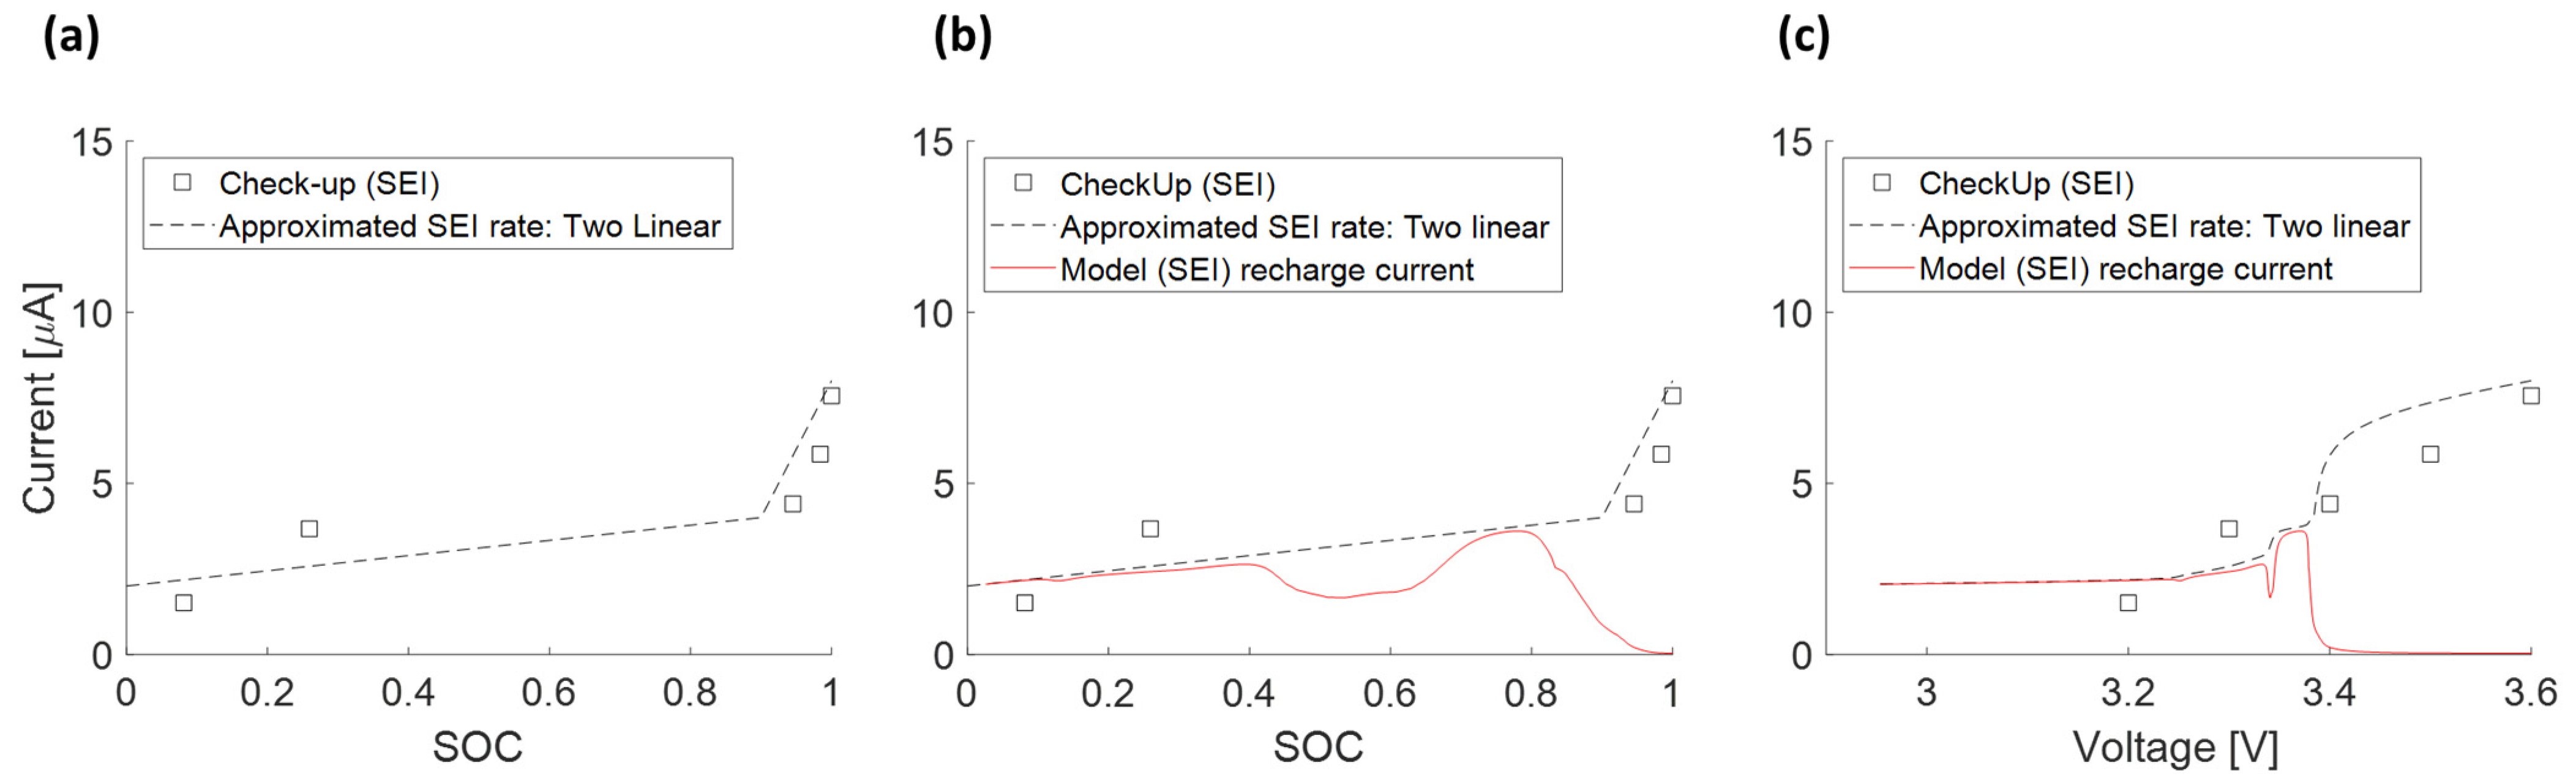
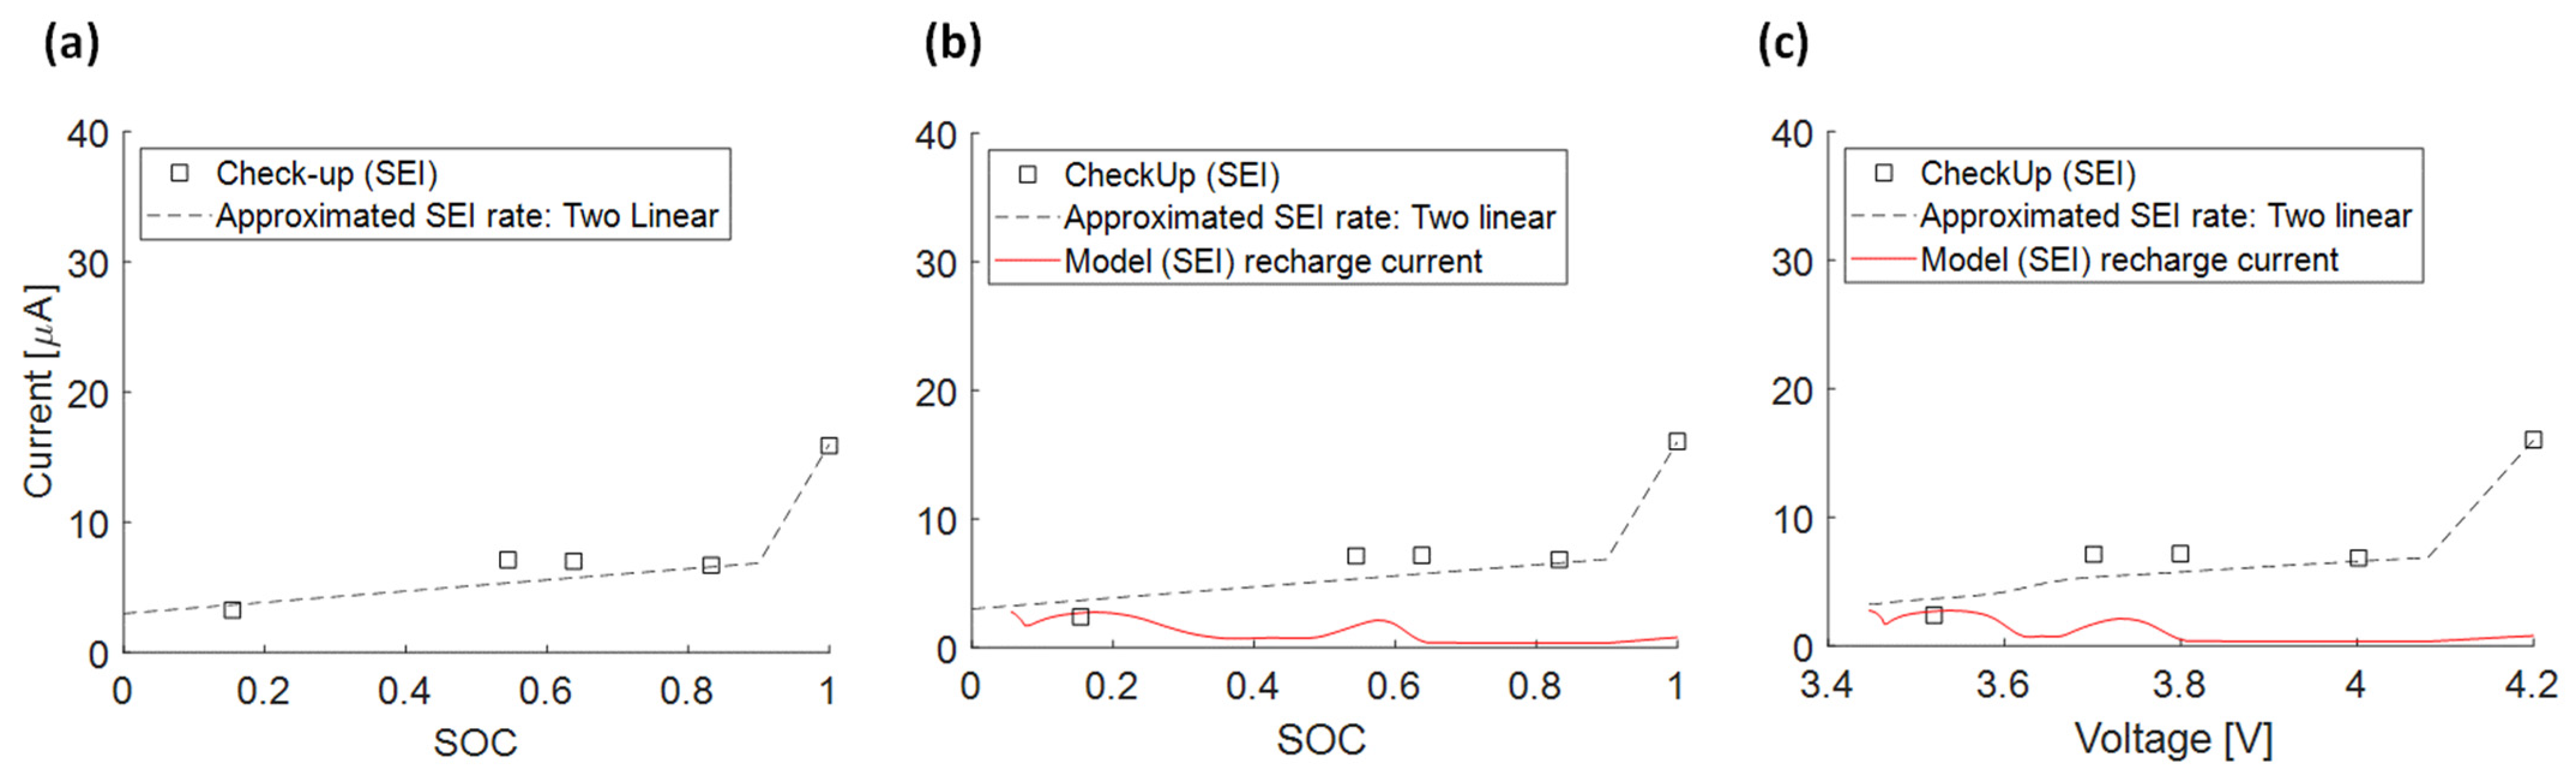
3.4.5. Approximated SEI Growth Rate (5)

This section mainly discusses the relationship between the SEI growth rate with respect to the cell voltage and SOC. Using the calculated scaling factor, and the relationship between anode and cathode DVAs, the recharge current is obtained for a given SEI growth rate with the help of Equation (3).
Figure 19a shows the capacity loss rate measured by the check-up tests interrupting the float current test for the A123 cell. As our experiments include only a few fixed voltages, the middle SOC part ranging from 30% to 90% is missing. Combined with the data obtained by Keil et al. [9] and Lewerenz et al. [20], we can infer that the SEI growth rate increases linearly with increasing SOC, and the increase amplitude could become larger in the higher SOC part. This is shown in Figure 19a with two dashed lines, where both lines are linear, with two different slopes.
By multiplying the scaling factor calculated in the previous section, the corresponding recharge currents are obtained. Figure 19b shows that the recharge current increases linearly at 0–40% SOC. It remains basically unchanged at 40–70%. At about 75% SOC, the recharge current reaches a maximum and then decreases. It is worth noting that at 90–100% SOC, the SEI growth will hardly cause any recharge current. Figure 19c shows the recharge current with respect to the voltage values.
Regarding the PAN cell, Figure 20a shows the SEI growth rate converted from the capacity loss measured by check-up under the condition of constant voltage from Figure 7. For simplicity, we approximate a linear relationship between the SEI growth rate and SOC to define an approximated SEI growth rate. The exact relationship between the two still needs to be further experimentally investigated with a test with a higher SOC density. Figure 20b shows the recharge current due to the voltage slippery effect at an approximated SEI growth rate with respect to the SOC, and Figure 20c shows the recharge current with respect to the cell voltage. Generally, the recharge current is significantly smaller than the SEI growth rate.
Figure 21a shows the corresponding results for SAN. For simplicity, we assume a linear approximated SEI growth rate as well over most of the SOC range. Only at very high SOCs is the approximated SEI growth rate expected to increase with a higher slope. Figure 21b shows the recharge current due to the voltage slippery effect under this assumption. Overall, the recharge currents are small. In the high SOC section, regardless of the curve of the SEI growth rate, the recharge current caused by SEI growth is negligible. Figure 21c shows an identical behavior of the current curve with the voltage as x-coordinate to the current curve with SOC as x-coordinate in Figure 21b. This is the case for both the PAN and SAN cell.

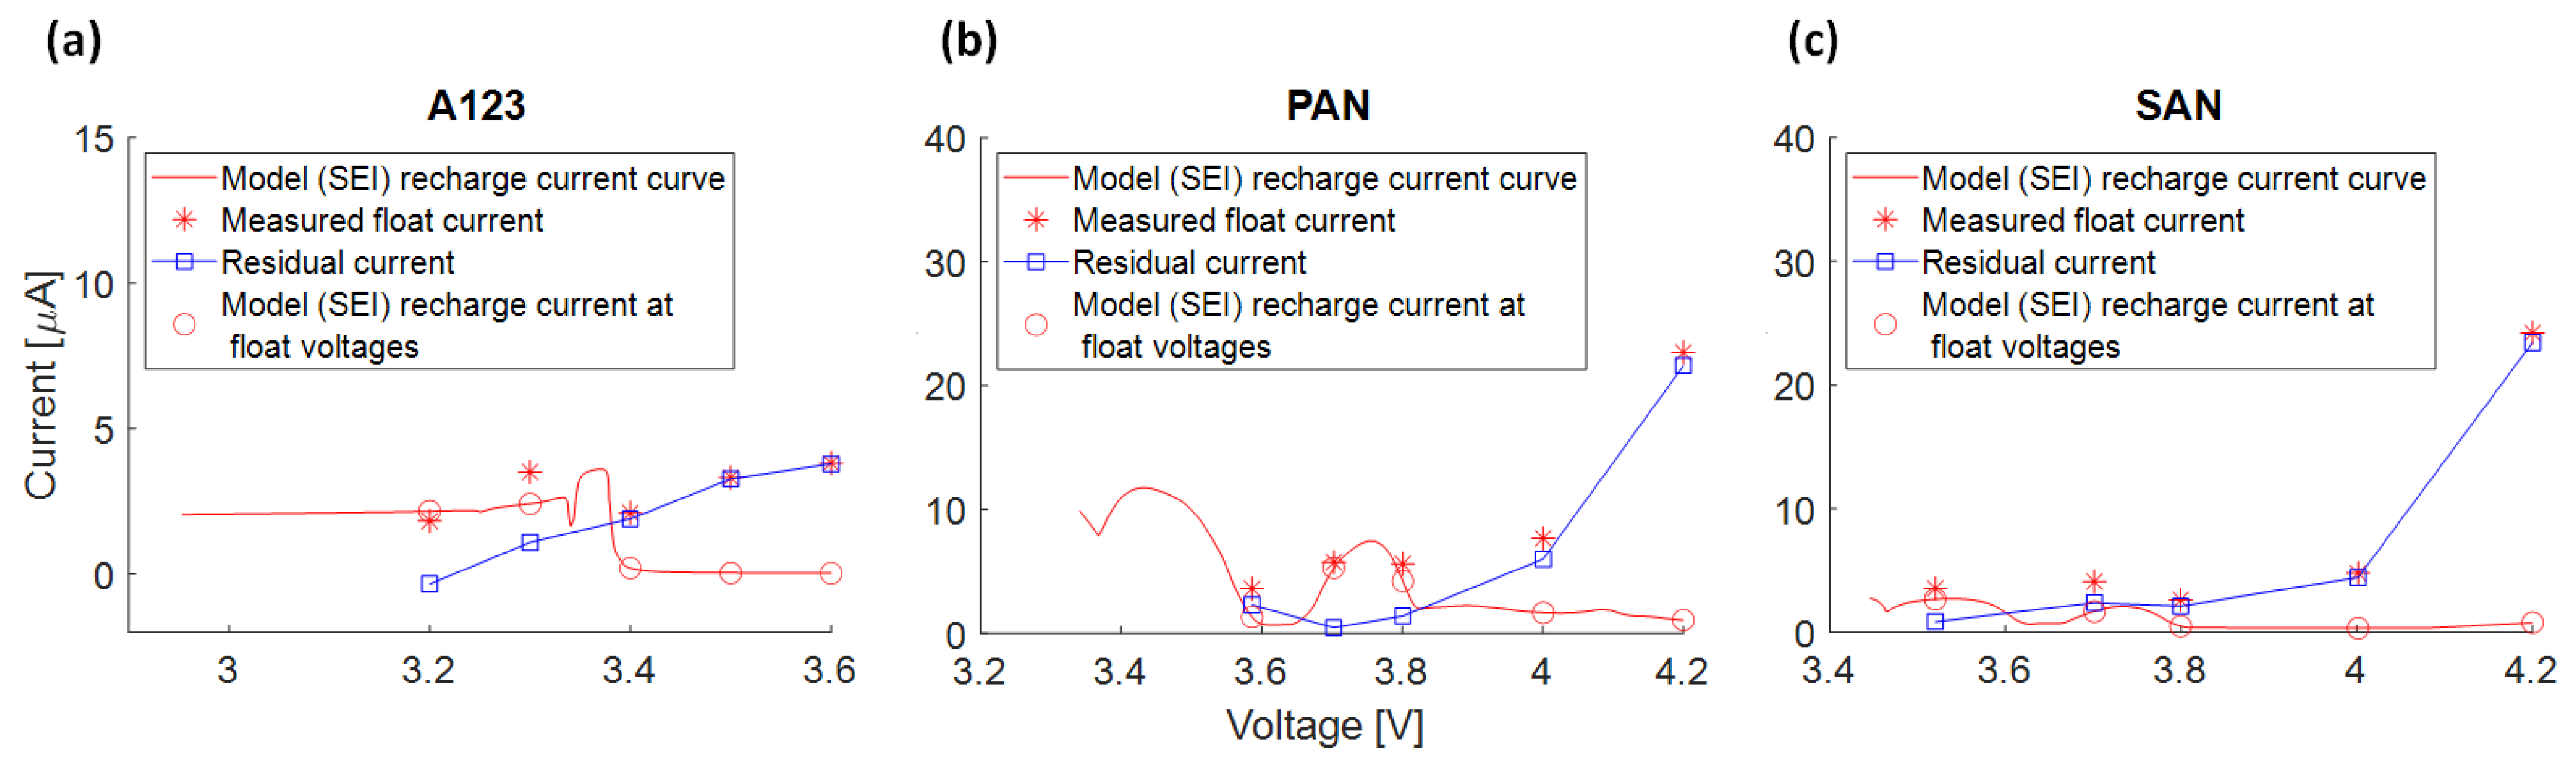
3.4.6. Recharge Current due to SEI Growth and Measured Float Current

This section compares the experimentally measured float current values with the recharge current values calculated by the derived voltage slippery model above.
Figure 22 shows the recharge current from SEI loss (red line), measured float currents (red asterisks) and the deviations named residual current (blue line) for (a) A123, (b) PAN and (c) SAN.
Considering the A123 cell, the residual current shows a clear linear increase with voltage. Only for 3.2 V and 3.296 V, a high agreement of float currents and modeled recharge current is present. For higher test voltages, a float current is measured even though according to the voltage slippery model and theory, no recharge current is expected. Even a variation of the approximated SEI loss rate cannot significantly change this deviation. Thus, at least at high voltages another significant mechanism is expected to contribute to the measured float current.
For the PAN cell in Figure 22b, the measured float current is always higher than the modeled recharge current. Although the agreement is rather low, the modeled increase at 3.7 V and 3.8 V is also visible in the measured float currents. This indicates that the voltage slippery model does not fully explain the measured float currents but has at least a certain contribution. Thus, one or various other effects must be superimposed following the residual current curve in blue.
For the SAN cells in Figure 22c, the trends are very similar to the PAN cell. Only at 3.586 V, there is a high agreement between recharge current and measured float current while at higher test voltages, as for PAN, the float currents are always higher. The high value at 3.7 V is, as for PAN, explainable with the voltage slippery model. Thus, above 3.7 V, another effect needs to explain the residual curve.

3.5. Float Currents Trends over Temperature Steps

To further understand the properties of float currents and to find the root causes, we analyze their temperature dependency. Figure 23 presents data for three cell types, assessing the float current as the temperature was raised from 20 °C to 60 °C in increments of 5 K. After each temperature increase, a waiting phase of 3 days was incorporated to account for entropic effects. For all cell types and voltages, an Arrhenius behavior is observed. Only for very low float currents, some distortion is visible that will be related to the limits of the measurement accuracy. Focusing on higher temperatures, a comparable general trend, as already shown in Figure 7 for 30 °C, is present indicating that even up to 60 °C no significant other effects are triggered, although SEI decomposition is reported above 45 °C [40]. The counterintuitive high float currents of the A123 cell type appear even with a stronger relative magnitude compared to the high voltages.

3.6. Interpretation Approach of Additional Effects Explaining the Residual Current

At first, we summarize the obtained results:
  • Float currents and capacity loss rates align for specific voltages and cell types, with float current values consistently equal to or lower than the capacity loss rate (except for SAN at 4.2 V).
  • The voltage slippery model, triggered by SEI loss current, cannot fully explain float currents, especially at higher cell voltages. This is due to the low anode voltage slope compared to the full cell.
  • The higher capacities observed at high voltages during the 1st and 2nd check-up suggest an effect leading to increased capacities at higher cell voltages.
  • General float current trends are comparable at 30 °C and 60 °C, indicating similar underlying effects.
Thus, we conclude that there must be at least one additional effect contributing marginally at low cell potential and successively more with increasing cell potentials. This effect could potentially lead to an increase in the extractable capacity, which might explain the observed higher capacity loss rates in comparison to the float currents. In the following, we discuss three of the most common and promising effects.
(1) An often-reported aging mechanism is the transition metal dissolution from the cathode where the dissolved transition metals are found in the electrolyte and also deposited on the anode [41,42]. This effect generally results in accelerated SEI formation, with minimal impact on the cathode. An enhanced SEI formation alone cannot account for the recharge current, especially given the anode’s low voltage slope at high SOC, and it would result in an increased pulse resistance. Additionally, as previously discussed, both high temperature and a specific kick-off voltage are prerequisites for transition metal dissolution. Even if this dissolution were to occur, the transition metal quantity involved is relatively minor. When transition metal dissolution [41] takes place, it should elevate the resistance upon its deposition on the anode surface. Consequently, we assume that transition metal dissolution is not a significant factor. This aligns with findings by Ruff et al. [43], who observed that the transition metal mass on the anode side of a battery after 30 days of aging is approximately 1 mg, spanning temperatures from 25 °C to 60 °C and voltages between 3.0 V and 4.2 V. The resulting recharge current from this is around 1 nA, which is considerably less than the charge current in the µA range induced by the SEI increase, even if the reaction might involve two electrons.
(2) A coupled side reaction mentioned recently in the context of float currents by Streck et al. [15], or a shuttle reaction mentioned by Wen et al. [44] and Boetticher et al. [45] would only lead to continuous self-discharge of the cell without the aging of the cell. This would be a simple explanation for the residual current as it increases with cell voltage. However, it would not change the capacity loss rate as it is considered fully reversible.
(3) An effect that would lead to a voltage decay as well is the lithiation of the cathode active material by electrolyte decomposition, called cathode lithiation. This would change the “scaling factor” to “1-scaling factor” as now the cathode voltage slope compared to the full-cell slope is significant, leading to no impact at low SOCs and an impact at high SOCs. Moreover, the capacity loss rate would be lowered by the lithiation of the cathode reducing the gap between capacity loss rate and float currents. Based on the data measured by Keil et al. [46], the magnitude of cathode lithiation rate is close to the SEI growth rate.
In summary, both a shuttle reaction and cathode lithiation offer plausible explanations for the observed float currents, but further clarification is needed based on the data presented in this publication. As the shuttle reaction is conceptually simpler and does not require a scaling factor, our subsequent discussion will focus solely on the implications of cathode lithiation.

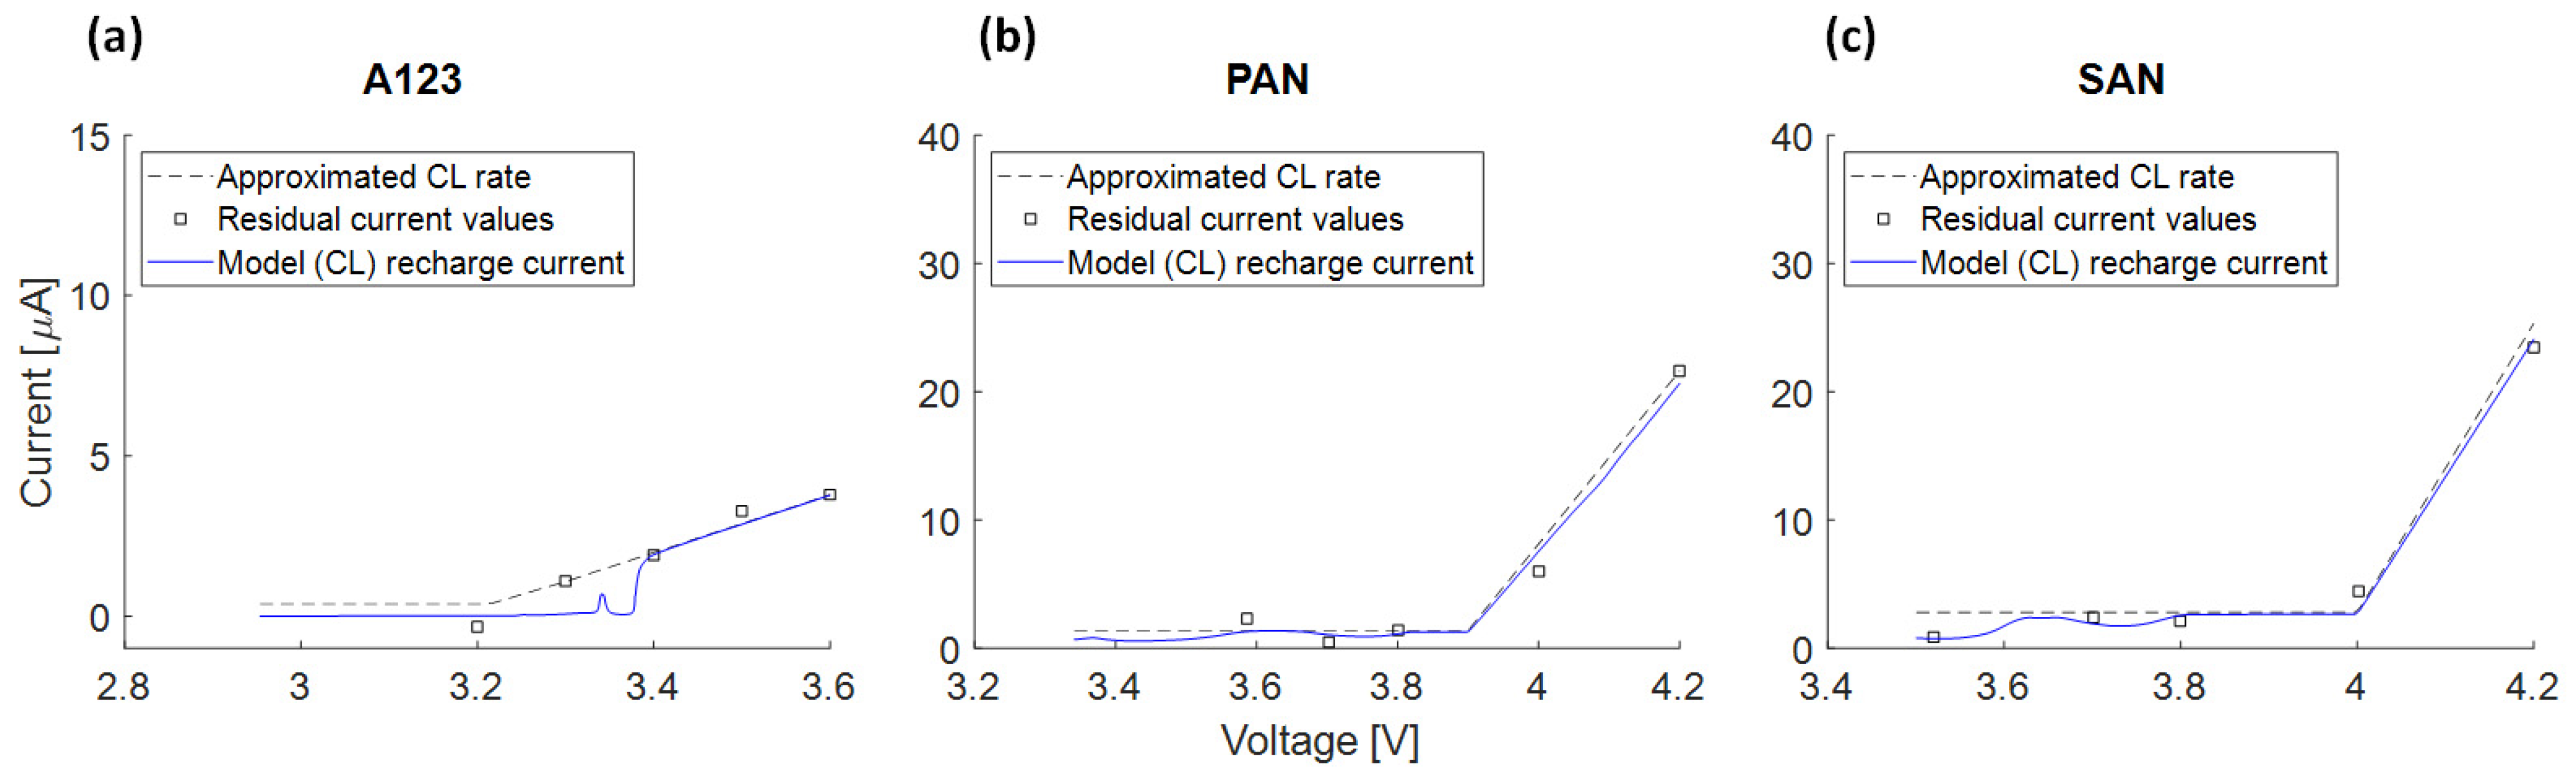
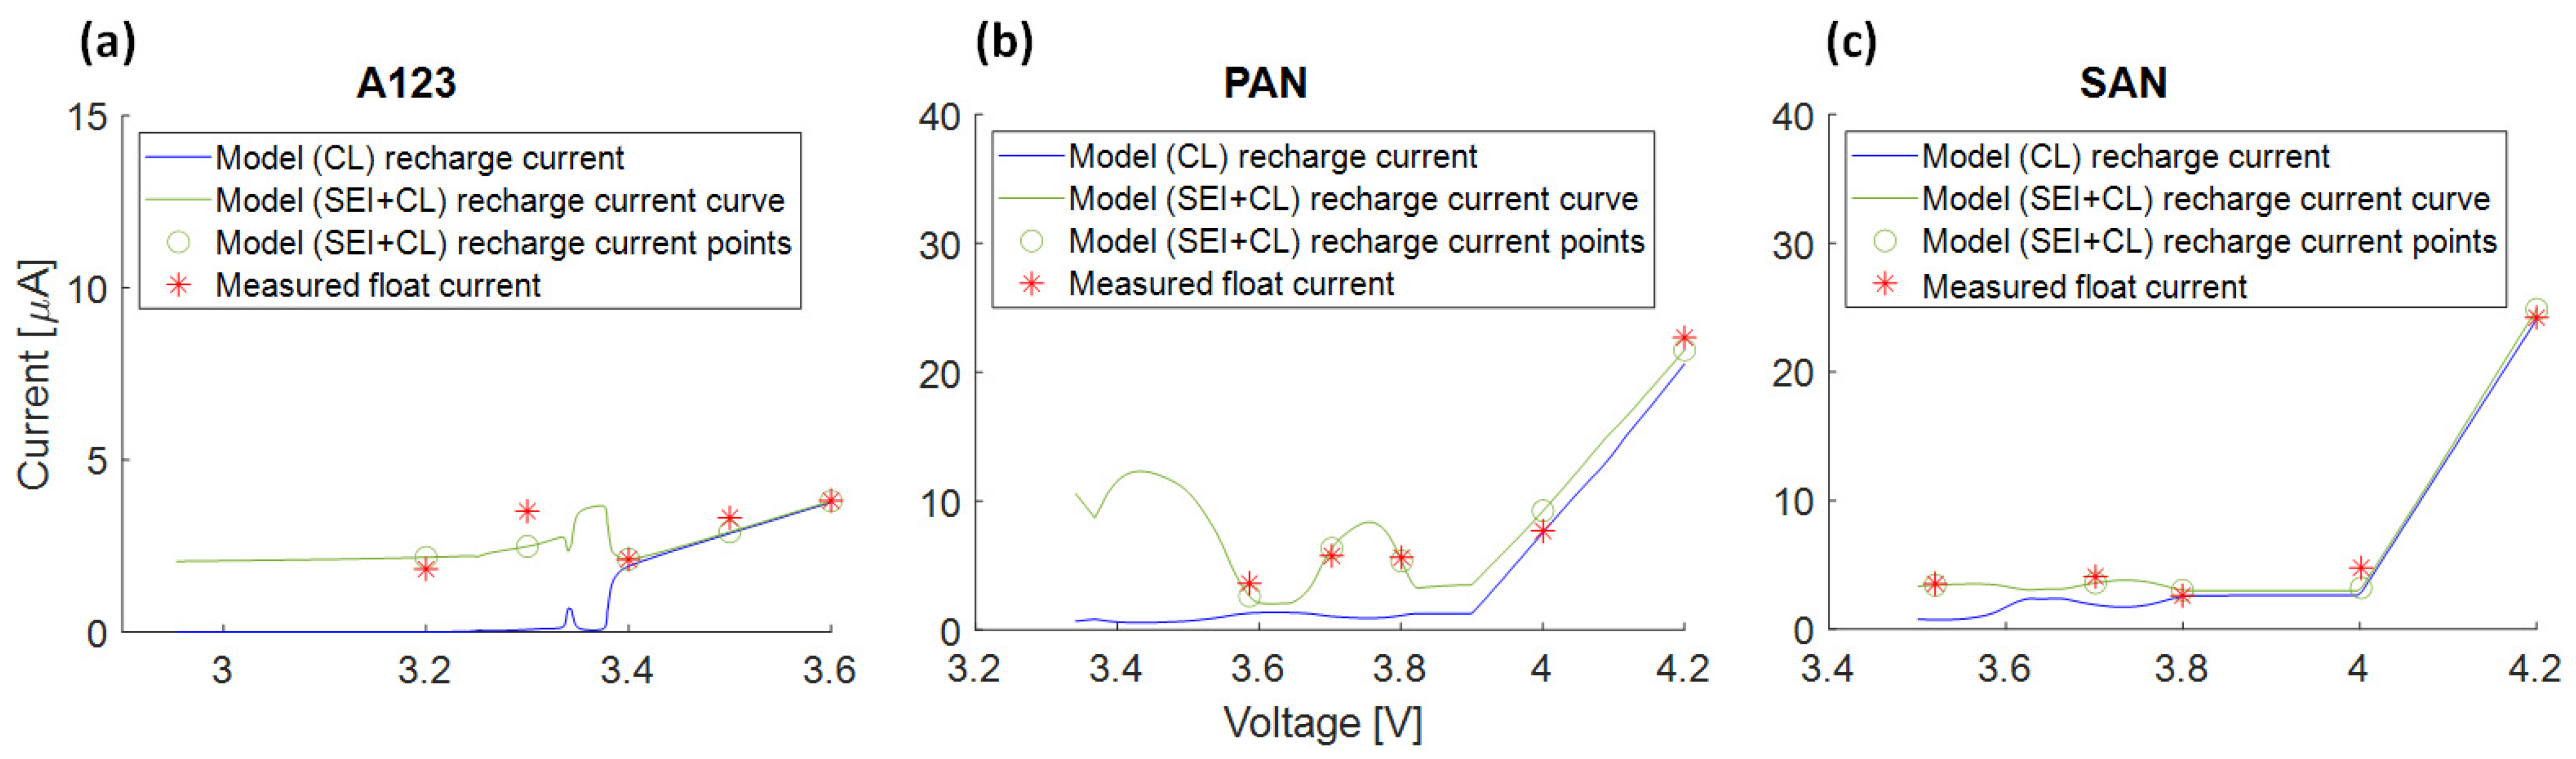
Integration of Cathode Lithiation in the Voltage Slippery Model

In the following, we assume solely that the cathode lithiation leads to the residual current. We presume that the lithiation rate of the cathode increases linearly with voltage within the high voltage range, while having a constant value in the lower voltage range. The voltage slippery model is employed to simulate the two linear cathode lithiation effects and the “1-scaling factor”, representing the effect of the recharge current for all three cells.
Figure 24a shows the assumed lithiation rate of the cathode of the A123 cell. The result shows that, despite of the value of the cathode lithiation rate, the recharge current is negligible within low/middle SOC/voltage ranges. At a high SOC/voltage range, the recharge current is very close to the lithiation rate of the cathode. Comparable results are obtained for PAN in Figure 24b and SAN in Figure 24c with a steeper slope at high voltages.
In Figure 25, the measured float currents (red asterisks), the recharge current of the A123 cell caused solely by cathode lithiation (blue) and the superposition of cathode lithiation and SEI multiplied with the respective scaling factor (green) is given for (a) A123, (b) PAN and (c) SAN. Comparing the two-aging-effect model (green circles) with the measured float currents (red asterisks), one observes a high agreement with only small deviations that might be addressed by optimizing the model parameters. Another effect of cathode lithiation by electrolyte decomposition is a capacity increase as decomposed conductive salt increases the amount of active lithium. As the measured capacity is true, the corresponding SEI losses at high voltages would be higher than the measured capacity loss rate. A deeper analysis will be the scope of upcoming papers.

4. Conclusions

In this paper, we aimed to identify the root cause of float current analysis by modeling SEI formation losses through the voltage slippery effect. We investigated three distinct cell types, each at 30 °C spanning a broad voltage range.
As a first step, we compared the measured float currents to the current derived from the capacity loss rate, excluding the anode overhang effect. Generally, the derived current from the capacity loss rate is either equal to or greater than the measured float current.
This model utilized experimentally measured battery voltage curves, which were then separated into two distinct electrode curves within the model. As per Equation (1), the scaling factor between the recharge current, influenced by the voltage slippery, and the SEI growth rate is ascertained by evaluating the slopes of the anode and cathode half-cells. We estimated the SEI growth rate using experimental data from the capacity test. According to the DVA, only active lithium is lost during this test.
When comparing the modeled recharge current, attributed solely to the growth of SEI, with the measured float current, we observed an agreement only at low SOC. At higher SOCs, the model predicts minimal recharge current due to the flat nature of the anode voltage curve. Hence, we explored additional effects that might account for the observed discrepancies, termed as residual currents.
One potential explanation for this deviation could be the lithiation of the cathode. When incorporated into the voltage slippery model, it showed a strong alignment between the measured float current and the modeled recharge current. Another possible explanation could be a coupled side reaction occurring between both electrodes. To verify this, we need to gather more experimental data and undergo additional tests to find out the specific reaction causing the deviation between capacity measurement and float current.
The analysis makes a significant contribution to understanding the calendar aging of lithium-ion cells. With our method, it will be possible to determine the causes of aging processes in these cells by supplementing the results with standard capacity tests. To this end, we are developing a test unit with higher precision and temperature stability that will enable a comprehensive characterization of the behavior of lithium-ion cells in a variety of scenarios, including their responses under different temperature profiles.

Author Contributions

Conceptualization, M.L. and C.E.; methodology, M.L. and M.A.; validation, M.L. and M.A.; formal analysis, M.L. and M.A.; investigation, M.L. and M.A.; resources, M.L. and C.E.; data curation, M.L. and M.A.; writing—original draft preparation, M.A.; writing—review and editing, M.L.; supervision, M.L. and M.A.; project administration, M.L. and C.E.; funding acquisition, M.L. and C.E. All authors have read and agreed to the published version of the manuscript.

Funding

The research is funded by two projects. (1) Grant number: 440701024 funded by German Research Foundation (DFG); (2) Grant number: 03XP0442 funded by German Federal Ministry of Education and Research (BMBF).

Data Availability Statement

The data presented in this study are available on request from the corresponding author. The data are not publicly available due to privacy.

Acknowledgments

Special thanks for the preliminary work to Fan Xue and for the fruitful discussion and support to Moritz Ehrensberger, Katharina Golder, and Simon Diehl.

Conflicts of Interest

The authors declare no conflict of interest.

Appendix

Appendix A.1. PAN

Figure A1. Charge/Discharge OCV voltage curves. (a) Original data; (b) curve with extrapolated points at high voltage for the PAN cell.
Batteries 10 00003 g0a1
Figure A2. (a) Charge, discharge, and average differential voltage curve; (b) charge, discharge, and average voltage curve for the PAN cell.
Batteries 10 00003 g0a2

Appendix A.2. SAN

Figure A3. Charge/Discharge OCV voltage curves. (a) Original data; (b) curve with extrapolated points at high voltage for the SAN cell.
Batteries 10 00003 g0a3
Figure A4. (a) Charge, discharge, and average differential voltage curve; (b) charge, discharge, and average voltage curve for the SAN cell.
Batteries 10 00003 g0a4

References

  1. Johnen, M.; Pitzen, S.; Kamps, U.; Kateri, M.; Dechent, P.; Sauer, D.U. Modeling long-term capacity degradation of lithium-ion batteries. J. Energy Storage 2021, 34, 102011. [Google Scholar] [CrossRef]
  2. Marquis, S.G. Long-Term Degration of Lithium-Ion Batteries. Ph.D. Thesis, St Anne’s College, University of Oxford, Oxford, UK, 2020. [Google Scholar]
  3. Barré, A.; Deguilhem, B.; Grolleau, S.; Gérard, M.; Suard, F.; Riu, D. A review on lithium-ion battery ageing mechanisms and estimations for automotive applications. J. Power Sources 2013, 241, 680–689. [Google Scholar] [CrossRef]
  4. Kassem, M.; Delacourt, C. Postmortem analysis of calendar-aged graphite/LiFePO4 cells. J. Power Sources 2013, 235, 159–171. [Google Scholar] [CrossRef]
  5. Birkl, C.R.; Roberts, M.R.; McTurk, E.; Bruce, P.G.; Howey, D.A. Degradation diagnostics for lithium ion cells. J. Power Sources 2017, 341, 373–386. [Google Scholar] [CrossRef]
  6. Naumann, M.; Schimpe, M.; Keil, P.; Hesse, H.C.; Jossen, A. Analysis and modeling of calendar aging of a commercial LiFePO4/graphite cell. J. Energy Storage 2018, 17, 153–169. [Google Scholar] [CrossRef]
  7. Ecker, M.; Gerschler, J.B.; Vogel, J.; Käbitz, S.; Hust, F.; Dechent, P.; Sauer, D.U. Development of a lifetime prediction model for lithium-ion batteries based on extended accelerated aging test data. J. Power Sources 2012, 215, 248–257. [Google Scholar] [CrossRef]
  8. Mingant, R.; Bernard, J.; Sauvant Moynot, V.; Delaille, A.; Mailley, S.; Hognon, J.-L.; Huet, F. EIS Measurements for Determining the SoC and SoH of Li-Ion Batteries. ECS Trans. 2011, 33, 41–53. [Google Scholar] [CrossRef]
  9. Keil, P.; Schuter, S.F.; Wilhelm, J.; Travi, J.; Hauser, A.; Katl, R.C.; Jossen, A. Calendar Aging of Lithium-Ion Batteries: I. Impact of the Graphite Anode on Capacity Fade. J. Electrochem. Soc. 2016, 163, A1872–A1880. [Google Scholar] [CrossRef]
  10. Jalkanen, K.; Karppinen, J.; Skogström, L.; Laurila, T.; Nisula, M.; Vuorilehto, K. Cycle aging of commercial NMC/graphite pouch cells at different temperatures. Appl. Energy 2015, 154, 160–172. [Google Scholar] [CrossRef]
  11. Guan, T.; Sun, S.; Gao, Y.; Du, C.; Zuo, P.; Cui, Y.; Zhang, L.; Yin, G. The effect of elevated temperature on the accelerated aging of LiCoO2/mesocarbon microbeads batteries. Appl. Energy 2016, 177, 1–10. [Google Scholar] [CrossRef]
  12. Lewerenz, M.; Käbitz, S.; Knips, M.; Münnix, J.; Schmalstieg, J.; Warnecke, A.; Sauer, D.U. New method evaluating currents keeping the voltage constant for fast and highly resolved measurement of Arrhenius relation and capacity fade. J. Power Sources 2017, 353, 144–151. [Google Scholar] [CrossRef]
  13. Theiler, M.; Endisch, C.; Lewerenz, M. Float Current Analysis for Fast Calendar Aging Assessment of 18650 Li(NiCoAl)O2/Graphite Cells. Batteries 2021, 7, 22. [Google Scholar] [CrossRef]
  14. Käbitz, S.; Gerschler, J.B.; Ecker, M.; Yurdagel, Y.; Emmermacher, B.; André, D.; Mitsch, T.; Sauer, D.U. Cycle and calendar life study of a graphite|LiNi1/3Mn1/3Co1/3O2 Li-ion high energy system. Part A: Full cell characterization. J. Power Sources 2013, 239, 572–583. [Google Scholar] [CrossRef]
  15. Streck, L.; Roth, T.; Keil, P.; Strehle, B.; Ludmann, S.; Jossen, A. A Comparison of Voltage Hold and Voltage Decay Methods for Side Reactions Characterization. J. Electrochem. Soc. 2023, 170, 40520. [Google Scholar] [CrossRef]
  16. Belov, D.; Yang, M.-H. Failure mechanism of Li-ion battery at overcharge conditions. J. Solid State Electrochem. 2008, 12, 885–894. [Google Scholar] [CrossRef]
  17. Azzam, M.; Ehrensberger, M.; Scheuer, R.; Endisch, C.; Lewerenz, M. Long-Term Self-Discharge Measurements and Modelling for Various Cell Types and Cell Potentials. Energies 2023, 16, 3889. [Google Scholar] [CrossRef]
  18. Gyenes, B.; Stevens, D.A.; Chevrier, V.L.; Dahn, J.R. Understanding Anomalous Behavior in Coulombic Efficiency Measurements on Li-Ion Batteries. J. Electrochem. Soc. 2015, 162, A278–A283. [Google Scholar] [CrossRef]
  19. Zilberman, I.; Sturm, J.; Jossen, A. Reversible self-discharge and calendar aging of 18650 nickel-rich, silicon-graphite lithium-ion cells. J. Power Sources 2019, 425, 217–226. [Google Scholar] [CrossRef]
  20. Lewerenz, M.; Münnix, J.; Schmalstieg, J.; Käbitz, S.; Knips, M.; Sauer, D.U. Systematic aging of commercial LiFePO4|Graphite cylindrical cells including a theory explaining rise of capacity during aging. J. Power Sources 2017, 345, 254–263. [Google Scholar] [CrossRef]
  21. Roth, T.; Streck, L.; Graule, A.; Niehoff, P.; Jossen, A. Relaxation Effects in Self-Discharge Measurements of Lithium-Ion Batteries. J. Electrochem. Soc. 2023, 170, 20502. [Google Scholar] [CrossRef]
  22. Schulze, M.C.; Rodrigues, M.-T.F.; McBrayer, J.D.; Abraham, D.P.; Apblett, C.A.; Bloom, I.; Chen, Z.; Colclasure, A.M.; Dunlop, A.R.; Fang, C.; et al. Critical Evaluation of Potentiostatic Holds as Accelerated Predictors of Capacity Fade during Calendar Aging. J. Electrochem. Soc. 2022, 169, 50531. [Google Scholar] [CrossRef]
  23. Deutschen, T.; Gasser, S.; Schaller, M.; Siehr, J. Modeling the self-discharge by voltage decay of a NMC/graphite lithium-ion cell. J. Energy Storage 2018, 19, 113–119. [Google Scholar] [CrossRef]
  24. Jannesari, H.; Emami, M.D.; Ziegler, C. Effect of electrolyte transport properties and variations in the morphological parameters on the variation of side reaction rate across the anode electrode and the aging of lithium ion batteries. J. Power Sources 2011, 196, 9654–9664. [Google Scholar] [CrossRef]
  25. Sarasketa-Zabala, E.; Gandiaga, I.; Rodriguez-Martinez, L.M.; Villarreal, I. Calendar ageing analysis of a LiFePO4/graphite cell with dynamic model validations: Towards realistic lifetime predictions. J. Power Sources 2014, 272, 45–57. [Google Scholar] [CrossRef]
  26. Sarasketa-Zabala, E.; Martinez-Laserna, E.; Berecibar, M.; Gandiaga, I.; Rodriguez-Martinez, L.M.; Villarreal, I. Realistic lifetime prediction approach for Li-ion batteries. Appl. Energy 2016, 162, 839–852. [Google Scholar] [CrossRef]
  27. Vermeer, W.; Chandra Mouli, G.R.; Bauer, P. A Comprehensive Review on the Characteristics and Modeling of Lithium-Ion Battery Aging. IEEE Trans. Transp. Electrific. 2022, 8, 2205–2232. [Google Scholar] [CrossRef]
  28. Vetter, J.; Novák, P.; Wagner, M.R.; Veit, C.; Möller, K.-C.; Besenhard, J.O.; Winter, M.; Wohlfahrt-Mehrens, M.; Vogler, C.; Hammouche, A. Ageing mechanisms in lithium-ion batteries. J. Power Sources 2005, 147, 269–281. [Google Scholar] [CrossRef]
  29. An, S.J.; Li, J.; Daniel, C.; Mohanty, D.; Nagpure, S.; Wood, D.L. The state of understanding of the lithium-ion-battery graphite solid electrolyte interphase (SEI) and its relationship to formation cycling. Carbon 2016, 105, 52–76. [Google Scholar] [CrossRef]
  30. German, F.; Hintennach, A.; LaCroix, A.; Thiemig, D.; Oswald, S.; Scheiba, F.; Hoffmann, M.J.; Ehrenberg, H. Influence of temperature and upper cut-off voltage on the formation of lithium-ion cells. J. Power Sources 2014, 264, 100–107. [Google Scholar] [CrossRef]
  31. Weppner, W.; Huggins, R.A. Electrochemical Methods for Determining Kinetic Properties of Solids. Annu. Rev. Mater. Sci. 1978, 8, 269–311. [Google Scholar] [CrossRef]
  32. Knap, V.; Stroe, D.-I. Effects of open-circuit voltage tests and models on state-of-charge estimation for batteries in highly variable temperature environments: Study case nano-satellites. J. Power Sources 2021, 498, 229913. [Google Scholar] [CrossRef]
  33. Barai, A.; Widanage, W.D.; Marco, J.; McGordon, A.; Jennings, P. A study of the open circuit voltage characterization technique and hysteresis assessment of lithium-ion cells. J. Power Sources 2015, 295, 99–107. [Google Scholar] [CrossRef]
  34. Marongiu, A.; Nußbaum, F.G.W.; Waag, W.; Garmendia, M.; Sauer, D.U. Comprehensive study of the influence of aging on the hysteresis behavior of a lithium iron phosphate cathode-based lithium ion battery—An experimental investigation of the hysteresis. Appl. Energy 2016, 171, 629–645. [Google Scholar] [CrossRef]
  35. Roscher, M.A.; Bohlen, O.; Vetter, J. OCV Hysteresis in Li-Ion Batteries including Two-Phase Transition Materials. Int. J. Electrochem. 2011, 2011, 984320. [Google Scholar] [CrossRef]
  36. Simolka, M.; Heger, J.-F.; Traub, N.; Kaess, H.; Friedrich, K.A. Influence of Cycling Profile, Depth of Discharge and Temperature on Commercial LFP/C Cell Ageing: Cell Level Analysis with ICA, DVA and OCV Measurements. J. Electrochem. Soc. 2020, 167, 110502. [Google Scholar] [CrossRef]
  37. Safari, M.; Delacourt, C. Aging of a Commercial Graphite/LiFePO4 Cell. J. Electrochem. Soc. 2011, 158, A1123. [Google Scholar] [CrossRef]
  38. Ando, K.; Matsuda, T.; Imamura, D. Degradation diagnosis of lithium-ion batteries with a LiNi0.5Co0.2Mn0.3O2 and LiMn2O4 blended cathode using dV/dQ curve analysis. J. Power Sources 2018, 390, 278–285. [Google Scholar] [CrossRef]
  39. Fath, J.P.; Dragicevic, D.; Bittel, L.; Nuhic, A.; Sieg, J.; Hahn, S.; Alsheimer, L.; Spier, B.; Wetzel, T. Quantification of aging mechanisms and inhomogeneity in cycled lithium-ion cells by differential voltage analysis. J. Energy Storage 2019, 25, 100813. [Google Scholar] [CrossRef]
  40. Yoon, T.; Milien, M.S.; Parimalam, B.S.; Lucht, B.L. Thermal Decomposition of the Solid Electrolyte Interphase (SEI) on Silicon Electrodes for Lithium Ion Batteries. Chem. Mater. 2017, 29, 3237–3245. [Google Scholar] [CrossRef]
  41. Sahore, R.; O’Hanlon, D.C.; Tornheim, A.; Lee, C.-W.; Garcia, J.C.; Iddir, H.; Balasubramanian, M.; Bloom, I. Revisiting the Mechanism Behind Transition-Metal Dissolution from Delithiated LiNixMnyCozO2 (NMC) Cathodes. J. Electrochem. Soc. 2020, 167, 20513. [Google Scholar] [CrossRef]
  42. Eldesoky, A.; Logan, E.R.; Johnson, M.B.; McFarlane, C.R.M.; Dahn, J.R. Scanning Micro X-ray Fluorescence (μXRF) as an Effective Tool in Quantifying Fe Dissolution in LiFePO4 Cells: Towards a Mechanistic Understanding of Fe Dissolution. J. Electrochem. Soc. 2020, 167, 130539. [Google Scholar] [CrossRef]
  43. Ruff, Z.; Xu, C.; Grey, C.P. Transition Metal Dissolution and Degradation in NMC811-Graphite Electrochemical Cells. J. Electrochem. Soc. 2021, 168, 60518. [Google Scholar] [CrossRef]
  44. Wen, J.; Yu, Y.; Chen, C. A Review on Lithium-Ion Batteries Safety Issues: Existing Problems and Possible Solutions. Mater. Express 2012, 2, 197–212. [Google Scholar] [CrossRef]
  45. Boetticher, T.; Adamson, A.; Buechele, S.; Alter, E.D.; Metzger, M. Understanding the Self-Discharge Redox Shuttle Mechanism of Dimethyl Terephthalate in Lithium-Ion Batteries. J. Electrochem. Soc. 2023, 170, 60507. [Google Scholar] [CrossRef]
  46. Keil, P.; Jossen, A. Calendar Aging of NCA Lithium-Ion Batteries Investigated by Differential Voltage Analysis and Coulomb Trackin. J. Electrochem. Soc. 2017, 164, A6066–A6074. [Google Scholar] [CrossRef]
Figure 1. Measurement procedure for each cell is illustrated.
Batteries 10 00003 g001
Figure 2. Theoretical illustration of the state change during the voltage hold, when SEI growth (black) occurs on the anode side. Therefore, a voltage decay of the purple to the yellow arrow is assumed forcing the cathode curve to shift to the left. The recharge (light blue) can only be active until the same hold voltage, i.e. arrow length, is reached (green and purple).
Batteries 10 00003 g002
Figure 3. Illustration for the influence of the slope of electrode voltage curves on the recharge current and SEI growth rate: (a) Anode slope is 0.2 V/Ah, cathode slope is 0.2 V/Ah; (b) Anode slope is 1 V/Ah, cathode slope is 0.02 V/Ah; (c) Anode slope is 0.02 V/Ah, cathode slope is 1 V/Ah.
Batteries 10 00003 g003
Figure 4. (a) Normalized capacity and (b) pulse resistance trends measured in check-ups for the A123 cell are presented. The grey background symbolizes the part strongly influenced by the anode overhang effect. The blue slope triangle demonstrates how the irreversible loss is linearly approximated.
Batteries 10 00003 g004
Figure 5. (a) Normalized capacity loss (b) and normalized resistance change measured in check-ups for the PAN cell are presented. The grey background symbolizes the part strongly influenced by the anode overhang effect. The red slope triangle demonstrates how the irreversible loss is linearly approximated.
Batteries 10 00003 g005
Figure 6. (a) Normalized capacity loss and (b) normalized resistance change measured in check-ups for the SAN cell are presented. The grey background symbolizes the part strongly influenced by the anode overhang effect. The green slope triangle demonstrates how the irreversible loss is linearly approximated.
Batteries 10 00003 g006
Figure 7. Comparison between values obtained in check-up and steady-state float current for the (a) A123 cell, (b) PAN cell and (c) SAN cell. The colors are chosen the same as already used in the Figure 4, Figure 5 and Figure 6. The error bars for the float currents return the lowest and highest value measured in the entire period of interest. To improve visibility, float currents and capacity loss rates are slightly shifted to each other in x-direction.
Batteries 10 00003 g007
Figure 8. DVA measurements over check-ups at different float voltages during charging for the A123 cell are presented.
Batteries 10 00003 g008
Figure 9. DVA measurements at different float voltages during charging for the PAN cell are presented.
Batteries 10 00003 g009
Figure 10. DVA measurements at different float voltages during charging for the SAN cell are presented.
Batteries 10 00003 g010
Figure 11. Cell analysis steps based on the voltage slippery effect are illustrated.
Batteries 10 00003 g011
Figure 12. (a) Charge/Discharge voltage test with GITT of the A123 cell; (b) zoomed-in figure.
Batteries 10 00003 g012
Figure 13. Charge/Discharge OCV voltage curves. (a) Original data; (b) curve with extrapolated points at high voltage for the A123 cell.
Batteries 10 00003 g013
Figure 14. (a) Charge, discharge, and average differential voltage curve; (b) charge, discharge, and average voltage curve for the A123 cell.
Batteries 10 00003 g014
Figure 15. (a) Half-cell DVA curves; (b) half-cell voltage curves for the A123 cell.
Batteries 10 00003 g015
Figure 16. (a) Half-cell DVA curves; (b) half-cell voltage curves for the PAN cell.
Batteries 10 00003 g016
Figure 17. (a) Half-cell DVA curves; (b) half-cell voltage curves for the SAN cell.
Batteries 10 00003 g017
Figure 18. Scaling factor of the anode to full-cell voltage slopes of (a) A123, (b) PAN, and (c) SAN with the test voltages marked.
Batteries 10 00003 g018
Figure 19. (a) SEI growth rate versus SOC and approximated SEI growth rate. (b) Approximated SEI rate and corresponding recharge current in SOC view and (c) in voltage view for the A123 cell.
Batteries 10 00003 g019
Figure 20. (a) SEI growth rate versus SOC and approximated SEI growth rate. (b) Approximated SEI rate and corresponding recharge current in SOC view and (c) in voltage view for the PAN cell.
Batteries 10 00003 g020
Figure 21. (a) SEI growth rate versus SOC and approximated SEI growth rate. (b) Approximated SEI rate and corresponding recharge current in SOC view and (c) in voltage view for the SAN cell.
Batteries 10 00003 g021
Figure 22. The difference between the modeled recharge current (red line) and the measured float current (red asterisks) over voltage is named residual current (blue line) for all three cell types.
Batteries 10 00003 g022
Figure 23. Measured float current normalized to the nominal capacity at different voltages increasing the temperature stepwise from 20 to 60 °C with a rest period of two to three days for each step: (a) A123, (b) PAN and (c) SAN.
Batteries 10 00003 g023
Figure 24. Approximated assumed lithiation rate of the cathode (CL) and its recharge current for all three cell types.
Batteries 10 00003 g024
Figure 25. The modeled recharge current based on cathode lithiation (CL) alone (blue) and combined with SEI to compare to the measured float current (red asterisks) for all three cell types.
Batteries 10 00003 g025
Table 1. Specifications of the three used battery cell types are presented.
Short NameA123PANSAN
ProducerA123PanasonicSanyo
Cell typeAPR18650M-A1NCR18650BUR18650AAN
CathodeLFP:
LiFePO4
NCA:
Li(Ni0.81Co0.16Al0.03)O2
NMC:
Li(NixMnyCoz)O2
AnodeGraphiteGraphiteGraphite
Nom. capacity1.1 Ah3.2 Ah2.15 Ah
Nom. voltage3.3 V3.6 V3.6 V
Storage voltage (SOC) before test3.296 V (26%)3.586 V (28%)3.520 V (14%)
Examined float voltages3.2 V, 3.296 V,
3.4 V, 3.5 V, 3.6 V
3.586 V, 3.7 V,
3.8 V, 4.0 V, 4.2 V
3.520 V, 3.7 V
3.8 V, 4.0 V, 4.2 V, 4.2 V
Disclaimer/Publisher’s Note: The statements, opinions and data contained in all publications are solely those of the individual author(s) and contributor(s) and not of MDPI and/or the editor(s). MDPI and/or the editor(s) disclaim responsibility for any injury to people or property resulting from any ideas, methods, instructions or products referred to in the content.

