Article

Voltage and Overpotential Prediction of Vanadium Redox Flow Batteries with Artificial Neural Networks

by
Joseba Martínez-López
1,
Koldo Portal-Porras
1,
Unai Fernández-Gamiz
1,*,
Eduardo Sánchez-Díez
2,
Javier Olarte
2 and
Isak Jonsson
3
1
Nuclear Engineering and Fluid Mechanics Department, University of the Basque Country UPV/EHU, Nieves Cano 12, 01006 Vitoria-Gasteiz, Spain
2
Centre for Cooperative Research on Alternative Energies (CIC EnergiGUNE), Basque Research and Technology Alliance (BRTA), Alava Technology Park, Albert Einstein 48, 01510 Vitoria-Gasteiz, Spain
3
Department of Mechanics and Maritime Sciences, Division of Fluid Dynamics, Chalmers University of Technology, SE-41296 Gothenburg, Sweden
*
Author to whom correspondence should be addressed.
Batteries 2024, 10(1), 23; https://doi.org/10.3390/batteries10010023
Submission received: 4 December 2023 / Revised: 27 December 2023 / Accepted: 4 January 2024 / Published: 9 January 2024

Abstract

:
This article explores the novel application of a trained artificial neural network (ANN) in the prediction of vanadium redox flow battery behaviour and compares its performance with that of a two-dimensional numerical model. The aim is to evaluate the capability of two ANNs, one for predicting the cell potential and one for the overpotential under various operating conditions. The two-dimensional model, previously validated with experimental data, was used to generate data to train and test the ANNs. The results show that the first ANN precisely predicts the cell voltage under different states of charge and current density conditions in both the charge and discharge modes. The second ANN, which is responsible for the overpotential calculation, can accurately predict the overpotential across the cell domains, with the lowest confidence near high-gradient areas such as the electrode membrane and domain boundaries. Furthermore, the computational time is substantially reduced, making ANNs a suitable option for the fast understanding and optimisation of VRFBs.

1. Introduction

Deploying effective and scalable energy storage systems is becoming increasingly important as we move toward carbon-neutral emissions and a sustainable energy future [1,2]. The integration of intermittent renewable energy sources into our energy infrastructure is imperative, considering the commitment to achieve carbon neutrality. The development of large-scale energy storage systems is vital for this integration and maximising the use of renewable resources while maintaining the stability of the electric grid. Redox flow batteries (RFBs) have become one of the front-runners among the several available choices [3,4,5,6]. They are distinguished by the separation of the energy storage capacity from the power output, because RFBs store energy in chemical solutions contained in external tanks, allowing the capacity to be scaled independently of the power density [7,8]. This decoupling of energy and power renders RFBs exceptionally flexible for a wide range of applications.
Arguably, vanadium-based redox flow batteries (VRFBs) are the most promising technology for commercial implementation [9,10]. Invented by M. Skyllas-Kazacos et al. [11] in the 1980s, VRFBs employ only one single element, vanadium, in different oxidation states for both electrolytes, thus reducing the cross-contamination risk [12]. Moreover, VRFB systems exhibit noteworthy characteristics in terms of cyclability, energy efficiency, response time, safe operation, remarkable energy storage capability, and incorporating readily recyclable components to minimize overall costs over the system lifetime [11,13,14,15,16,17]. This sets them apart from other RFB technologies, such as zinc-based chemistries, which present hydrogen evolution in charging, dendrite formation, and uneven metal deposition, which then lead to cell failure [3,18,19]. Organic-based RFBs have gained attention for their use of abundant, non-expensive organic compounds, but they still face challenges arising from cycling stability and reactant decomposition [6,20,21]. A more in-depth investigation is imperative to consolidate this technology for future scalability and commercial implementation.
Figure 1 depicts a visual representation of a single cell from a VRFB. The electrolytes are stored in two separate tanks. The positive electrolyte contains VO+2 and VO2+ ions, while the negative electrolyte has V2+ and V3+ ions. Both electrolytes are recirculated by pumps into the cell. The electrodes, inside the cell, provide an active area for the electrochemical redox reactions to occur. To prevent cross-contamination and allow for protons to pass and preserve the charge conservation, an ion-selective membrane is added between both electrodes [22].
The chemical reactions occurring in the half-cells and the full cell are as follows:
Cathode :   V O 2 + + 2 H + +   e charge discharge V O 2 + + H 2 O
Anode :   V 2 + charge discharge V 3 + + e
Full   cell :   V O 2 + + V 2 + + 2 H + charge discharge V O 2 + + V 3 + + H 2 O
The experimental evaluation of VRFB performance is the conventional approach to assess performance, but it has a considerable financial burden. As the use of VRFBs in various applications has become increasingly popular, there is a growing need for cost-effective methods and strategies to understand and optimise their performance and system integration. Numerical models offer a rapid and iterative design approach, allowing researchers to easily modify system parameters, electrode geometries, and operating conditions. This approach enables the exploration of various design configurations and identification of optimal operating conditions more efficiently than traditional experimental methods.
A wide range of numerical investigations of VRFBs is available in the public literature, ranging from basic zero-dimensional models [23,24,25] to the most complex three-dimensional models [26,27,28,29,30,31]. The use of numerical models to simulate flow batteries involves a careful balance between computational cost and accuracy. Zero- and one-dimensional models are particularly helpful for preliminary evaluations, down-selection, and fast exploratory studies, but have the limitation of oversimplifying the complex behaviour of VRFBs, neglecting spatial variations and non-uniformities within the battery cell. The need for computational resources increases significantly as the accuracy of numerical simulations is improved to include aspects such as concentration profiles, potential, and current density distributions [28,29,30,31] or capture intricate time-dependent fluid–membrane interactions. However, recent advancements in Artificial Neural Networks (ANNs) have enabled the creation of accurate models trained on data obtained from Computational Fluid Dynamics (CFD) simulations. These surrogate models offer the flexibility and speed of low-fidelity models, while incorporating many aspects of advanced computational models. In the field of fluid mechanics, several studies have used ANNs to model different cases, such as active [32] and passive flow control devices [33], vehicle aerodynamics [34], thermal systems [35], and multiphase-state systems [36], to mention a few.
The primary objective of this study was to model a VRFB using Artificial Neural Networks (ANNs). To accomplish this, numerical simulations were performed to generate training and benchmark data. By altering the current densities and states of charge in these simulations, a comprehensive dataset was created. Specifically, two distinct ANNs were designed and trained: one for predicting the voltage and the other for predicting the overpotential.

2. Materials and Methods

2.1. Governing Equations

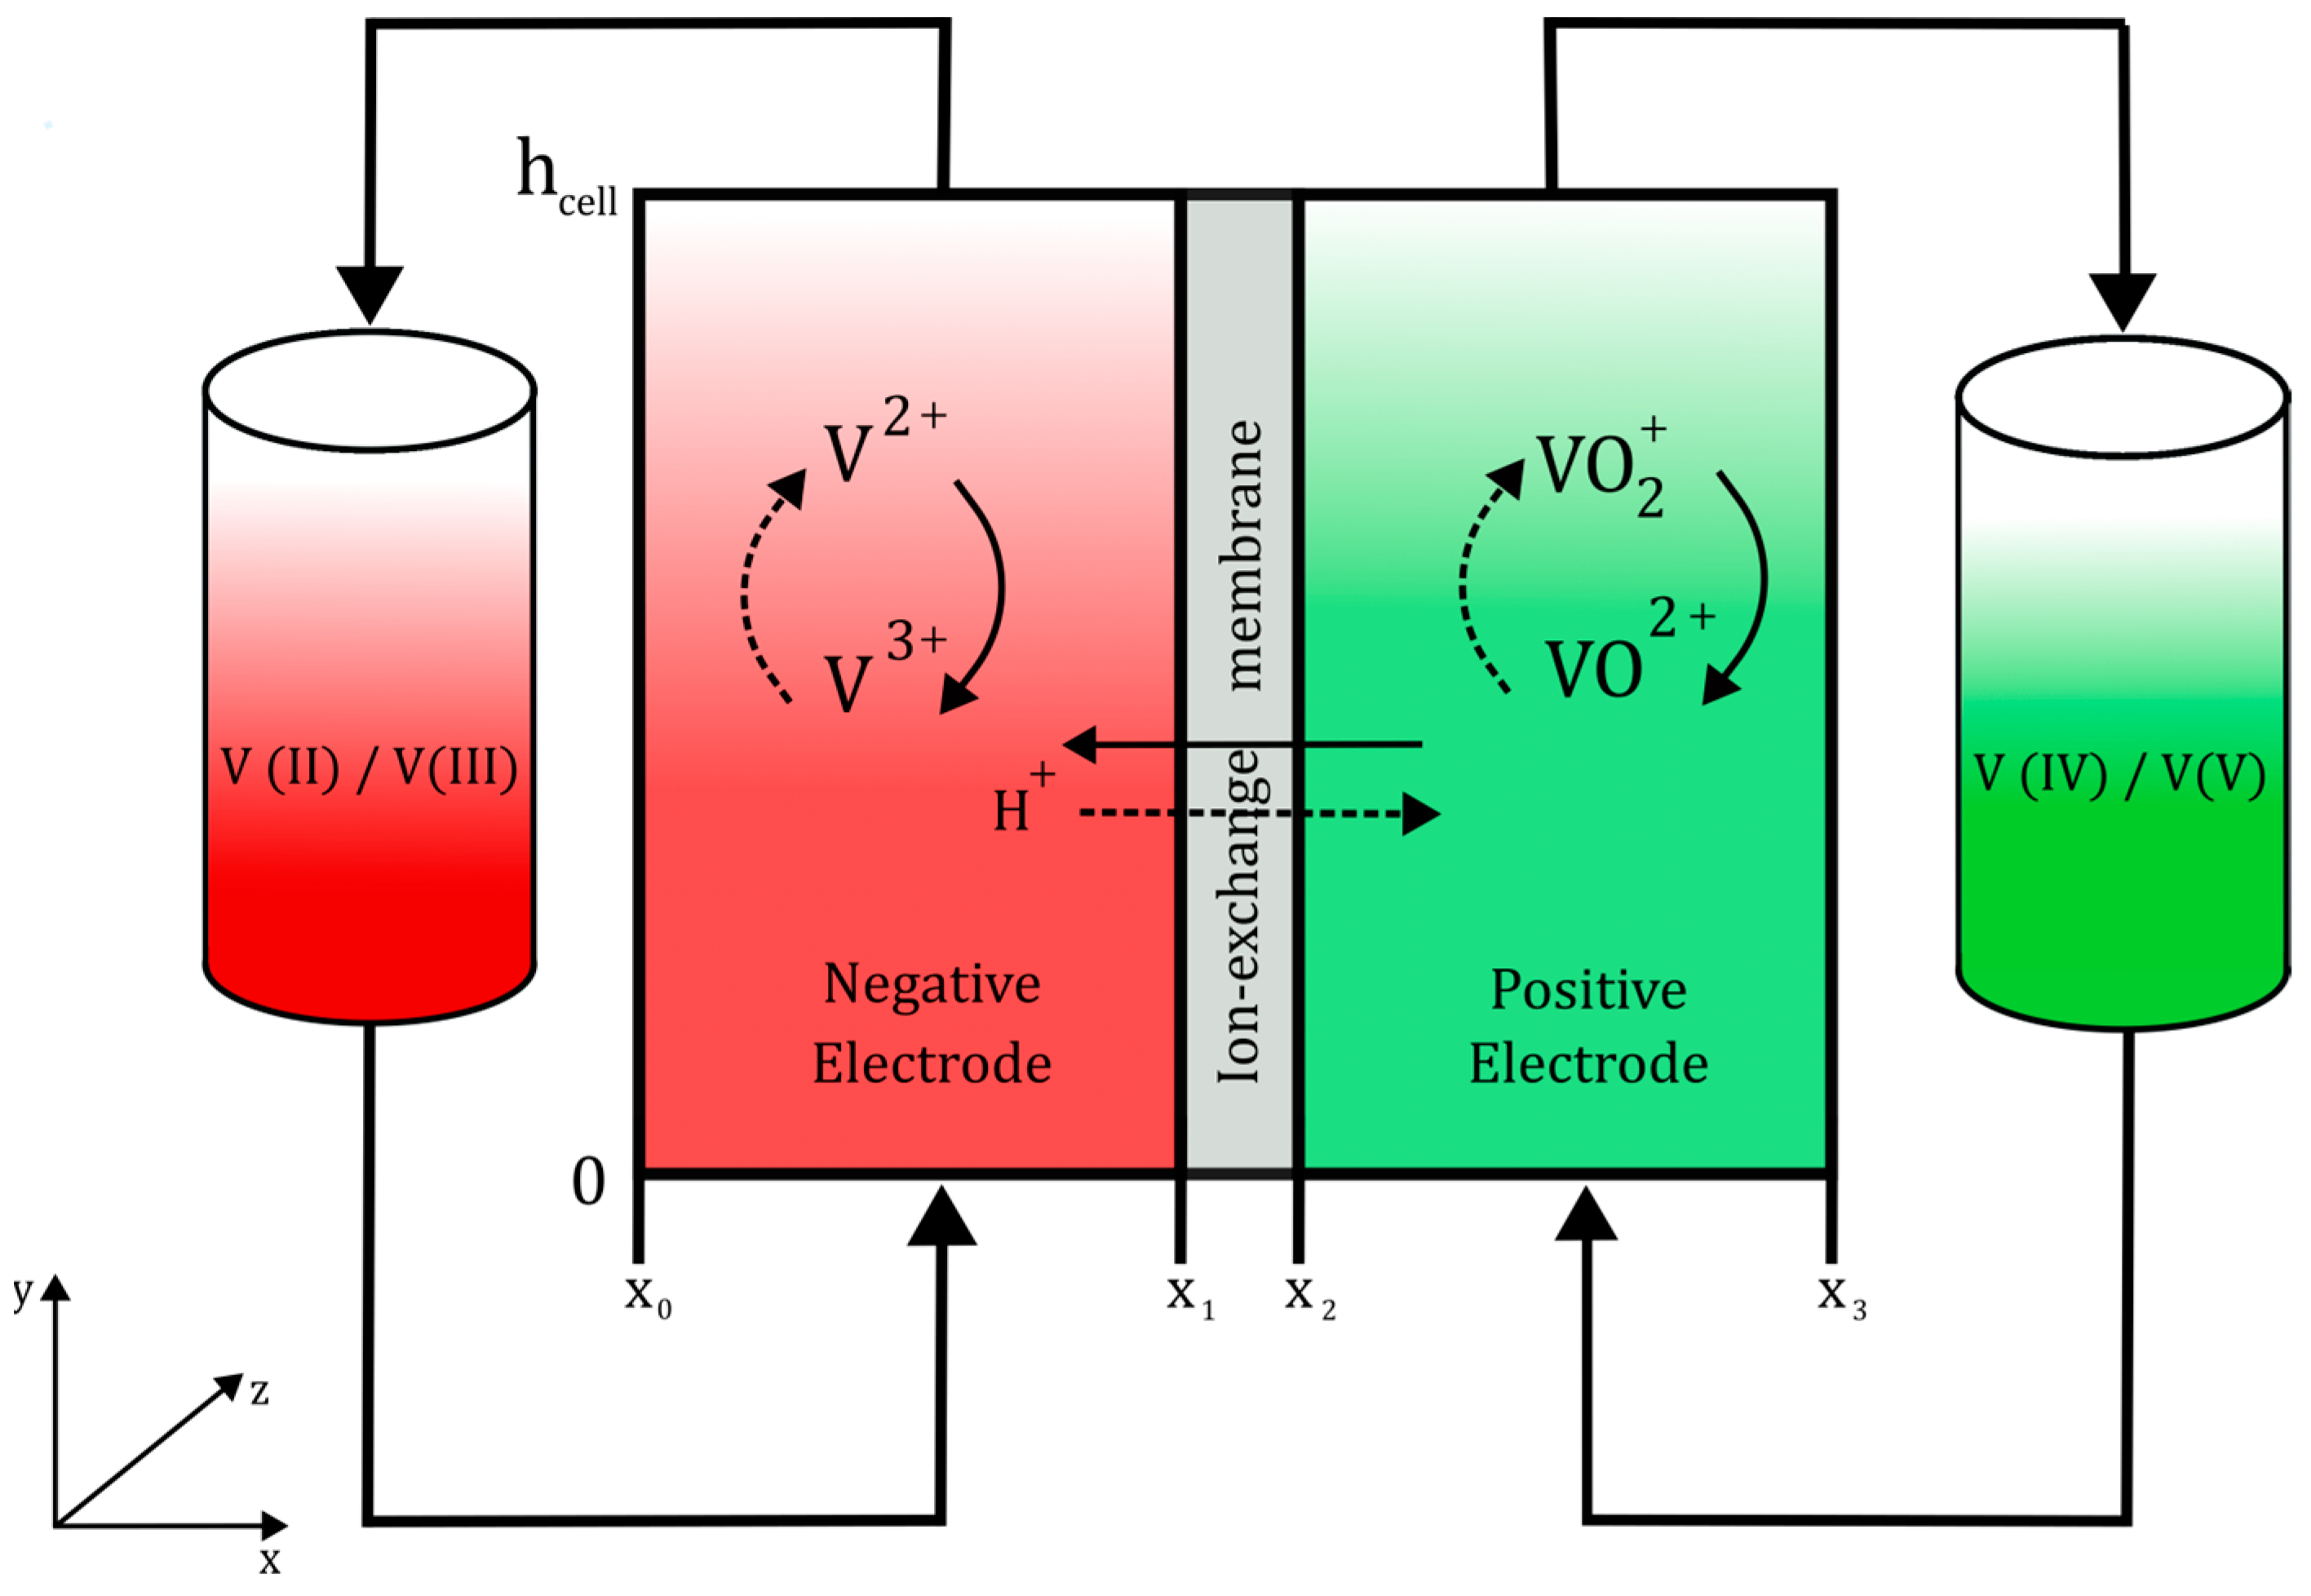
The model presented in this work consists of three domains: positive electrode, ion exchange membrane, and negative electrode. The current work utilizes a Nafion type cation exchange membrane. This choice aligns with the conventional approach in the literature and is consistent with the experimental validation. However, newly developed anion exchange membranes show promising results in terms of lower vanadium crossover and cost and enhanced H+ permeability [37]. The following assumptions were made in the numerical model:
  • Stationary conditions;
  • Incompressible electrolytes;
  • The fluids were assumed to be completely diluted;
  • Side reactions were neglected;
  • Both electrodes and the membrane were considered isothermal;
  • The properties of the electrodes, electrolyte, and membrane were isotropic;
  • Changes in the z-direction of the cell were ignored (depth in Figure 1).
The model was based on works published by Shah et al. [38] and Knehr et al. [39]. The conservation of mass of the charged species can be expressed by Equation (4).
t ε c i + · N i = S i
Variable ε refers to the electrode porosity, ci is the concentration of species i, and Si is the source term of the species (listed in Table 1).
N i is the charged species flux described by the Nernst–Planck equation, as shown in Equation (5).
N i = D i e f f c i z i u i c i F φ l + u c i
The first term accounts for diffusion, where D i e f f is effective diffusivity. In the second term (migration term), zi represents the charge of species i, ui is the ionic mobility, F is the Faraday constant, and φl is the liquid potential. In the third term (convection), u represents electrolyte velocity.
The effective diffusivity, D i e f f , was obtained from the Bruggemann correlation as shown in Equation (6).
D i e f f = ε 3 / 2 D i
The ionic mobility ui was calculated using the Nernst–Einstein equation, as shown in Equation (7), where R is the universal gas constant and T is the temperature.
u i = D i e f f R T
The electrolyte velocity, represented by u in Equation (5) in the convection term, is calculated by means of Darcy’s Law, as shown in Equation (8), where p is the pressure and µ is the dynamic viscosity of the electrolyte, as indicated in Table 2, among the other electrolyte properties.
u = K μ p
K represents the porous electrode permeability calculated using the Kozeny–Carman equation, as shown in Equation (9), where df is the fibre diameter and kck is the Kozeny–Carman constant.
K = d f 2 ε 3 16 k c k ( 1 ε ) 2
To fulfil the condition of electroneutrality, Equation (10) was solved for all charged species, except for SO42−:
i z i c i = 0
To integrate the species balance with electrochemical reactions and the current flow within the electrode during the charge/discharge processes, the charge conservation equation was solved, as shown in Equation (11).
· l = · s = R
Equation (11) indicates that the electrochemical reaction rate (iR) directly corresponds to the charges leaving the electrolyte l , which in turn equate to the charges entering the electrode s . Both the liquid and solid current densities are expressed by Equations (12) and (13).
i l   = F i z i N i
i s = σ s e f f φ s
The term σ s e f f , which corresponds to the effective conductivity of the porous electrode, was calculated using Equation (14), where σs is the electrode bulk conductivity, listed in Table 3, with other parameters related to the electrodes.
σ s e f f = ( 1 ε )   3 2     σ s
An integration with the Butler–Volmer law, which characterizes the electrochemical reactions occurring at the surface of the porous carbon electrode, is utilised to converge the conservation equations. Following this, the electrochemical reaction rate (iR) was calculated for both electrodes, positive (“+”) and negative (“−”), as shown in Equation (15) and Equation (16), respectively.
i R + = a i 0 , + e x p 1 α + F η + R T e x p α + F η + R T
i R = a i 0 , e x p 1 α F η + R T e x p α F η + R T
The specific surface area of the electrode was represented by a, α is the charge transfer coefficient, and η denotes the overpotential. i 0 , + and i 0 , , the exchange current densities, are expressed as shown in Equations (17) and (18), where k+ and k are the reaction rate constants for the positive and negative side, respectively.
i 0 , + = F k + ( c I V ) ( 1 α + ) ( c V ) α +
i 0 , = F k ( c I I ) ( 1 α ) ( c I I I ) α
Table 4 lists the kinetic parameters used in Equations (17) and (18).
The overpotential was determined for the positive and negative reactions using Equations (19) and (20).
η + = φ s φ l E +
η = φ s φ l E
The standard equilibrium potentials E+ and E were obtained using the Nernst equation, as shown in Equations (21) and (22).
E + = E + + R T F l n c I I I c I I
E = E + R T F l n c V · c H + 2 c I V
The effective conductivity of the membrane σ m e f f can be modelled as shown in Equation (23), where D H + e f f denotes the proton effective diffusion coefficient.
σ m e f f = F 2 R T z i 2 D H + e f f c H +

2.2. Boundary Conditions

Figure 1 x and y coordinates were taken as references for the boundary condition description. At x = x0, the anode external boundary is set as an electrical ground, that is, the solid potential is equal to zero:
φ s = 0     x = x 0
The species fluxes at the top and bottom of the membrane and the external boundaries of the electrodes are zero, aside from the inlets and outlets:
n · N i = 0 x = x 0   and   x = x 3 x = x 1   and   x = x 2   ( except   protons ) y = 0   and   y = h e
At y = 0, a boundary was set for the flux entering the cell through the electrodes.
c i = c i i n n   ·   u = Q ε w e L e   x 0   <   x   <   x 1   and   x 2   <   x   <   x 3 y   = 0
where Q is the volumetric flow rate, wcell is the cell width, and Le is the electrode thickness. Analogously, the electrodes have a pressure outlet at y = hcell, and the flux of the species caused by diffusion is neglected.
p = p o u t D i e f f c i · n = 0 x 0 < x < x 1   and   x 2 < x < x 3 y = h e
A constant current density was applied to the external boundary of the cathode using Equation (28).
n · i s = i a v g     x = x 3
where iavg denotes the user-defined current applied to the boundary. The sign of this parameter determines whether the cell is in charge or discharge. This leads to the application of an electrical insulation to the upper and lower boundaries of the membranes and electrodes.
n   ·   i s = 0 n   ·   i l = 0   x 0 < x < x 3 y = 0   and   y = h e
The geometrical dimensions and operating conditions of the cell are listed in Table 5.

2.3. Numerical Model

The cell was modelled using the commercial software COMSOL Multiphysics 5.5 with its incorporated physics packages, including Darcy’s law and tertiary current distribution. By employing the finite element method, the model featured a structured mesh made of 4616 quadratic elements. The computational approach adhered to a relative error set at 1.0 × 10⁻⁶.

2.4. Neural Network

In the present study, a multilayer perceptron with backpropagation (MLP-BP) is used, which is a multilayer model with hidden layers. In this model, the output y is estimated using Equation (30). The output of each hidden neuron is calculated with the sigmoid function defined in Equation (31), which receives as input the postsynaptical h i of each i neuron from the previous layer, calculated with the linear combination defined in Equation (32), where x represents the inputs to the layers, ω the weights of the layers, and θ the biases.
y = i = 1 i = N h i d d e n ω i · g i x + θ
g i x = 1 1 + e h i
h i x = j = 1 j = N h i d d e n ω i , j · x j + θ i
The commercial software MATLAB 2022a [45], commercial code with its Deep Learning toolbox [46], was used to design and train the ANN.
The number of hidden layers and neurones in each network depended on the complexity of the magnitude considered. Hence, two different networks were trained for the two targeted ANN models: one for voltage prediction, as shown in Figure 2, and the other for overpotential prediction, as shown in Figure 3. The training data were split into 70% training, 20% validation, and 10% testing for both networks.
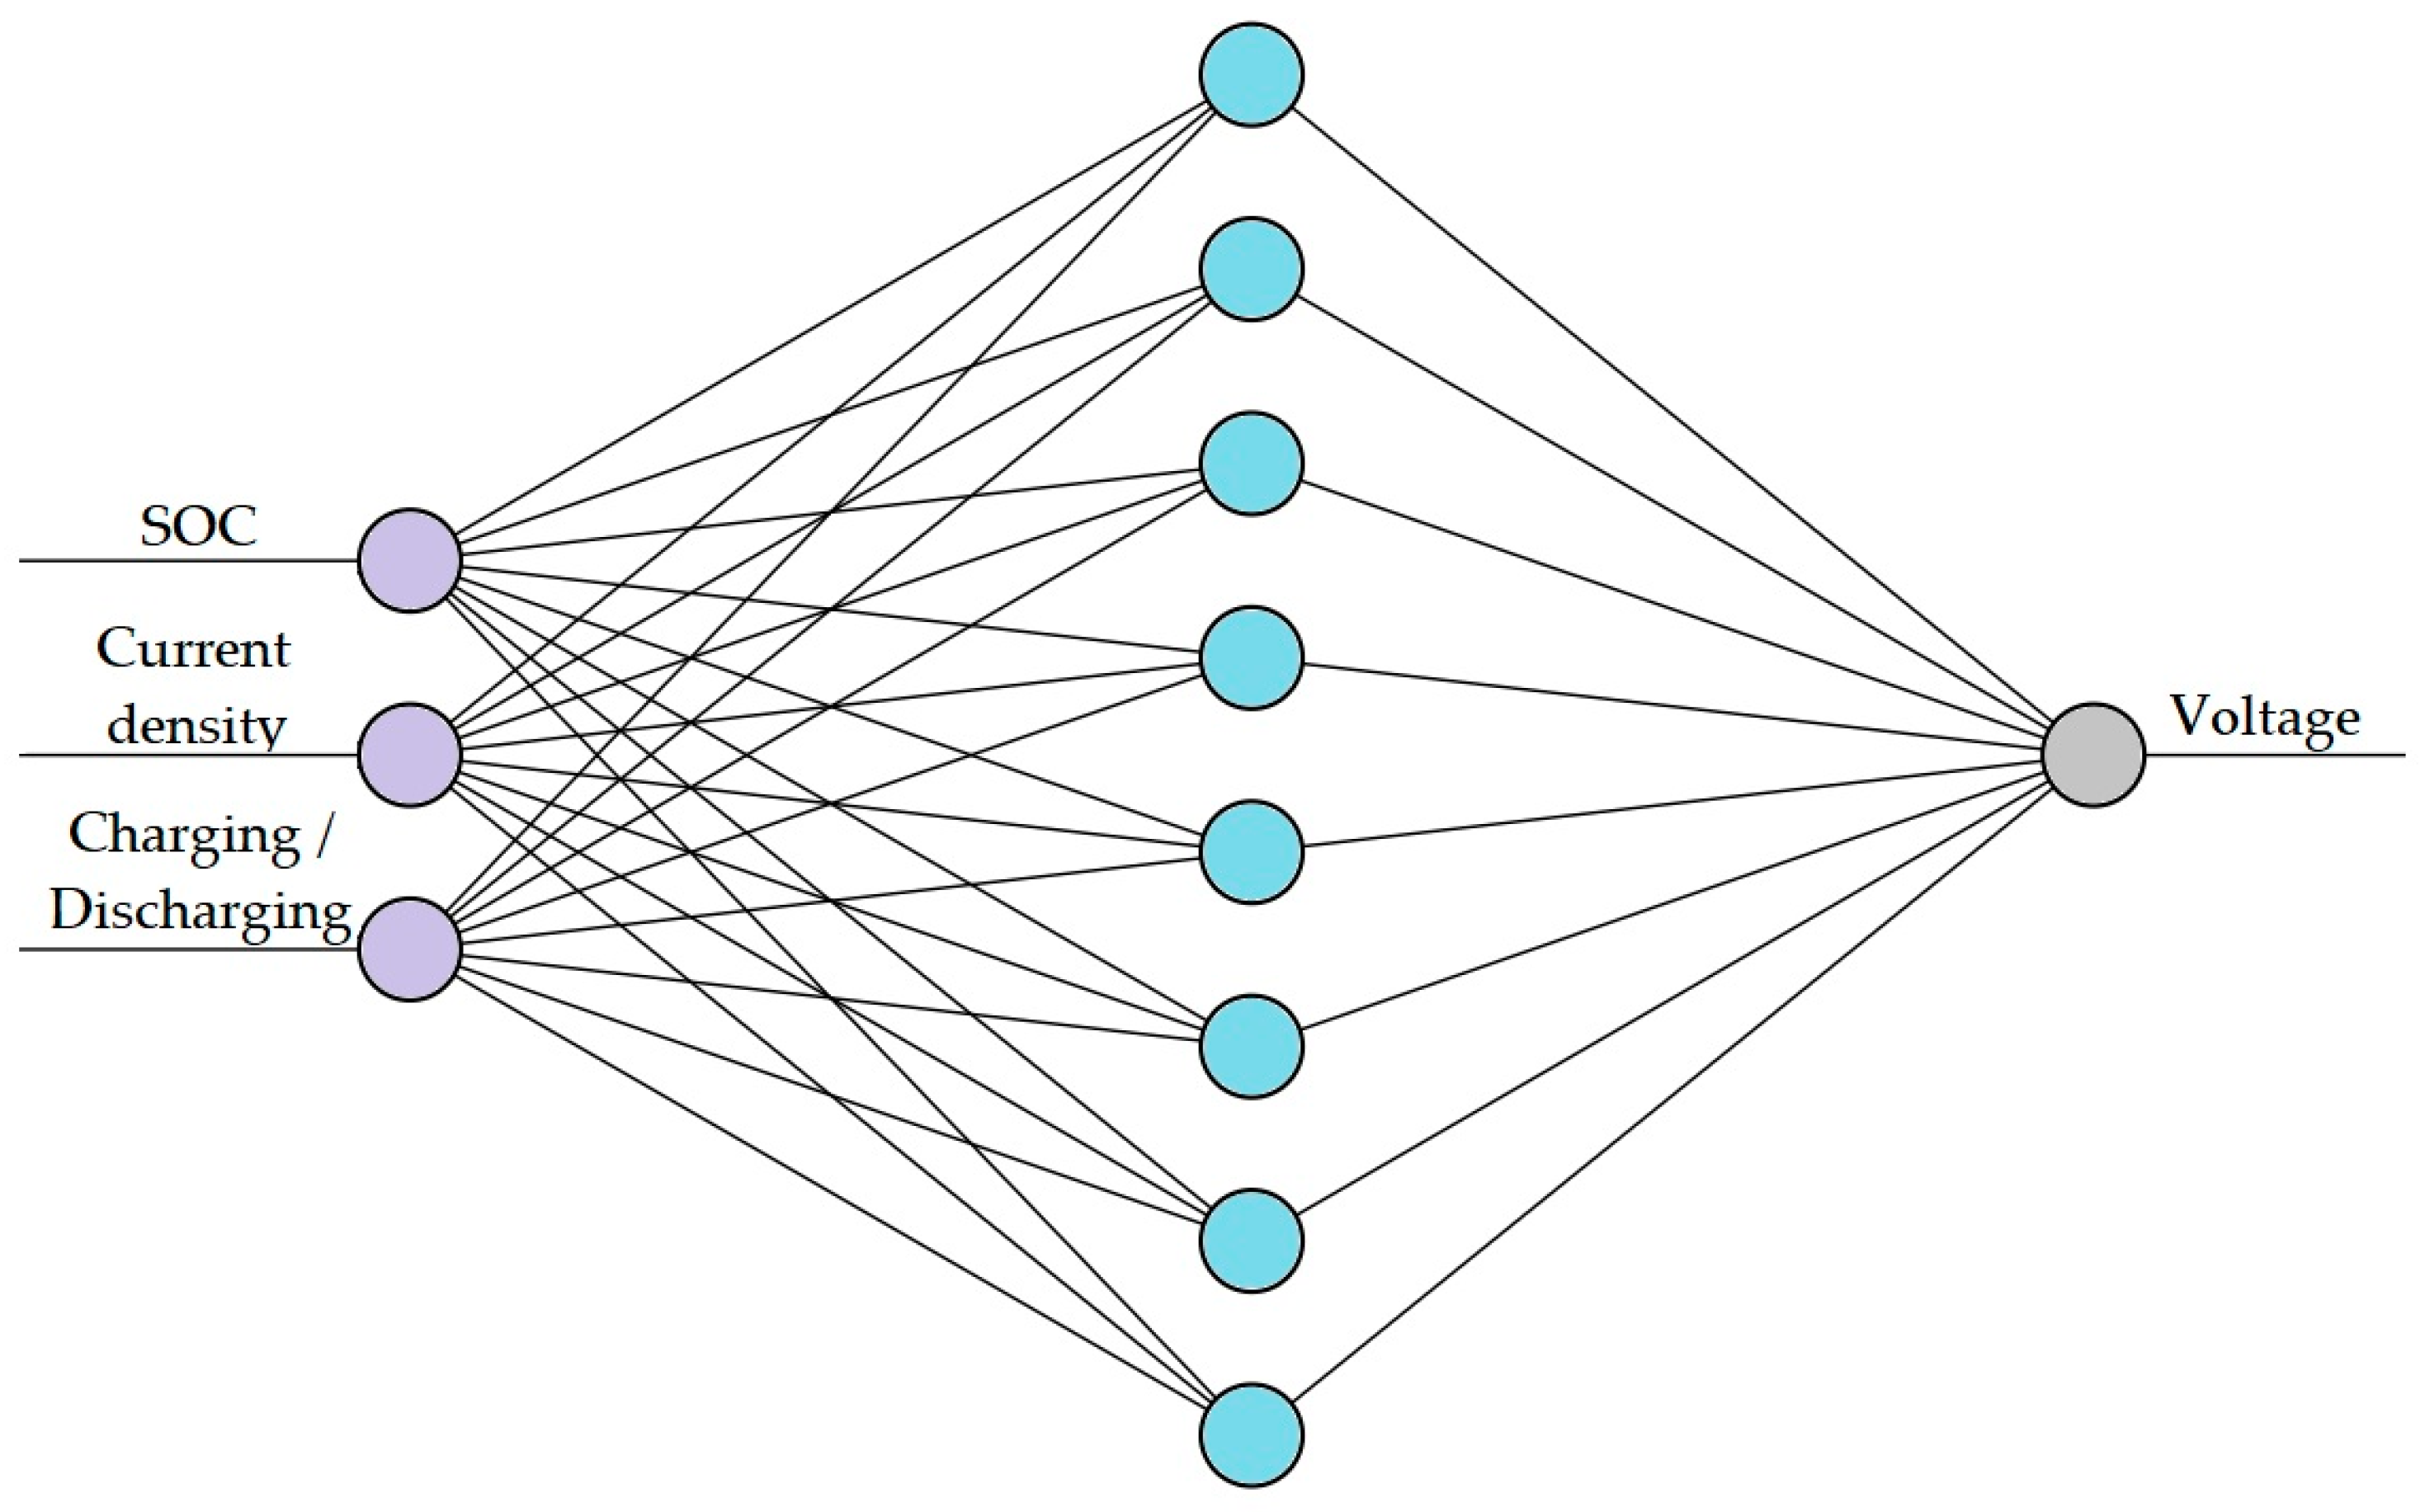
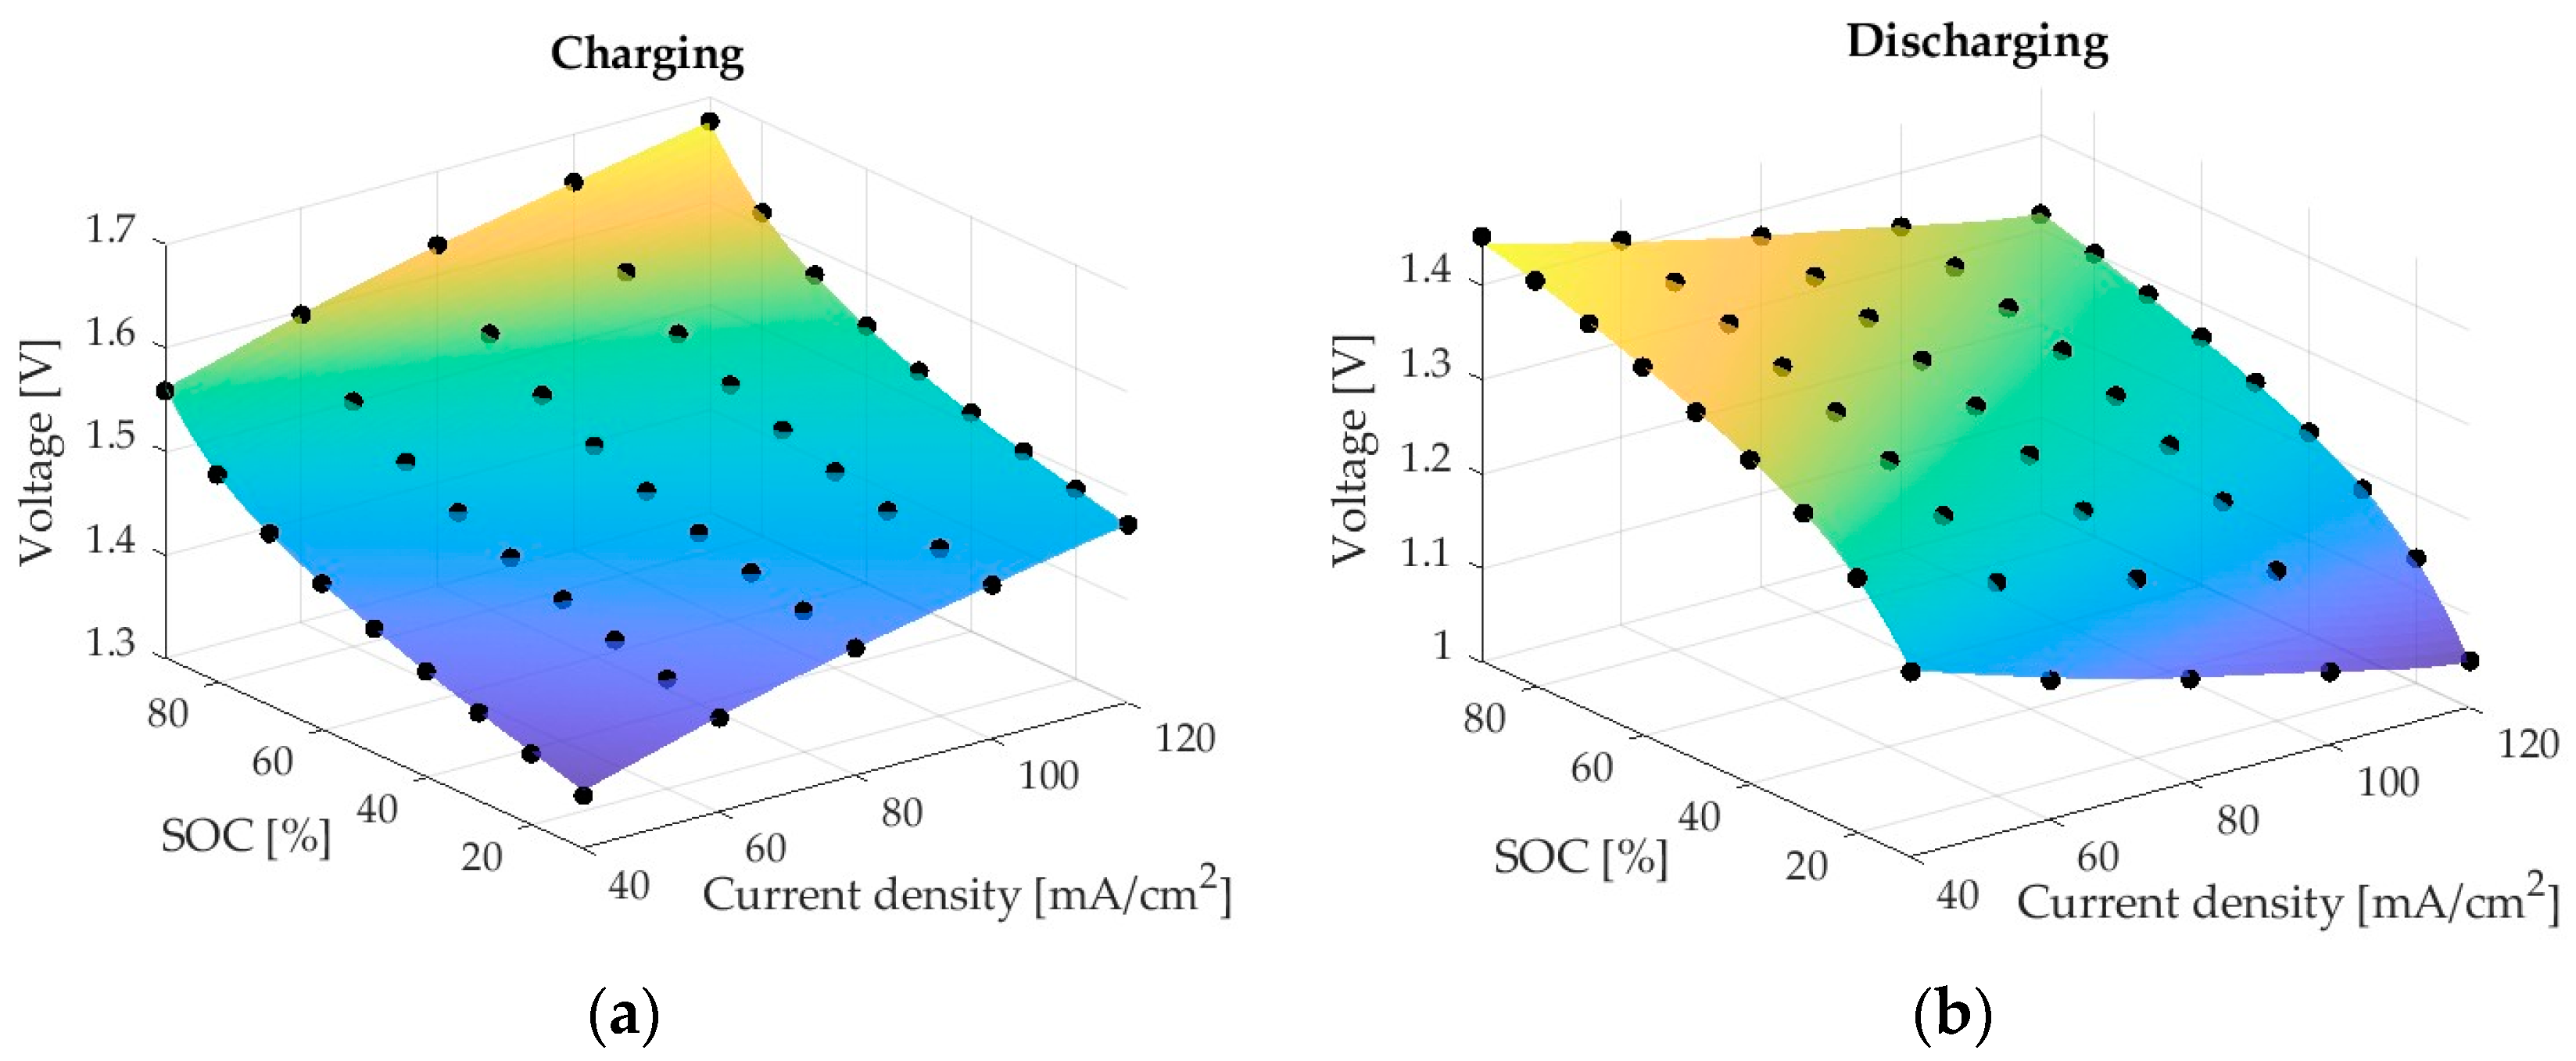
The first network (ANN1) predicts the voltage of the cell under charge and discharge regimes for different charge and current densities. ANN1 is a relatively simple ANN with a single input layer comprising three parameters: SoC, Current density, Charging or Discharging, a single hidden layer with eight nodes, and an output layer with a single node. Figure 2 shows the architecture of ANN1.
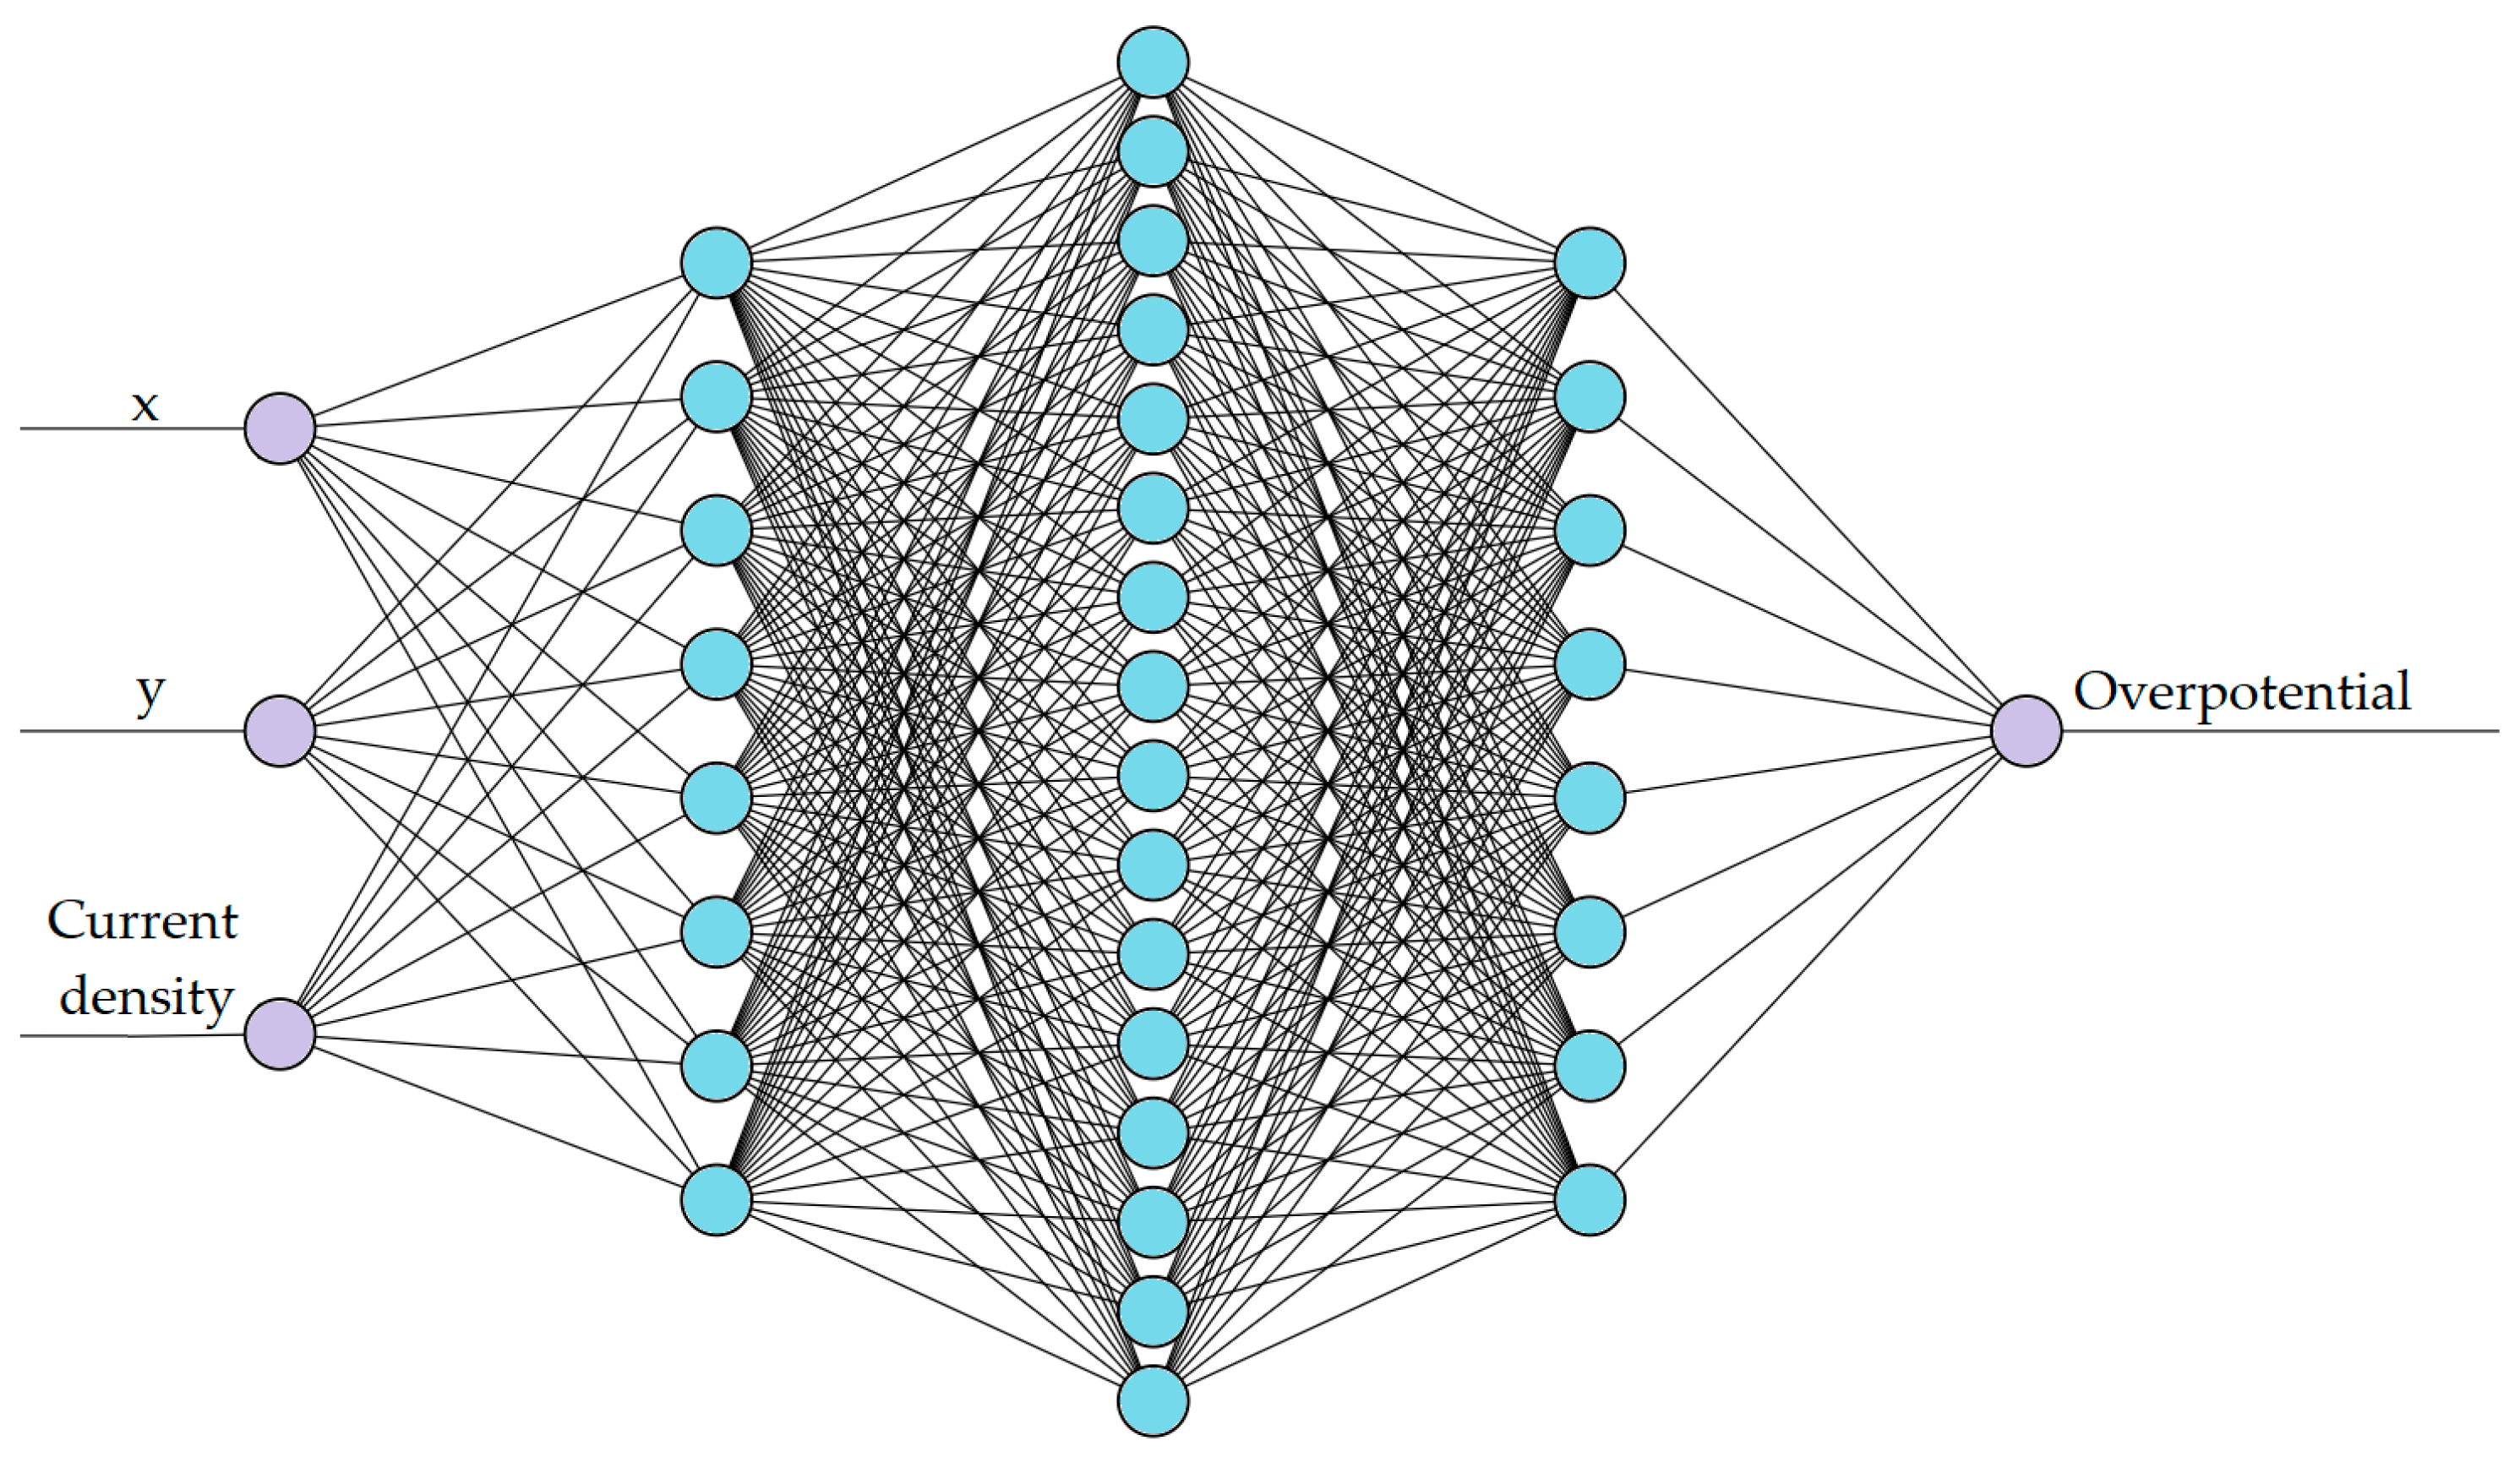
The second network (ANN2) aims to predict the spatial overpotential of the cell for a constant State of Charge of 50% which is expected to be substantially less continuous compared to ANN1. Hence, added complexity is required in ANN2 which contains three hidden layers (with 8, 16, and 8 nodes) and an output layer with a single node for the overpotential. Figure 3 shows the architecture of the ANN2.
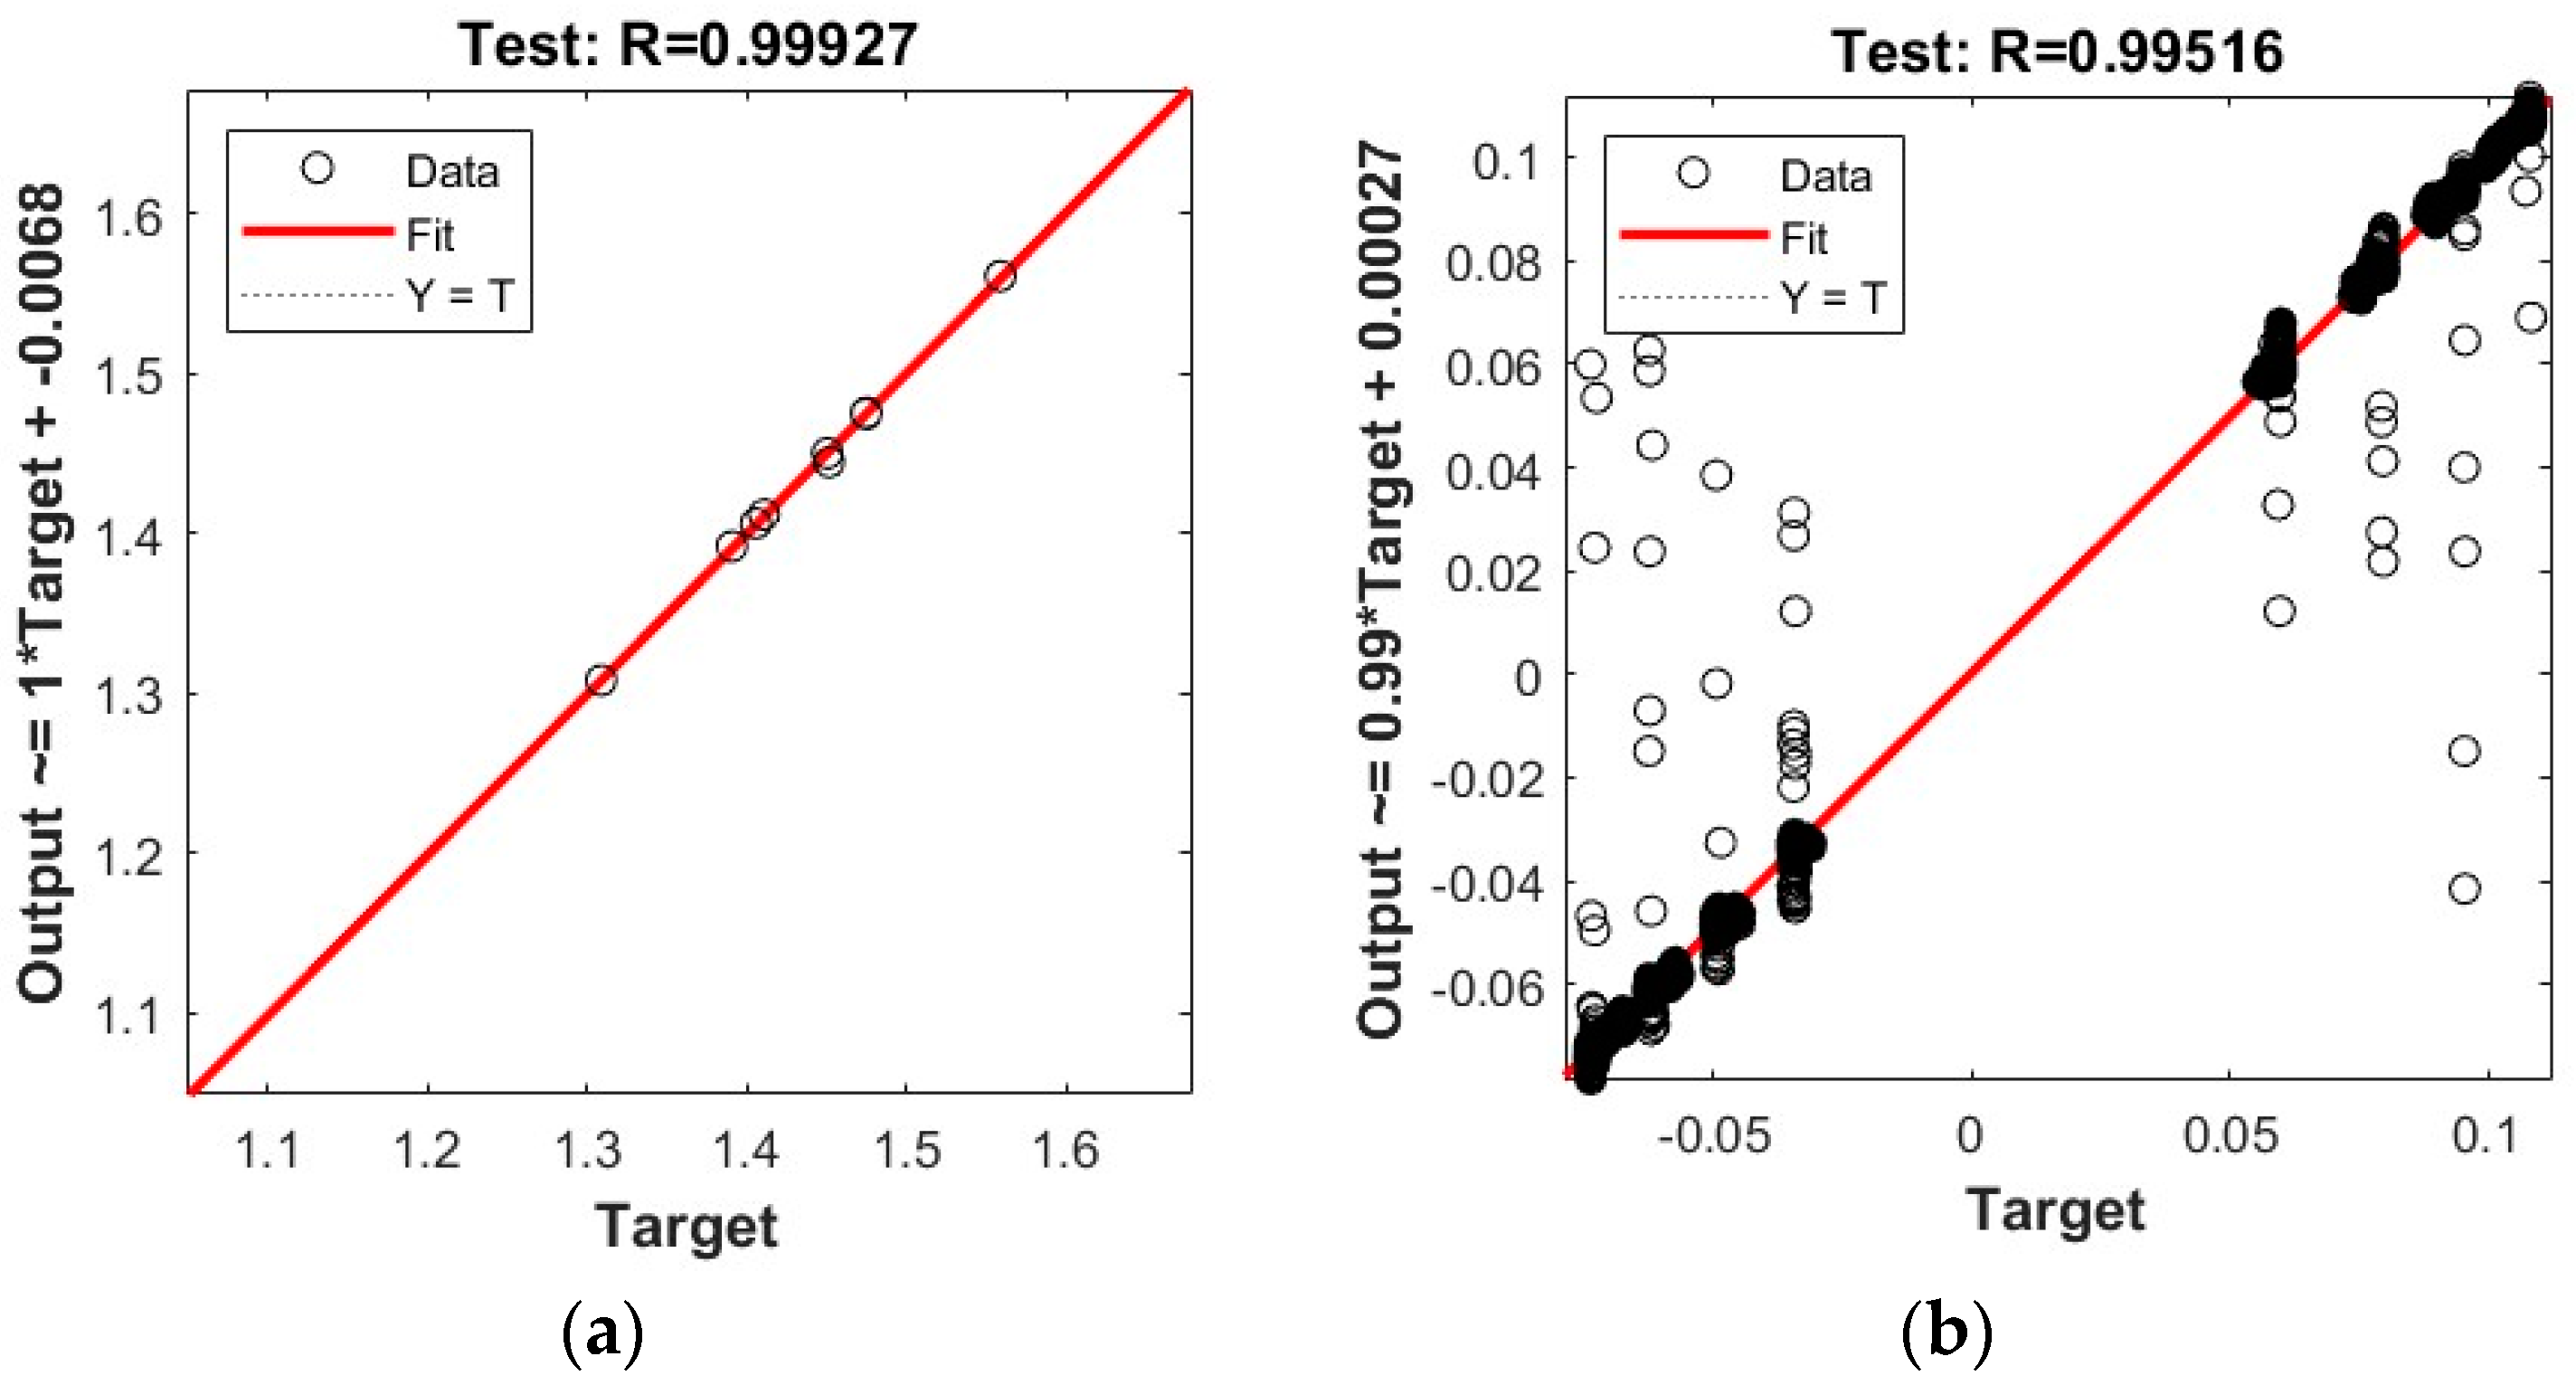
The ANNs are benchmarked using the standard Pearson product-moment correlation coefficient R.

3. Results

3.1. Model Validation

The numerical model was validated using experimental data from You et al. [28], which involved placing a 5 cm2 cell in a static solution and measuring the charge-discharge curves at two different current densities: 40 mA cm−2 and 80 mA cm−2. Figure 4 illustrates the excellent agreement between the numerical results of the in-house simulation and experimental data from You et al. [28]. The model demonstrated an average relative error of 1.6% when calculating the voltage, which is comparable to the level of agreement between the numerical simulations and experiments described in You et al. [28]. The relative error has been calculated by means of the following expression:
Relative   error   ( % )   = Numerical   model   value Experimental   value Experimental   value × 100

3.2. Artificial Neural Network Validation

To evaluate the accuracy of the ANN predictions, the correlation coefficient (R-value) of the test set is considered, since these cases are unknown for the network, and therefore determine the generalisability of the proposed networks. The R-values after training ANN1 and ANN2 are shown in Figure 5.
The R-values for ANN1 and ANN2 were 0.99927 and 0.99516. Both models provide relatively high correlation coefficients, indicating a high level of confidence in ANN prediction. It should be noted that the two graphs do not have the same vertical scale and that ANN1 has no outliers, whereas the more complex ANN2 has a substantial set of outliers at the extremes.
To further analyse the performance of the two neural networks, Figure 6 shows a comparison between the predictions of ANN1 for both charging and discharging, together with the CFD results for the considered cases. The ANN1 prediction is illustrated as a surface, and the CFD results are illustrated using black markers. The possibility of spanning a continuous and smooth surface between CFD cases enables the prediction of a well-formulated ANN to have few outliers, which is the case for the ANN1 model.
As previously mentioned, ANN2, compared to ANN1, is modelling a more complex phenomenon and has a non-negligible set of outliers of correlation coefficients. The intricate modelling is illustrated by detailed studies of the overpotential for a current density of 60 mA/cm2 in the discharge mode for an SoC of 50%. Figure 7 shows a section view across the membrane (the xy plane in Figure 1), where the positive and negative electrode voltages across the membrane and neighbouring fluid are shown for the numerical simulations to the left and ANN2 to the centre. Observing the numerical results, one may note a near-discrete step in the electrode voltage over the membrane and a non-uniform distribution, particularly near the lower boundary. ANN2 captured a substantial fraction of the electrode voltage distribution of the section cut, as can be observed by comparing the results with the CFD results. However, there were clear discrepancies near the membrane and the lower boundary. These discrepancies are emphasised by the subtraction of the numerical results and ANN2, as illustrated on the rightmost surface in Figure 7.

3.3. ANN Effiency Benchmark

Table 6 summarises the computational times required for the CFD calculation, ANN1, and ANN2 for a workstation with a single Intel Xeon Gold 5120 CPU. The effectiveness of the ANN was benchmarked based on the time required to conduct a single CFD simulation.
The results demonstrate that ANNs can significantly reduce the computational time required to obtain the results. ANN1 achieved a speed-up of 15,625 times the CFD, whereas with ANN2 for overpotential prediction, a speed-up of 266.7 was obtained.

4. Conclusions

This study investigated the predictive capabilities of Artificial Neural Networks (ANNs) for cell voltage and overpotential in Vanadium Redox Flow (VRF) cells. Two ANN models were developed, one for cell voltage and another for overpotential, and trained on a dataset generated by a two-dimensional numerical CFD model based on previous research by Shah et al. [30] and Knehr et al. [31]. The accuracy of the CFD models was verified with experimental results from You et al. [28], with an average discrepancy of 1.6% for the charge and discharge curves at two different current densities (40 and 80 mA cm−2).
The results demonstrate that the ANN models are capable of accurately predicting a wide range of State of Charge and current density conditions with high precision during both charge and discharge. Additionally, the ANN model showed high confidence in overpotential predictions for most of the domains, with only minor performance deterioration in the high-gradient region over the membrane and selected boundaries of the simulated domain.
The computational power required for the ANN models was significantly less than that required for the CFD simulations, reducing the required computational power by up to four orders of magnitude. This reduction in power, combined with high confidence in the predictions, provides a promising option for rapid evaluation and system integration for optimisation. The most compelling application may be the integration of ANN models on hardware for on-site monitoring and real-time cell prediction.

Author Contributions

Conceptualization, J.M.-L. and U.F.-G.; methodology, K.P.-P.; software, E.S.-D.; validation, J.M.-L. and U.F.-G.; formal analysis, J.O.; investigation, U.F.-G.; resources, E.S.-D.; data curation, K.P.-P. and I.J.; writing—review and editing, J.M.-L., K.P.-P., U.F.-G. and I.J.; visualization, J.O.; supervision, E.S.-D.; project administration, U.F.-G.; funding acquisition, U.F.-G. All authors have read and agreed to the published version of the manuscript.

Funding

This work has been partially supported by the Government of the Basque Country, program: Elkartek CICe2022; Grant No.: KK-2022/00043. U.F.-G. was supported by the Mobility Lab Foundation, a governmental organization of the Provincial Council of Araba and the local council of Vitoria-Gasteiz.

Data Availability Statement

All data generated in the current study are available upon reasonable request to the corresponding author.

Acknowledgments

The authors are grateful for the support provided by SGIker of UPV/EHU. This research was developed under the frame of the Joint Research Laboratory on Offshore Renewable Energy (JRL-ORE).

Conflicts of Interest

Authors Eduardo Sánchez-Díez and Javier Olarte are employed by the Centre for Cooperative Research on Alternative Energies (CIC EnergiGUNE). The remaining authors declare that the research was conducted in the absence of any commercial or financial relationships that could be construed as a potential conflict of interest.

Nomenclature

aSpecific surface area [m2]
cConcentration [mol m−3]
DDiffusion coefficient
dfFiber diameter [m]
EEquilibrium potential [V]
FFaraday constant [C mol−1]
hLength [m]
h i Postsynaptical output (ANN)
iCurrent density [mA cm−2]
i0Exchange current density
iRElectrochemical reaction rate
KPermeability [m2]
KckKozeny-Carman constant
kReaction rate constant [m s−1]
LThickness [m]
NCharged species flux [mol m−3 s−1]
pPressure [Pa]
QVolumetric flow rate [ml min−1]
RIdeal gas constant [J mol−1 K−1]
SSource term [mol m−3 s−1]
TTemperature [K]
tTime
uMobility [mol s kg−1]
uVelocity [m s−1]
wWidth [m]
x Input (ANN)
y Output (ANN)
zSpecies charge
Greek
αCharge transfer coefficient
εPorosity
ηOverpotential [V]
σConductivity [S m−1]
φPotential [V]
µDynamic viscosity [Pa s]
θ Layer bias (ANN)
ω Layer weights (ANN)
Superscripts and subscripts
+Positive side or cathode
Negative side or anode
Standard
avgAverage
eElectrode
effEffective
iSpecies
inInlet
lLiquid
mMembrane
outOutlet
sSolid
Abbreviations
ANNArtificial Neural Network
CFDComputational Fluid Dynamics
MLP-BPMulti-Layer Perceptron with Backpropagation
RFBRedox Flow Battery
VRFBVanadium Redox Flow Battery

References

  1. Sayed, E.T.; Olabi, A.G.; Alami, A.H.; Radwan, A.; Mdallal, A.; Rezk, A.; Abdelkareem, M.A. Renewable Energy and Energy Storage Systems. Energies 2023, 16, 1415. [Google Scholar] [CrossRef]
  2. Mitali, J.; Dhinakaran, S.; Mohamad, A.A. Energy Storage Systems: A Review. Energy Storage Sav. 2022, 1, 166–216. [Google Scholar] [CrossRef]
  3. Sánchez-Díez, E.; Ventosa, E.; Guarnieri, M.; Trovò, A.; Flox, C.; Marcilla, R.; Soavi, F.; Mazur, P.; Aranzabe, E.; Ferret, R. Redox Flow Batteries: Status and Perspective towards Sustainable Stationary Energy Storage. J. Power Sources 2021, 481, 228804. [Google Scholar] [CrossRef]
  4. Arévalo-Cid, P.; Dias, P.; Mendes, A.; Azevedo, J. Redox Flow Batteries: A New Frontier on Energy Storage. Sustain. Energy Fuels 2021, 5, 5366–5419. [Google Scholar] [CrossRef]
  5. Skyllas-Kazacos, M.; Menictas, C.; Lim, T. Redox Flow Batteries for Medium- to Large-Scale Energy Storage. In Electricity Transmission, Distribution and Storage Systems; Melhem, Z., Ed.; Woodhead Publishing Series in Energy; Woodhead Publishing: Sawston, UK, 2013; pp. 398–441. ISBN 978-1-84569-784-6. [Google Scholar]
  6. Olabi, A.G.; Allam, M.A.; Abdelkareem, M.A.; Deepa, T.D.; Alami, A.H.; Abbas, Q.; Alkhalidi, A.; Sayed, E.T. Redox Flow Batteries: Recent Development in Main Components, Emerging Technologies, Diagnostic Techniques, Large-Scale Applications, and Challenges and Barriers. Batteries 2023, 9, 409. [Google Scholar] [CrossRef]
  7. Lourenssen, K.; Williams, J.; Ahmadpour, F.; Clemmer, R.; Tasnim, S. Vanadium Redox Flow Batteries: A Comprehensive Review. J. Energy Storage 2019, 25, 100844. [Google Scholar] [CrossRef]
  8. Weber, A.Z.; Mench, M.M.; Meyers, J.P.; Ross, P.N.; Gostick, J.T.; Liu, Q. Redox Flow Batteries: A Review. J. Appl. Electrochem. 2011, 41, 1137–1164. [Google Scholar] [CrossRef]
  9. Alotto, P.; Guarnieri, M.; Moro, F. Redox Flow Batteries for the Storage of Renewable Energy: A Review. Renew. Sustain. Energy Rev. 2014, 29, 325–335. [Google Scholar] [CrossRef]
  10. Cunha, Á.; Martins, J.; Rodrigues, N.; Brito, F.P. Vanadium Redox Flow Batteries: A Technology Review. Int. J. Energy Res. 2015, 39, 889–918. [Google Scholar] [CrossRef]
  11. Skyllas-Kazacos, M.; Rychcik, M.; Robins, R.G.; Fane, A.G.; Green, M.A. New All-Vanadium Redox Flow Cell. J. Electrochem. Soc. 1986, 133, 1057. [Google Scholar] [CrossRef]
  12. Esan, O.C.; Shi, X.; Pan, Z.; Huo, X.; An, L.; Zhao, T.S. Modeling and Simulation of Flow Batteries. Adv. Energy Mater. 2020, 10, 2000758. [Google Scholar] [CrossRef]
  13. Aluko, A.; Knight, A. A Review on Vanadium Redox Flow Battery Storage Systems for Large-Scale Power Systems Application. IEEE Access 2023, 11, 13773–13793. [Google Scholar] [CrossRef]
  14. Chen, R.; Kim, S.; Chang, Z. Redox Flow Batteries: Fundamentals and Applications; CRC Press: Boca Raton, FL, USA, 2017; pp. 103–118. ISBN 978-953-51-5421-1. [Google Scholar]
  15. Lucas, A.; Chondrogiannis, S. Smart Grid Energy Storage Controller for Frequency Regulation and Peak Shaving, Using a Vanadium Redox Flow Battery. Int. J. Electr. Power Energy Syst. 2016, 80, 26–36. [Google Scholar] [CrossRef]
  16. Arribas, B.; Melicio, R.; Ginja Teixeira, J.; Mendes, V.M.F. Vanadium Redox Flow Battery Storage System Linked to the Electric Grid. Renew. Energy Power Qual. J. 2016, 1, 1025–1030. [Google Scholar] [CrossRef]
  17. Sun, C.; Negro, E.; Vezzù, K.; Pagot, G.; Cavinato, G.; Nale, A.; Herve Bang, Y.; Di Noto, V. Hybrid Inorganic-Organic Proton-Conducting Membranes Based on SPEEK Doped with WO3 Nanoparticles for Application in Vanadium Redox Flow Batteries. Electrochim. Acta 2019, 309, 311–325. [Google Scholar] [CrossRef]
  18. Choi, C.; Kim, S.; Kim, R.; Choi, Y.; Kim, S.; Jung, H.; Yang, J.H.; Kim, H.-T. A Review of Vanadium Electrolytes for Vanadium Redox Flow Batteries. Renew. Sustain. Energy Rev. 2017, 69, 263–274. [Google Scholar] [CrossRef]
  19. Yu, F.; Zhao, W.; Leung, P.; Mohamed, M.R.; Wei, L.; Shah, A.; Liao, Q. Performance Evaluation of a Scaled-Up Membraneless Organic-Based Hybrid Flow Battery. Batteries 2023, 9, 336. [Google Scholar] [CrossRef]
  20. Liu, Y.; Goulet, M.-A.; Tong, L.; Liu, Y.; Ji, Y.; Wu, L.; Gordon, R.G.; Aziz, M.J.; Yang, Z.; Xu, T. A Long-Lifetime All-Organic Aqueous Flow Battery Utilizing TMAP-TEMPO Radical. Chem 2019, 5, 1861–1870. [Google Scholar] [CrossRef]
  21. Winsberg, J.; Hagemann, T.; Janoschka, T.; Hager, M.D.; Schubert, U.S. Redox-Flow Batteries: From Metals to Organic Redox-Active Materials. Angew. Chem. Int. Ed. 2017, 56, 686–711. [Google Scholar] [CrossRef]
  22. Tas, M.; Elden, G. A Comprehensive Review of Carbon- and Metal-based Electrocatalysts in the Vanadium Redox Flow Battery. Energy Storage 2021, 4, e265. [Google Scholar] [CrossRef]
  23. Pugach, M.; Kondratenko, M.; Briola, S.; Bischi, A. Zero Dimensional Dynamic Model of Vanadium Redox Flow Battery Cell Incorporating All Modes of Vanadium Ions Crossover. Appl. Energy 2018, 226, 560–569. [Google Scholar] [CrossRef]
  24. König, S.; Suriyah, M.R.; Leibfried, T. Validating and Improving a Zero-Dimensional Stack Voltage Model of the Vanadium Redox Flow Battery. J. Power Sources 2018, 378, 10–18. [Google Scholar] [CrossRef]
  25. Chen, Y.; Xu, Z.; Wang, C.; Bao, J.; Koeppel, B.; Yan, L.; Gao, P.; Wang, W. Analytical Modeling for Redox Flow Battery Design. J. Power Sources 2021, 482, 228817. [Google Scholar] [CrossRef]
  26. Yin, C.; Gao, Y.; Guo, S.; Tang, H. A Coupled Three Dimensional Model of Vanadium Redox Flow Battery for Flow Field Designs. Energy 2014, 74, 886–895. [Google Scholar] [CrossRef]
  27. Ma, X.; Zhang, H.; Xing, F. A Three-Dimensional Model for Negative Half Cell of the Vanadium Redox Flow Battery. Electrochim. Acta 2011, 58, 238–246. [Google Scholar] [CrossRef]
  28. Wang, Y.; Cho, S.C. Analysis and Three-Dimensional Modeling of Vanadium Flow Batteries. J. Electrochem. Soc. 2014, 161, A1200–A1212. [Google Scholar] [CrossRef]
  29. Xu, Q.; Zhao, T.S.; Leung, P.K. Numerical Investigations of Flow Field Designs for Vanadium Redox Flow Batteries. Appl. Energy 2013, 105, 47–56. [Google Scholar] [CrossRef]
  30. Wang, Q.; Qu, Z.G.; Jiang, Z.Y.; Yang, W.W. Numerical Study on Vanadium Redox Flow Battery Performance with Non-Uniformly Compressed Electrode and Serpentine Flow Field. Appl. Energy 2018, 220, 106–116. [Google Scholar] [CrossRef]
  31. Sun, J.; Zheng, M.; Luo, Y.; Yu, Z. Three-Dimensional Detached Serpentine Flow Field Design for Redox Flow Batteries. J. Power Sources 2019, 428, 136–145. [Google Scholar] [CrossRef]
  32. Portal-Porras, K.; Fernandez-Gamiz, U.; Zulueta, E.; Garcia-Fernandez, R.; Etxebarria Berrizbeitia, S. Active Flow Control on Airfoils by Reinforcement Learning. Ocean Eng. 2023, 287, 115775. [Google Scholar] [CrossRef]
  33. Portal-Porras, K.; Fernandez-Gamiz, U.; Zulueta, E.; Ballesteros-Coll, A.; Zulueta, A. CNN-Based Flow Control Device Modelling on Aerodynamic Airfoils. Sci. Rep. 2022, 12, 8205. [Google Scholar] [CrossRef] [PubMed]
  34. Jacob, S.J.; Mrosek, M.; Othmer, C.; Köstler, H. Deep Learning for Real-Time Aerodynamic Evaluations of Arbitrary Vehicle Shapes. SAE Int. J. Passeng. Veh. Syst. 2022, 15, 77–90. [Google Scholar] [CrossRef]
  35. Portal-Porras, K.; Fernandez-Gamiz, U.; Zulueta, E.; Garcia-Fernandez, R.; Irigaray, O. Parametric Study of Vortex Generators on a Fin-and-Tube Heat Exchanger. Energy Sources Part A Recovery Util. Environ. Eff. 2023, 45, 10051–10072. [Google Scholar] [CrossRef]
  36. Ugarte-Anero, A.; Fernandez-Gamiz, U.; Portal-Porras, K.; Zulueta, E.; Urbina-Garcia, O. Computational Characterization of the Behavior of a Saliva Droplet in a Social Environment. Sci. Rep. 2022, 12, 6405. [Google Scholar] [CrossRef] [PubMed]
  37. Che, X.; Tang, W.; Dong, J.; Aili, D.; Yang, J. Anion Exchange Membranes Based on Long Side-Chain Quaternary Ammonium-Functionalized Poly(Arylene Piperidinium)s for Vanadium Redox Flow Batteries. Sci. China Mater. 2022, 65, 683–694. [Google Scholar] [CrossRef]
  38. Shah, A.A.; Watt-Smith, M.J.; Walsh, F.C. A Dynamic Performance Model for Redox-Flow Batteries Involving Soluble Species. Electrochim. Acta 2008, 53, 8087–8100. [Google Scholar] [CrossRef]
  39. Knehr, K.; Agar, E.; Dennison, C.; Kalidindi, A.; Kumbur, E. A Transient Vanadium Flow Battery Model Incorporating Vanadium Crossover and Water Transport through the Membrane. J. Electrochem. Soc. 2012, 159, A1446–A1459. [Google Scholar] [CrossRef]
  40. Yamamura, T.; Watanabe, N.; Yano, T.; Shiokawa, Y. Electron-Transfer Kinetics of Np3+/Np4+, NpO2+/NpO22+, V2+/V3+, and VO2+/VO2+ at Carbon Electrodes. J. Electrochem. Soc. 2005, 152, A830. [Google Scholar] [CrossRef]
  41. Newman, J.; Thomas-Alyea, K.E. Electrochemical Systems; John Wiley & Sons: Hoboken, NJ, USA, 2004; ISBN 978-0-471-47756-3. [Google Scholar]
  42. You, D.; Zhang, H.; Chen, J. A Simple Model for the Vanadium Redox Battery. Electrochim. Acta 2009, 54, 6827–6836. [Google Scholar] [CrossRef]
  43. Zhou, H.; Zhang, H.; Zhao, P.; Yi, B. A Comparative Study of Carbon Felt and Activated Carbon Based Electrodes for Sodium Polysulfide/Bromine Redox Flow Battery. Electrochim. Acta 2006, 51, 6304–6312. [Google Scholar] [CrossRef]
  44. Sum, E.; Skyllas-Kazacos, M. A Study of the V(II)/V(III) Redox Couple for Redox Flow Cell Applications. J. Power Sources 1985, 15, 179–190. [Google Scholar] [CrossRef]
  45. MATLAB—MathWorks. Available online: https://www.mathworks.com/products/matlab.html (accessed on 22 May 2023).
  46. Deep Learning Toolbox. Available online: https://www.mathworks.com/products/deep-learning.html (accessed on 22 May 2023).
Figure 1. Schematic of the VRFB cell employed, with the negatively charged fluid symbolised in red and the positively charged fluid denoted in green. Additional details can be found in the text.
Batteries 10 00023 g001
Figure 2. Architecture of the ANN for voltage prediction.
Batteries 10 00023 g002
Figure 3. Architecture of the ANN for overpotential prediction.
Batteries 10 00023 g003
Figure 4. Comparison of experimentally obtained charge-discharge curves from [42] and simulated curves in a 5 cm2 cell for: (a) a current density of 40 mA cm−2; (b) a current density of 80 mA cm−2.
Batteries 10 00023 g004
Figure 5. Correlation coefficient of the test set ANN for overpotential prediction: (a) ANN1 for voltage prediction; (b) ANN2 for overpotential prediction.
Batteries 10 00023 g005
Figure 6. ANN1 predictions of voltage (coloured surfaces) and CFD results (black circles): (a) charging; (b) discharging.
Batteries 10 00023 g006
Figure 7. Comparison between the CFD data and ANN predictions of the overpotential for a current density of 60 mA/m2 in discharge mode for a State of Charge of 50%.
Batteries 10 00023 g007
Table 1. Source terms for species in the positive and negative electrodes.
Source TermPositive ElectrodeNegative Electrode
SII (V(II) mass conservation equation)- / F
SIII (V(III) mass conservation equation)- / F
SIV (V(IV) mass conservation equation) / F -
SV (V(V) mass conservation equation) / F -
SH+ (proton concentration equation)- 2 · / F
Table 2. Electrolyte properties.
TermSymbolValue
V(II) diffusion coefficient D V 2 2.4 × 10 10   m 2 s 1 [40]
V(III) diffusion coefficient D V 3 2.4 × 10 10   m 2 s 1 [40]
V(IV) diffusion coefficient D V 4 3.9 × 10 10   m 2 s 1 [40]
V(V) diffusion coefficient D V 5 3.9 × 10 10   m 2 s 1 [40]
HSO4 diffusion coefficient D HSO 4 1.33 × 10 9   m 2 s 1 [41]
SO42− diffusion coefficient D SO 4 2 1.065 × 10 9   m 2 s 1 [41]
H+ diffusion coefficient D H + 9.312 × 10 9   m 2 s 1 [41]
Dynamic viscosity μ 4.9238 × 10 3   Pa   s [42]
Table 3. Electrode properties.
TermSymbolValue
Electronic conductivity σ s 1 × 10 3   S   m 1 [42]
Porosity ε 0.929 [43]
Specific surface area a 1.62 × 10 4   m 2 [43]
Kozeny–Carman constant   k c k 4.28 [42]
Electrode fibre diameter d f 1.76 × 10 5   m [43]
Table 4. Kinetic parameters.
TermSymbolValue
Cathodic transfer coefficient α + 0.5 [42]
Anodic transfer coefficient α 0.5 [42]
Standard rate constant for positive reaction k + 6.8 × 10 7   m   s 1 [40]
Standard rate constant for negative reaction k 1.7 × 10 7   m   s 1 [44]
Standard equilibrium potential for positive side E + 1.004   V [38]
Standard equilibrium potential for negative side E 0.255   V [38]
Table 5. Operating conditions and cell geometrical parameters.
TermSymbolValue
TemperatureT298 K
State of ChargeSOC50%
Volumetric flow rateQ 60   mL   min 1
Outlet pressure p o u t 0   Pa
Electrode thickness L e 0.003   m [42]
Electrode width w e 0.025   m [42]
Electrode length h e 0.02   m [42]
Membrane thickness L m 125   μ m [42]
Table 6. Computational time required for each method.
MethodComputational TimeSpeed Up
CFD50 s-
ANN1 (Voltage)0.0032 s15,625
ANN2 (Overpotential)0.1875 s266.7
Disclaimer/Publisher’s Note: The statements, opinions and data contained in all publications are solely those of the individual author(s) and contributor(s) and not of MDPI and/or the editor(s). MDPI and/or the editor(s) disclaim responsibility for any injury to people or property resulting from any ideas, methods, instructions or products referred to in the content.

