Communication

Improved 19F{1H} Saturation Transfer Difference Experiments for Sensitive Detection to Fluorinated Compound Bound to Proteins

1
Division of Agriculture and Agricultural Life Sciences, The University of Tokyo, Yayoi, Bunkyo-ku, Tokyo 113-8657, Japan
2
Department of Chemistry, College of Science and Technology, Meisei University, Hino, Tokyo 191-8506, Japan
*
Author to whom correspondence should be addressed.
Magnetochemistry 2019, 5(1), 1; https://doi.org/10.3390/magnetochemistry5010001
Submission received: 24 October 2018 / Revised: 14 December 2018 / Accepted: 20 December 2018 / Published: 21 December 2018

Abstract

:
The 19F{1H} saturation transfer difference (STD) method was improved for sensitive 19F detection using a human serum albumin-diflunisal complex. Because NMR (nuclear magnetic resonance) experiments with 19F detection are feasible for the selective detection of fluorinated compounds, more sensitive NMR methods are required to be developed for purposes of practicality. The present research focused on the investigations of 19F{1H} STD pulse techniques and experimental parameters, leading to the development of detection methods with higher sensitivity.

Graphical Abstract

1. Introduction

NMR (nuclear magnetic resonance) spectroscopy can be a useful method for analyzing protein–ligand interactions in the solution state. Moreover, various NMR-based screening methods to observe 1H ligand signals have been proposed, such as NOE-pumping [1], saturation transfer difference (STD) [2], water-ligand observed via gradient spectroscopy (WaterLOGSY) [3,4], and reverse NOE-pumping [5] experiments. NMR-based screening methods have also been applied to 19F detection [6,7,8,9]. The characteristic properties of 19F are a 100% natural abundance and high sensitivity for observation. The inclusion of fluorine atoms in a drug molecule generally alters its chemical properties and biological activities, and can influence the interaction with its target [10]. The fluorine substitution in ligand molecules is expected to affect binding owing to the change of intra- and intermolecular forces [11]. For the purpose of developing more practical NMR-based screening methods with 19F detection, 19F{1H} saturation transfer difference (STD) experiments with higher sensitivity were optimized using the complex of diflunisal (Figure 1) and human serum albumin (HSA). Diflunisal contains two fluorine atoms per molecule, and is a nonsteroidal anti-inflammatory drug. Since the X-ray crystal structure of a diflunisal-HSA complex is available (pdb: 2BXE), this complex could be a suitable model system for studying the molecular interactions of 1H and 19F using NMR spectroscopy.

2. Materials and Methods

2.1. Instrumentation and Chemicals

All of the NMR spectra were recorded at 20 °C on a Varian 600 MHz NMR system equipped with an HFX probe (Varian, Palo Alto, CA, USA). Diflunisal and HSA were purchased from Sigma-Aldrich (Tokyo, Japan). A 600-μL volume of solution containing 0.05 mM HSA and 2.5 mM diflunisal was prepared in 100% 2H2O.

2.2. NMR Spectroscopy

The experimental parameters of the 19F{1H} STD experiment were as follows: data points = 16,384, spectral width of 19F = 6818 Hz, number of scans = 2048 or 4096. The saturation times for the selective excitation of protein were arrayed in the range of 0.5–3.0 s. The on-resonance frequency of 1H was 0.6 ppm, and the off-resonance frequencies were arrayed at 6000 Hz increments in the range of −50 to 50 ppm for comparison. The shaped pulses of I-BURP-1, I-BURP-2, Q3, G3, and Gaussian were made using VnmrJ software (Agilent Technologies, Santa Clara, CA, USA). The pulse widths (H1/2) were 4.67 ms (715 Hz), 4.87 ms (1133 Hz), 3.77 ms (900 Hz), 3.86 ms (637 Hz) and 0.866 ms (1426 Hz), respectively.

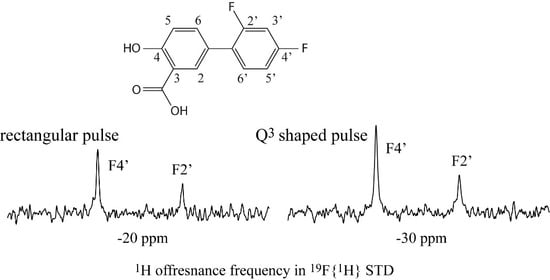
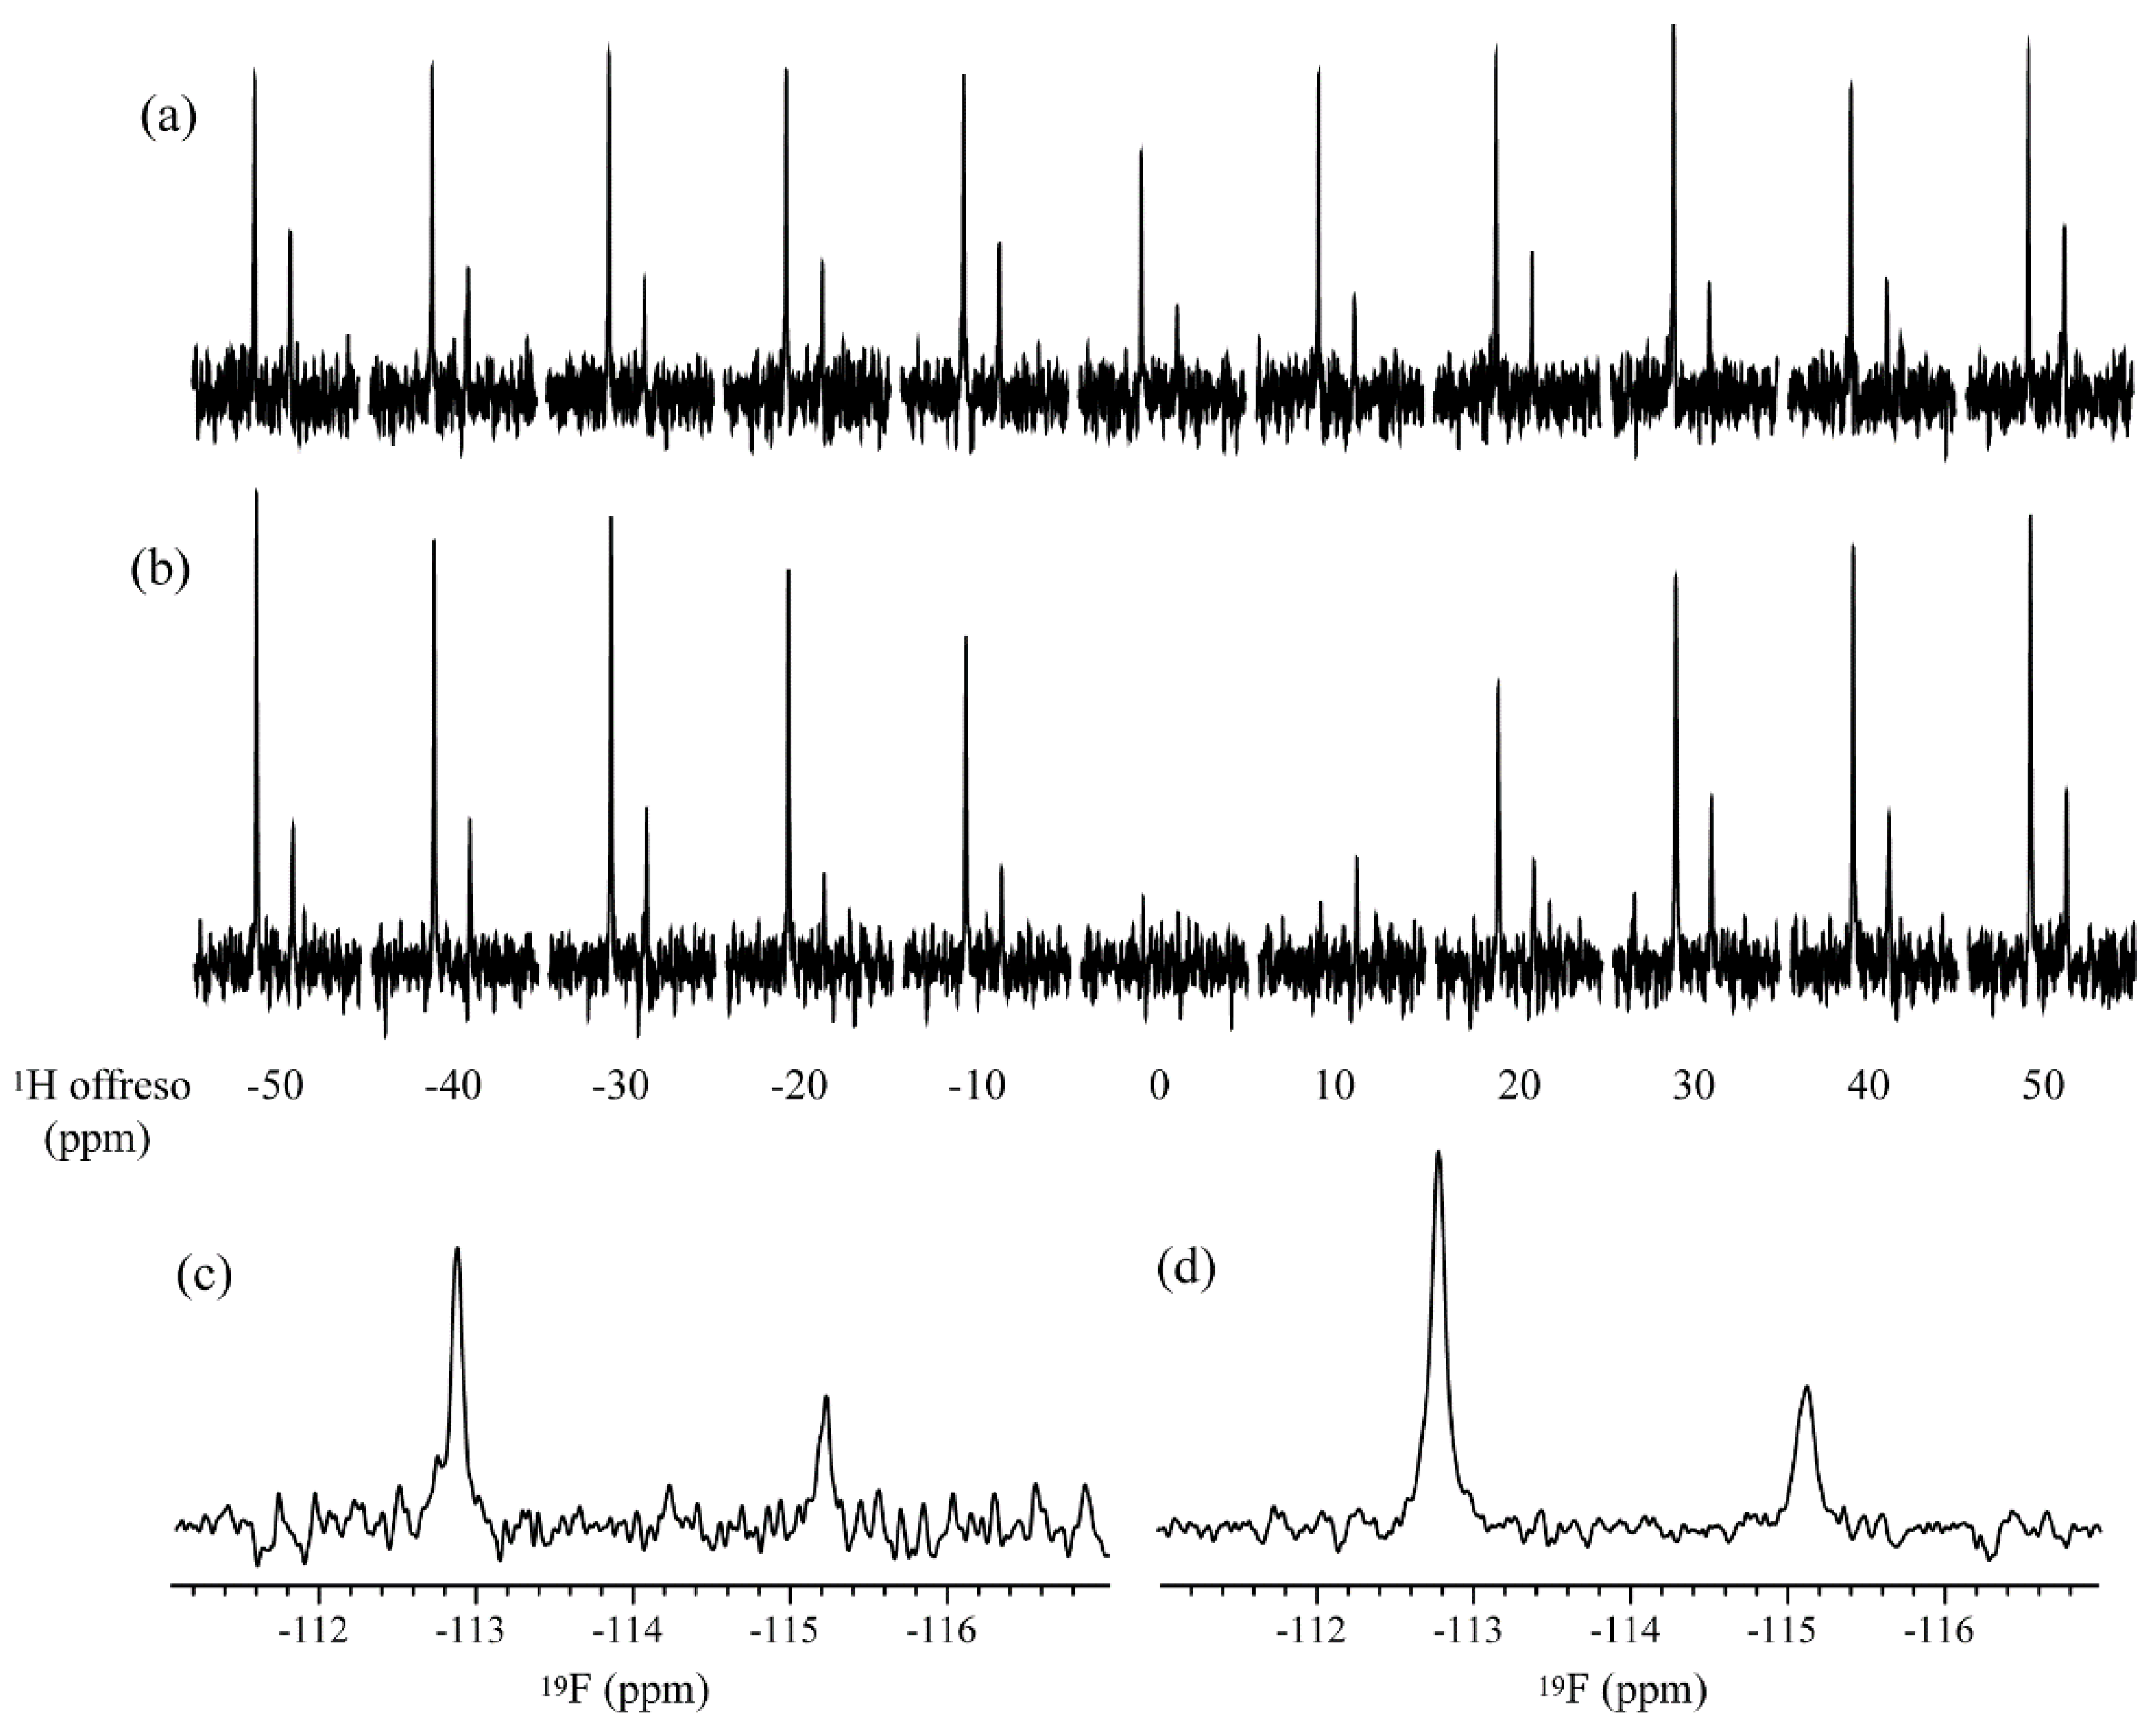
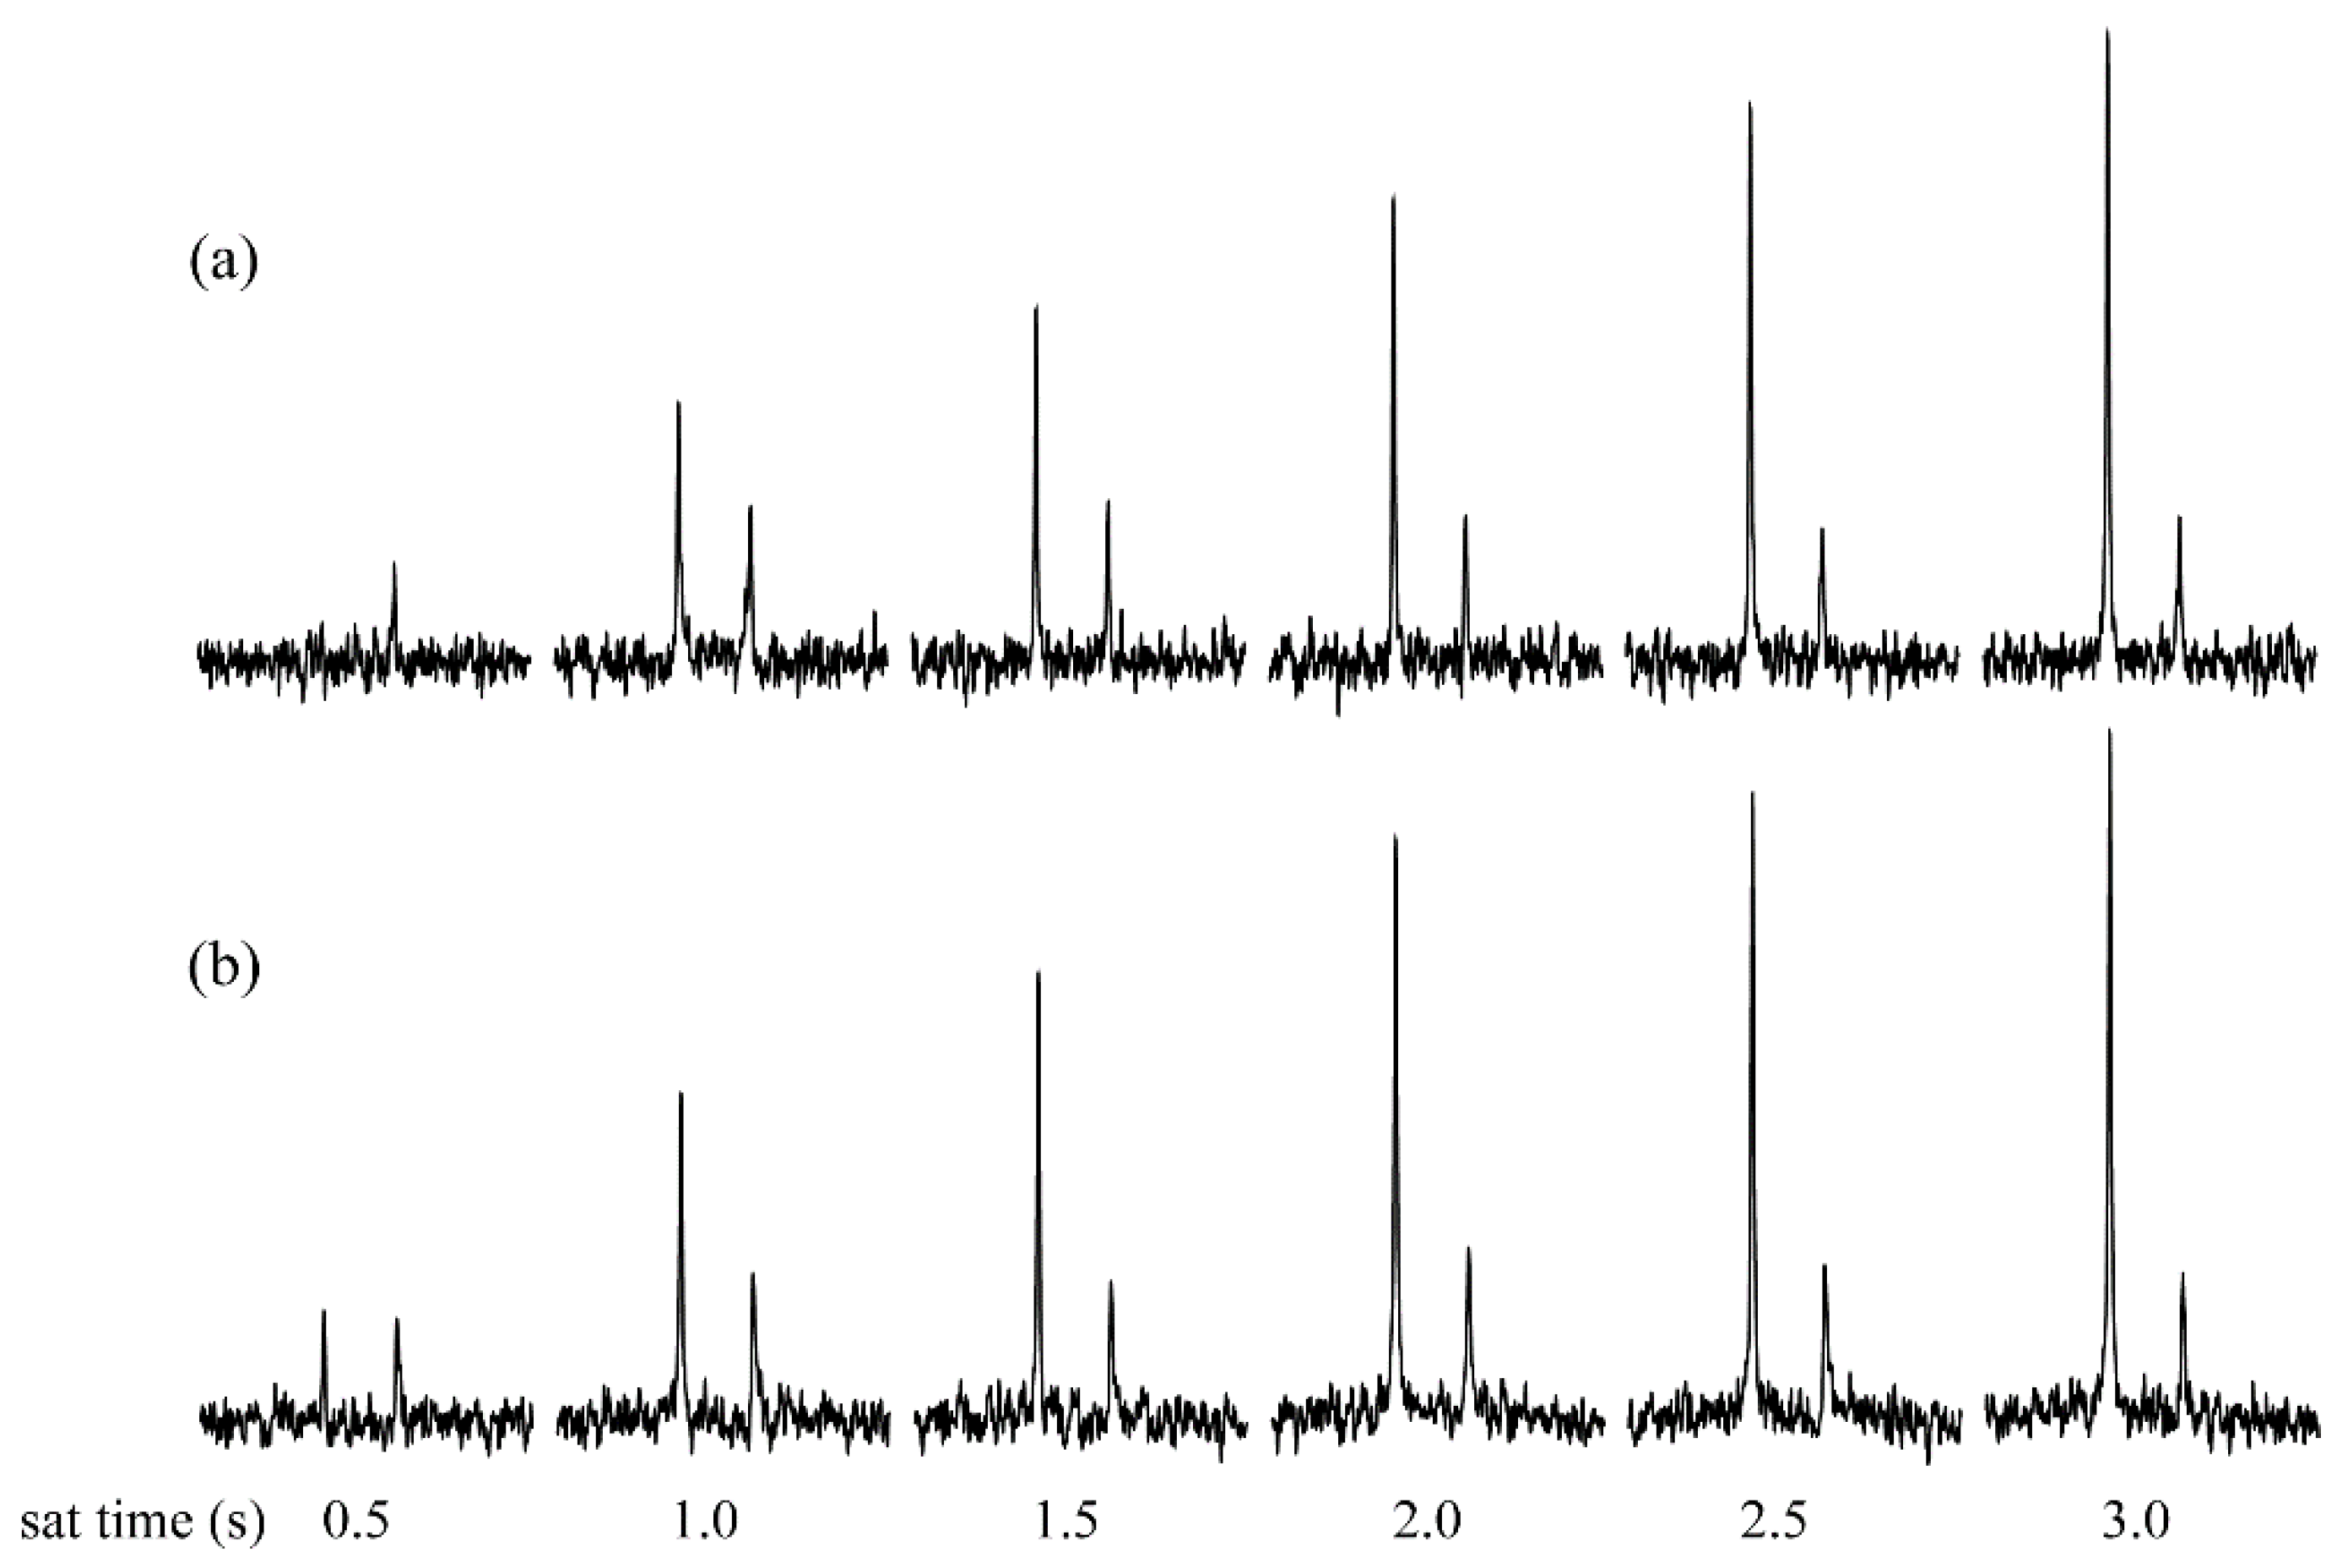
3. Results and Discussion

An optimization of the 19F{1H} STD experiments was carried out based on the 19F{1H} STD pulse sequence (Figure 2a) used in our past study [12]. Regarding the selective excitation of protein signals, several pulse schemes, such as a single rectangular pulse and various shaped pulses, were evaluated using the pulse sequences shown in Figure 2. The saturation time was set to 1.5 s in each experiment for comparison. The repetitive time n shown in Figure 2b was adjusted to set the total saturation time.
The S/N ratios calculated using the VnmrJ software (Agilent Technologies) are shown in each spectrum (Figure 3). The most sensitive spectrum was acquired by an application of a Gaussian shaped pulse (Figure 3f). The sensitivities were almost equal among the rectangular pulse, I-BURP-2, and Q3 shaped pulses. In setting the rectangular pulse, a higher power was expected to result in a higher sensitivity; however, it could also lead to serious damage of the probe. Considering the sensitivity and maintenance of the probe, the Gaussian shaped pulse was expected to be the most feasible pulse scheme in the 19F{1H} STD experiments.
In the STD experiments, to observe ligand signals bound to proteins, on-resonance frequency was set on the protein (e.g., methyl region) and off-resonance frequency was set outside the signal region for reference (e.g., −20 ppm). Although the 1H off-resonance frequency was generally set without careful consideration, it was arrayed in the range of −50 to 50 ppm to observe the impact on the sensitivity (Figure 4). The rectangular and Gaussian shaped pulses, corresponding to the previous [12] and currently optimized pulse schemes, were employed for comparison. The 1H off-resonance frequency was optimized to be δ1H = −30 ppm, indicating that its careful setting was crucial for obtaining the sensitive spectra. The expanded 19F{1H} STD spectra, acquired using the past parameters [12] and the optimized parameters, are shown in Figure 4c,d.
In the 1H{1H} STD experiments, the STD build-up curves could be obtained at various saturation times [17]. The slope of the STD build-up curve at a saturation time of 0 s was obtained by fitting to the monoexponential equation: STD = STDmax(1 − e(−ksat × t)), where STD stands for the STD signal intensity at saturation time t; STDmax is the maximal STD intensity at long saturation times; and ksat stands for the observed saturation constant. The values of ksat × STDmax are generally used for epitope mapping [17]. The 19F{1H} STD build-up curves were obtained using a rectangular pulse and Gaussian shaped pulses for 1H saturation (Figure 5). The saturation times were arrayed in the range of 0.5–3.0 s, and the values of the STD effect were normalized by referencing the signal of F2’ with the largest STD effect as 100%. The normalized values of F4’ using a rectangular pulse and Gaussian shaped pulses were 21.7 and 28.7%, respectively, indicating that F2’ made a more significant contribution to binding with HSA (human serum albumin).

4. Conclusions

The pulse schemes for 1H saturation were evaluated, and the Gaussian shaped pulse was considered to be most feasible for the purposes of sensitivity and maintaining the instruments. The 1H off-resonance frequency affected sensitivity, suggesting the importance of its optimization. Repetition of the shaped pulses could lead to some artifacts or phase distortion, which would be the reason why subtle differences in the 1H off-resonance frequency affected sensitivity, besides off-resonance effects. The proposed technique with 19F detection is expected to be a useful NMR screening method for fluorinated compounds.

Author Contributions

Conceptualization, M.T.; Methodology, M.T., K.F.; Writing, M.T.; Supervision, K.F.; Project Administration, M.T.; Funding Acquisition, M.T.

Funding

This research was funded by JSPS KAKENHI Grant Numbers JP15K05550 and JP18K05185 for M.T.

Acknowledgments

This study was supported by Meisei University and JSPS KAKENHI Grant Numbers JP15K05550 and JP18K05185 for M.T.

Conflicts of Interest

The authors declare no conflict of interest.

References

  1. Chen, A.; Shapiro, M.J. NOE Pumping: A novel NMR technique for identification of compounds with binding affinity to macromolecules. J. Am. Chem. Soc. 1998, 120, 10258–10259. [Google Scholar] [CrossRef]
  2. Maye, M.; Meyer, B. Group epitope mapping by saturation transfer difference NMR to identify segments of a ligand in direct contact with a protein receptor. J. Am. Chem. Soc. 2001, 123, 6108–6117. [Google Scholar]
  3. Dalvit, C.; Pevarello, P.; Tatò, M.; Veronesi, M.; Vulpetti, A.; Sundström, M. Identification of compounds with binding affinity to proteins via magnetization transfer from bulk water. J. Biomol. NMR 2000, 18, 65–68. [Google Scholar] [CrossRef] [PubMed]
  4. Dalvit, C.; Fogliatto, G.P.; Stewart, A.; Veronesi, M.; Stockman, B.J. WaterLOGSY as a method for primary NMR screening: Practical aspects and range of applicability. J. Biomol. NMR 2001, 21, 349–359. [Google Scholar] [CrossRef] [PubMed]
  5. Chen, A.; Shapiro, M.J. NOE Pumping. 2. A high-throughput method to determine compounds with binding affinity to macromolecules by NMR. J. Am. Chem. Soc. 2000, 122, 414–415. [Google Scholar] [CrossRef]
  6. Dalvit, C.; Fagerness, P.E.; Hadden, S.T.A.; Sarver, R.W.; Stockman, B.J. Fluorine-NMR experiments for high-throughput screening: Theoretical aspects, practical considerations, and range of applicability. J. Am. Chem. Soc. 2003, 125, 7696–7703. [Google Scholar] [CrossRef] [PubMed]
  7. Dalvit, C.; Flocco, M.; Stockman, B.J.; Veronesi, M. Competition binding experiments for rapidly ranking lead molecules for their binding affinity to human serum albumin. Comb. Chem. High Throughput Screen. 2002, 5, 645–650. [Google Scholar] [CrossRef] [PubMed]
  8. Sakuma, C.; Kurita, J.; Furihata, K.; Tashiro, M. Achievement of 1H-19F heteronuclear experiments using the conventional spectrometer with a shared single high band amplifier. Magn. Reson. Chem. 2015, 53, 327–329. [Google Scholar] [CrossRef] [PubMed]
  9. Diercks, T.; Ribeiro, J.P.; Canada, F.J.; Andre, S.; Jimenez-Barbero, J.; Gabius, H. Fluorinated Carbohydrates as Lectin Ligands: Versatile Sensors in 19F-Detected Saturation Transfer Difference NMR Spectroscopy. Chem. Eur. J. 2009, 15, 5666–5668. [Google Scholar] [CrossRef] [PubMed]
  10. Park, B.K.; Kitteringham, N.R.; O’Neill, P.M. Metabolism of fluorine-containing drugs. Annu. Rev. Pharmacol. Toxicol. 2001, 41, 443–470. [Google Scholar] [CrossRef] [PubMed]
  11. O’Hagan, D.; Harper, D.B. Fluorine-containing natural products. J. Fluorine Chem. 1999, 100, 127–133. [Google Scholar] [CrossRef]
  12. Furihata, K.; Usui, M.; Tashiro, M. Application of NMR screening methods with 19F detection to fluorinated compounds bound to proteins. Magnetochemistry 2018, 4, 3. [Google Scholar] [CrossRef]
  13. Geen, H.; Freeman, R. Band-selective radiofrequency pulses. J. Magn. Reson. 1991, 93, 93–141. [Google Scholar] [CrossRef]
  14. Emsley, L.; Bodenhausen, G. Optimization of shaped selective pulses for NMR using a quaternion description of their overall propagators. J. Magn. Reson. 1992, 97, 135–148. [Google Scholar] [CrossRef]
  15. Emsley, L.; Bodenhausen, G. Gaussian pulse cascades: New analytical functions for rectangular selective inversion and in-phase excitation in NMR. Chem. Phys. Lett. 1990, 165, 469–476. [Google Scholar] [CrossRef]
  16. Bauer, C.; Freeman, R.; Frenkiel, T.; Keeler, J.; Shaka, A.J. Gaussian pulses. J. Magn. Reson. 1984, 58, 442–457. [Google Scholar]
  17. Mayer, M.; James, T.L. NMR-based characterization of phenothiazines as a RNA binding scaffold. J. Am. Chem. Soc. 2004, 126, 4453–4460. [Google Scholar] [CrossRef] [PubMed]
Figure 1. The structure of diflunisal.
Magnetochemistry 05 00001 g001
Figure 2. The pulse sequences of the 1H-19F saturation transfer difference (STD) experiment. The thin bars represent 90-degree pulses. All pulses were along the x direction unless otherwise shown. In (a), the 1H pulse width (H1/2) was 1.5 s (40 Hz). In (b), I-BURP-1, I-BURP-2 [13], Q3 [14], G3 [15], and Gaussian [16] shaped pulses were used for evaluations. Each pulse width (H1/2) was 4.67 ms (715 Hz), 4.87 ms (1133 Hz), 3.77 ms (900 Hz), 3.86 ms (637 Hz), and 0.866 ms (1426 Hz), respectively. The repetitive time n was adjusted for the total saturation time. The experimental parameters were; d1 = 1.0 s, d2 = 10 μs, G1 = 7.2 G/cm, gradient pulse width = 2.0 ms. Phase cycling: φ1 = x, −x, −x, x, y, −y, −y, y; φr = x, x, −x, −x, y, y, −y, −y. In the 19F-1H STD experiment, two channels of 19F and 1H were switched.
Magnetochemistry 05 00001 g002
Figure 3. The 19F{1H} STD spectra acquired using (a) a rectangular pulse, (b) G3, (c) I-BURP-1, (d) I-BURP-2, (e) Q3, and (f) Gaussian shaped pulses for 1H saturation. The S/N ratios calculated using VnmrJ software are shown in each STD spectrum. (g) A reference 19F spectrum.
Magnetochemistry 05 00001 g003
Figure 4. The 19F{1H} STD spectra acquired using (a) a rectangular pulse and (b) Gaussian shaped pulses for 1H saturation. The 1H on-resonance frequency was set to 0.6 ppm, and the 1H off-resonance frequencies were arrayed in the range of −50 to 50 ppm. The expanded spectra acquired using (c) a rectangular and (d) Gaussian shaped pulses. The 1H off-resonance frequencies were (c) −20 ppm and (d) −30 ppm.
Magnetochemistry 05 00001 g004
Figure 5. The 19F{1H} STD spectra acquired with various saturation times using (a) a rectangular pulse and (b) Gaussian shaped pulses for 1H saturation.
Magnetochemistry 05 00001 g005

