Structural Changes of Zn(II)bleomycin Complexes When Bound to DNA Hairpins Containing the 5′-GT-3′ and 5′-GC-3′ Binding Sites, Studied through NMR Spectroscopy


Abstract
:
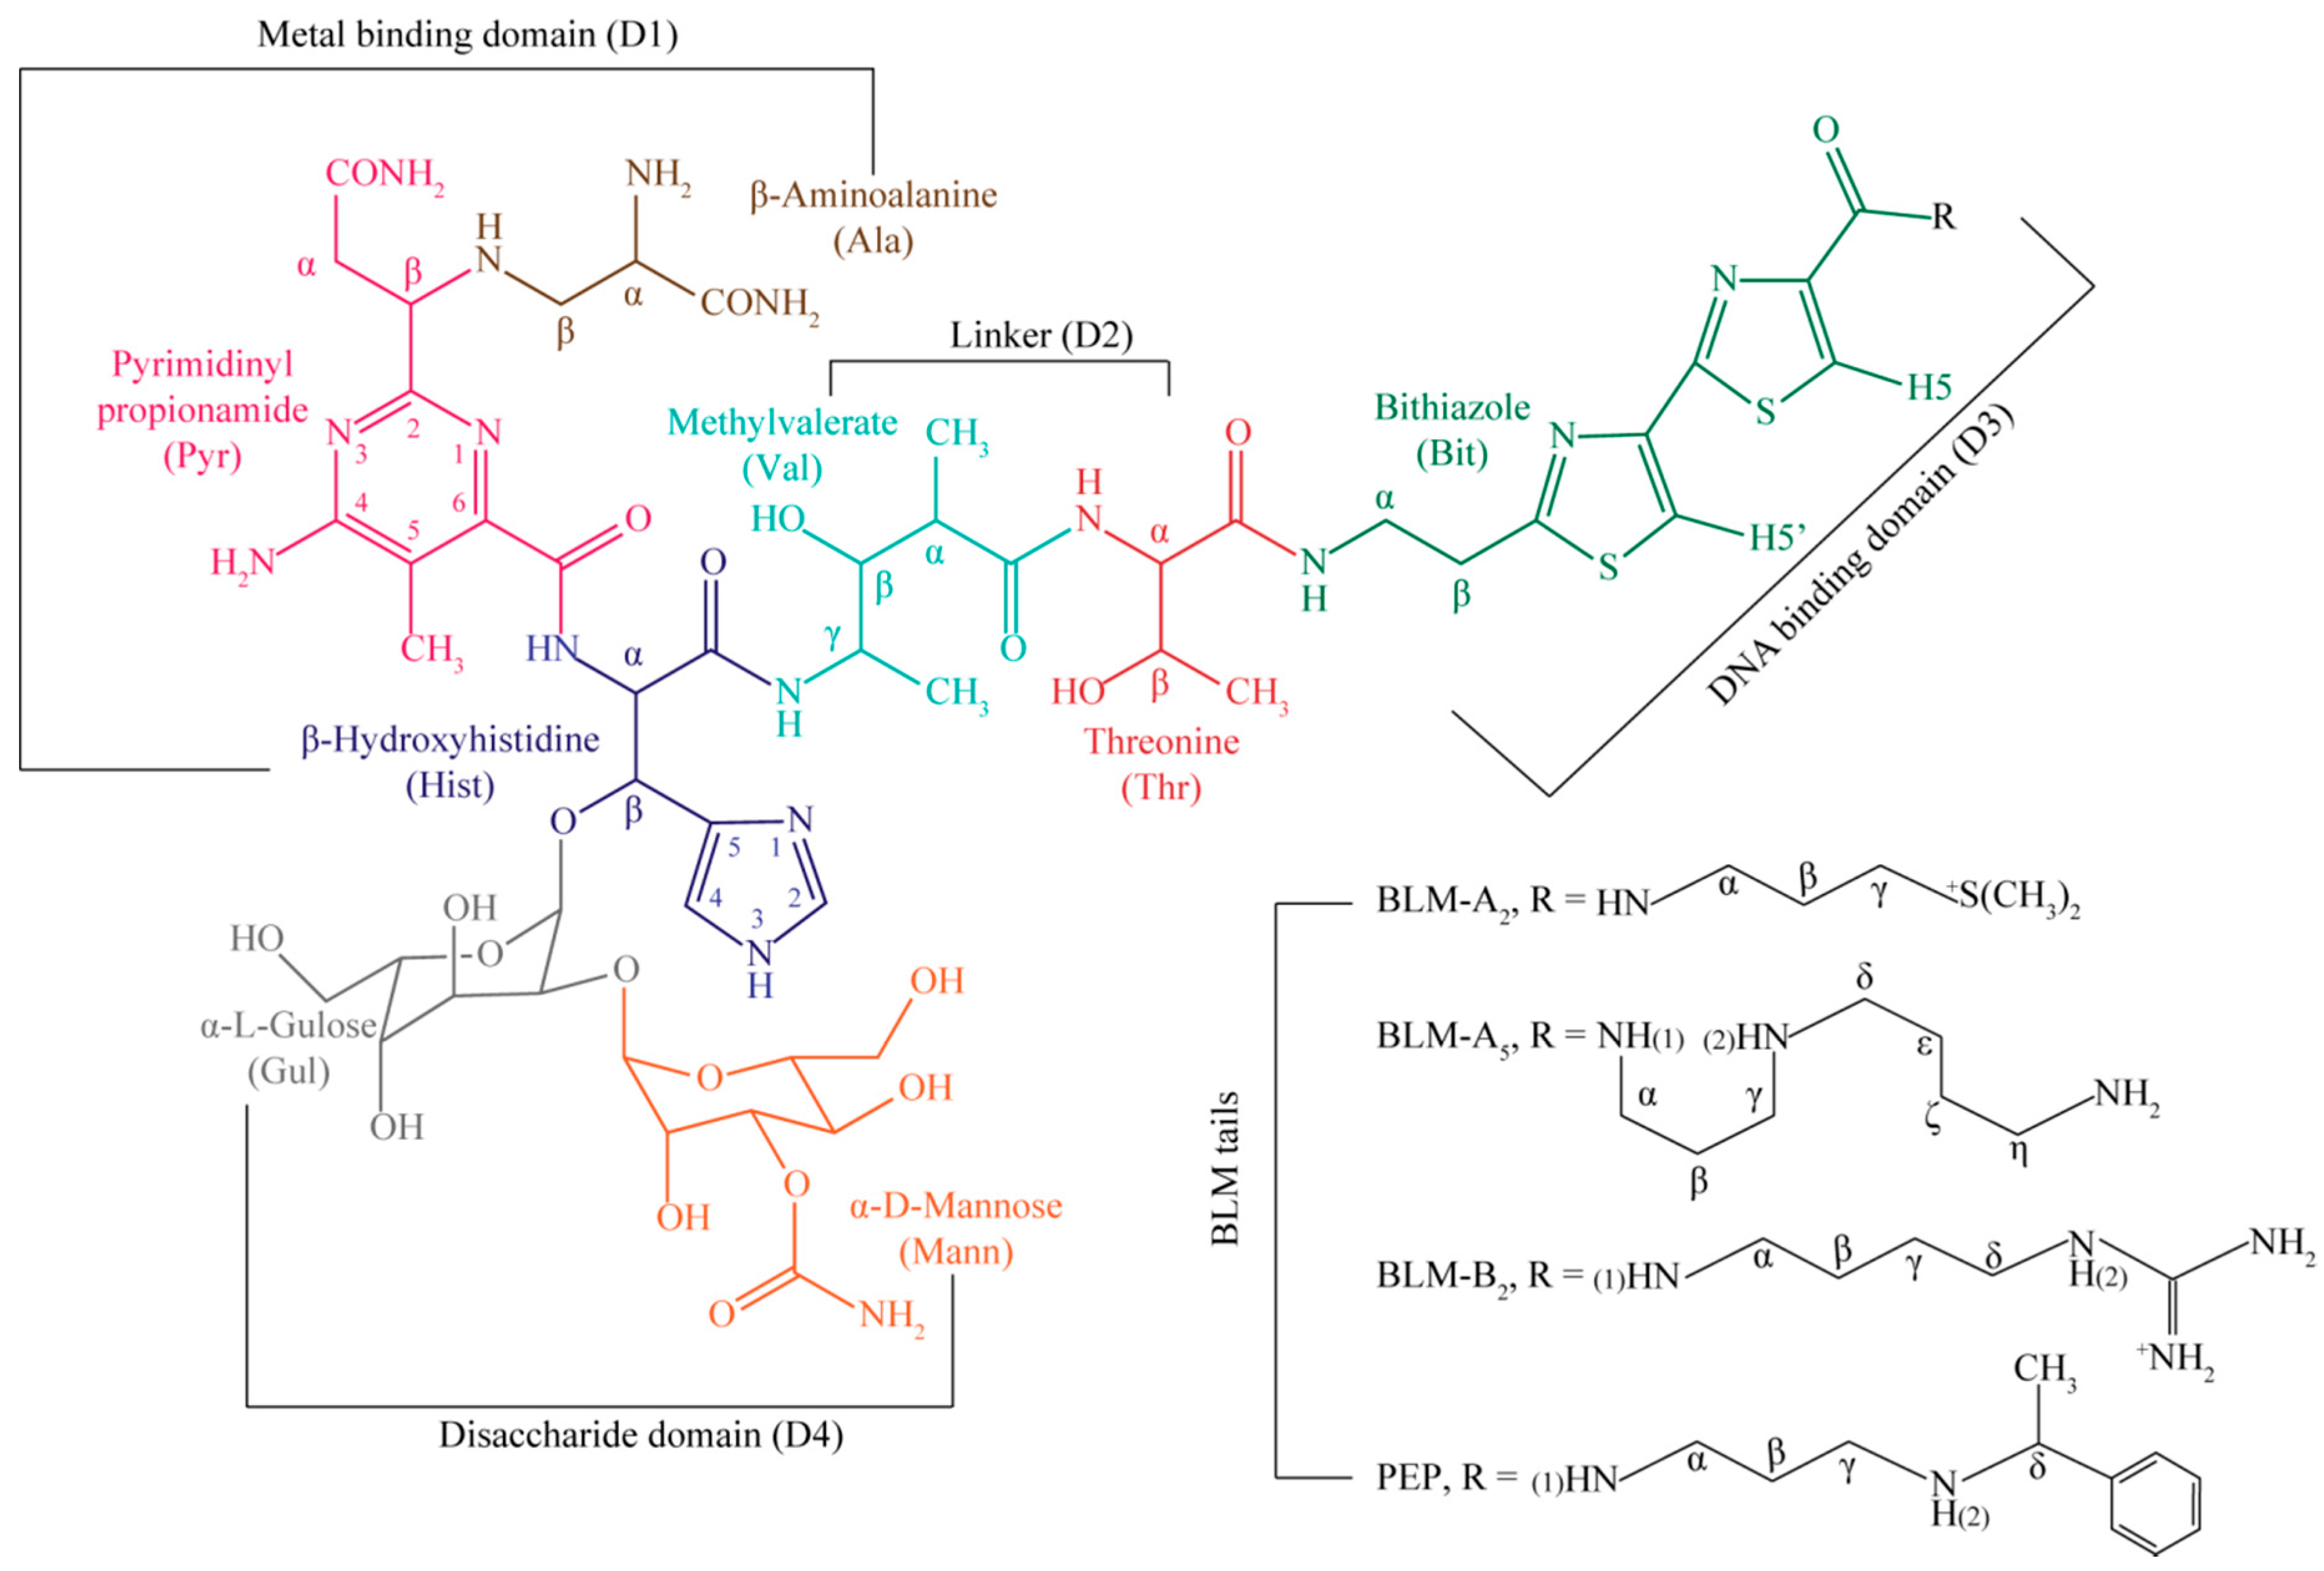
1. Introduction
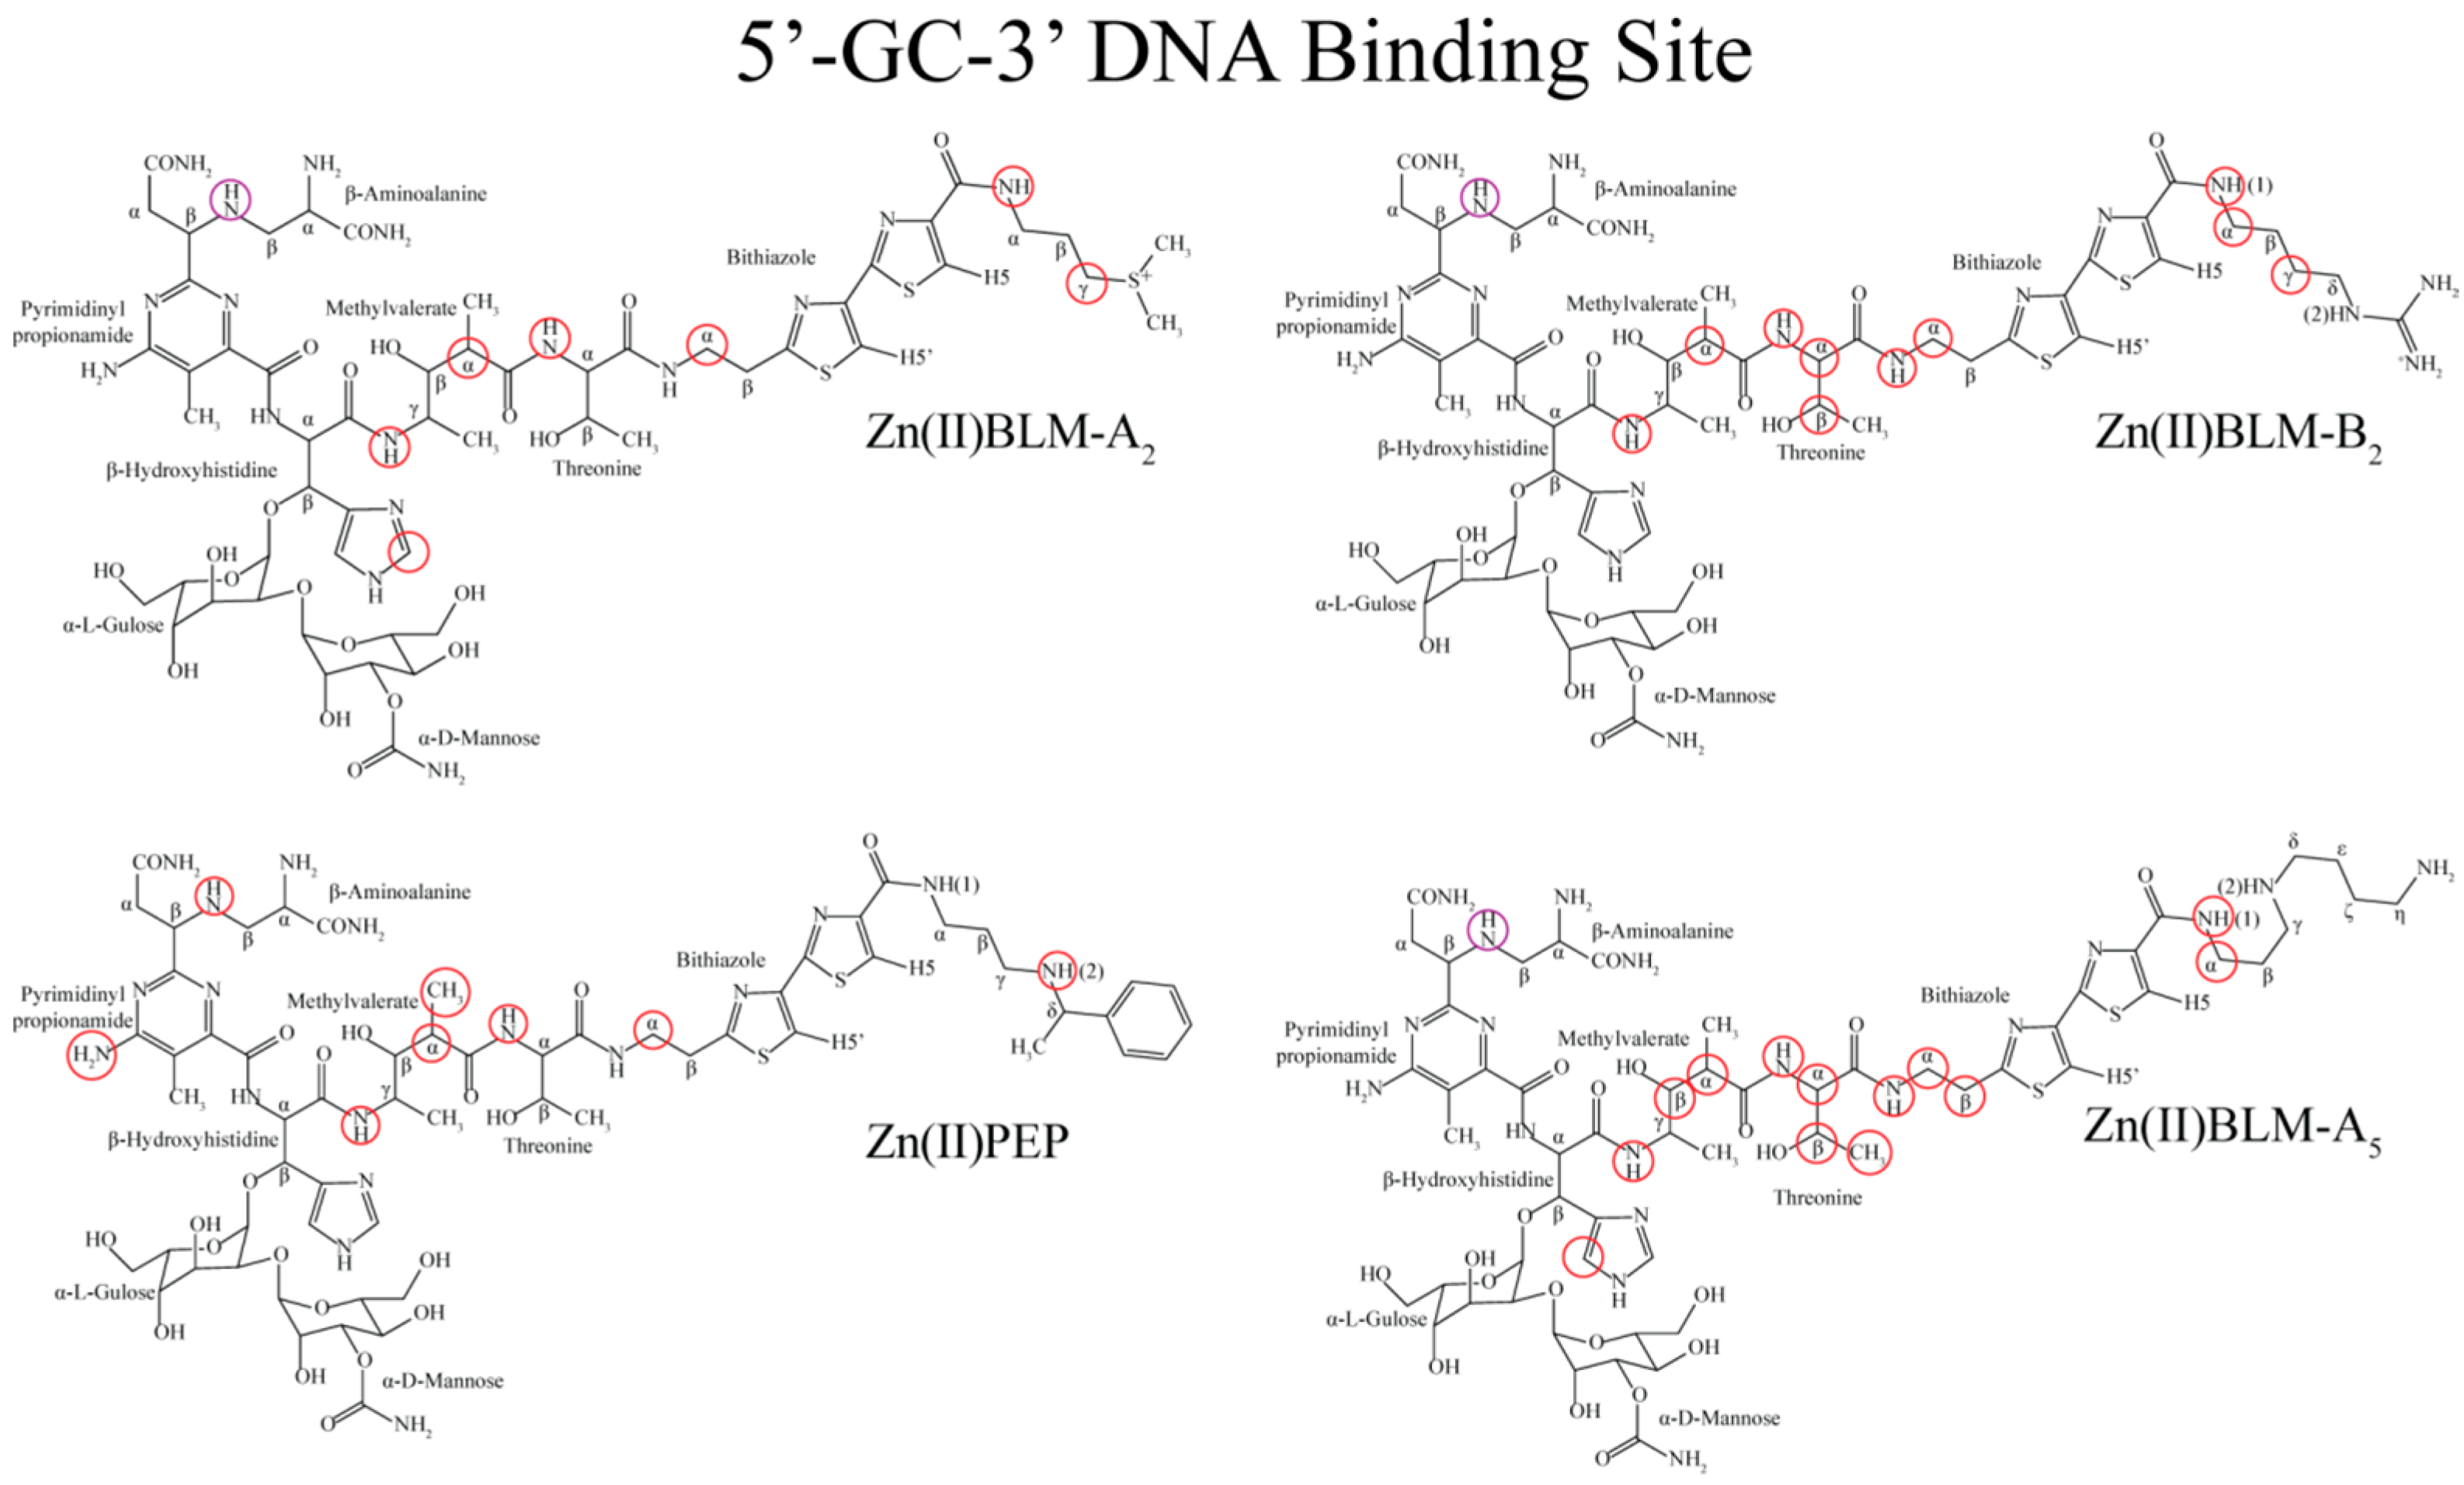
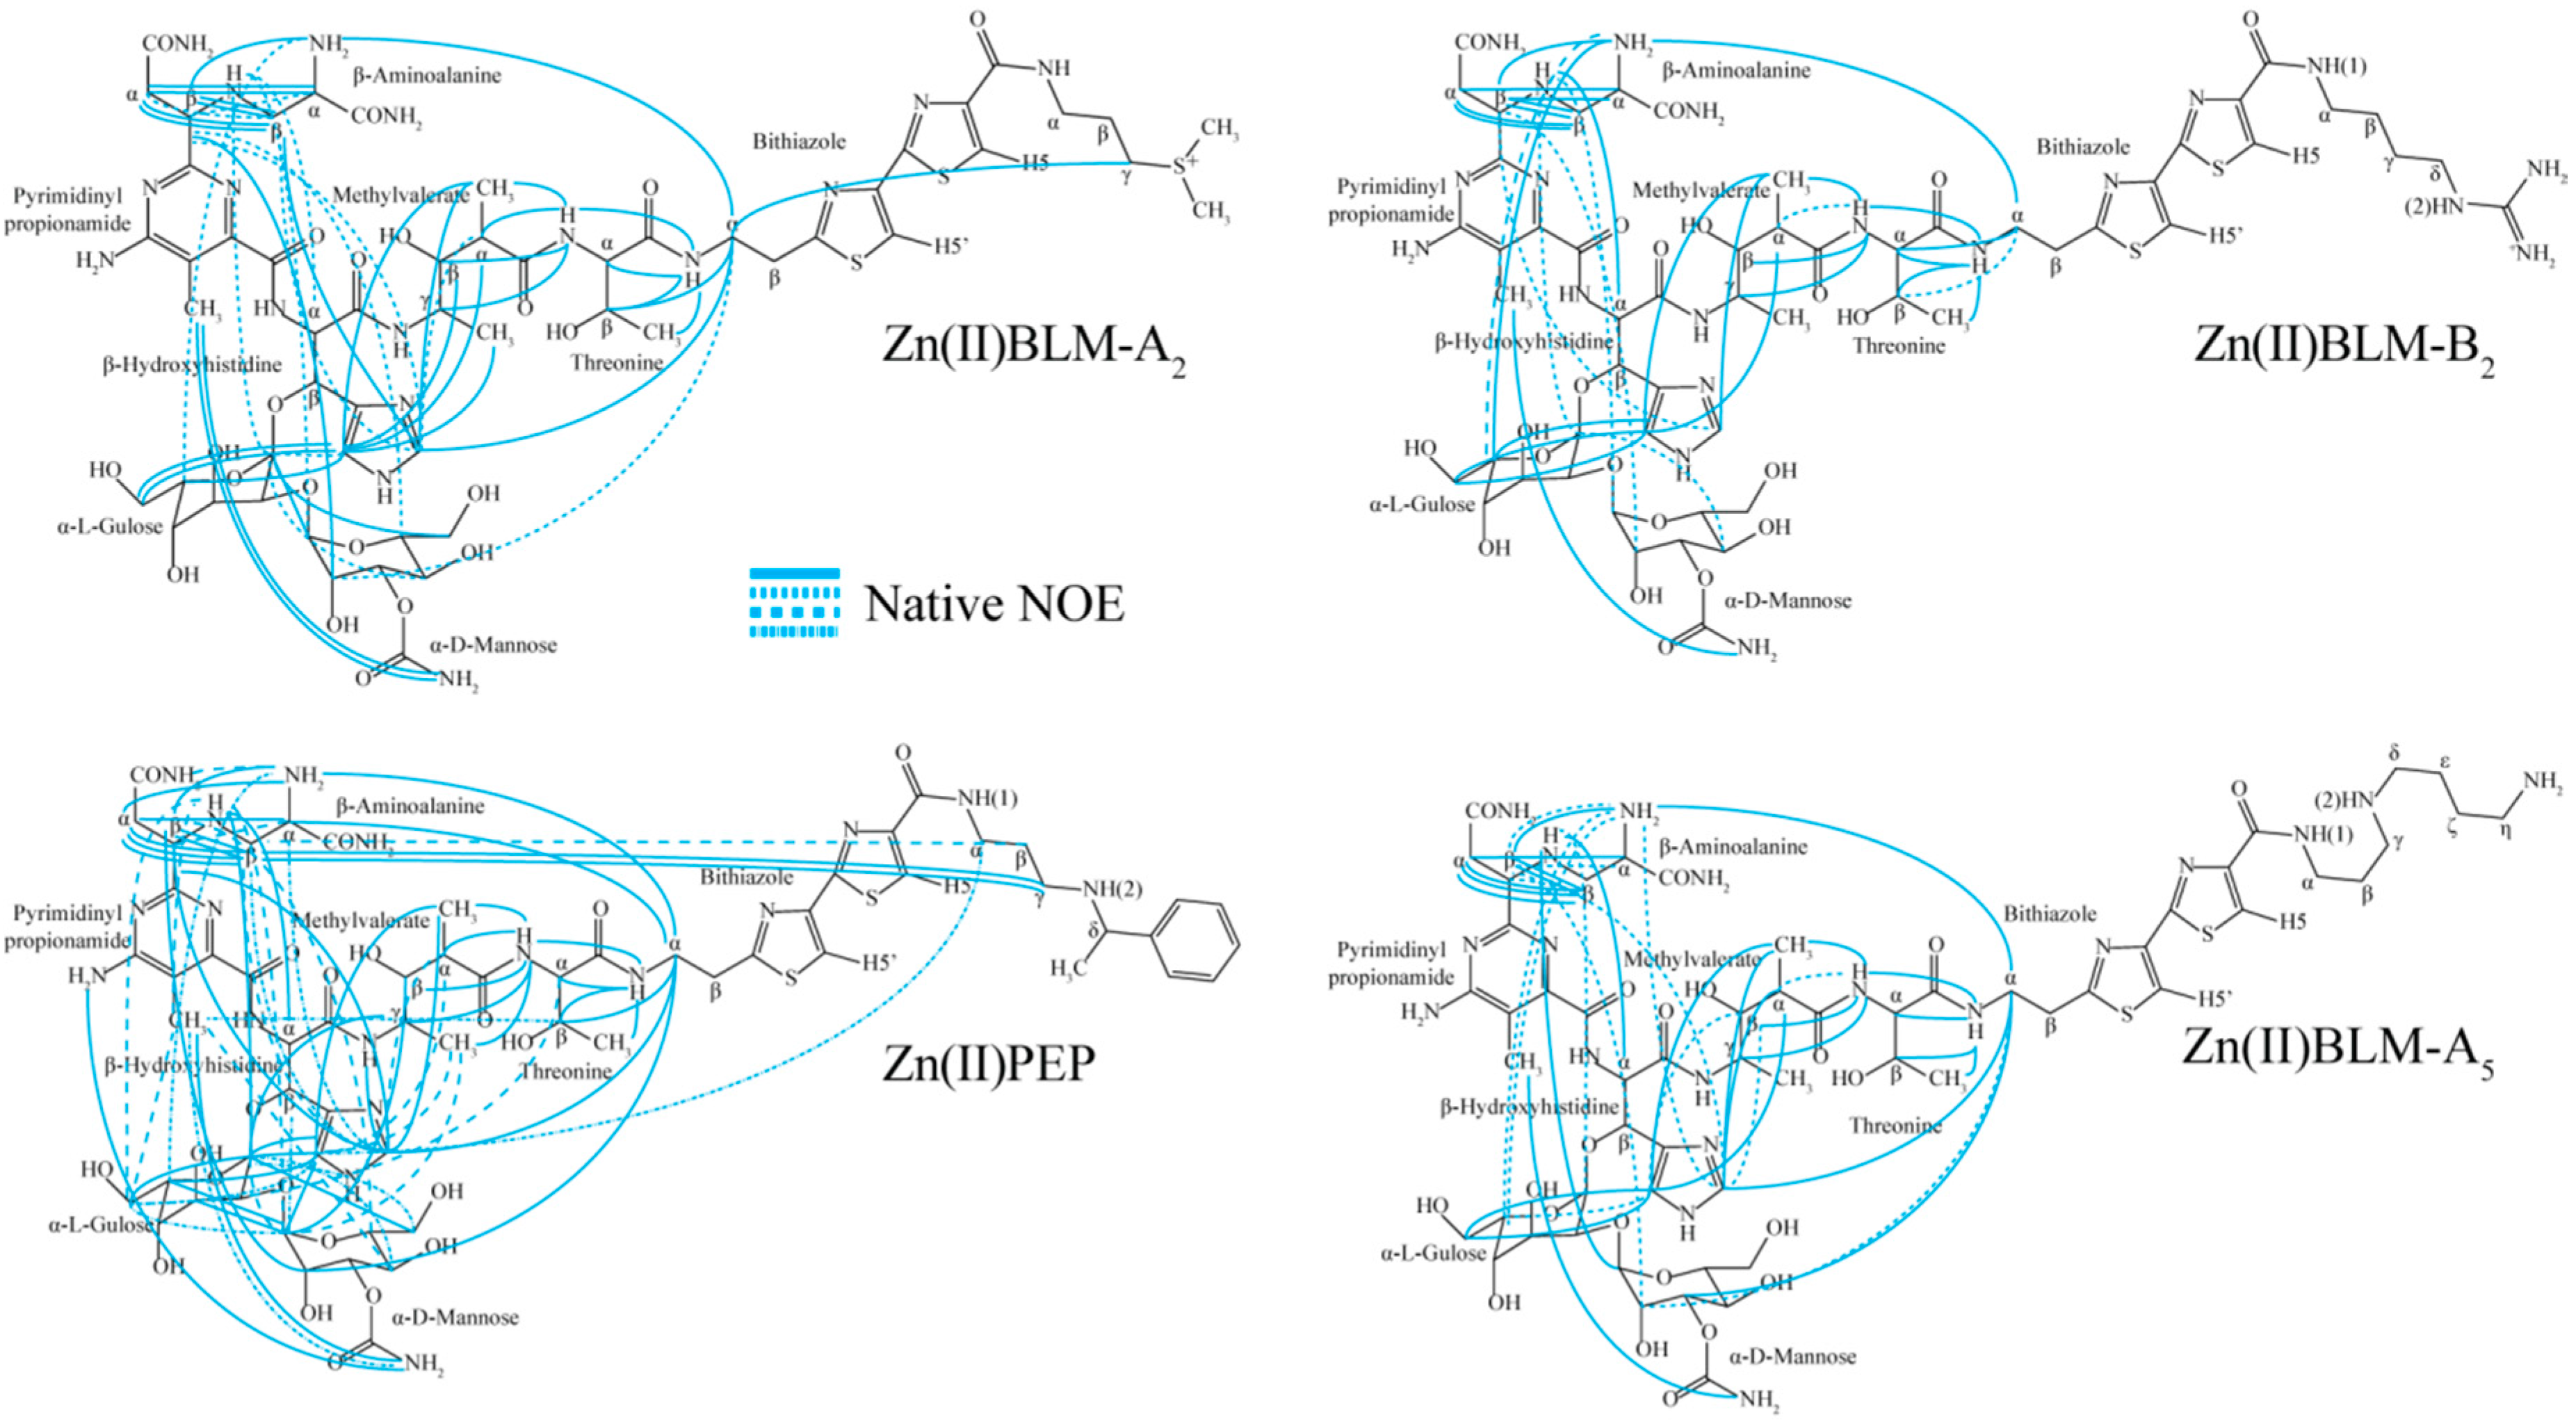
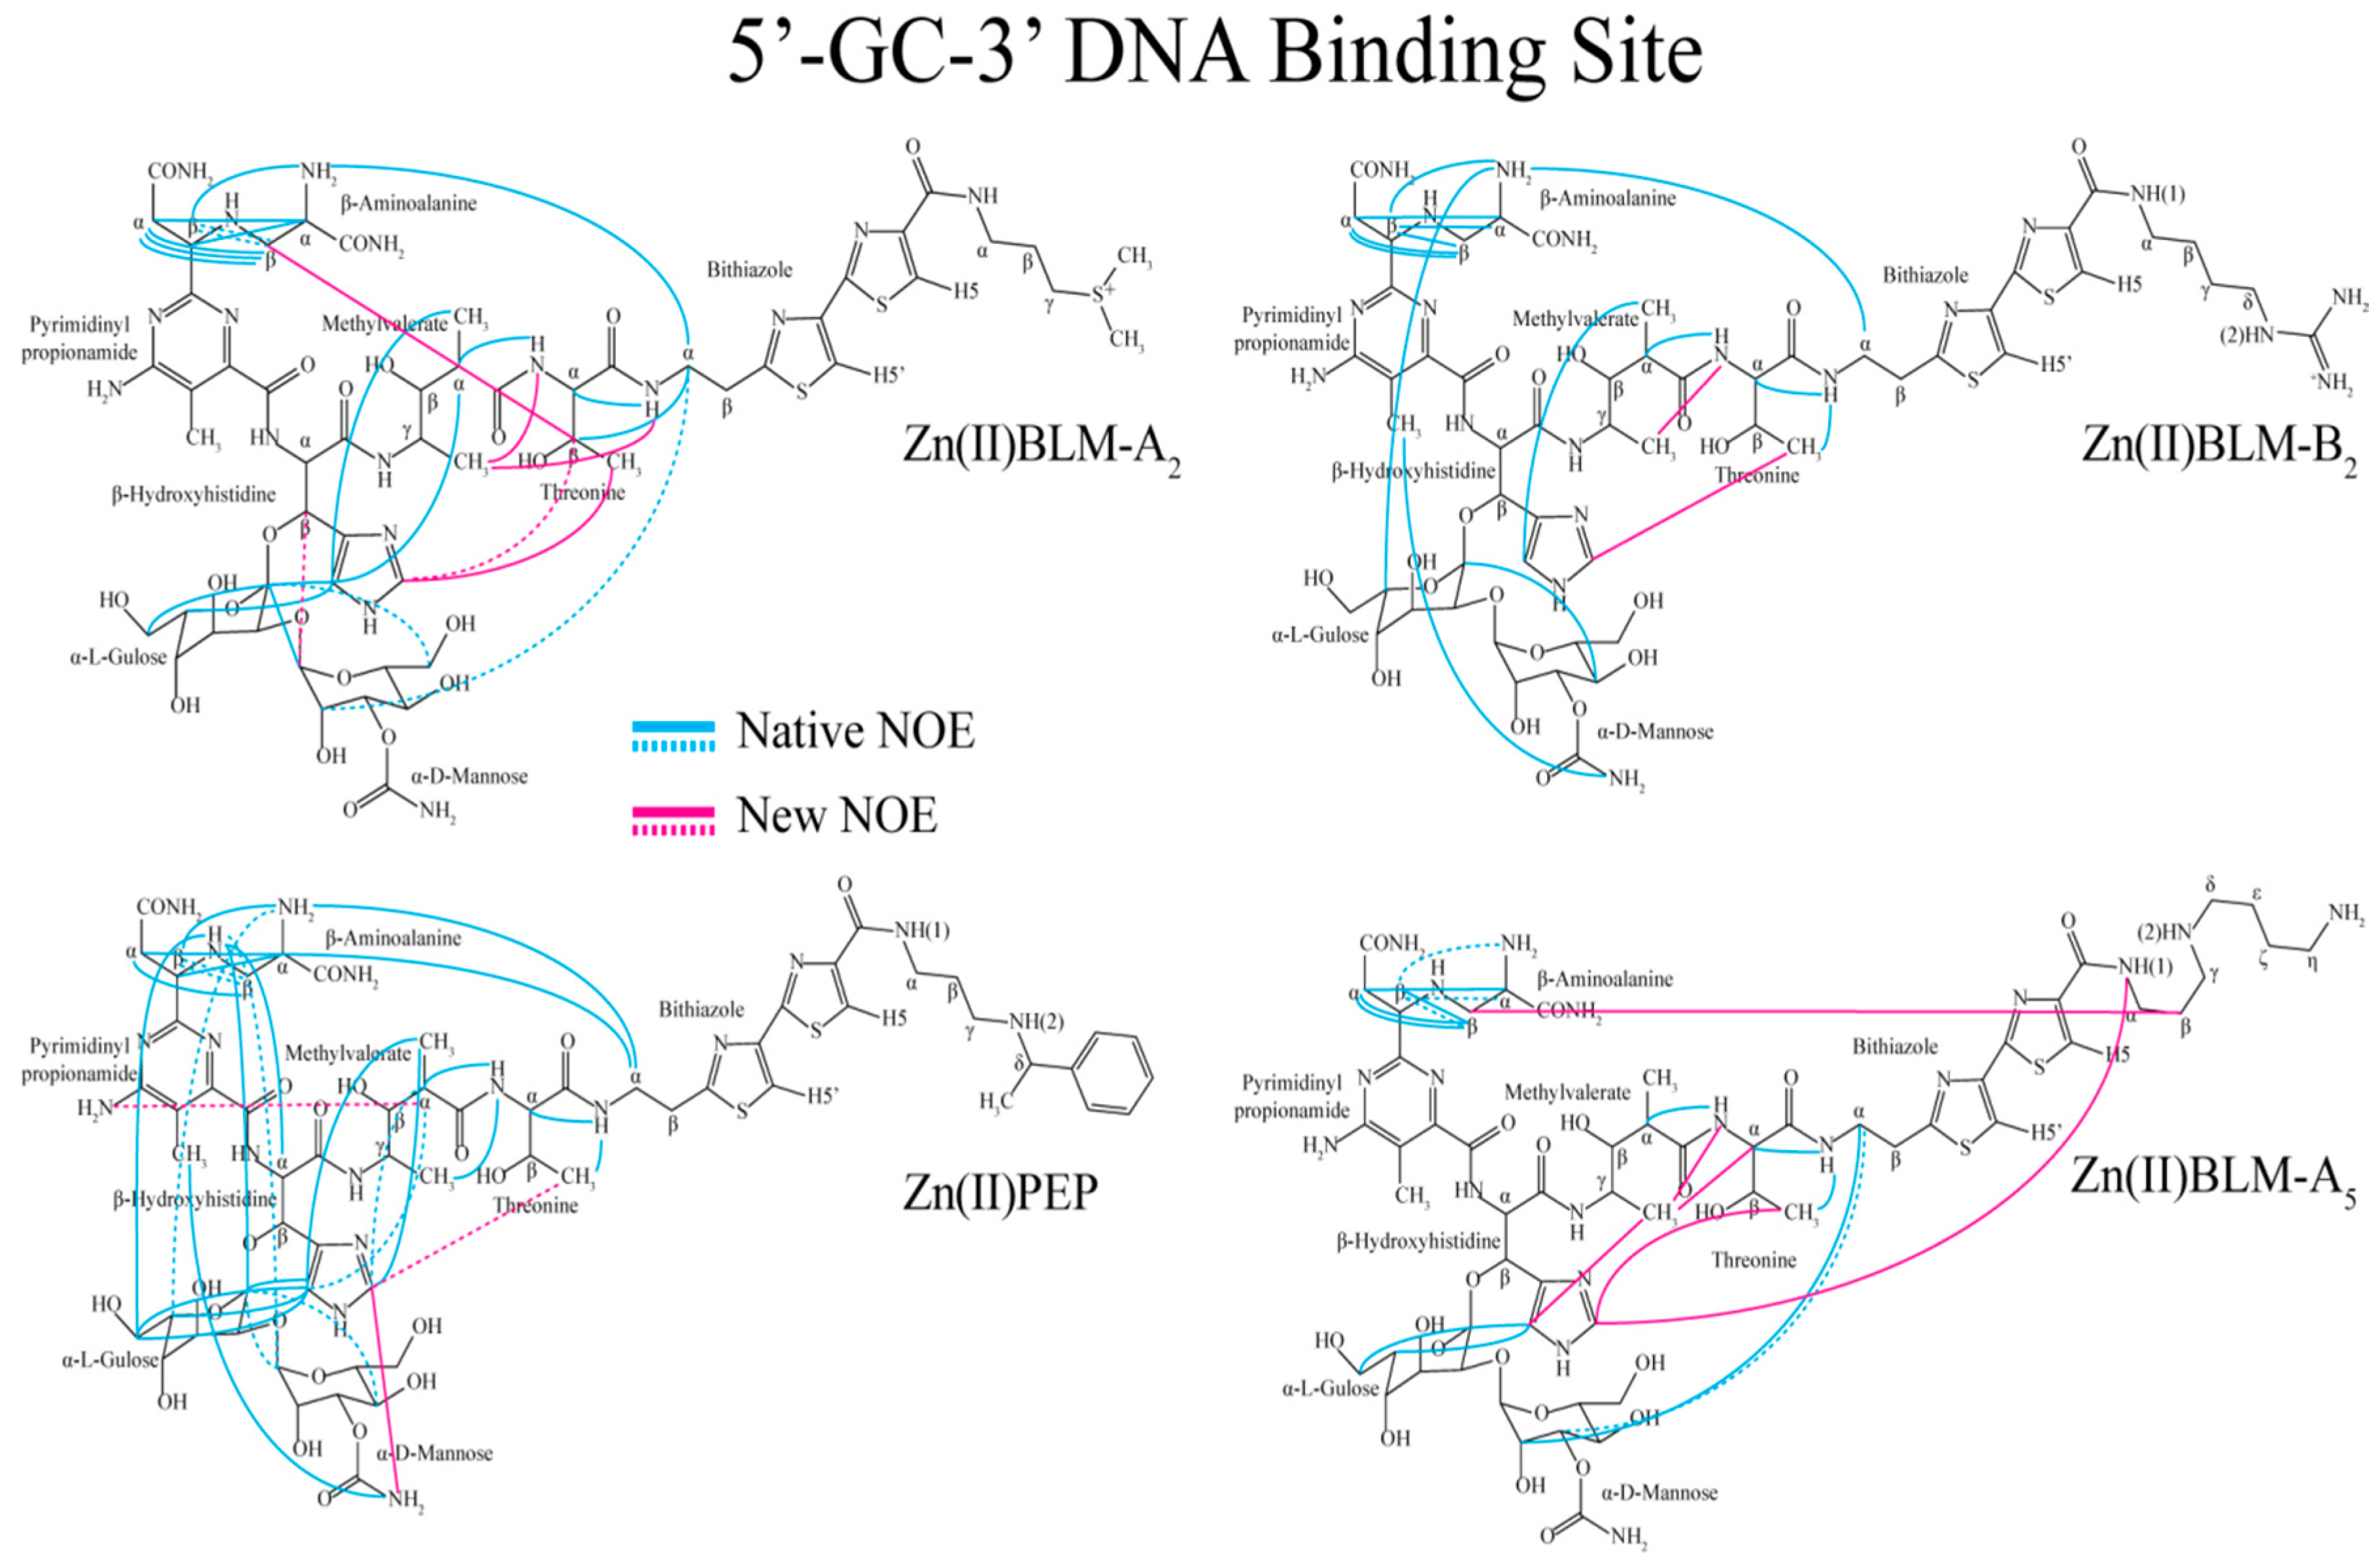
2. Results
3. Discussion
3.1. Bithiazole (D3)
3.2. C-termini (D3)
3.3. Linker (D2)
3.4. Metal Binding Domain (D1)
4. Materials and Methods
4.1. NMR Sample Preparation
4.2. NMR Spectra Collection
5. Conclusions
Supplementary Materials
Acknowledgments
Author Contributions
Conflicts of Interest
References
- Blum, R.H.; Carter, S.K.; Agre, K. A clinical review of bleomycin—A new antineoplastic agent. Cancer 1973, 31, 903–914. [Google Scholar] [CrossRef]
- Akiyama, Y.; Ma, Q.; Edgar, E.; Laikhter, A.; Hecht, S.M. Identification of Strong DNA Binding Motifs for Bleomycin. J. Am. Chem. Soc. 2008, 130, 9650–9651. [Google Scholar] [CrossRef] [PubMed]
- Giroux, R.A.; Hecht, S.M. Characterization of Bleomycin Cleavage Sites in Strongly Bound Hairpin DNAs. J. Am. Chem. Soc. 2010, 132, 16987–16996. [Google Scholar] [CrossRef] [PubMed]
- Yu, Z.; Schmaltz, R.M.; Bozeman, T.C.; Paul, R.; Rishel, M.J.; Tsosie, K.S.; Hecht, S.M. Selective Tumor Cell Targeting by the Disaccharide Moiety of Bleomycin. J. Am. Chem. Soc. 2013, 135, 2883–2886. [Google Scholar] [CrossRef] [PubMed]
- Boger, D.L.; Cai, H. Bleomycin: Synthetic and Mechanistic Studies. Angew. Chem. Int. Ed. 1999, 38, 448–476. [Google Scholar] [CrossRef]
- Carter, B.J.; Murty, V.S.; Reddy, K.S.; Wang, S.N. A Role for the Metal-Binding Domain in Determining the DNA-Sequence Selectivity of Fe-Bleomycin. J. Biol. Chem. 1990, 265, 4193–4196. [Google Scholar] [PubMed]
- Kane, S.A.; Hecht, S.M. Progress in Nucleic Acid Research and Molecular Biology; Waldo, E.C., Kivie, M., Eds.; Academic Press: Walttham, MA, USA, 1994; pp. 313–352. [Google Scholar]
- Hecht, S.M. The Chemistry of Activated Bleomycin. Acc. Chem. Res. 1986, 19, 383–391. [Google Scholar] [CrossRef]
- Stubbe, J.; Kozarich, J.W. Mechanisms of Bleomycin-Induced DNA-Degradation. Chem. Rev. 1987, 87, 1107–1136. [Google Scholar] [CrossRef]
- Povirk, L.F.; Hogan, M.; Dattagupta, N. Binding of Bleomycin to DNA—Intercalation of the Bithiazole Rings. Biochemistry 1979, 18, 96–101. [Google Scholar] [CrossRef] [PubMed]
- Hecht, S.M. RNA degradation by bleomycin, a naturally-occurring bioconjugate. Bioconjug. Chem. 1994, 5, 513–526. [Google Scholar] [CrossRef] [PubMed]
- Zuber, G.; Quada, J.C.; Hecht, S.M. Sequence Selective Cleavage of A DNA Octanucleotide by Chlorinated Bithiazoles and Bleomycins. J. Am. Chem. Soc. 1998, 120, 9368–9369. [Google Scholar] [CrossRef]
- Loeb, K.E.; Zaleski, J.M.; Hess, C.D.; Hecht, S.M.; Solomon, E.I. Spectroscopic Investigation of the Metal Ligation and Reactivity of the Ferrous Active Sites of Bleomycin and Bleomycin Derivatives. J. Am. Chem. Soc. 1998, 120, 1249–1259. [Google Scholar] [CrossRef]
- Lehmann, T.E. Molecular Modeling of the Three-Dimensional Structure of Fe(II)-Bleomycin: Are the Co(II) and Fe(II) Adducts Isostructural? J. Biol. Inorg. Chem. 2002, 7, 305–312. [Google Scholar] [CrossRef] [PubMed]
- Lehmann, T.E.; Serrano, M.L.; Que, L., Jr. Coordination Chemistry of Co(II)-Bleomycin: Its Investigation Through NMR and Molecular Dynamics. Biochemistry 2000, 39, 3886–3898. [Google Scholar] [CrossRef] [PubMed]
- Akkerman, M.A.J.; Neijman, E.W.J.F.; Wijmenga, S.S.; Hilbers, C.W.; Bermel, W. Studies of the Solution Structure of the Bleomycin-A2 Iron(II) Carbon-Monoxide Complex by Means of 2-Dimensional NMR-Spectroscopy and Distance Geometry Calculations. J. Am. Chem. Soc. 1990, 112, 7462–7474. [Google Scholar] [CrossRef]
- Akkerman, M.A.J.; Haasnoot, C.A.G.; Pandit, U.K.; Hilbers, C.W. Complete Assignment of the 13C-NMR Spectra of Bleomycin-A2 and its Zinc Complex by Means of Two-Dimensional NMR-Spectroscopy. Magn. Reson. Chem. 1988, 26, 793–802. [Google Scholar] [CrossRef]
- Akkerman, M.A.J.; Haasnoot, C.A.G.; Hilbers, C.W. Studies of the Solution Structure of the Bleomycin-A2 Zinc Complex by Means of Two-Dimensional NMR-Spectroscopy and Distance Geometry Calculations. Eur. J. Biochem. 1988, 173, 211–225. [Google Scholar] [CrossRef] [PubMed]
- Oppenheimer, N.J.; Rodriguez, L.O.; Hecht, S.M. Structural Studies of Active Complex of Bleomycin—Assignment of Ligands to the Ferrous Ion in a Ferrous-Bleomycin Carbon Monoxide Complex. Proc. Natl. Acad. Sci. USA 1979, 76, 5616–5620. [Google Scholar] [CrossRef] [PubMed]
- Lehmann, T.E.; Ming, L.J.; Rosen, M.E.; Que, L., Jr. NMR Studies of the Paramagnetic Complex Fe(II)-Bleomycin. Biochemistry 1997, 36, 2807–2816. [Google Scholar] [CrossRef] [PubMed]
- Lehmann, T.E.; Li, Y. Possible Structural Role of the Disaccharide Unit in Fe-Bleomycin before and after Oxygen Activation. J. Antibiot. 2012, 65, 25–33. [Google Scholar] [CrossRef] [PubMed]
- Lehmann, T.E.; Li, Y. Solution Structure of Fe(II)-Azide-Bleomycin Derived from NMR Data: Transition from Fe(II)-Bleomycin to Fe(II)-Azide-Bleomycin as Derived from NMR Data and Structural Calculations. J. Biol. Inorg. Chem. 2012, 17, 761–771. [Google Scholar] [CrossRef] [PubMed]
- Li, Y.; Lehmann, T.E. Coordination Chemistry and Solution Structure of Fe(II)-Peplomycin. Two Possible Coordination Geometries. J. Inorg. Biochem. 2012, 111, 50–58. [Google Scholar] [CrossRef] [PubMed]
- Lehmann, T.E.; Topchiy, E. Contributions of NMR to the Understanding of the Coordination Chemistry and DNA Interactions of Metallo-Bleomycins. Molecules 2013, 18, 9253–9277. [Google Scholar] [CrossRef] [PubMed]
- Schroeder, B.R.; Ghare, M.I.; Bhattacharya, C.; Paul, R.; Yu, Z.Q.; Zaleski, P.A.; Bozeman, T.C.; Rishel, M.J.; Hecht, S.M. The Disaccharide Moiety of Bleomycin Facilitates Uptake by Cancer Cells. J. Am. Chem. Soc. 2014, 136, 13641–13656. [Google Scholar] [CrossRef] [PubMed]
- Raisfeld, I.H. Pulmonary Toxicity of Bleomycin Analogs. Toxicol. Appl. Pharmacol. 1980, 56, 326–336. [Google Scholar] [CrossRef]
- Raisfeld, I.H.; Chovan, J.P.; Frost, S. Bleomycin Pulmonary Toxicity—Production of Fibrosis by Bithiazole-Terminal Amine and Terminal Amine Moieties of Bleomycin-A2. Life Sci. 1982, 30, 1391–1398. [Google Scholar] [CrossRef]
- Raisfeld, I.H.; Chu, P.; Hart, N.K.; Lane, A. A Comparison of the Pulmonary Toxicity Produced by Metal-Free and Copper-Complexed Analogs of Bleomycin and Phleomycin. Toxicol. Appl. Pharmacol. 1982, 63, 351–362. [Google Scholar] [CrossRef]
- Raisfeld, I.H. Relation between Bleomycin Structure and Pulmonary Fibrosis. Clin. Pharmacol. Ther. 1981, 29, 274. [Google Scholar]
- Raisfeld, I.H. Relation of Bleomycin Structure to Pulmonary Toxicity. Clin. Res. 1980, 28, A530. [Google Scholar]
- Raisfeld, I.H. Bleomycin Terminal Groups Produce Pulmonary Fibrosis. Clin. Res. 1979, 27, A445. [Google Scholar]
- Oka, S. A Review of Clinical-Studies of Pepleomycin. Recent Results Cancer Res. 1980, 74, 163–171. [Google Scholar] [PubMed]
- Umezawa, H. Recent Studies on Bleomycin. Lloydia 1977, 40, 67–81. [Google Scholar]
- Tanaka, W.; Takita, T. Pepleomycin—2nd Generation Bleomycin Chemically Derived From Bleomycin A2. Heterocycles 1979, 13, 469–476. [Google Scholar] [CrossRef]
- Sucheck, S.J.; Ellena, J.F.; Hecht, S.M. Characterization of Zn(II) Deglycobleomycin A2 and Interaction with d(CGCTAGCG)2: Direct Evidence for Minor Groove Binding of the Bithiazole Moiety. J. Am. Chem. Soc. 1998, 120, 7450–7460. [Google Scholar] [CrossRef]
- Keck, M.V.; Manderville, R.A.; Hecht, S.M. Chemical and Structural Characterization of the Interaction of Bleomycin A2 with d(CGCGAATTCGCG)(2). Efficient, Double-Strand DNA Cleavage Accessible without Structural Reorganization. J. Am. Chem. Soc. 2001, 123, 8690–8700. [Google Scholar] [CrossRef] [PubMed]
- Manderville, R.A.; Ellena, J.F.; Hecht, S.M. Interaction of Zn(II)-Bleomycin With d(CGCTAGCG)2—A Binding Model-Based on NMR Experiments and Restrained Molecular-Dynamics Calculations. J. Am. Chem. Soc. 1995, 117, 7891–7903. [Google Scholar] [CrossRef]
- Vanderwall, D.E.; Lui, S.M.; Wu, W.; Turner, C.J.; Kozarich, J.W.; Stubbe, J. A Model of the Structure of HOO-CoBleomycin Bound to d(CCAGTACTGG): Recognition at the d(GpT) Site and Implications for Double-Stranded DNA Cleavage. Chem. Biol. 1997, 4, 373–387. [Google Scholar] [CrossRef]
- Wu, W.; Vanderwall, D.E.; Lui, S.M.; Tang, X.J.; Turner, C.J.; Kozarich, J.W.; Stubbe, J. Studies of CoBleomycin A2 Green: Its Detailed Structural Characterization by NMR and Molecular Modeling and its Sequence-Specific Interaction with DNA Oligonucleotides. J. Am. Chem. Soc. 1996, 118, 1268–1280. [Google Scholar] [CrossRef]
- Wu, W.; Vanderwall, D.E.; Stubbe, J.; Kozarich, J.W.; Turner, C.J. Interaction of CoBleomycin A2 (Green) with d(CCAGGCCTGG)2—Evidence for Intercalation Using 2D NMR. J. Am. Chem. Soc. 1994, 116, 10843–10844. [Google Scholar] [CrossRef]
- Wu, W.; Vanderwall, D.E.; Teramoto, S.; Lui, S.M.; Hoehn, S.T.; Tang, X.J.; Turner, C.J.; Boger, D.L.; Kozarich, J.W.; Stubbe, J. NMR Studies of Codeglycobleomycin A2 Green and its Complex with d(CCAGGCCTGG). J. Am. Chem. Soc. 1998, 120, 2239–2250. [Google Scholar] [CrossRef]
- Wu, W.; Vanderwall, D.E.; Turner, C.J.; Hoehn, S.; Chen, J.Y.; Kozarich, J.W.; Stubbe, J. Solution Structure of the Hydroperoxide of Co(III) Phleomycin Complexed With d(CCAGGCCTGG)2: Evidence for Binding by Partial Intercalation. Nucleic Acids Res. 2002, 30, 4881–4891. [Google Scholar] [CrossRef] [PubMed]
- Wu, W.; Vanderwall, D.E.; Turner, C.J.; Kozarich, J.W.; Stubbe, J. Solution Structure of CoBleomycin A2 Green Complexed With d(CCAGGCCTGG). J. Am. Chem. Soc. 1996, 118, 1281–1294. [Google Scholar] [CrossRef]
- Zhao, C.Q.; Xia, C.W.; Mao, Q.K.; Forsterling, H.; DeRose, E.; Antholine, W.E.; Subczynski, W.K.; Petering, D.H. Structures of HO2-Co(III)Bleomycin A2 Bound to d(GAGCTC)2 and d(GGAAGCTTCC)2): Structure-Reactivity Relationships of Co and Fe Bleomycins. J. Inorg. Biochem. 2002, 91, 259–268. [Google Scholar] [CrossRef]
- Kuwahara, J.; Sugiura, Y. Sequence-Specific Recognition and Cleavage of DNA by Metallobleomycin—Minor Groove Binding and Possible Interaction Mode. Proc. Natl. Acad. Sci. USA 1988, 85, 2459–2463. [Google Scholar] [CrossRef] [PubMed]
- Goodwin, K.D.; Lewis, M.A.; Long, E.C.; Georgiadis, M.M. Crystal Structure of DNA-Bound Co(III)-Bleomycin B-2: Insights on Intercalation and Minor Groove Binding. Proc. Natl. Acad. Sci. USA 2008, 105, 5052–5056. [Google Scholar] [CrossRef] [PubMed]
- Lui, S.M.; Vanderwall, D.E.; Wu, W.; Tang, X.J.; Turner, C.J.; Kozarich, J.W.; Stubbe, J. Structural Characterization of CoBleomycin A2 Brown: Free and Bound to d(CCAGGCCTGG). J. Am. Chem. Soc. 1997, 119, 9603–9613. [Google Scholar] [CrossRef]
- Caceres-Cortes, J.; Sugiyama, H.; Ikudome, K.; Saito, I.; Wang, A.H.J. Interactions of Deglycosylated Cobalt(III)—Pepleomycin (Green Form) with DNA Based on NMR Structural Studies. Biochemistry 1997, 36, 9995–10005. [Google Scholar] [CrossRef] [PubMed]
- Caceres-Cortes, J.; Sugiyama, H.; Ikudome, K.; Saito, I.; Wang, A.H.J. Structure, Motion, Interaction and Expression of Biological Macromolecules; Sarma, R.H., Sarma, M.H., Eds.; Adenine Press: New York, NY, USA, 1998; pp. 207–225. [Google Scholar]
- Lehmann, T.E.; Murray, S.A.; Ingersoll, A.D.; Reilly, T.M.; Follett, S.E.; Macartney, K.E.; Harpster, M.H. NMR Study of the Effects of Some Bleomycin C-Termini on the Structure af a DNA Hairpin With the 5′-GC-3′ Binding Site. J. Biol. Inorg. Chem. 2017, 22, 121–136. [Google Scholar] [CrossRef] [PubMed]
- Follett, S.E.; Ingersoll, A.D.; Murray, S.A.; Reilly, T.M.; Lehmann, T.E. Interaction of Zn(II)Bleomycin-A2 and Zn(II)Peplomycin With a DNA Hairpin Containing the 5′-GT-3′ Binding Site in Comparison with the 5′-GC-3′ Binding Site Studied by NMR Spectroscopy. J. Biol. Inorg. Chem. 2017, 22, 1039–1054. [Google Scholar] [CrossRef] [PubMed]
- Ohno, M.; Otsuka, M. Recent Progress in the Chemical Synthesis of Antibiotics; Lukacs, G., Ohno, M., Eds.; Springer: Berlin, Germany, 1990; pp. 387–414. [Google Scholar]
- Glickson, J.D.; Pillai, R.P.; Sakai, T.T. Proton NMR-Studies of the Zn(II)-Bleomycin-A2-Poly(dA-dT) Ternary Complex. Proc. Natl. Acad. Sci. USA 1981, 78, 2967–2971. [Google Scholar] [CrossRef] [PubMed]
- Xu, R.X.; Nettesheim, D.; Otvos, J.D.; Petering, D.H. NMR Determination of the Structures of Peroxycobalt(III) Bleomycin and Cobalt(III) Bleomycin, Products of the Aerobic Oxidation of Cobalt(II) Bleomycin by Dioxygen. Biochemistry 1994, 33, 907–916. [Google Scholar] [CrossRef] [PubMed]
- Raisfeld, I.H.; Kundahl, E.R.; Sawey, M.J.; Chovan, J.P.; Depasquale, J. Selective Toxicity of Specific Lung-Cells to Bleomycin. Clin. Res. 1982, 30, A437. [Google Scholar]
- Takahashi, K.; Aoyagi, H.S.; Koyu, A.; Kuramochi, H.; Yoshioka, O.; Matsuda, A.; Fujii, A.; Umezawa, H. Biological Studies on the Degradation Products of 3-[(S)-1′-Phenylethylamino]Propylaminobleomycin—Novel Analog (Pepleomycin). J. Antibiot. 1979, 32, 36–42. [Google Scholar] [CrossRef] [PubMed]


| Residue | OL1 Zn(II)BLM-A2 | OL2 Zn(II)BLM-A2 | OL1 Zn(II)PEP | OL2 Zn(II)PEP | OL1 Zn(II)BLM-B2 | OL1 Zn(II)BLM-A5 |
|---|---|---|---|---|---|---|
| Val CαH | 0.17 a | −0.07 | 0.21 | −0.06 | 0.21 | 0.33 |
| Val CβH | −0.03 | −0.06 | −0.03 | −0.29 | −0.03 | −0.07 |
| Val CγH | −0.02 | −0.06 | −0.02 | −0.08 | −0.02 | −0.03 |
| Val CαCH3 | 0.03 | 0.00 | 0.04 | −0.04 | 0.03 | 0.02 |
| Val CγCH3 | −0.01 | −0.02 | −0.01 | 0.19 | −0.01 | −0.01 |
| Val NH | 0.05 | −0.10 | 0.05 | b - | 0.08 | 0.09 |
| Thr CαH | −0.02 | −0.05 | −0.03 | −0.04 | −0.04 | −0.05 |
| Thr CβH | −0.03 | −0.05 | −0.04 | −0.05 | −0.04 | −0.09 |
| Thr CH3 | −0.01 | −0.02 | −0.02 | −0.01 | −0.02 | −0.04 |
| Thr NH | 0.15 | −0.02 | 0.19 | - | 0.18 | 0.28 |
| Bit CαH2 | 0.05 | 0.08 | 0.06 | 0.12 | 0.07 | 0.10 |
| Bit CβH2 | 0.02 | 0.05 | 0.03 | 0.09 | 0.02 | 0.05 |
| c Bit C5′H | 0.19 | 0.19 | 0.37 | 0.07 | 0.09 | −0.19 |
| c Bit C5H | - | - | 0.36 | - | −0.37 | |
| Bit NH | −0.02 | −0.03 | −0.03 | 0.01 | −0.04 | −0.05 |
| Ala CαH | −0.01 | 0.00 | −0.01 | 0.04 | −0.01 | 0.00 |
| Ala CβH2b | 0.00 | −0.01 | −0.01 | −0.05 | −0.01 | 0.00 |
| Ala NH | - | - | 0.05 | - | - | - |
| Ala NH2a | 0.00 | 0.01 | −0.01 | −0.04 | −0.01 | −0.01 |
| Ala CONH2a | −0.01 | −0.01 | −0.02 | −0.14 | −0.01 | 0.00 |
| Ala CONH2b | 0.00 | 0.02 | 0.00 | 0.04 | 0.00 | 0.02 |
| Pyr NH2 | −0.03 | −0.04 | −0.04 | −0.05 | −0.03 | −0.02 |
| Hist C2H | −0.05 | −0.23 | −0.01 | −0.11 | −0.03 | −0.03 |
| Hist C4H | −0.02 | −0.04 | −0.01 | −0.03 | −0.03 | −0.04 |
| Hist CαH | 0.00 | 0.06 | −0.03 | 0.01 | 0.00 | −0.01 |
| Hist CβH | 0.00 | 0.05 | −0.01 | −0.01 | −0.01 | 0.00 |
| Mann C1H | 0.03 | 0.07 | 0.01 | - | 0.01 | - |
| Mann C6H | - | - | - | −0.06 | - | - |
| Mann C6H′ | - | - | - | −0.04 | - | - |
| Mann NH2a | −0.01 | −0.07 | −0.01 | −0.07 | −0.01 | −0.01 |
| Gul C2H | 0.00 | −0.01 | 0.01 | −0.04 | 0.01 | 0.00 |
| d A2 CβH2 | 0.01 | 0.06 | ||||
| A2 CγH2 | 0.05 | 0.16 | ||||
| A2 NH | 0.09 | 0.23 | ||||
| PEP CαH2 | 0.03 | 0.13 | ||||
| PEP CγH2a | −0.01 | 0.04 | ||||
| PEP CδH | 0.01 | 0.04 | ||||
| PEP NH (2) | 0.10 | - | ||||
| B2 CαH2a | 0.05 | |||||
| B2 CγH2a | −0.04 | |||||
| B2 NH (1) | 0.13 | |||||
| A5 CαH2 | 0.08 | |||||
| A5 NH2a | 0.24 |
| OL1 Triads | OL2 Triads | |||||
|---|---|---|---|---|---|---|
| A2 | PEP | B2 | A5 | A2 | PEP | |
| % Overall native NOEs detected | 51 | 48 | 56 | 50 | 43 | 26 |
| Number of new intra-residue NOEs | 3 | 2 | 2 | 1 | 0 | 0 |
| % Native inter-residue NOEs | 43 | 44 | 42 | 38 | 38 | 13 |
| Number of new inter-residue NOES | 6 | 3 | 2 | 6 | 10 | 2 |
| Number of intermolecular NOEs | 1 | 3 | 0 | 0 | 4 | 8 |
| Number of significantly shifted BLM residues | 8 | 8 | 11 | 14 | 19 | 25 |
© 2017 by the authors. Licensee MDPI, Basel, Switzerland. This article is an open access article distributed under the terms and conditions of the Creative Commons Attribution (CC BY) license (http://creativecommons.org/licenses/by/4.0/).
Share and Cite
Follett, S.E.; Murray, S.A.; Ingersoll, A.D.; Reilly, T.M.; Lehmann, T.E. Structural Changes of Zn(II)bleomycin Complexes When Bound to DNA Hairpins Containing the 5′-GT-3′ and 5′-GC-3′ Binding Sites, Studied through NMR Spectroscopy. Magnetochemistry 2018, 4, 4. https://doi.org/10.3390/magnetochemistry4010004
Follett SE, Murray SA, Ingersoll AD, Reilly TM, Lehmann TE. Structural Changes of Zn(II)bleomycin Complexes When Bound to DNA Hairpins Containing the 5′-GT-3′ and 5′-GC-3′ Binding Sites, Studied through NMR Spectroscopy. Magnetochemistry. 2018; 4(1):4. https://doi.org/10.3390/magnetochemistry4010004
Chicago/Turabian StyleFollett, Shelby E., Sally A. Murray, Azure D. Ingersoll, Teresa M. Reilly, and Teresa E. Lehmann. 2018. "Structural Changes of Zn(II)bleomycin Complexes When Bound to DNA Hairpins Containing the 5′-GT-3′ and 5′-GC-3′ Binding Sites, Studied through NMR Spectroscopy" Magnetochemistry 4, no. 1: 4. https://doi.org/10.3390/magnetochemistry4010004
APA StyleFollett, S. E., Murray, S. A., Ingersoll, A. D., Reilly, T. M., & Lehmann, T. E. (2018). Structural Changes of Zn(II)bleomycin Complexes When Bound to DNA Hairpins Containing the 5′-GT-3′ and 5′-GC-3′ Binding Sites, Studied through NMR Spectroscopy. Magnetochemistry, 4(1), 4. https://doi.org/10.3390/magnetochemistry4010004