Communication

Nuclear Magnetic Resonance Spectroscopy Investigations of Naphthalene-Based 1,2,3-Triazole Systems for Anion Sensing

1
Department of Chemistry and Biochemistry, Georgia Southern University, 521 College of Education Drive, Statesboro, GA 30460-8064, USA
2
Department of Chemistry and Physics, Armstrong State University, 11935 Abercorn Street, Savannah, GA 31419, USA
3
Department of Chemistry, Clemson University, Clemson, SC 29634-1905, USA
*
Authors to whom correspondence should be addressed.
Magnetochemistry 2018, 4(1), 15; https://doi.org/10.3390/magnetochemistry4010015
Submission received: 3 November 2017 / Revised: 11 December 2017 / Accepted: 13 December 2017 / Published: 6 February 2018
(This article belongs to the Special Issue Nuclear Magnetic Resonance Spectroscopy)

Abstract

:
Detailed Nuclear Magnetic Resonance (NMR) spectroscopy investigations on a novel naphthalene-substituted 1,2,3-triazole-based fluorescence sensor provided evidence for the “turn-on” detection of anions. The one-step, facile synthesis of the sensors was implemented using the “Click chemistry” approach in good yield. When investigated for selectivity and sensitivity against a series of anions (F, Cl, Br, I, H2PO4, ClO4, OAc, and BF4), the sensor displayed the strongest fluorometric response for the fluoride anion. NMR and fluorescence spectroscopic studies validate a 1:1 binding stoichiometry between the sensor and the fluoride anion. Single crystal X-ray diffraction evidence revealed the structure of the sensor in the solid state.

1. Introduction

Small, inexpensive organic molecular sensors are making an impact in the field of molecular recognition and as a result, have captured the attention of chemists [1,2,3]. When chemosensors respond to external stimuli, distinct and significant changes can be observed—for example, in color or fluorescence [4,5,6]. Anions are crucial in biological and environmental systems; optimum concentrations are critical to proper functioning, as an excess or diminished amount of anions can prove fatal in both systems [7].
The ability to detect fluoride is important for the environment, industry, biological systems, and the military [6,8]. Developing cost-effective, high-performance, easily portable methods for the detection of this anion is highly beneficial to society [8]. The fluoride (F) anion, in particular, has a significant impact on health. With groundwater concentrations of 0.5 to 48 ppm [9], this anion is important for healthy dental and bone development [10,11]. However, overexposure causes fluorosis [12] and high levels in utero can impede children’s cognitive development [13]. In military operations, the detection of fluoride could be quite useful in the uranium enrichment process for nuclear power and weaponry development [14,15]. In chemical warfare, quick measurement of fluoride levels can expedite tracking of harmful phosphorofluoridate nerve agents such as sarin that hydrolyze to release the anion upon contact with the atmosphere [16,17].
A number of colorimetric and fluorometric sensors have been developed to detect anions through a Brønsted acid–base reaction and/or hydrogen bond formation at the N–H and O–H moieties [18]. For ion recognition, complicated molecules with multistep syntheses are used to create highly conjugated systems with common scaffolds such as ureas, amides, and/or phenolic groups [19,20]. Photoinduced electron transfer (PET) [21,22], metal-to-ligand charge transfer (MLCT) [22,23]; excimer/exciplex formation [23], intramolecular charge transfer (ICT) [24]; and excited state intra/intermolecular proton transfer (ESPT) [25,26] are some of the signaling mechanisms by which the anions are detected.
One of the greatest challenges for chemists is to create chemosensors that are stable, fast, sensitive at the parts per million (ppm) level, and efficient [27]. Organosensors, through reversible interactions, present an avenue into various applications such as resettable logic gate systems [28,29,30,31], molecular security devices [32,33], micellar devices [34,35], dual sensors [36,37], corrosion inhibitors [38], fabrication of materials and polymers, etc. [39,40]. The optically and chemically stable naphthalene substituted-1,2,3-triazole molecule, NpTP ((2-(4-(naphthalen-2-yl)-1H-1,2,3-triazol-1-yl)phenol, Scheme 1) described herein is produced with straightforward synthesis, targeted design, and sensitive as well as selective ion-recognition properties.
Bypassing complicated synthetic steps, the 1,2,3-triazole chemosensors is accessed in one step with an azide–alkyne cycloaddition utilizing the most well-known “Click” reaction [41,42,43,44,45,46]. With this approach, the recognition core can be easily retained while the signaling units are readily modified using commercially available precursors. Furthermore, unlike other naphthyl-based fluoride sensors reported in the literature [47,48] that function through the interaction of the anion with N-H groups in cage-like bisurea systems, NpTP utilizes a much simpler phenolic–triazole binding core.
The triazole units serve distinct roles in sensing. They can be a part of the response group, participate in cation and anion chelation, or function as a ligation unit that links one part of a sensor to another [42,44]. These scaffolds are N-donors via one of the sp2-nitrogens during cation binding, and H-donors at the Csp2-H proton in anion binding [41,44]. In the case of NpTP, the triazole serves in three capacities: ligation, signaling, and recognition.
Previous work by our group investigated the sensing properties of PTP (2-(4-phenyl-1-H-1,2,3-triazol-1-yl)phenol) [49]. This molecule exhibited a blue “turn-on” fluorescent response to fluoride (F), acetate (OAc) and dihydrogen phosphate (H2PO4). PTP was equally responsive to OAc and H2PO4, and three times more sensitive to F compared to the other two anions. NpTP presented herein illustrates a red-shift effect on the signal output, a yellow “turn-on” fluorescence upon interacting with fluoride, acetate, and dihydrogen phosphate due to increased conjugation length in the sensor, i.e., replacing the phenyl group in PTP with naphthyl in NpTP. Additionally, our investigations have revealed that the incorporation of the naphthyl unit significantly improved the ion selectivity and fluoride sensitivity of the sensor relative to PTP.
The results presented in this study show a strong fluoride response with NpTP. The sensor “turns-on” in the presence of a fluoride ion upon irradiation at 300 nm. The binding pocket is created by the phenolic –OH and triazole Csp2-H site (Scheme 2). Detailed NMR investigations (1) showed the structural skeleton of NpTP; (2) displayed the binding interaction with F; and (3) revealed the stoichiometry between the sensor and the analyte after titrating with varied concentrations of fluoride anion with NpTP. NMR, Ultra violet-visible (UV-Vis) and fluorescence spectroscopy studies detailed the molecule’s response to host anions as their tetrabutylammonium salts (F, Cl, Br, I, H2PO4, ClO4, OAc, BF4).

2. Results and Discussion

The detailed characterization of NpTP was carried out by NMR (1D and 2D) and single crystal X-ray analysis. NMR studies revealed the structure, the anion-binding site and the stoichiometry between the sensor and the fluoride anion. The photophysical properties of NpTP with and without the anions (F, Cl, Br, I, H2PO4, ClO4, OAc, BF4) were investigated by steady state absorption and fluorescence spectroscopy.

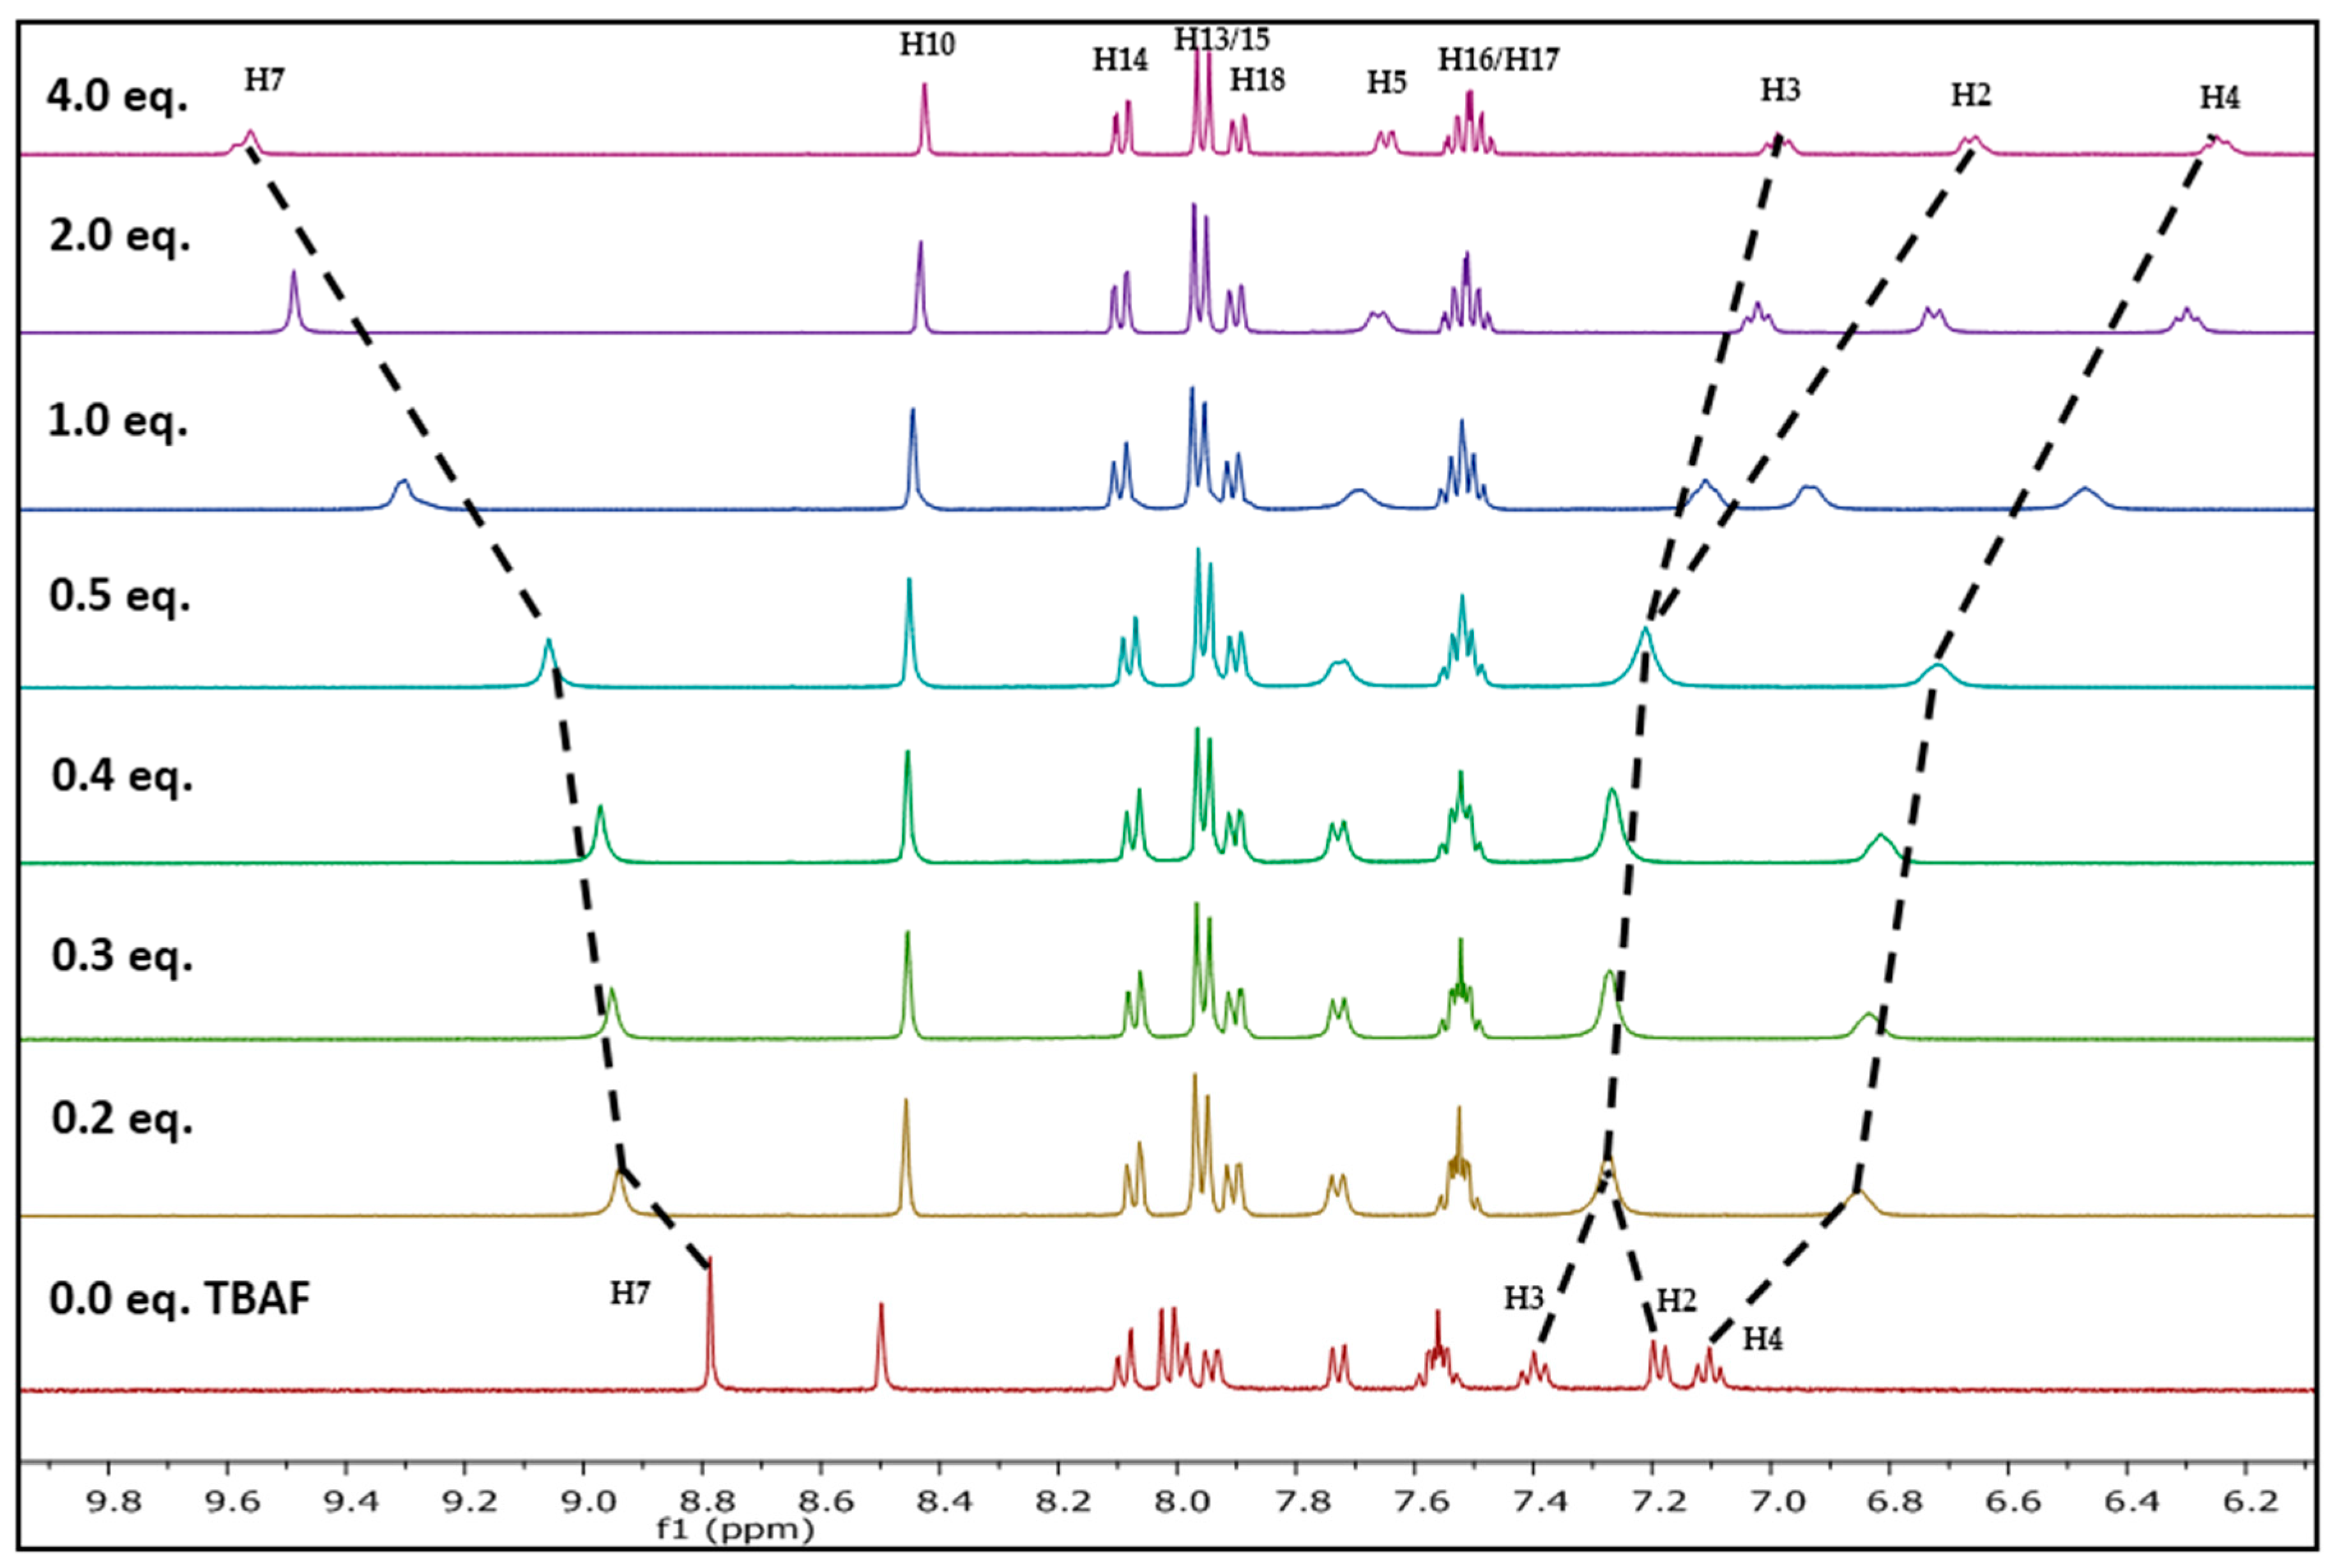
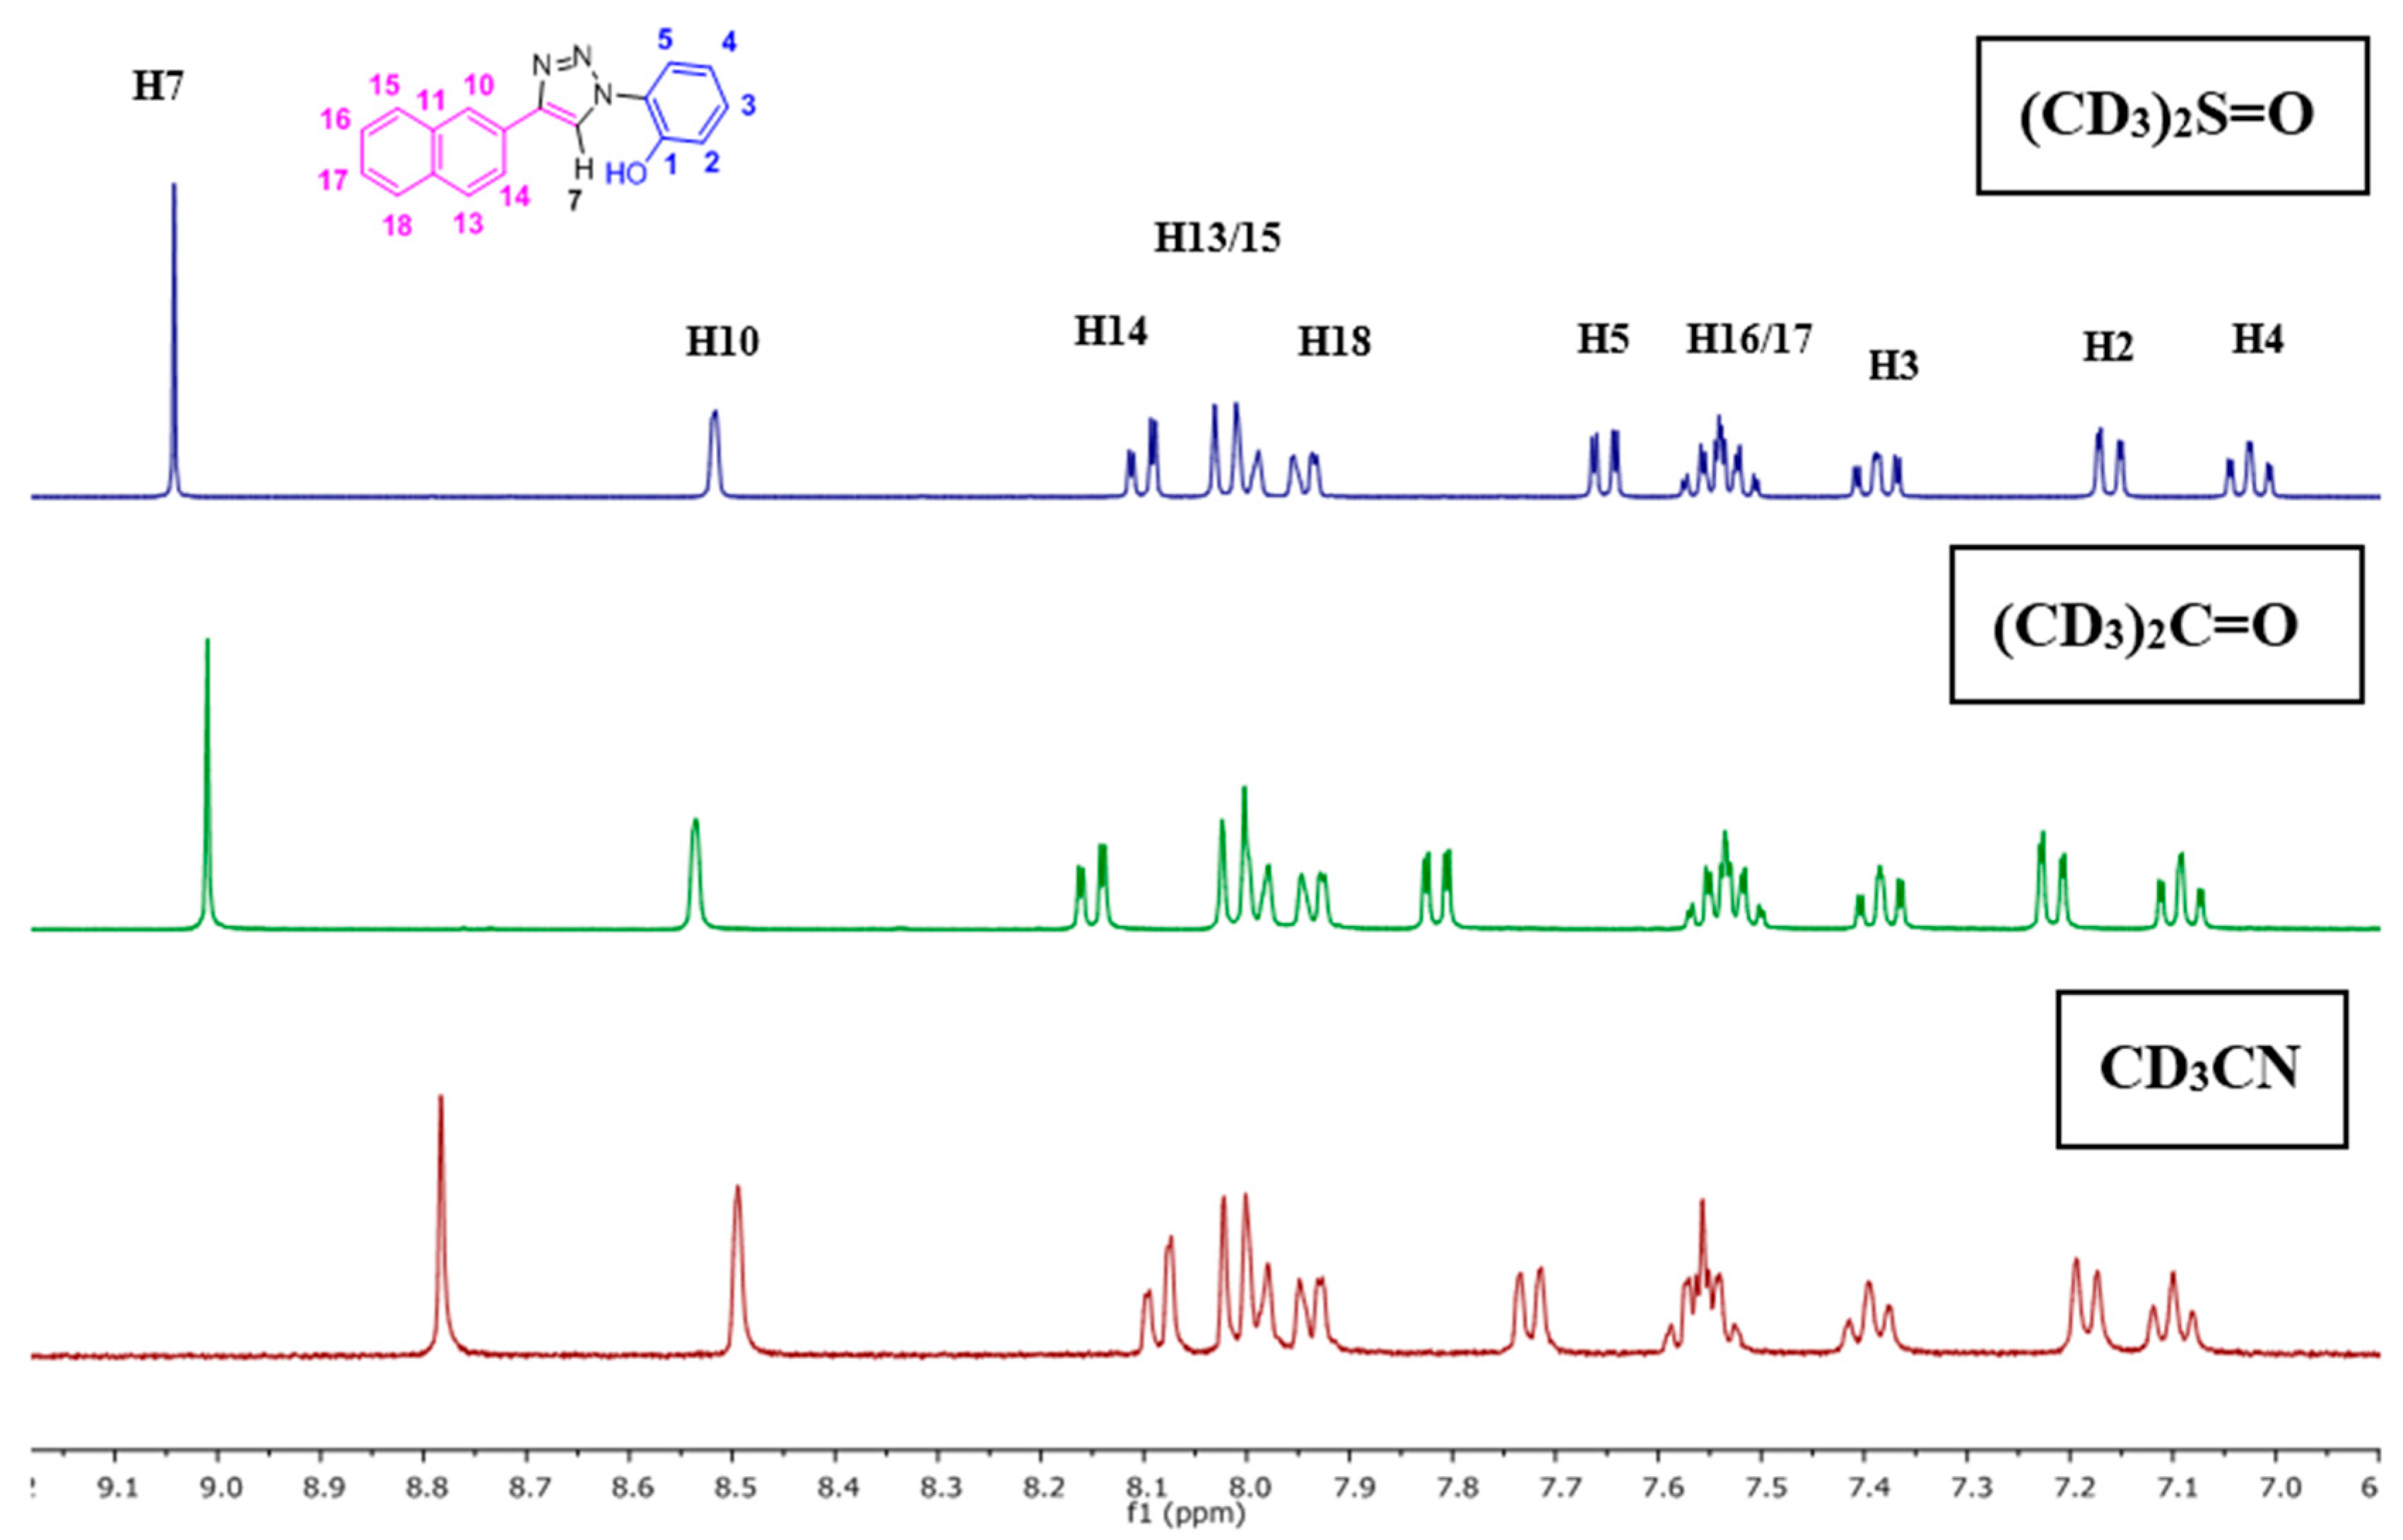
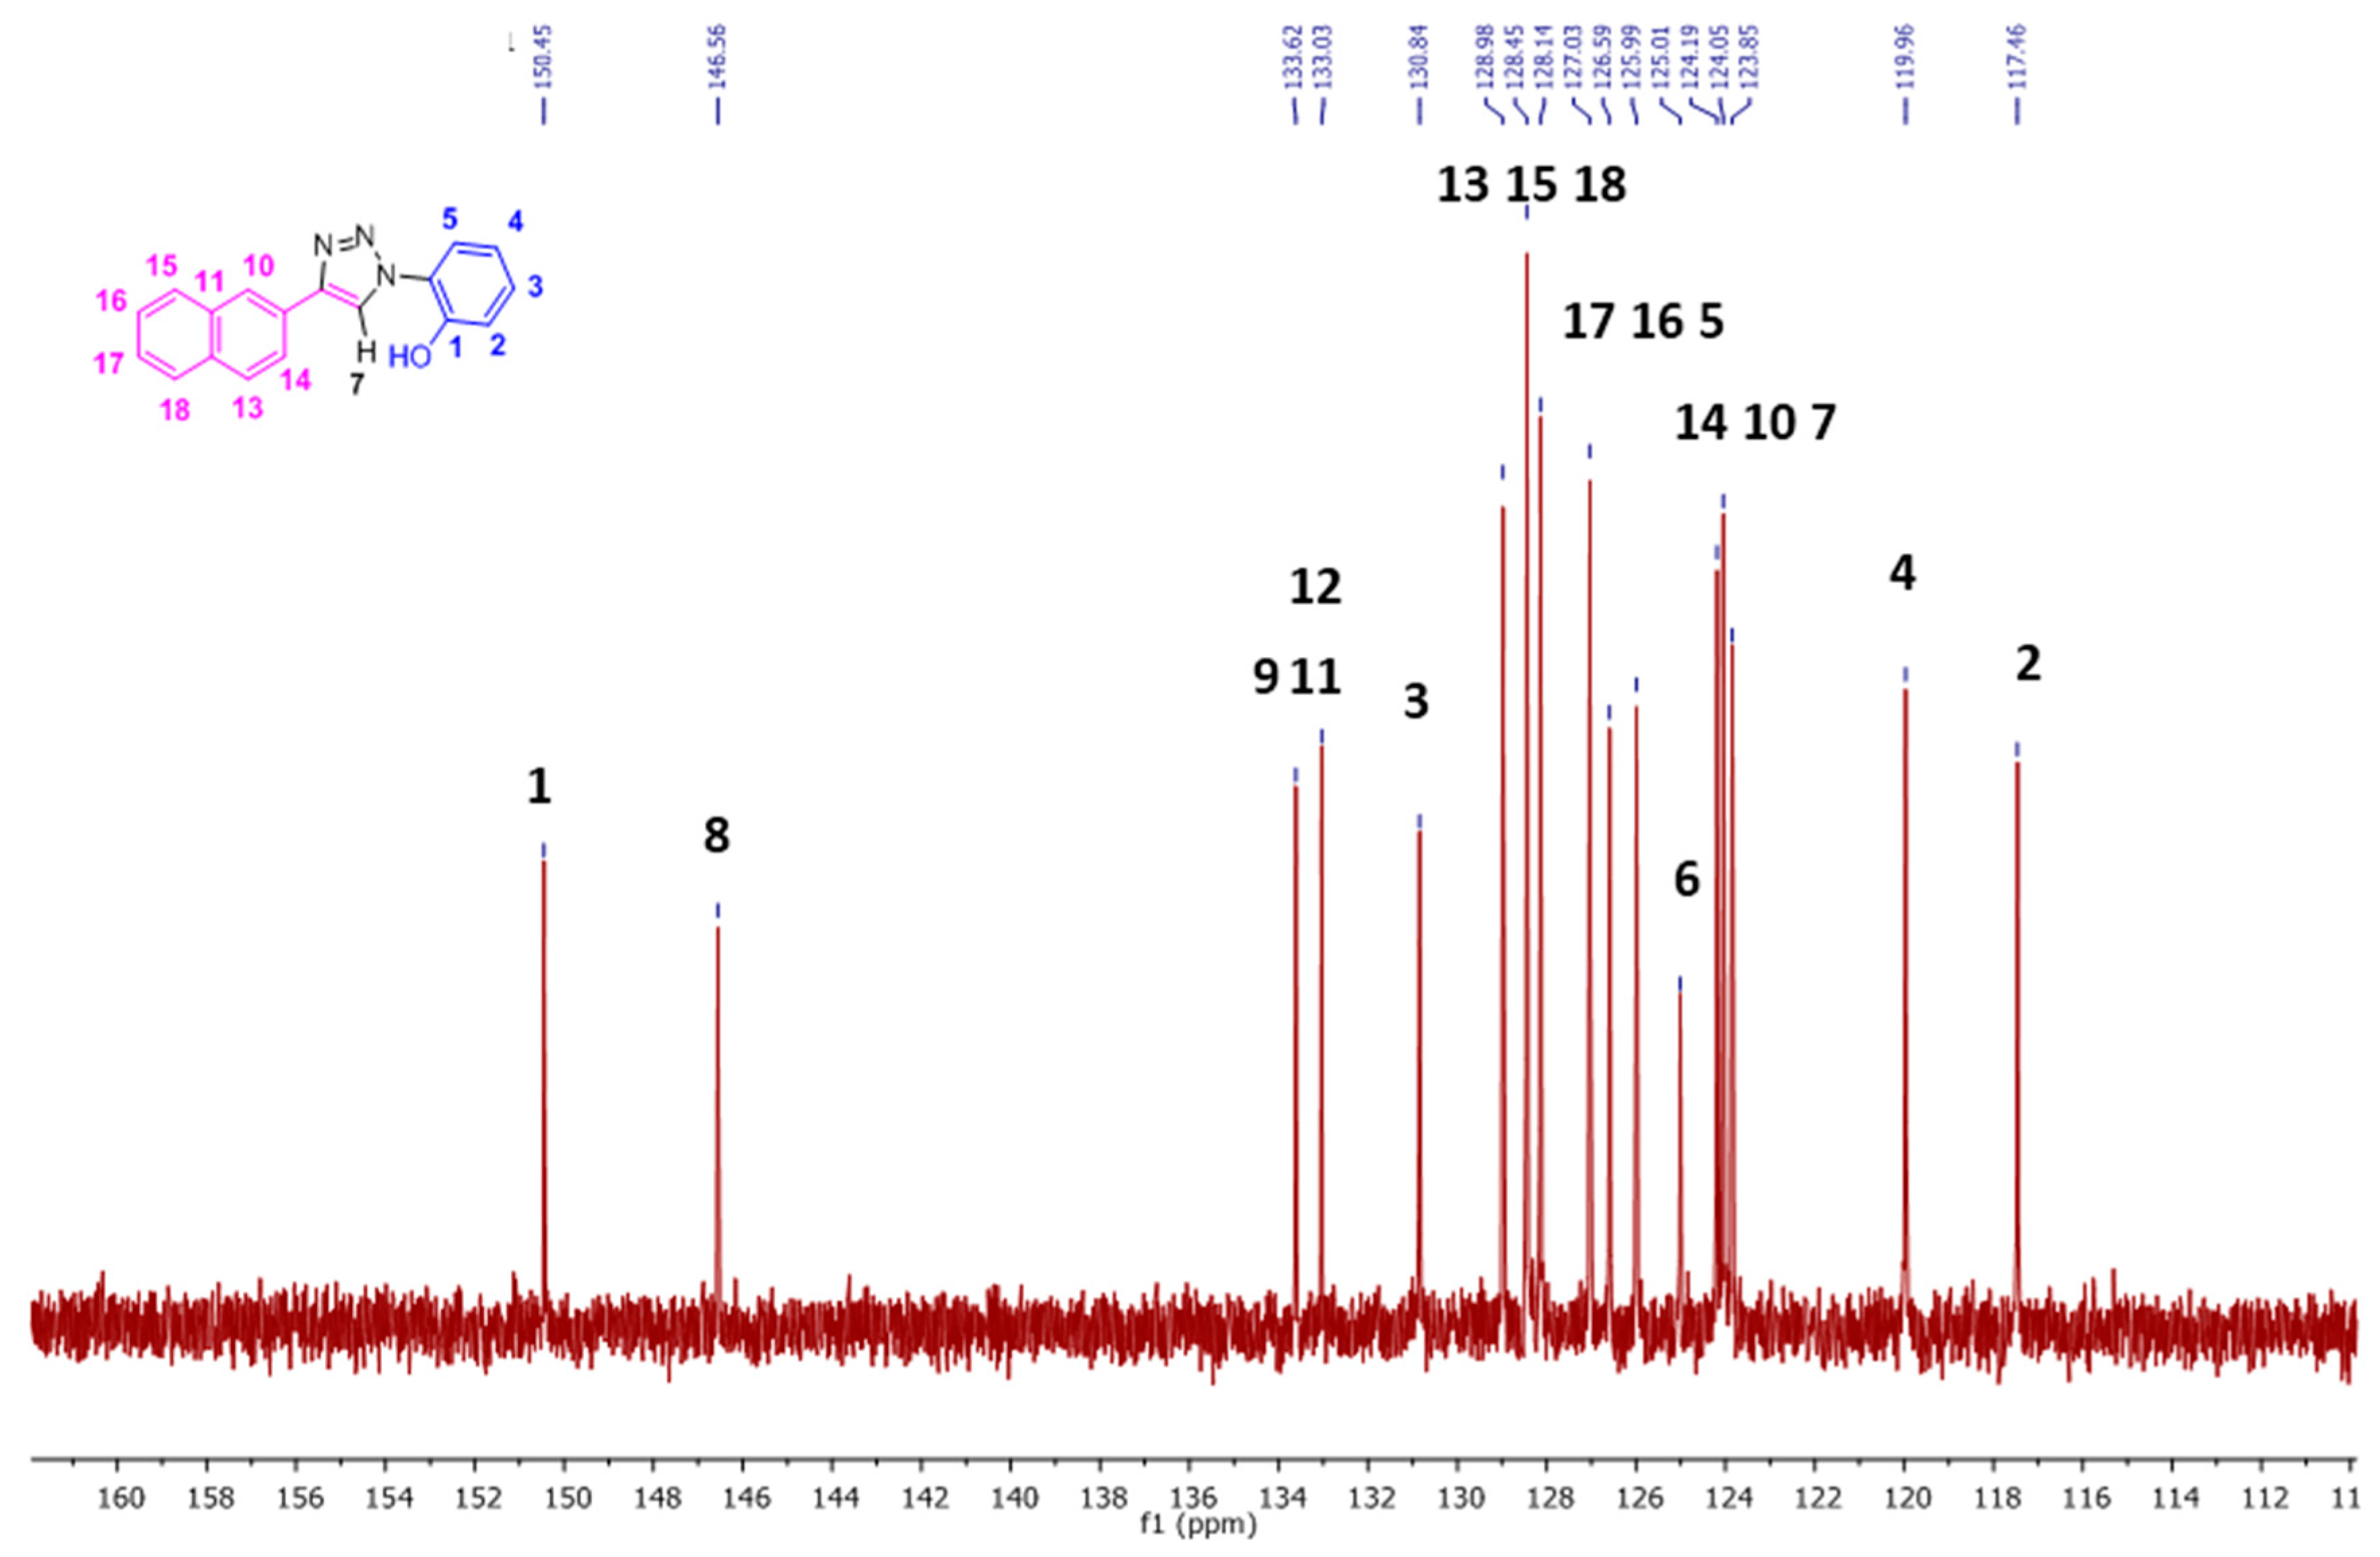
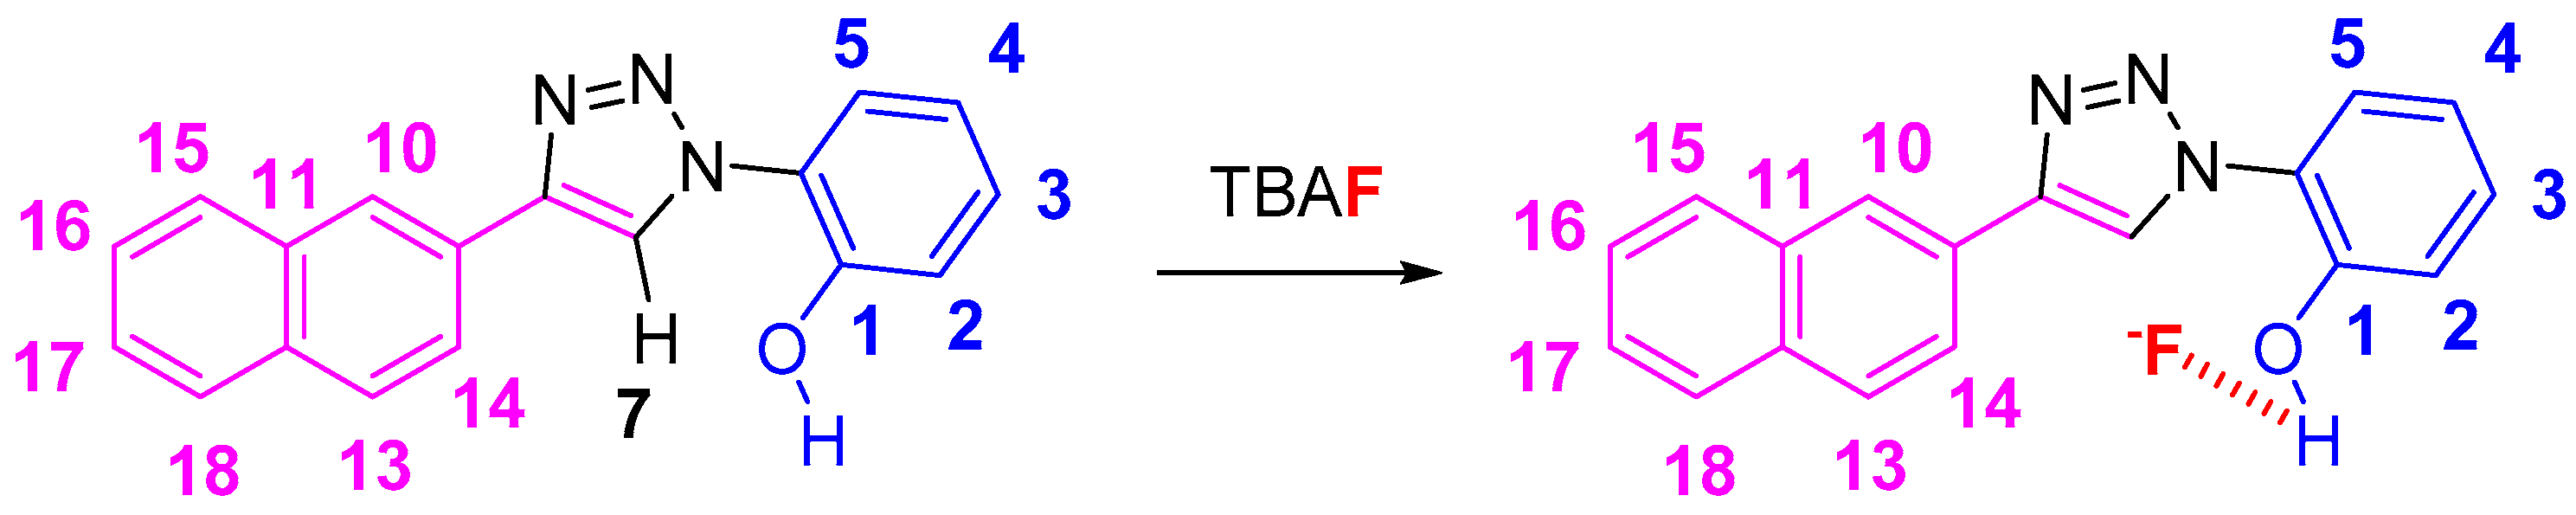
2.1. Nuclear Magnetic Resonance Spectroscopic Studies

The NpTP structure was characterized by 1H-NMR in various deuterated solvents such as acetonitrile-d3 (CD3CN), dimethylsulfoxide-d6 ([(CD3)2SO]), and acetone-d6 [(CD3)2CO]. Figure 1 shows the comparison between the three solvents. The aromatic peaks in these solvents appear in the range of δ 7.00 to 9.05 ppm with anticipated coupling patterns. The triazole Csp2–H (H7) proton singlet, as expected, is highly deshielded and hence is a reference peak in many studies (δ 9.05 ppm in DMSO; δ 9.00 ppm in acetone, and δ 8.78 ppm in acetonitrile) [41,50]. The H5 proton has noticeably shifted its position in all three solvents, with acetone being highly downfield (δ 7.82 ppm as doublet of doublets in acetone-d6). The naphthyl core has seven resonance signals; the singlet at δ 8.52 in DMSO-d6 is easily identified as the H10 proton. The H14 and H13 proton split as a doublet (δ 8.11 ppm and δ 8.00 ppm, respectively). The phenolic –OH proton is visible as a broad singlet in DMSO-d6 at δ 10.60 ppm (Figure 2 and Figure S1). The correlational spectroscopy (g-COSY) studies helped in assigning all the aromatic protons. A strong meta coupling (4J) cross peak of the H10 and H14 proton is visible and is marked below in Figure 3.
The 13C-NMR signals (Figure 4, Figures S2 and S3) for the aromatic region ranged from δ 117.5 to 150.5 ppm in DMSO-d6. With the help of 1D DEPT 90 (Figure S4) and 2D HSQC (Figure 5), all the single bonded carbon hydrogen correlations were marked. The HMBC studies (Figure S5), aided in allocating the quaternary carbons (1, 6, 8, 9, 11, and 12). The strong peaks for example seen for C1 carbon are for H5 and H3 protons through three bond correlations and the weak peak is seen for H2 proton via two bond correlation. Both the 1D and 2D studies guided in assigning the 1H and 13C resonances for the NpTP molecule.
Fluoride ion interaction with NpTP was investigated by evaluating the binding mechanism of the anion with the sensor. For this purpose, the Csp2-H triazole proton signal was used to verify the site of interaction between the NpTP molecule and the fluoride anion. The 1H-NMR titration experiments were carried out with the sensor by gradual addition of 0 to 4.0 equivalents of tetrabutylammonium fluoride (TBAF) in CD3CN (Figure 6). The protons on the phenyl ring (H2–H4) and the triazole proton were greatly affected. The H4 proton, which is in the para position to the –OH group, is shielded from 7.10 to 6.24 (∆δ = 0.84) with increased concentration of TBAF from 0 to 4.0 equivalents. The protons that are ortho and meta to –OH (H2 and H3) initially unite to form the broadened peak at ~δ 7.27 after the addition of 0.2 equivalents of TBAF. At a higher concentration of approximately one equivalent, it splits again into two distinct resonances. These results are in accordance with the previously reported PTP sensor from our group [49]. The initial downfield and later upfield shifts of the H2 phenyl proton showed the impact of fluoride binding on the ring. The proton meta (H3) to the –OH group was moderately affected at higher concentrations of F ion. This confirmed our hypothesis of the increased electron density in the phenyl ring displaying a significant impact on ortho and para position of phenyl protons with a through-bond propagation [51,52].
Substantial change was observed in the chemical shift of the Csp2-H triazole proton (δ 8.78 in CD3CN) before and after its binding with fluoride. The change in delta value is significant from 8.78 to 9.58 (∆δ = 0.80) with increasing equivalents of TBAF. This strong deshielding effect is attributed to the fact that the triazole proton is in the vicinity of the anion through possible hydrogen bonding- like interaction [53]. The H5 proton on the phenyl ring, in comparison to other protons’ chemical shifts, is minimally affected throughout the course of the titration, providing additional evidence for a binding site with fluoride. The above results support the fact that the triazole proton and the phenolic proton (–OH) are part of the binding pocket. The naphthyl protons H10 and H13–H18 are not influenced by fluoride binding [49].
The titration experiments also helped to find the binding stoichiometry of the sensor with the F ions through Job’s plot [54,55]. The change in the delta value of the triazole proton H7 (∆δ = δx − δo) at δ 8.78 [55] was plotted against the mole fraction of the sensor [NpTP]/([NpTP + TBAF]). The plot was fitted using the non-linear curve fit parameters of the ORIGIN 8.0 software. It showed a maximum intensity at 0.45 mole fraction, revealing the binding stoichiometry of F ions to NpTP as 1:1 (Figure 7).
To understand the structural conformations of NpTP in solution, Nuclear Overhauser Effect (NOE) experiments were carried out (Figures S6 and S7). We did not find any correlation between the triazole Csp2-H proton (H7) and the phenyl H5 proton, indicating that the phenolic –OH is in close proximity to the H7 proton. A strong NOE correlation is observed between the a) triazole proton H7 and the H10 and H14 protons and b) H10 and H15 protons on the naphthyl ring (Figure S6). The NOE correlation is also seen for the –OH proton and the H2 proton, suggesting the position of the phenolic group towards phenyl proton rather than the triazole proton (Figure S7). NOE studies of NpTP in presence of four equivalents of TBAF (Figure S8) showed the correlation between the H7, H10, and H14 protons, indicating that the naphthyl core is unaffected. There is no conformational change before and after fluoride binding. It also suggests that the fluoride anion is in close vicinity to the triazole proton and the –OH proton, shown in Scheme 2. The single X-ray crystal structure for NpTP and our previous studies on cation sensor (BPT) [56] also support this hypothesis. The crystal structure substantiated that there is no intramolecular hydrogen bonding between the phenolic oxygen (–OH) and the triazole proton (see Section 2.4).
Since the phenolic (–OH) group was part of the binding pocket, the behavior of the –OH group was studied in DMSO-d6 by a titration study with NpTP and TBAF. In this polar aprotic solvent, the phenolic –OH resonates distinctly at δ 10.60 ppm. Upon addition of 0.5 equivalents of fluoride anion, the –OH proton signal completely disappears indicating a hydrogen bond between F- and the phenolic –OH. Higher equivalents of TBAF (2.0 equivalents) generated a triplet at 16.1 ppm, which intensified with 4.0 equivalents of TBAF. The highly deshielded triplet peak is an indication of the stable hydrogen bonded HF2 ion. This provided evidence to a deprotonation pathway in the ion-recognition process (Figures S9 and S10) [57,58].
In 1H-NMR, the H7 proton in deuterated DMSO (Figure S9) at 1 equivalent of TBAF started splitting. Our understanding is that the fluoride anion is in close proximity to the triazole proton and hence is severely affected. To confirm this hypothesis, we monitored the interaction through 19F-NMR titration in DMSO-d6, where the singlet for pure TBAF appears at δ −106 ppm, and HF2 can be seen at −144 ppm (weak signal). At one equivalent of TBAF, the −106 ppm peak completely disappears indicating the formation of a complex between the NpTP molecule and the F ion. At higher concentrations (2–4 equivalents), the doublet for HF2 ion at −144 ppm was clearly observed (Figure S11) [59,60].
In comparison to the previously reported sensor, PTP [49], from our group, the 1H-NMR studies with NpTP showed similar observations. The phenolic –OH proton was significantly affected but the aryl core (phenyl in PTP and the naphthyl in NpTP) was not. The binding site for fluoride in both sensors consisted of the triazole proton and the phenolic proton. The triazole proton in PTP appeared at δ 8.65 ppm and in NpTP at δ 8.78 ppm in CD3CN. For both sensors, the 1H-NMR titration experiments conducted in CD3CN at four equivalents of TBAF resulted in considerable deshielding of the triazole proton and shielding of the proton para to the phenolic –OH. The change in the triazole proton’s chemical shift for PTP was 0.70 ppm and 0.8 ppm for NpTP.

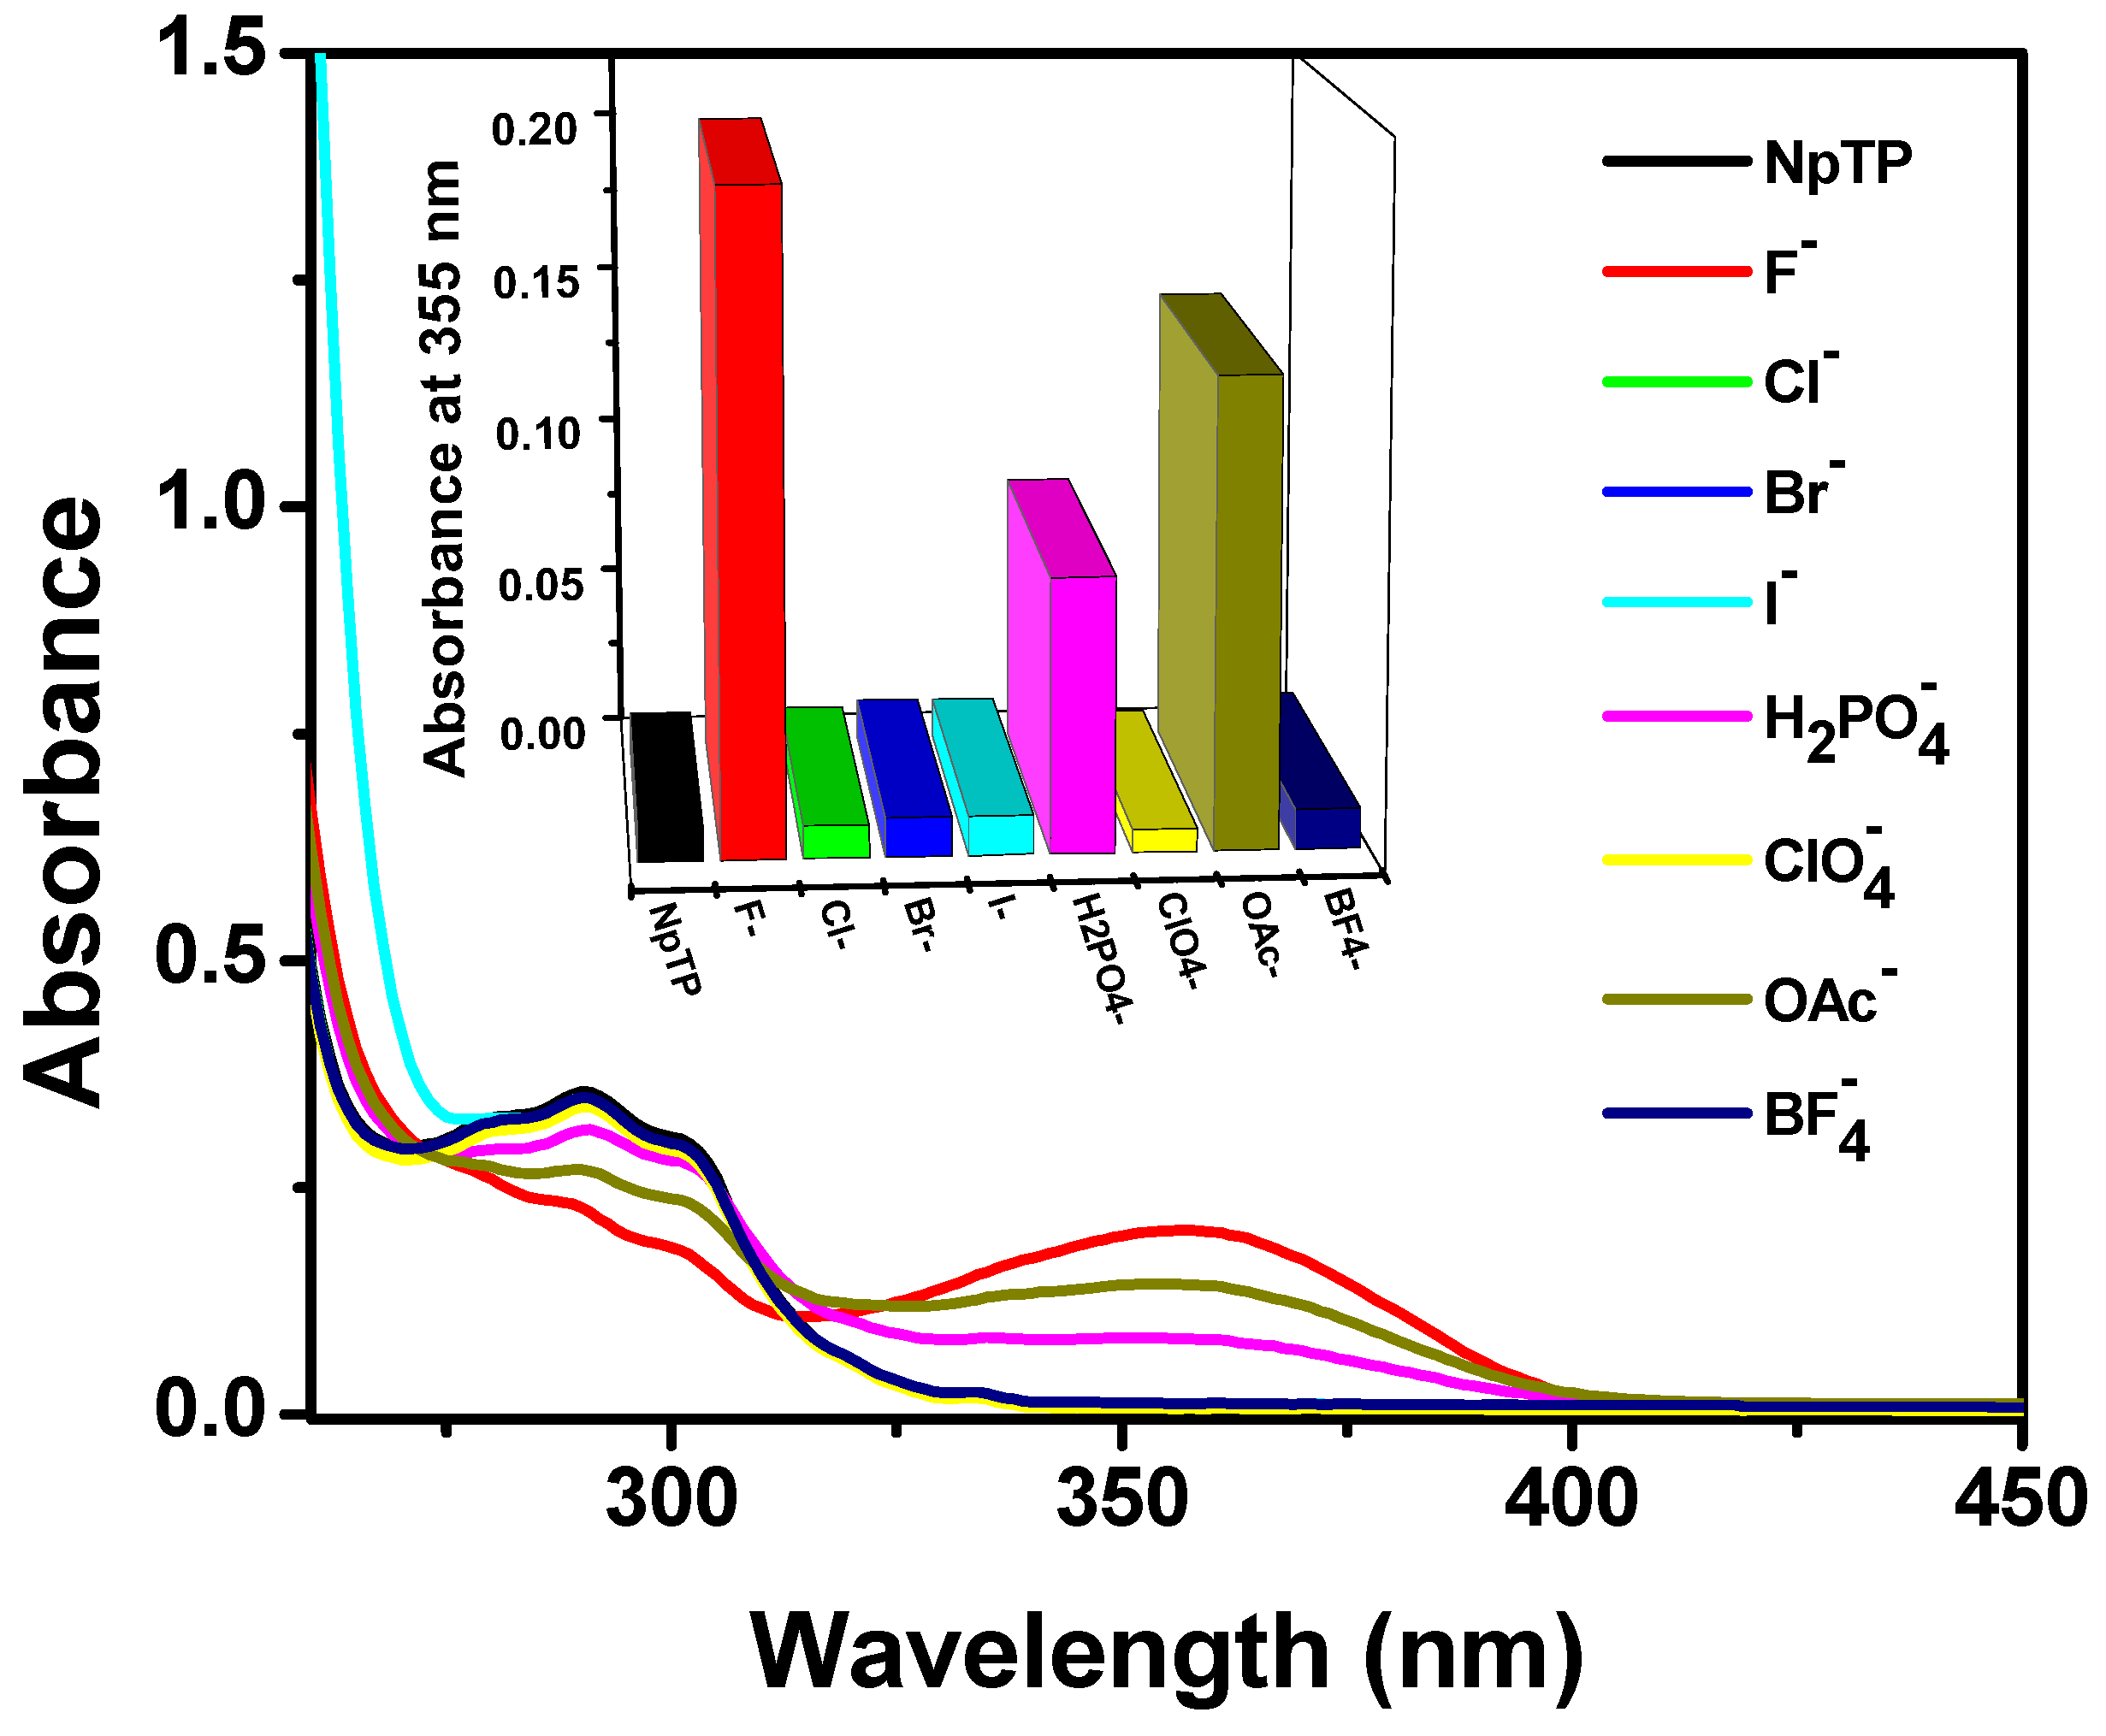
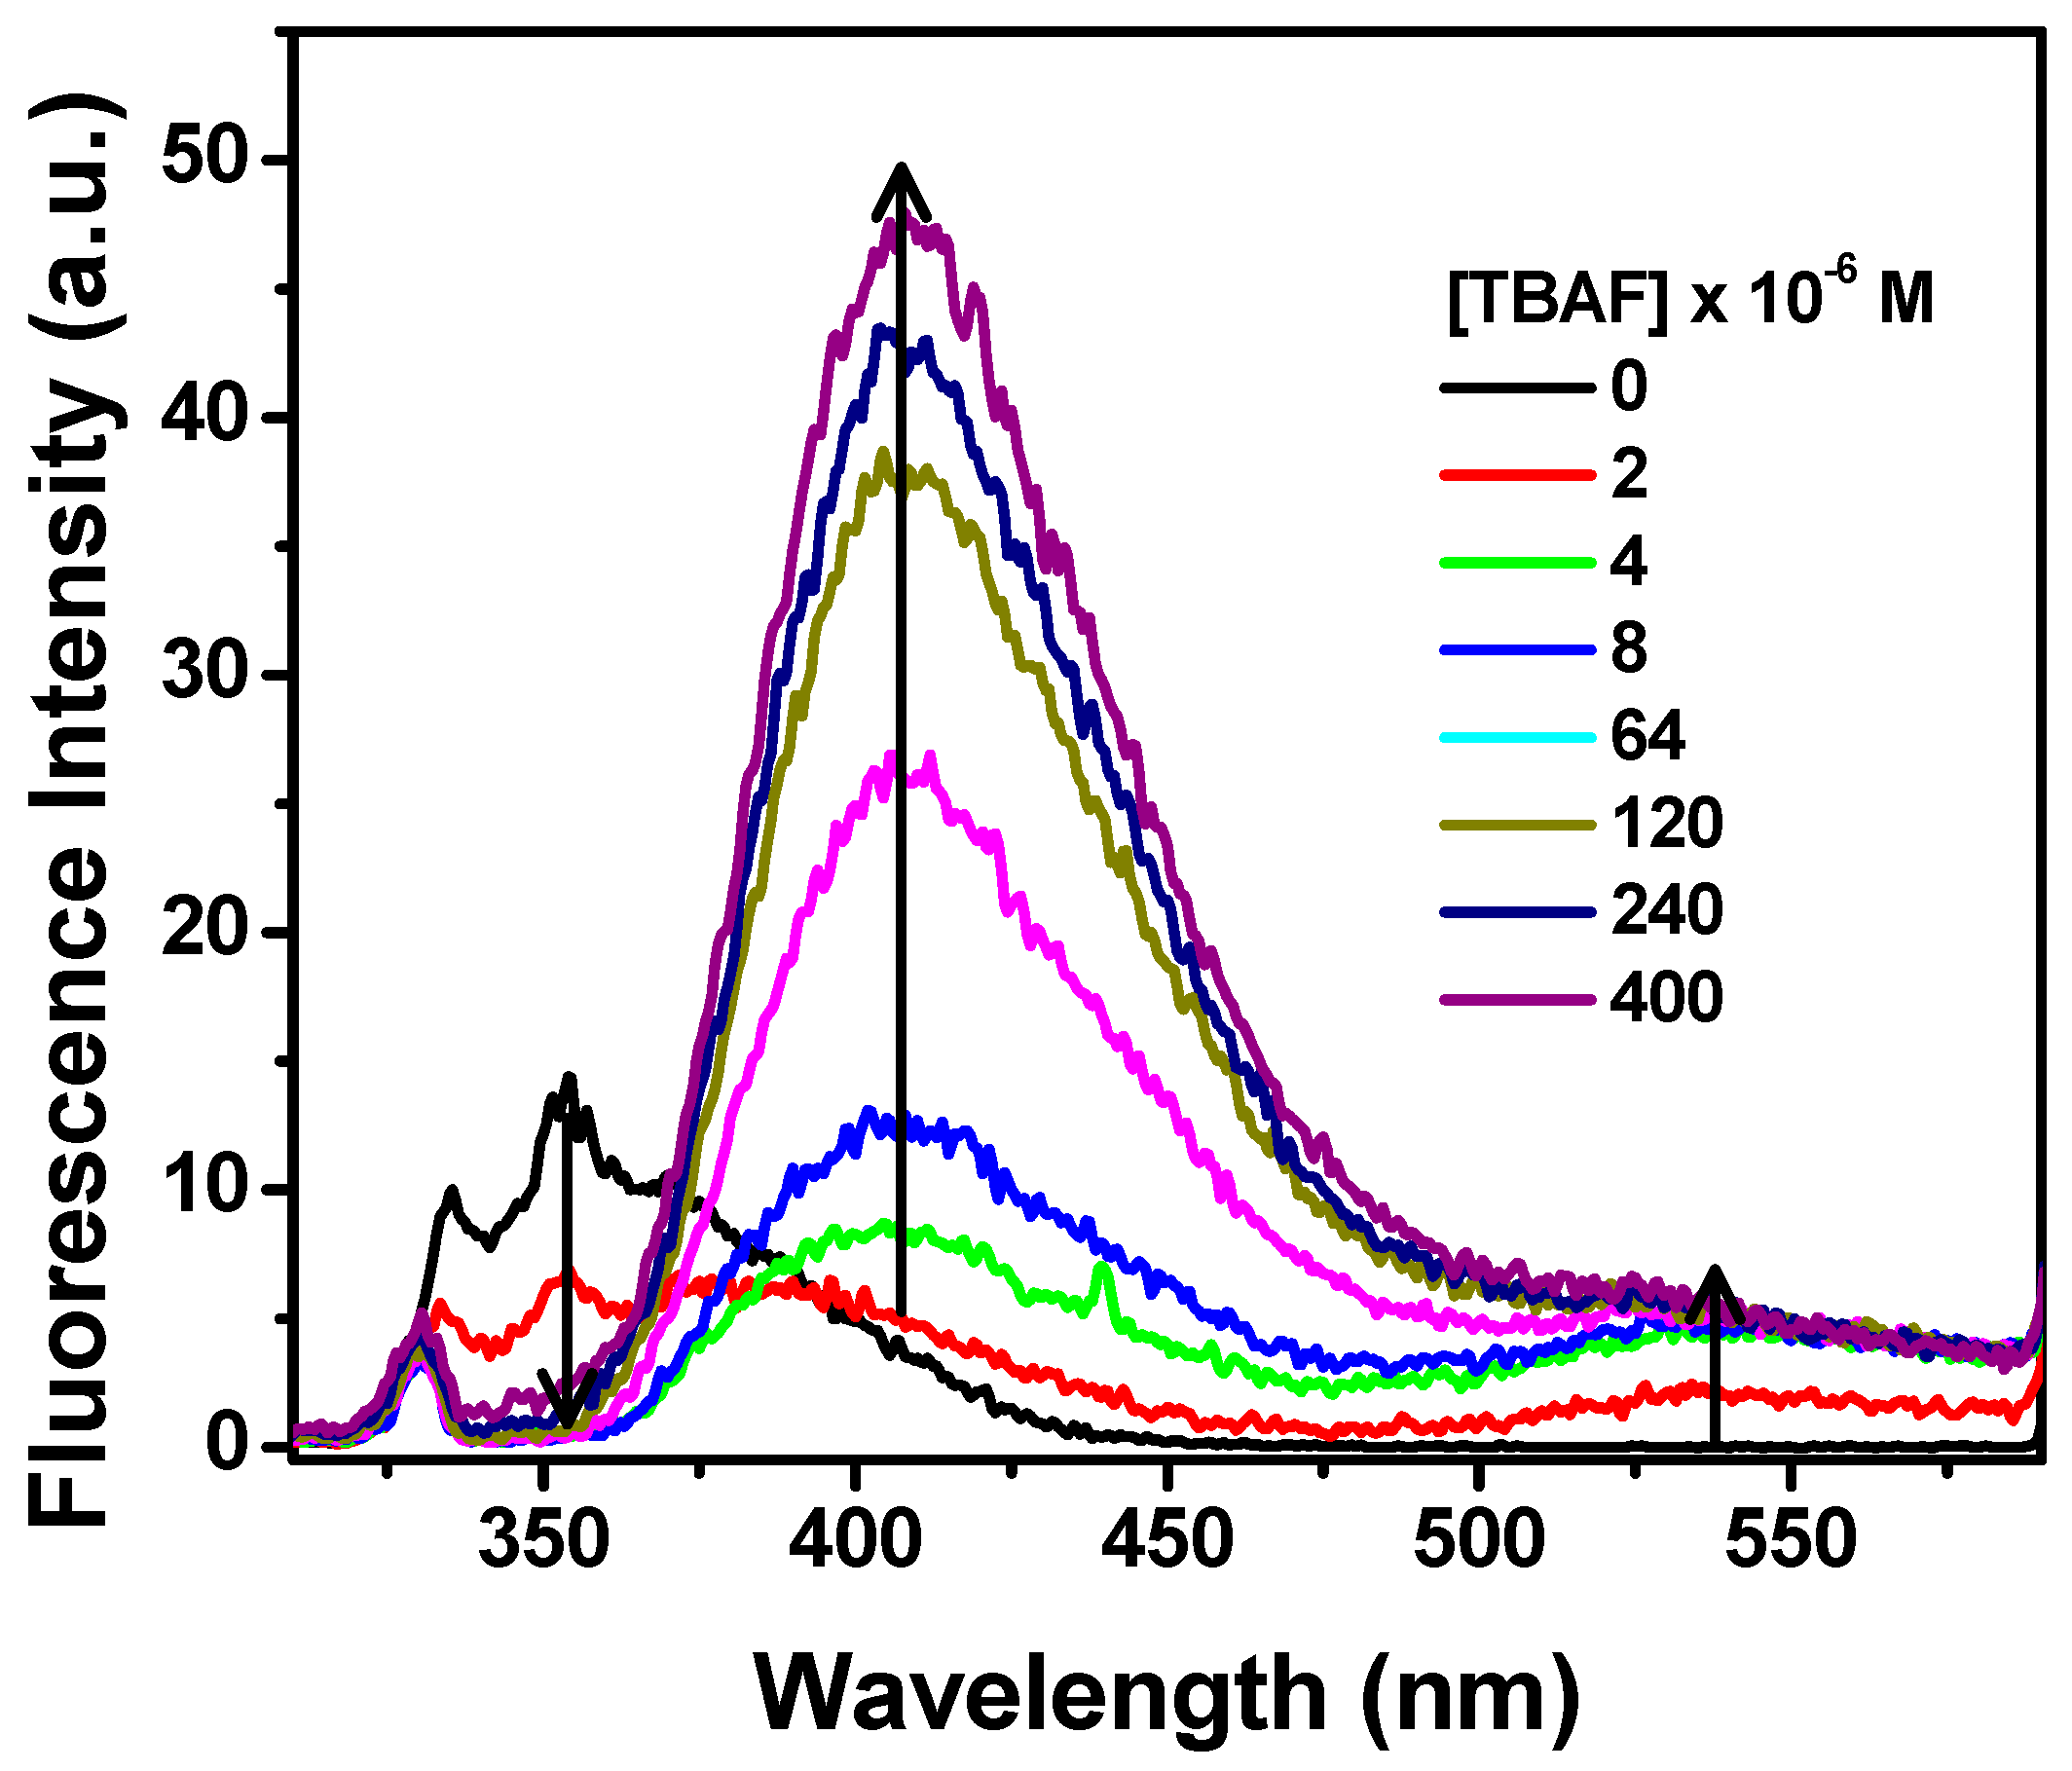
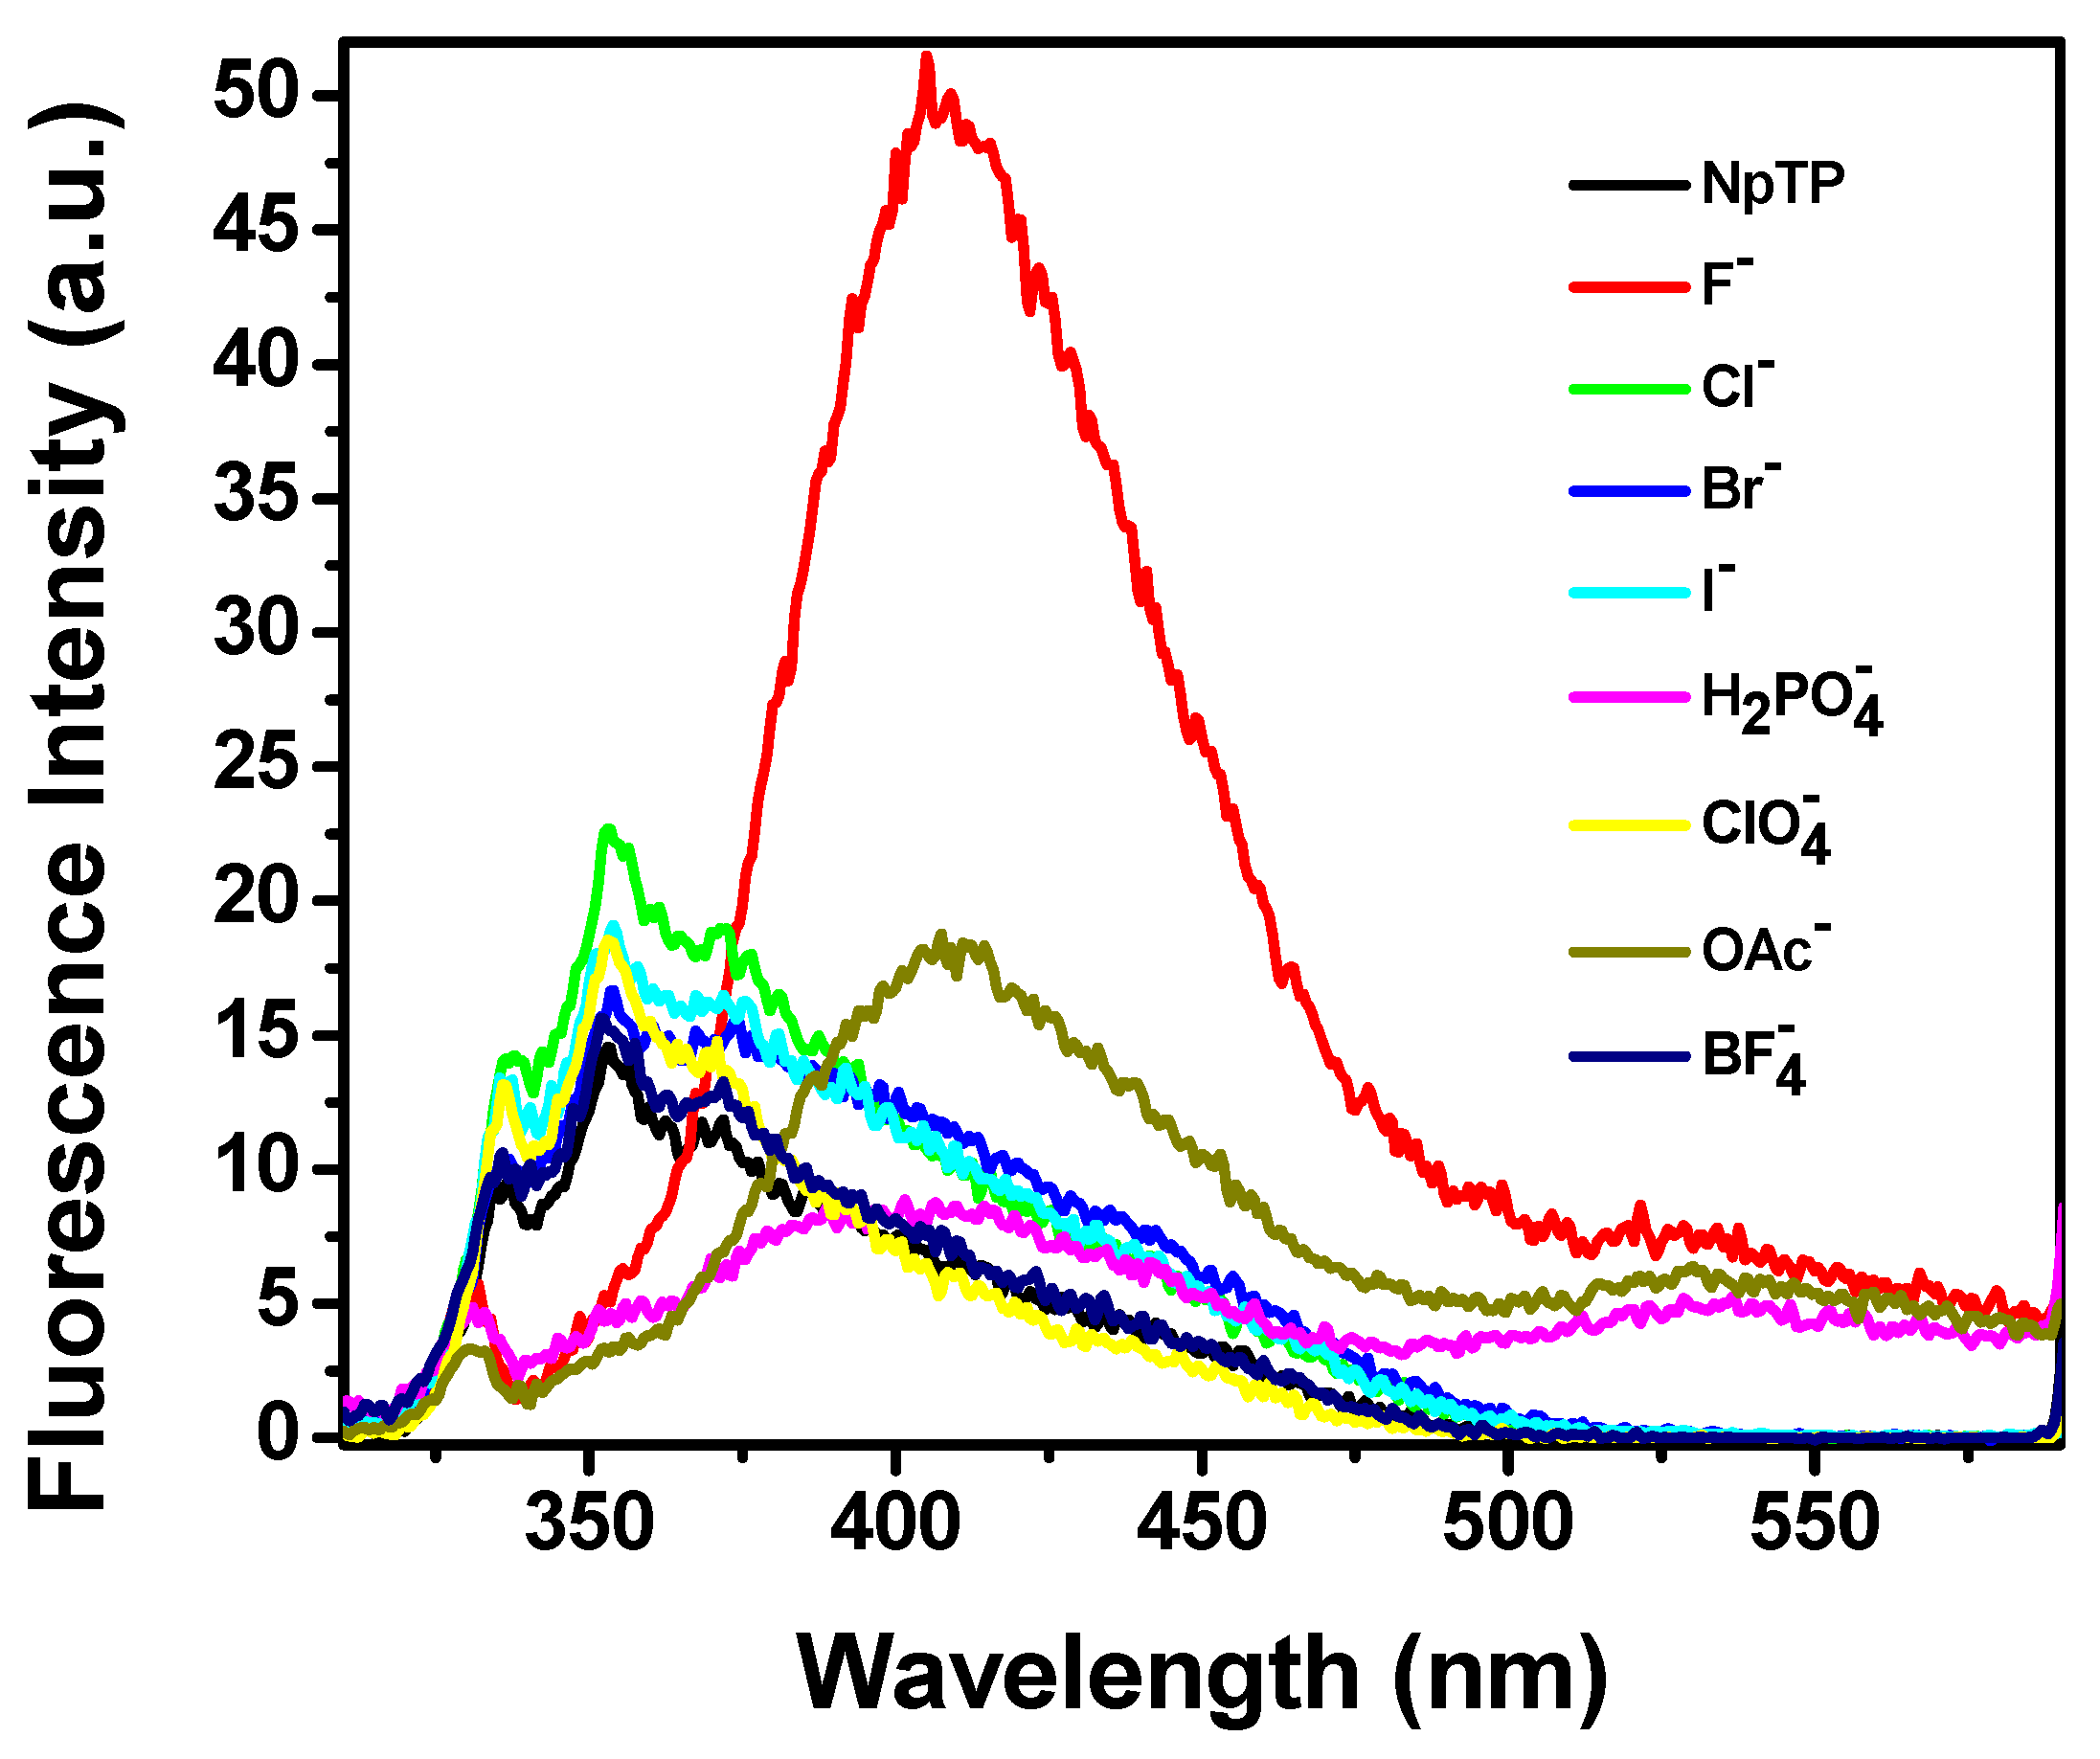
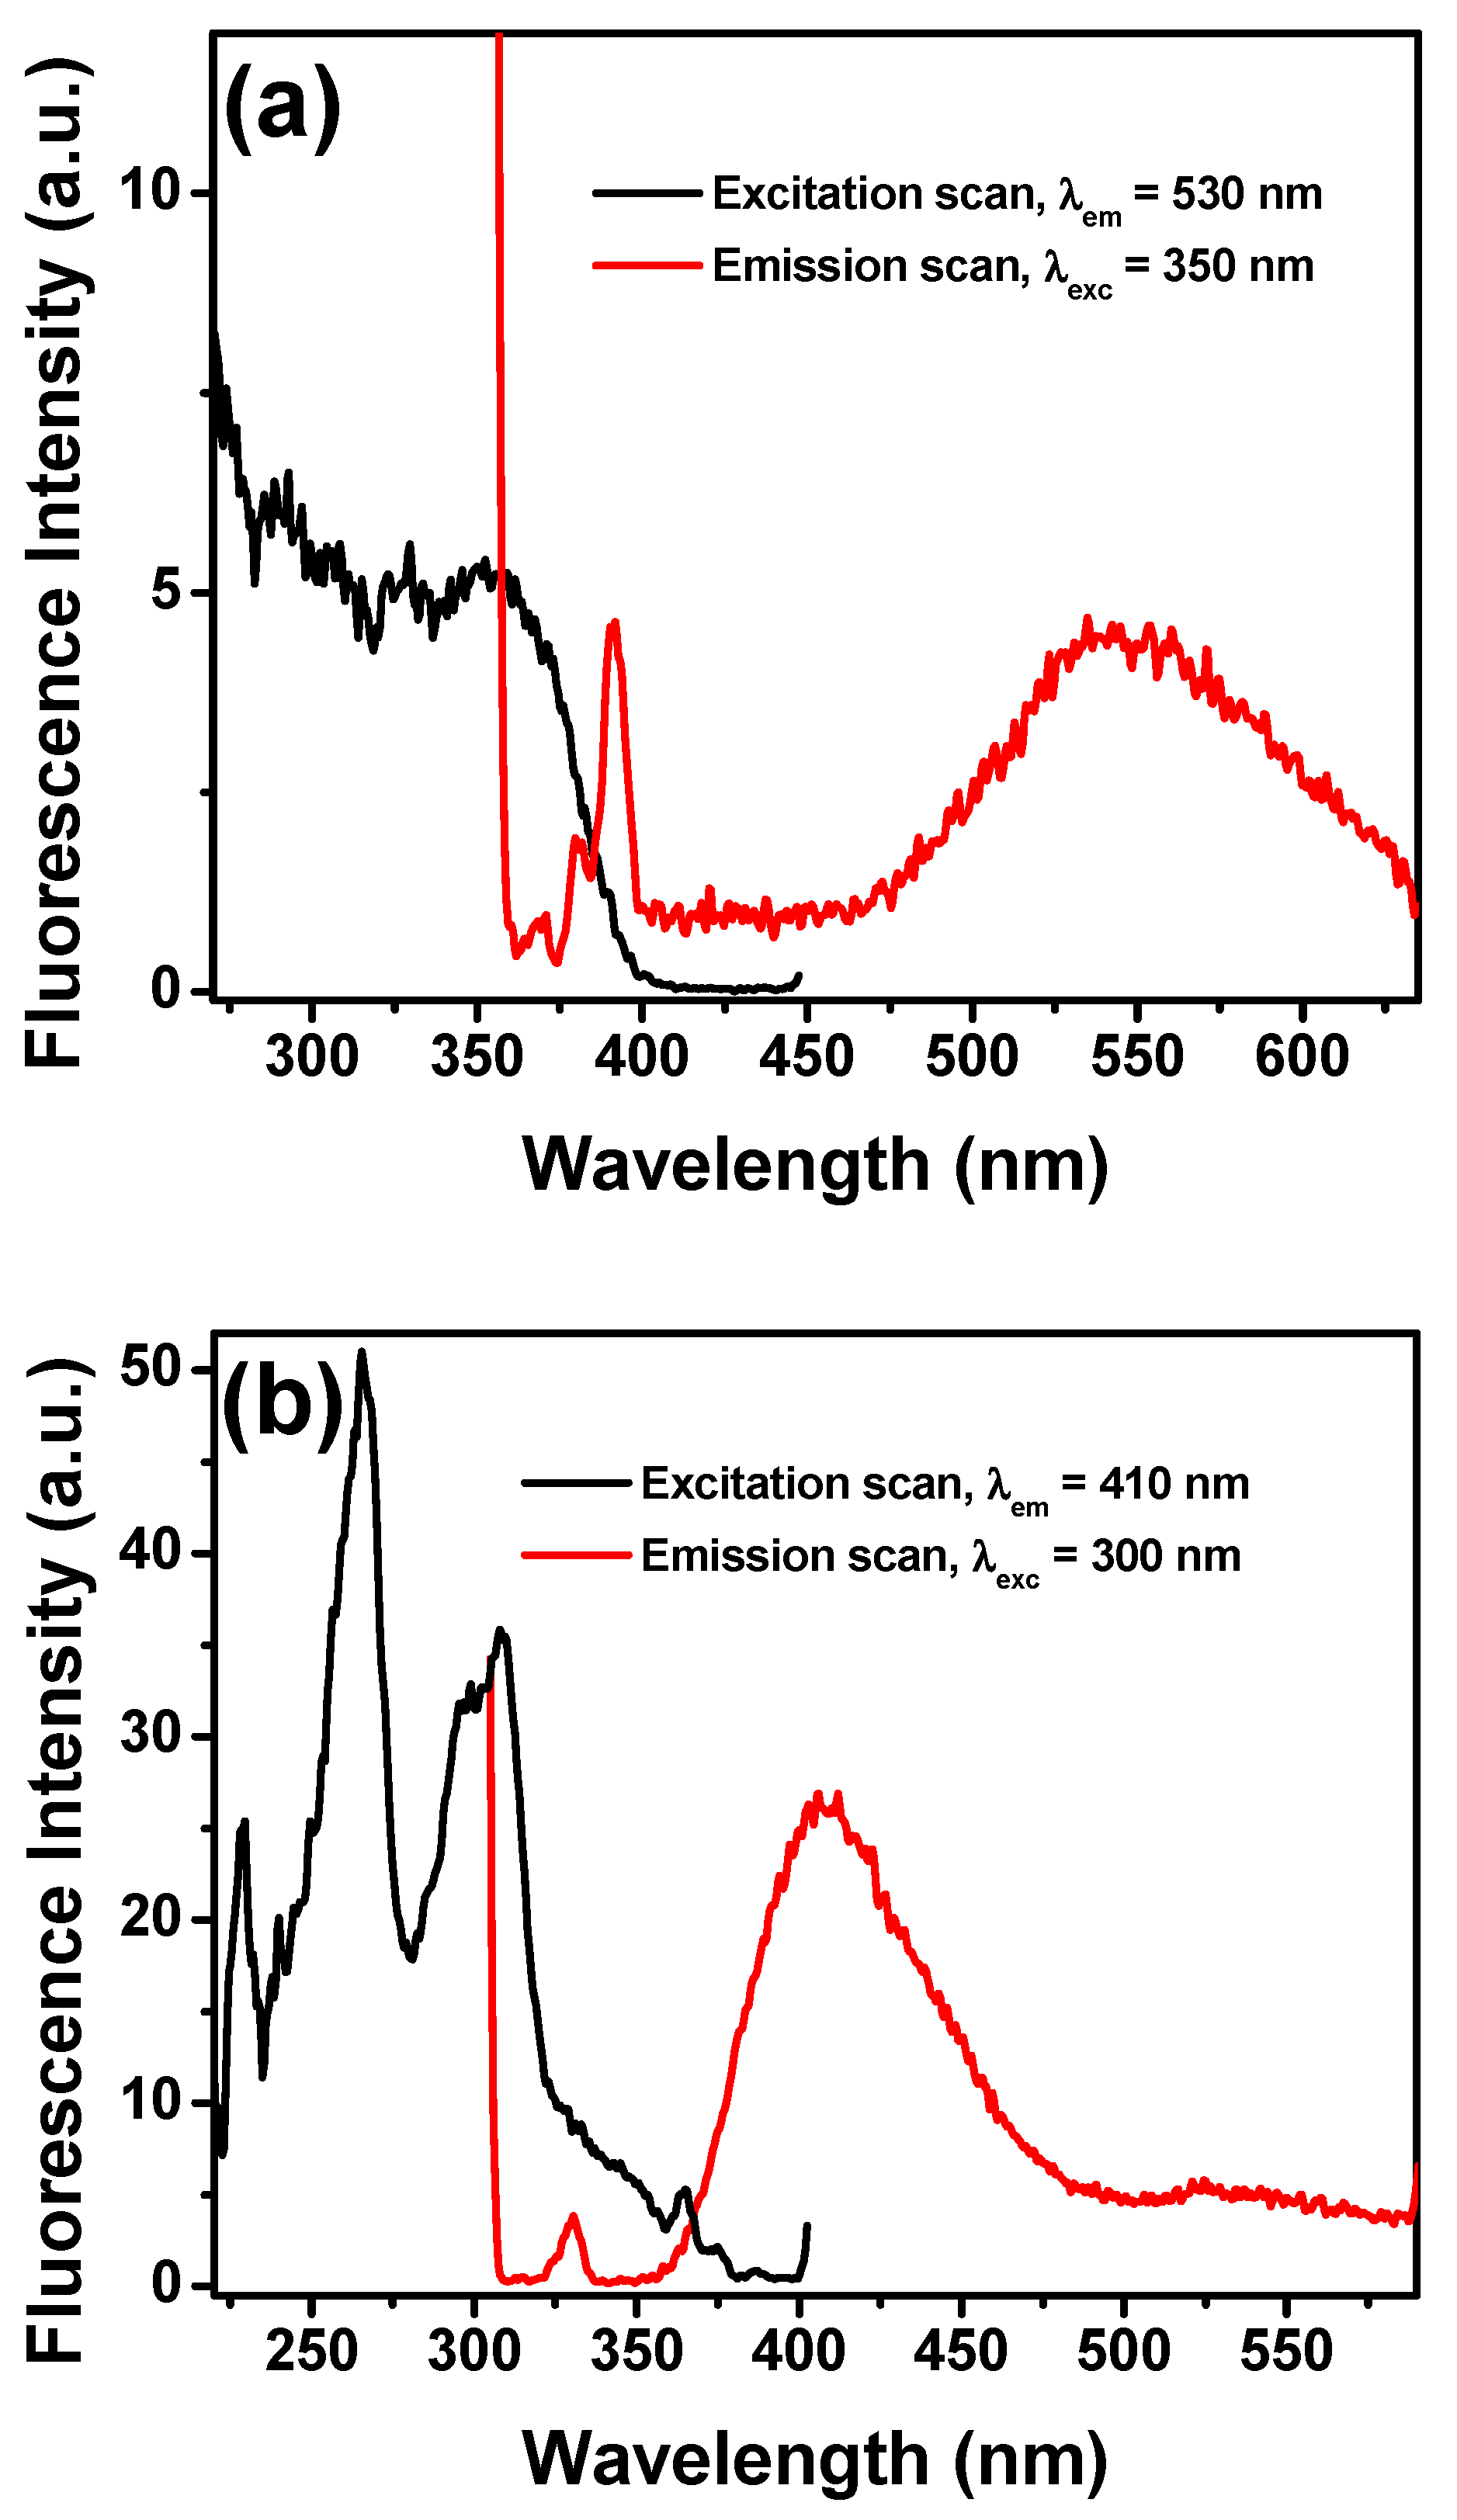
2.2. Absorption and Fluorescence Studies
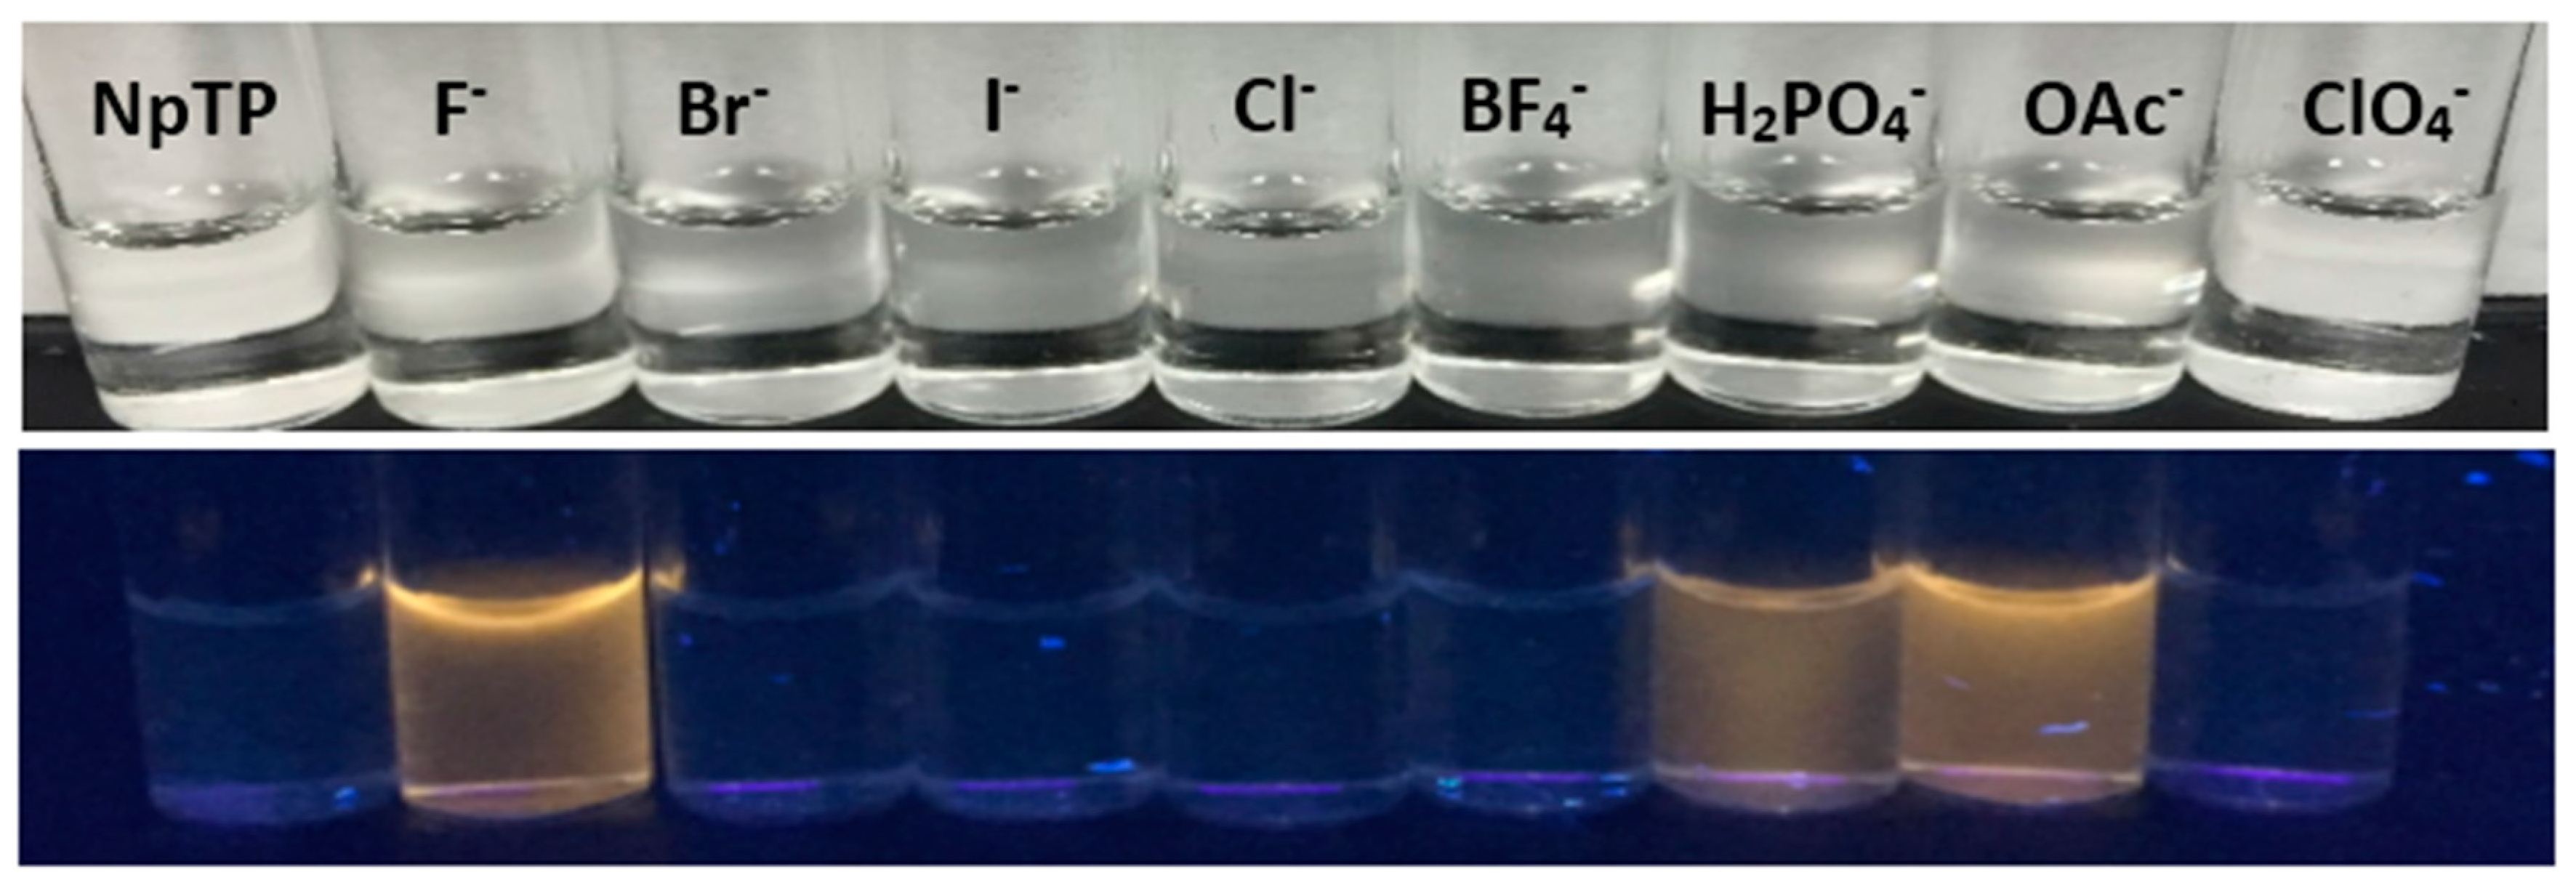
With the NpTP molecule, anion recognition was investigated using steady state absorption and fluorescence experiments. This was carried out by screening the molecule with the tetrabutylammonium salts of various anions: F, Cl, Br, I, H2PO4, ClO4, OAc, and BF4. Significant spectral changes for NpTP in both absorption and fluorescence spectra were noted in the presence of F, OAc, and H2PO4 ions (Figure 8). However, fluoride showed the most significant response compared to the other two anions. In acetonitrile, NpTP showed the lowest energy absorption band in the range of 275–310 nm, peaking at 290 nm. The structured absorption is characteristic of the ππ* transition in the polyaromatic ring system [61,62,63,64]. Development of a new absorption peak around 355 nm at the cost of the pre-existing NpTP original band indicates effective interaction of these ions with NpTP leading to the formation of a new complex (Figure 8).
Modulation in the fluorescence color change of the molecule, as observed in the presence of a UV lamp (Section 2.3) under the influence of fluoride, acetate, and dihydrogen phosphate anions, steered us to investigate the emission properties of NpTP in the presence of these ions. An emission spectrum of NpTP molecule was obtained upon exciting the molecule at 300 nm (around λmax absorption). The structured emission band spanning between 345 nm and 380 nm is due to the naphthalene moiety [65,66], whereas the band at 330 nm is a signature of the phenol triazole group [49]. With the addition of a series of tetrabutylammonium salts of ions, emission spectra of NpTP in presence of the ions (Figure 9) resulted in a similar spectral changes as the absorption profiles (Figure 8). With the addition of F, OAc, and H2PO4 ions, the NpTP emission from the naphthalene moiety was quenched and two new bands developed—one around 410 nm and the other at 530 nm. The band at 530 nm revealed a low quantum yield with respect to the one at 410 nm. Also, in the presence of fluoride ions, the 410 nm band had comparatively higher fluorescence than the other two ions. Fluorescence color study (see Section 2.3, Figure 12) under a UV lamp (long wavelength ~365 nm) resulted in yellow fluorescence for NpTP in the presence of F, OAc, and H2PO4 ions, which validated the existence of a 530 nm emission band (yellow region in the color spectrum) in the presence of these three ions.
To further study the interaction of fluoride with NpTP, TBAF was progressively added to the molecule in acetonitrile. The fluorescence intensity of the 330 nm band of the sensor gradually decreased with a concomitant development of the bands at 410 nm and 530 nm (Figure 10). To unveil the characteristics of each emission band, excitation scans were collected by monitoring the emission wavelengths at 530 nm (Figure 11a) and 410 nm (Figure 11b). The spectrum obtained at λem 530 nm resembled the absorption spectrum when fluoride was added to the molecule, with the peak maximizing at 350 nm. To substantiate our result, the molecule was excited at 350 nm and a broad emission band peaking at 545 nm correlates to the emission band due to fluoride ion interaction with NpTP (Figure 11a).
The spectrum obtained at λem 410 nm (Figure 11b) is rather interesting as it showed the excitation band specific to the naphthalene triazole itself. This hinted at the fact that fluoride addition resulted in a notable change in the photophysical property of the NpTP molecule. The presence of an electron withdrawing group in the form of F ions dramatically influenced the excited state dynamics of the molecule through an inductive effect caused after fluoride is bound to NpTP. This allowed an electron flow throughout the aromatic rings, causing further conjugation in the system and, as a result, a red shifted emission band of NpTP appeared at 410 nm (Figure 11b). This also demonstrated the excited state proton transfer (ESPT) process occurring in this molecule when fluoride abstracts the phenolic proton [26]. The appearance of the 410 nm emission band is attributed to the formation of an anion of NpTP. Deprotonation occurs during the excited state lifetime of the molecule. This phenomenon correlates to the widely studied photophysics of 2-Naphthol [25,67,68,69,70,71] where the molecule undergoes the ESPT process at high pH conditions, revealing emission of the Naptholate anion around 410 nm [67]. Observation of the emissions from both the deprotonated NpTP and NpTP-F hinted at the fact that the excited state reaction is partially completed during the excited state lifetime [67]. Similar observations in the fluorescence spectral patterns of OAc and H2PO4 ions indicated that deprotonation and anion binding are simultaneously taking place with anions that have higher basicity. Though acetate is considered more basic than fluoride, the fluorescence response for fluoride ions is relatively higher than for acetate (Figure 8). Here, the size of the anion played an important part in its binding with the molecule. Fluoride, being smaller in size than acetate, has better proximity to fit in the triazole pocket and bind with the –OH proton.
Overall, relative to our previous study with a phenyl-based sensor, PTP, the spectroscopic investigation with NpTP revealed increased ion-selectivity with the replacement of the phenyl unit by the naphthyl group. While fluoride induces the strongest response in both molecules, with PTP the intensity of the fluorescence with OAc and H2PO4 was on par [49]. For NpTP, the improvement in ion selectivity is verified by a fluorescence output with H2PO4 that is significantly lower than that for OAc (Figure 9), a clear and marked distinction occurring between F versus OAc versus H2PO4.
The stoichiometry of the sensor with F was determined from the modified Benesi–Hildebrand equation (Equation (1)) [72]. The graph was plotted with 1/∆F against 1/[L] (Figure S12):
1/∆F = 1/∆Fmax + 1/K. 1/∆Fmax. 1/[L],
where ∆F = FxF0 and ∆Fmax = FF0;
F0, Fx, and F are the fluorescence intensities of the NpTP molecule considered in the absence, at an intermediate concentration, and at a concentration of complete interaction of the anion, respectively. K is the binding constant and [L] is the concentration of the fluoride anion. The fluorescence was monitored at 530 nm. NpTP showed a linear variation upon addition of fluoride, justifying the validity of the above equation and confirming the 1:1 interaction between the sensor and the anion. The binding constant, K, determined from the slope to be 2.8 × 10⁴ M−1 for NpTP–fluoride binding, demonstrated higher sensitivity towards fluoride compared to our previously studied triazole molecule, PTP (K = 9.0 × 10³ M−1) [49].

2.3. Color Studies

The color study showed (Figure 12) a “turn-on” yellow fluorescence enhancement of NpTP, under a UV lamp of wavelength 365 nm, with tetrabutylammonium salts of fluoride. Salts of H2PO4 and OAc ions also showed the “turn-on” fluorescence but the color intensity was low compared to the F anion. The results corroborated the absorption and fluorescence spectroscopy experiments. The observations from spectroscopic and color studies of NpTP upon addition of F were attributed to hydrogen bonding, which is consistent with previous studies on hydrogen bonding interactions between the sensor and the analyte [24,49,73,74].

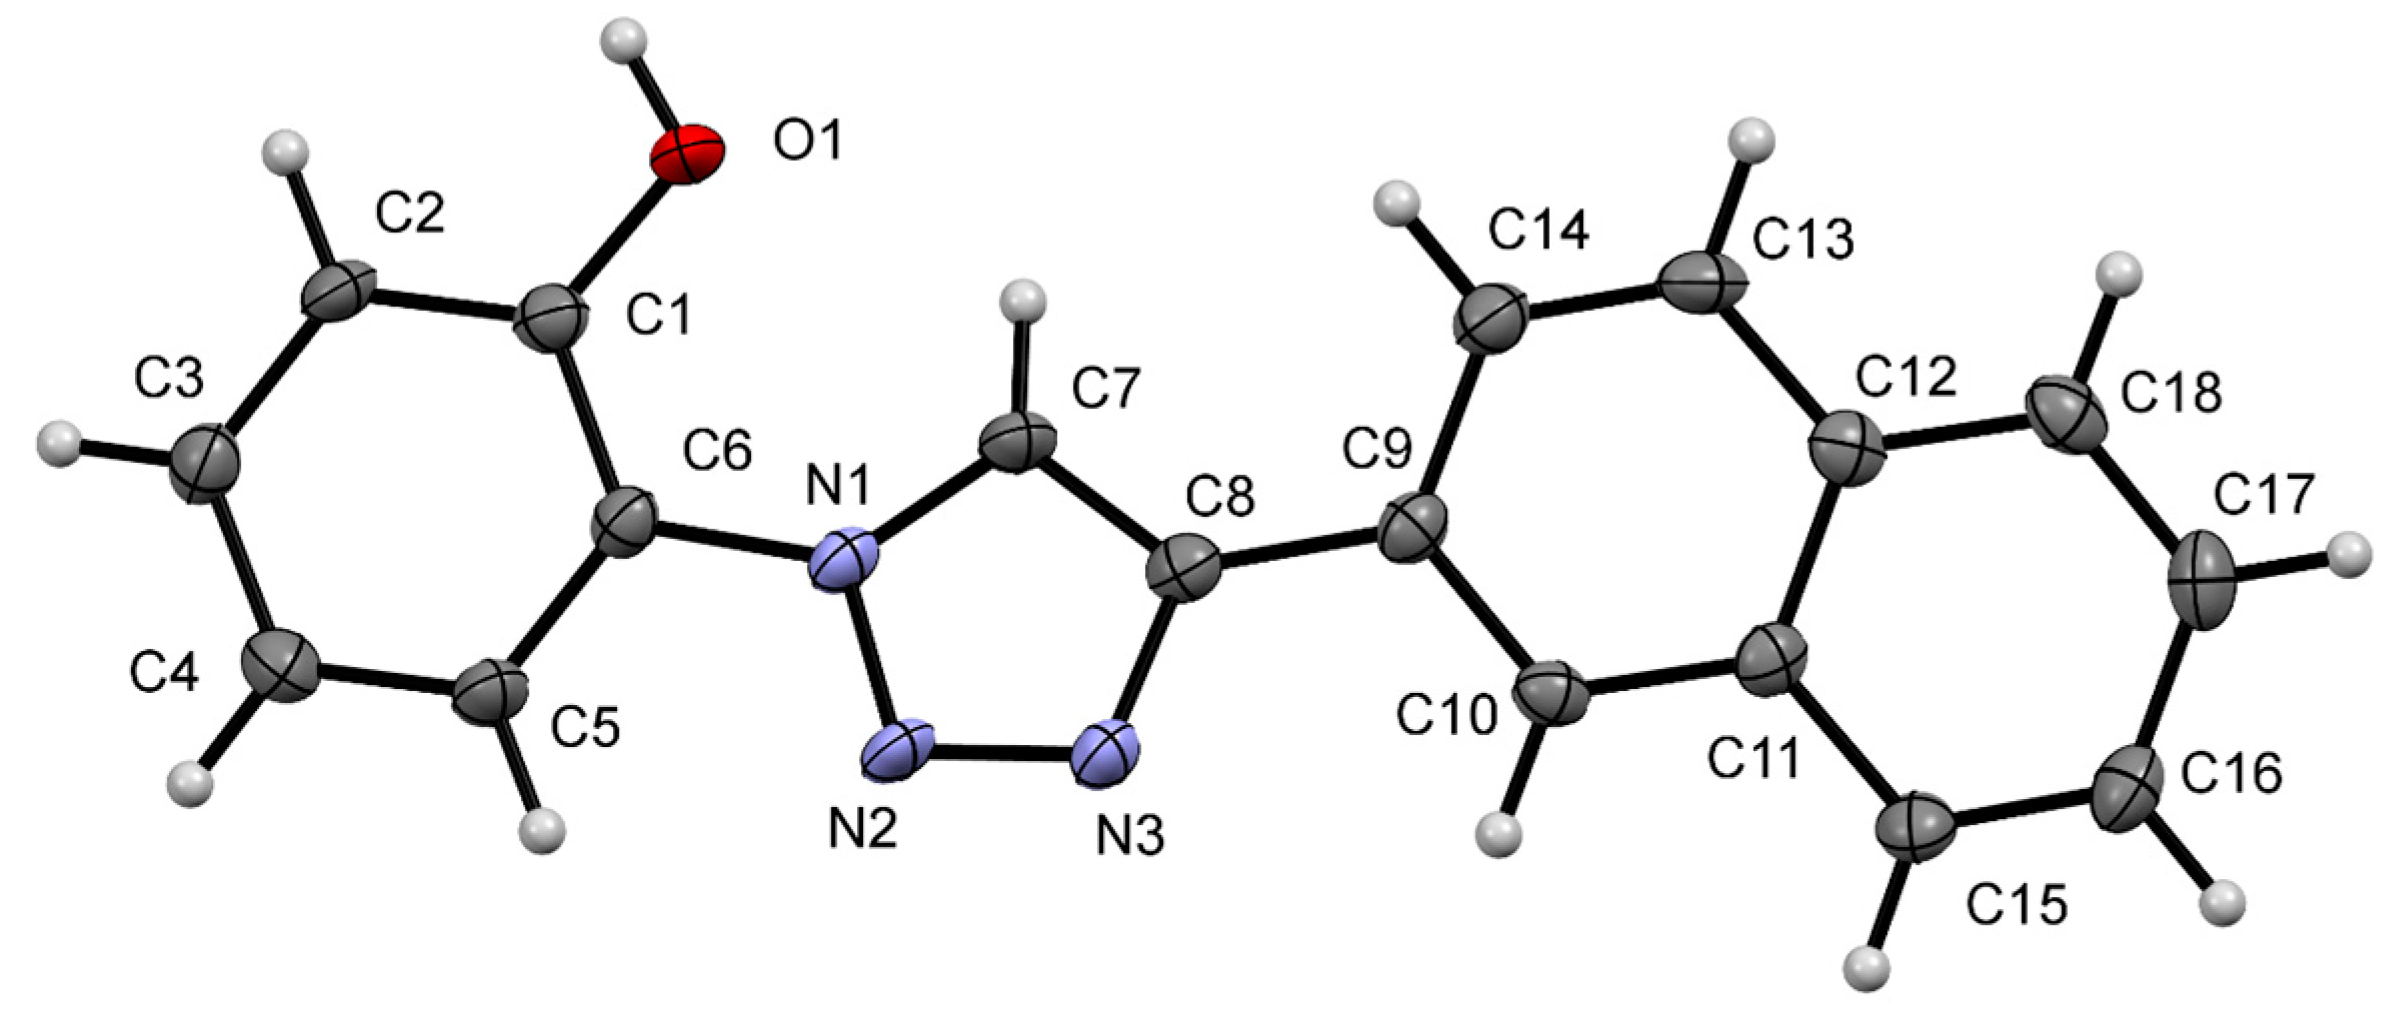
2.4. Single Crystal X-ray Crystallography Studies

The single X-ray crystal of NpTP (15 mg) was obtained by slow evaporation of a mixed solvent system (0.5 mL methanol + 0.2 mL acetonitrile + 2–3 drops of DMSO). A colorless pyramidal crystal of C18H13N3O having approximate dimensions of 0.067 mm × 0.068 mm × 0.071 mm was used for the X-ray crystallographic analysis. Crystal data, data collection, and structure refinement details are summarized in Table 1. NpTP crystallized in the tetragonal space group P43 (#78) with the unit cell parameters a = 7.3806(16) Å, b = 7.3806(16) Å, c = 50.665(11) Å, volume = 2759.9(13) Å3. The structure was collected at 140 K and had an unweighted r factor of 4.88% (R1). The thermal ellipsoid of the single-crystal structure of NpTP is shown in Figure 13.
The structure has two independent NpTP molecules in the asymmetric unit that only differ in the orientation of the naphthyl ring to the triazole. The structure is held together by two independent hydrogen bonding chains with H-bond between the phenolic O–H and the triazole nitrogen of neighboring molecules. The first chain runs parallel to the a-axis (Figure S15), the second runs parallel to the b-axis (Figure S16). Combined, these form a network of hydrogen bonds that holds the overall structure together. The detail reports on NpTP crystal structure is provided in Table S1–S7.

3. Materials and Methods

All chemicals and reactants for NpTP synthesis and the tetrabutylammonium salts of anions were obtained from commercial sources (Sigma-Aldrich (St. Louis, MO, USA) and Acros Organics (Pittsburgh, PA, USA)) and used without further purification. Column chromatography was performed with Selecto Scientific Si-gel (particle size 100–200 microns). All reactions were monitored by thin-layer chromatography (TLC) using Agela Technologies silica gel plates 60 F254 (Wilmington, DE, USA). Visualization was accomplished with UV light and/or staining with appropriate stains (iodine, vanillin). Melting points were measured with a Vernier Melt Station (Beaverton, OR, USA) using a Vernier LabQuest 2 and are uncorrected. NMR spectra were recorded on an Agilent MR400DD2 spectrometer (Santa Clara, CA, USA), with a multinuclear probe with two RF channels and variable temperature capability (1H-NMR: 400 MHz, 13C-NMR: 100 MHz). The solvent used was CD3CN, [(CD3)2SO], [(CD3)2CO] purchased from Sigma-Aldrich (St. Louis, MO, USA) and Acros Organics (Pittsburgh, PA, USA) with TMS as an internal standard set at 0 ppm in both 1H-NMR and 13C-NMR spectra. The NMR signals are reported in parts per million (ppm) relative to the residual in the solvent. Signals are described with multiplicity, singlet (s), doublet (d), triplet (t), triplet of doublet (td), quartet (q) and multiplet (m); coupling constants (J; Hz) and integration. High Resolution MS (HRMS) analyses were performed using MALDI, Q-TOF micro, 3200API, LCMS, GCMS EI (DI) (Figure S13). The Electrospray Ionization Mass Spectrometry (ESI-MS) was conducted using a Shimadzu LCMS-2020 Single Quad (Korneuburg, Austria) (Figure S14).
Room-temperature absorption and steady-state fluorescence measurements were performed using a Shimadzu UV-2450 spectrophotometer and PerkinElmer LS55 (Waltham, MA, USA) with a well plate reader fluorimeter, respectively. Concentration of NpTP was kept at ~1.0 × 10⁻⁶ M in acetonitrile to avoid any possible intermolecular effect. Stock concentrations of ~1.0 × 10⁻² M for the tetrabutylammonium salts of anions were also prepared in acetonitrile. The solvents used are of HPLC grade and all the experiments were performed at ambient temperature (27 °C) with air-equilibrated solutions.
The single X-ray crystal structure measurements were made on a Bruker D8 Venture Photon 100 diffractometer using Mo-Kα radiation (Madison, WI, USA).
General procedure for synthesis of sensor 2-(4-(naphthalen-2-yl)-1H-1,2,3-triazol-1-yl)phenol (NpTP): 2-Azidophenol (225.4 mg, 1.67 mmol) [75] and naphthylene-2-acetylene (253.9 mg, 1.67 mmol) were suspended in tert-butanol/water (33.4 mL; 1:1, v/v) in a round bottomed flask. In order to dissolve the solids completely, the mixture was warmed slightly above the room temperature. An aqueous solution of copper(II) sulfate pentahydrate (8.10 mg, 0.03 mmol in 2 mL of water) was then added dropwise, followed by sodium ascorbate (64.0 mg, 0.32 mmol in 2 mL of water). The reaction was stirred vigorously while refluxing for 24 h. Upon cooling to room temperature, the resulting mixture was placed in an ice bath and diluted with water (~20 mL) to induce precipitation. The crude, solid product was collected with vacuum filtration and purified by flash column chromatography (10% ethyl acetate in hexanes followed by 40% ethyl acetate in hexanes) to provide a beige powder, 329.6 mg (69%).
Melting point: 225.9–226.5 °C.
1H-NMR (400 MHz, DMSO-d6) δ 10.60 (brs, 1H, OH), 9.05 (s, 1H), 8.52 (s, 1H), 8.11 (dd, 1H, 1.6, 8.0 Hz), 7.98–8.04 (m, 2H), 7.95 (dd, 1H, 1.4, 8.0 Hz), 7.66 (dd, 1.68, 7.92), 7.50–7.60 (m, 2H), 7.39 (ddd, 1H, 0.8, 1.76, 7.48 Hz), 7.17 (dd, 1H, 1.28, 8.3 Hz), 7.03 (td, 1H, 1.2, 7.6 Hz).
13C-NMR (100 MHz, DMSO-d6) δ 150.0, 146.1, 133.2, 132.6, 130.4, 128.5, 128.0, 127.7, 126.6, 126.1, 125.5, 124.6, 123.7, 123.6, 123.4, 119.5, 117.0.
ESI-MS m/z 288.0 [M + H]+; calculated value for C18H13N3O = 287.0, found from experiment 288.0.
HRMS (ESI/QTOF) m/z: [M + H]+ calculated for C18H14N3O 288.1131; Found 288.1119.

4. Conclusions

A new, simple, efficient synthesis of a naphthalene-based -1,2,3-triazole fluorescent sensor that showed yellow “turn-on” fluorescence response in the presence of fluoride ions has been developed. The single crystal and NMR studies confirmed the skeletal structure of NpTP. The binding interaction of NpTP with the fluoride anion through the phenolic group and the triazole proton of the sensor was confirmed from the upfield shift of the phenolic protons and the downfield shift of the triazole proton. Job’s plot using NMR studies revealed 1:1 binding between the NpTP molecule and the anion. Steady state studies of UV-Vis and fluorescence supported the formation of the new species after the interaction of NpTP and F. The presence of fluoride ions demonstrated an ESPT process in the molecule. The recognition behavior of the NpTP molecule towards anions can find applications in logic gate systems, molecular switches, dual detection systems, and in a biological environment. The described sensing system can also open up avenues in “structure–signal” (structure–property) investigations for developing a predictive model for tuning the signal-output of 1,2,3-triazole sensors for efficient and selective sensing.

Supplementary Materials

The following are available online at https://www.mdpi.com/2312-7481/4/1/15/s1. Figure S1. 1H-NMR spectrum of NpTP. Figure S2. 13C-NMR spectrum of NpTP in DMSO-d6. Figure S3. 13C-NMR spectrum of NpTP in Acetone-d6. Figure S4. 1D DEPT90 spectrum of NpTP. Figure S5. 2D HMBC spectrum of NpTP. Figure S6. The 2D NOESY spectrum of NpTP in ((CD3)2S=O, RT) showing the correlation between the H7 proton and H10 and H14 protons and in between H10 and H15 proton. Figure S7. The 2D NOESY spectrum of NpTP in ((CD3)2S=O, RT) showing the correlation between the -OH proton and H2 proton. Figure S8. 2D NOESY spectrum of NpTP + 4 equivalence of TBAF. Figure S9. 1H-NMR Titration experiments of NpTP with TBAF in DMSO-d6. Figure S10. 1H-NMR Titration experiments of NpTP with TBAF in DMSO-d6, region expanded from 13.5 to 18.0 ppm. Figure S11. 19F-NMR Titration experiments of NpTP with TBAF in DMSO-d6. Figure S12. Benesi–Hildebrand plot of NpTP. Figure S13. HRMS of NpTP. Figure S14. ESI of NpTP. Figures S15 and S16. Single Crystal X-ray spectroscopic study. Tables S1–S7. Detail reports on NpTP crystal structure.

Acknowledgments

The authors acknowledge the Department of Chemistry and Biochemistry, Georgia Southern University, College of Science and Mathematics and the College Office of Undergraduate Research (COUR) for the financial assistance. The authors are also thankful to Jeffrey Orvis for the intellectual and helpful discussion. Jessica Bunn, ShainazLandge, and KarelleAiken acknowledge the support of the National Science Foundation (Award Number: NSF-CHE (REU) 1359229).

Author Contributions

Georgia Southern University is a Primarily Undergraduate Institution and hence multiple undergraduates have been involved in this project. Jessica Bunn (summer REU scholar), Steven Sutton, Matthew Christianson, and Christian Freeman are all undergraduate scholars who have contributed towards this project with synthesis and analysis. Domonique Winder was a Master’s student who was involved in the initial synthesis of NpTP. Clifford Padgett and Colin McMillen analyzed and solved the crystal structure. Shainaz Landge, Karelle Aiken, and Debanjana Ghosh conceived, designed, and analyzed the experiments. Karelle Aiken is primarily responsible for the synthesis of the sensors. Debanjana Ghosh performed the steady-state studies and Shainaz Landge performed the NMR and color studies. Shainaz Landge, Karelle Aiken, and Debanjana Ghosh all are equally responsible for writing this manuscript.

Conflicts of Interest

The authors declare no conflict of interest.

References

  1. Lehn, J.-M. Molecular and Supramolecular Devices. In Supramolecular Chemistry; Wiley-VCH Verlag GmbH & Co. KGaA: Weinheim, Germany, 1995. [Google Scholar]
  2. Gopel, W.; Hesse, J.; Zemel, J.N. Sensors: A Comprehensive Survey; Wiley: Hoboken, NJ, USA, 1989. [Google Scholar]
  3. Zaccheroni, N.; Palomba, F.; Rampazzo, E. Luminescent Chemosensors: From Molecules to Nanostructures. In Applied Photochemistry: When Light Meets Molecules; Bergamini, G., Silvi, S., Eds.; Springer International Publishing: Cham, Switzerland, 2016. [Google Scholar]
  4. Kubo, Y.; Yamamoto, M.; Ikeda, M.; Takeuchi, M.; Shinkai, S.; Yamaguchi, S.; Tamao, K. A Colorimetric and Ratiometric Fluorescent Chemosensor with Three Emission Changes: Fluoride Ion Sensing by a Triarylborane– Porphyrin Conjugate. Angew. Chem. Int. Ed. 2003, 42, 2036–2040. [Google Scholar] [CrossRef] [PubMed]
  5. Udhayakumari, D.; Naha, S.; Velmathi, S. Colorimetric and fluorescent chemosensors for Cu2+. A comprehensive review from the years 2013–15. Anal. Methods 2017, 9, 552–578. [Google Scholar] [CrossRef]
  6. Zhou, Y.; Zhang, J.F.; Yoon, J. Fluorescence and Colorimetric Chemosensors for Fluoride-Ion Detection. Chem. Rev. 2014, 114, 5511–5571. [Google Scholar] [CrossRef] [PubMed]
  7. Du, J.; Hu, M.; Fan, J.; Peng, X. Fluorescent chemodosimeters using “mild” chemical events for the detection of small anions and cations in biological and environmental media. Chem. Soc. Rev. 2012, 41, 4511–4535. [Google Scholar] [CrossRef] [PubMed]
  8. Hussain, I.; Ahamad, K.U.; Nath, P. Low-Cost, Robust, and Field Portable Smartphone Platform Photometric Sensor for Fluoride Level Detection in Drinking Water. Anal. Chem. 2017, 89, 767–775. [Google Scholar] [CrossRef] [PubMed]
  9. Ayoob, S.; Gupta, A.K. Fluoride in Drinking Water: A Review on the Status and Stress Effects. Crit. Rev. Environ. Sci. Technol. 2006, 36, 433–487. [Google Scholar] [CrossRef]
  10. Carey, C.M. Focus on Fluorides: Update on the Use of Fluoride for the Prevention of Dental Caries. J. Evid. Based Dent. Pract. 2014, 14, 95–102. [Google Scholar] [CrossRef] [PubMed]
  11. Everett, E.T. Fluoride’s Effects on the Formation of Teeth and Bones, and the Influence of Genetics. J. Dent. Res. 2010, 90, 552–560. [Google Scholar] [CrossRef] [PubMed]
  12. Jha, S.K.; Singh, R.K.; Damodaran, T.; Mishra, V.K.; Sharma, D.K.; Rai, D. Fluoride in Groundwater: Toxicological Exposure and Remedies. J. Toxicol. Environ. Health 2013, 16, 52–66. [Google Scholar] [CrossRef] [PubMed]
  13. Valdez Jiménez, L.; López Guzmán, O.D.; Cervantes Flores, M.; Costilla-Salazar, R.; Calderón Hernández, J.; Alcaraz Contreras, Y.; Rocha-Amador, D.O. In utero exposure to fluoride and cognitive development delay in infants. Neurotoxicology 2017, 59, 65–70. [Google Scholar] [CrossRef] [PubMed]
  14. Van Veen, E.H.; De Loos-Vollebregt, M.T.C.; Wassink, A.P.; Kalter, H. Determination of trace elements in uranium by inductively coupled plasma-atomic emission spectrometry using Kalman filtering. Anal. Chem. 1992, 64, 1643–1649. [Google Scholar] [CrossRef]
  15. Orlov, A.A.; Tsimbalyuk, A.F.; Malyugin, R.V. Desublimation for Purification and Transporting UF6: Process Description and Modeling. Sep. Purif. Rev. 2017, 46, 81–89. [Google Scholar] [CrossRef]
  16. El Sayed, S.; Pascual, L.; Agostini, A.; Martínez-Máñez, R.; Sancenón, F.; Costero, A.M.; Parra, M.; Gil, S. A Chromogenic Probe for the Selective Recognition of Sarin and Soman Mimic DFP. ChemistryOpen 2014, 3, 142–145. [Google Scholar] [CrossRef] [PubMed]
  17. Jang, Y.J.; Kim, K.; Tsay, O.G.; Atwood, D.A.; Churchill, D.G. Update 1 of: Destruction and Detection of Chemical Warfare Agents. Chem. Rev. 2015, 115, PR1–PR76. [Google Scholar] [CrossRef] [PubMed]
  18. Duke, R.M.; Veale, E.B.; Pfeffer, F.M.; Kruger, P.E.; Gunnlaugsson, T. Colorimetric and fluorescent anion sensors: an overview of recent developments in the use of 1,8-naphthalimide-based chemosensors. Chem. Soc. Rev. 2010, 39, 3936–3953. [Google Scholar] [CrossRef] [PubMed]
  19. Amendola, V.; Fabbrizzi, L.; Mosca, L.; Schmidtchen, F.-P. Urea-, Squaramide-, and Sulfonamide-Based Anion Receptors: A Thermodynamic Study. Chemistry 2011, 17, 5972–5981. [Google Scholar] [CrossRef] [PubMed]
  20. Perez-Ruiz, R.; Diaz, Y.; Goldfuss, B.; Hertel, D.; Meerholz, K.; Griesbeck, A.G. Fluoride recognition by a chiral urea receptor linked to a phthalimide chromophore. Org. Biomol. Chem. 2009, 7, 3499–3504. [Google Scholar] [CrossRef] [PubMed]
  21. Gunnlaugsson, T.; Davis, A.P.; Glynn, M. Fluorescent photoinduced electron transfer (PET) sensing of anions using charge neutral chemosensors. Chem. Commun. 2001, 24, 2556–2557. [Google Scholar] [CrossRef]
  22. Beer, P.D. Transition-Metal Receptor Systems for the Selective Recognition and Sensing of Anionic Guest Species. Acc. Chem. Res. 1998, 31, 71–80. [Google Scholar] [CrossRef]
  23. Ghosh, D.; Nandi, N.; Chattopadhyay, N. Differential Förster Resonance Energy Transfer from the Excimers of Poly(N-vinylcarbazole) to Coumarin 153. J. Phys. Chem. B 2012, 116, 4693–4701. [Google Scholar] [CrossRef] [PubMed]
  24. Ghosh, D.; Sarkar, D.; Chattopadhyay, N. Intramolecular charge transfer promoted fluorescence transfer: A demonstration of re-absorption of the donor fluorescence by the acceptor. J. Mol. Liq. 2010, 156, 131–136. [Google Scholar] [CrossRef]
  25. Loken, M.R.; Hayes, J.W.; Gohlke, J.R.; Brand, L. Excited-state proton transfer as a biological probe. Determination of rate constants by means of nanosecond fluorometry. Biochemistry 1972, 11, 4779–4786. [Google Scholar] [CrossRef] [PubMed]
  26. Zhang, X.; Guo, L.; Wu, F.-Y.; Jiang, Y.-B. Development of Fluorescent Sensing of Anions under Excited-State Intermolecular Proton Transfer Signaling Mechanism. Org. Lett. 2003, 5, 2667–2670. [Google Scholar] [CrossRef] [PubMed]
  27. Kompa, K.L.; Levine, R.D. A molecular logic gate. Proc. Natl. Acad. Sci. USA 2001, 98, 410–414. [Google Scholar] [CrossRef] [PubMed]
  28. Bojinov, V.; Georgiev, N. Molecular sensors and molecular logic gates (review). J. Univ. Chem. Technol. Metall. 2011, 46, 3–26. [Google Scholar]
  29. Borghetti, J.; Snider, G.S.; Kuekes, P.J.; Yang, J.J.; Stewart, D.R.; Williams, R.S. /‘Memristive/’ switches enable /‘stateful/’ logic operations via material implication. Nature 2010, 464, 873–876. [Google Scholar] [CrossRef] [PubMed]
  30. De Silva, A.P. Molecular Logic Gates. In Supramolecular Chemistry; John Wiley & Sons, Ltd.: Hoboken, NJ, USA, 2012. [Google Scholar]
  31. Landge, S.M.; Aprahamian, I. A pH Activated Configurational Rotary Switch: Controlling the E/Z Isomerization in Hydrazones. J. Am. Chem. Soc. 2009, 131, 18269–18271. [Google Scholar] [CrossRef] [PubMed]
  32. Kumar, M.; Dhir, A.; Bhalla, V. A Molecular Keypad Lock Based on the Thiacalix[4]arene of 1,3-Alternate Conformation. Org. Lett. 2009, 11, 2567–2570. [Google Scholar] [CrossRef] [PubMed]
  33. Rezaeian, K.; Khanmohammadi, H. Molecular logic circuits and a security keypad lock based on a novel colorimetric azo receptor with dual detection ability for copper(II) and fluoride ions. Supramol. Chem. 2016, 28, 256–266. [Google Scholar] [CrossRef]
  34. Ahmad, Z.; Shah, A.; Siddiq, M.; Kraatz, H.-B. Polymeric micelles as drug delivery vehicles. RSC Adv. 2014, 4, 17028–17038. [Google Scholar] [CrossRef]
  35. Petcu, A.R.; Rogozea, E.A.; Lazar, C.A.; Olteanu, N.L.; Meghea, A.; Mihaly, M. Specific interactions within micelle microenvironment in different charged dye/surfactant systems. Arab. J. Chem. 2016, 9, 9–17. [Google Scholar] [CrossRef]
  36. Park, G.J.; Jo, H.Y.; Ryu, K.Y.; Kim, C. A new coumarin-based chromogenic chemosensor for the detection of dual analytes Al3+ and F. RSC Adv. 2014, 4, 63882–63890. [Google Scholar] [CrossRef]
  37. Tang, S.; Meng, Q.; Sun, H.; Su, J.; Yin, Q.; Zhang, Z.; Yu, H.; Chen, L.; Gu, W.; Li, Y. Dual pH-sensitive micelles with charge-switch for controlling cellular uptake and drug release to treat metastatic breast cancer. Biomaterials 2017, 114, 44–53. [Google Scholar] [CrossRef] [PubMed]
  38. Lebrini, M.; Traisnel, M.; Lagrenée, M.; Mernari, B.; Bentiss, F. Inhibitive properties, adsorption and a theoretical study of 3,5-bis(n-pyridyl)-4-amino-1,2,4-triazoles as corrosion inhibitors for mild steel in perchloric acid. Corros. Sci. 2008, 50, 473–479. [Google Scholar] [CrossRef]
  39. Lu, W.; Chen, D.; Jiang, H.; Jiang, L.; Shen, Z. Polymer-based fluoride-selective chemosensor: Synthesis, sensing property, and its use for the design of molecular-scale logic devices. J. Polym. Sci. Part A 2012, 50, 590–598. [Google Scholar] [CrossRef]
  40. Wagner, D.B. The Use of Coumarins as Environmentally-Sensitive Fluorescent Probes of Heterogeneous Inclusion Systems. Molecules 2009, 14, 210–237. [Google Scholar] [CrossRef] [PubMed]
  41. Hua, Y.; Flood, A.H. Click chemistry generates privileged CH hydrogen-bonding triazoles: The latest addition to anion supramolecular chemistry. Chem. Soc. Rev. 2010, 39, 1262–1271. [Google Scholar] [CrossRef] [PubMed]
  42. Lau, Y.H.; Rutledge, P.J.; Watkinson, M.; Todd, M.H. Chemical sensors that incorporate click-derived triazoles. Chem. Soc. Rev. 2011, 40, 2848–2866. [Google Scholar] [CrossRef] [PubMed]
  43. Wang, C.; Wang, D.; Yu, S.; Cornilleau, T.; Ruiz, J.; Salmon, L.; Astruc, D. Design and Applications of an Efficient Amphiphilic “Click” CuI Catalyst in Water. ACS Catal. 2016, 6, 5424–5431. [Google Scholar] [CrossRef]
  44. Watkinson, M. Click Triazoles as Chemosensors. In Click Triazoles; Košmrlj, J., Ed.; Springer: Berlin/Heidelberg, Germany, 2012. [Google Scholar]
  45. Zhang, F.; Moses, J.E. Benzyne Click Chemistry with in Situ Generated Aromatic Azides. Org. Lett. 2009, 11, 1587–1590. [Google Scholar] [CrossRef] [PubMed]
  46. Rostovtsev, V.V.; Green, L.G.; Fokin, V.V.; Sharpless, K.B. A Stepwise Huisgen Cycloaddition Process: Copper(I)-Catalyzed Regioselective “Ligation” of Azides and Terminal Alkynes. Angew. Chem. Int. Ed. 2002, 41, 2596–2599. [Google Scholar] [CrossRef]
  47. Cho, E.J.; Ryu, B.J.; Lee, Y.J.; Nam, K.C. Visible Colorimetric Fluoride Ion Sensors. Org. Lett. 2005, 7, 2607–2609. [Google Scholar] [CrossRef] [PubMed]
  48. Cho, E.J.; Moon, J.W.; Ko, S.W.; Lee, J.Y.; Kim, S.K.; Yoon, J.; Nam, K.C. A New Fluoride Selective Fluorescent as Well as Chromogenic Chemosensor Containing a Naphthalene Urea Derivative. J. Am. Chem. Soc. 2003, 125, 12376–12377. [Google Scholar] [CrossRef] [PubMed]
  49. Ghosh, D.; Rhodes, S.; Hawkins, K.; Winder, D.; Atkinson, A.; Ming, W.; Padgett, C.; Orvis, J.; Aiken, K.; Landge, S. A simple and effective 1,2,3-triazole based “turn-on” fluorescence sensor for the detection of anions. New J. Chem. 2015, 39, 295–303. [Google Scholar] [CrossRef]
  50. Govan, R.D. Approaches Toward Novel 1,2,3-Triazole Sensors for the Detection of Anions and Heavy Metal Cations, Electronic Theses & Dissertations; Georgia Southern University: Statesboro, GA, USA, 2017; Available online: http://digitalcommons.georgiasouthern.edu/etd/1604 (accessed on 15 December 2017).
  51. Boiocchi, M.; Del Boca, L.; Gómez, D.E.; Fabbrizzi, L.; Licchelli, M.; Monzani, E. Nature of Urea−Fluoride Interaction:  Incipient and Definitive Proton Transfer. J. Am. Chem. Soc. 2004, 126, 16507–16514. [Google Scholar] [CrossRef] [PubMed]
  52. Peng, X.; Wu, Y.; Fan, J.; Tian, M.; Han, K. Colorimetric and Ratiometric Fluorescence Sensing of Fluoride:  Tuning Selectivity in Proton Transfer. J. Org. Chem. 2005, 70, 10524–10531. [Google Scholar] [CrossRef] [PubMed]
  53. Juwarker, H.; Lenhardt, J.M.; Castillo, J.C.; Zhao, E.; Krishnamurthy, S.; Jamiolkowski, R.M.; Kim, K.-H.; Craig, S.L. Anion Binding of Short, Flexible Aryl Triazole Oligomers. J. Org. Chem. 2009, 74, 8924–8934. [Google Scholar] [CrossRef] [PubMed]
  54. Job, P. Spectrochemical Methods of Analysis; Wiley Interscience: New York, NY, USA, 1971. [Google Scholar]
  55. Choi, K.; Hamilton, A.D. Selective Anion Binding by a Macrocycle with Convergent Hydrogen Bonding Functionality. J. Am. Chem. Soc. 2001, 123, 2456–2457. [Google Scholar] [CrossRef] [PubMed]
  56. Ghosh, D.; Rhodes, S.; Winder, D.; Atkinson, A.; Gibson, J.; Ming, W.; Padgett, C.; Landge, S.; Aiken, K. Spectroscopic investigation of bis-appended 1,2,3-triazole probe for the detection of Cu(II) ion. J. Mol. Struct. 2017, 1134, 638–648. [Google Scholar] [CrossRef]
  57. Charisiadis, P.; Exarchou, V.; Troganis, A.N.; Gerothanassis, I.P. Exploring the “forgotten” -OH NMR spectral region in natural products. Chem. Commun. 2010, 46, 3589–3591. [Google Scholar] [CrossRef] [PubMed]
  58. Siskos, M.G.; Kontogianni, V.G.; Tsiafoulis, C.G.; Tzakos, A.G.; Gerothanassis, I.P. Investigation of solute-solvent interactions in phenol compounds: Accurate ab initio calculations of solvent effects on 1H NMR chemical shifts. Org. Biomol. Chem. 2013, 11, 7400–7411. [Google Scholar] [CrossRef] [PubMed]
  59. Jain, A.; Gupta, R.; Agarwal, M. Benzimidazole scaffold as dipodal molecular cleft for swift and efficient naked eye fluoride ion recognition via preorganized N-H and aromatic C-H in aqueous media. Indian J. Chem. 2017, 56, 513–518. [Google Scholar]
  60. Li, J.; Xu, X.; Shao, X.; Li, Z. A novel colorimetric fluoride sensor based on a semi-rigid chromophore controlled by hydrogen bonding. Luminescence 2015, 30, 1285–1289. [Google Scholar] [CrossRef] [PubMed]
  61. Jones, R.N. The Ultraviolet Absorption Spectra of Aromatic Hydrocarbons. Chem. Rev. 1943, 32, 1–46. [Google Scholar] [CrossRef]
  62. Mondal, K.; Bhattacharyya, S.; Sharma, A. Photocatalytic Degradation of Naphthalene by Electrospun Mesoporous Carbon-Doped Anatase TiO2 Nanofiber Mats. Ind. Eng. Chem. Res. 2014, 53, 18900–18909. [Google Scholar] [CrossRef]
  63. Silva, A.F.; Fiedler, H.D.; Nome, F. Ionic Quenching of Naphthalene Fluorescence in Sodium Dodecyl Sulfate Micelles. J. Phys. Chem. A 2011, 115, 2509–2514. [Google Scholar] [CrossRef] [PubMed]
  64. Maeda, H.; Maeda, T.; Mizuno, K. Absorption and Fluorescence Spectroscopic Properties of 1- and 1,4-Silyl-Substituted Naphthalene Derivatives. Molecules 2012, 17, 5108–5125. [Google Scholar] [CrossRef] [PubMed]
  65. Zhang, Y.; Ye, X.; Petersen, J.L.; Li, M.; Shi, X. Synthesis and Characterization of Bis-N-2-Aryl Triazole as a Fluorophore. J. Org. Chem. 2015, 80, 3664–3669. [Google Scholar] [CrossRef] [PubMed]
  66. Rasouli, M.; Tavassoli, S.H.; Mousavi, S.J.; Darbani, S.M.R. Measuring of naphthalene fluorescence emission in the water with nanosecond time delay laser induced fluorescence spectroscopy method. Opt. Int. J. Light Electron Opt. 2016, 127, 6218–6223. [Google Scholar] [CrossRef]
  67. Lakowicz, J.R. Principles of Fluorescence Spectroscopy; Springer: New York, NY, USA, 2007. [Google Scholar]
  68. Harris, C.M.; Selinger, B.K. Acid-base properties of 1-naphthol. Proton-induced fluorescence quenching. J. Phys. Chem. 1980, 84, 1366–1371. [Google Scholar] [CrossRef]
  69. Boyer, R.; Deckey, G.; Marzzacco, C.; Mulvaney, M.; Schwab, C.; Halpern, A.M. The photophysical properties of 2-naphthol: A physical chemistry experiment. J. Chem. Ed. 1985, 62, 630. [Google Scholar] [CrossRef]
  70. Laws, W.R.; Brand, L. Analysis of two-state excited-state reactions. The fluorescence decay of 2-naphthol. J. Phys. Chem. 1979, 83, 795–802. [Google Scholar] [CrossRef]
  71. Marciniak, B.; Kozubek, H.; Paszyc, S. Estimation of pKa* in the first excited singlet state. A physical chemistry experiment that explores acid-base properties in the excited state. J. Chem. Ed. 1992, 69, 247. [Google Scholar] [CrossRef]
  72. Benesi, H.A.; Hildebrand, J.H. A Spectrophotometric Investigation of the Interaction of Iodine with Aromatic Hydrocarbons. J. Am. Chem. Soc. 1949, 71, 2703–2707. [Google Scholar] [CrossRef]
  73. Bhosale, S.V.; Bhosale, S.V.; Kalyankar, M.B.; Langford, S.J. A Core-Substituted Naphthalene Diimide Fluoride Sensor. Org. Lett. 2009, 11, 5418–5421. [Google Scholar] [CrossRef] [PubMed]
  74. He, X.; Hu, S.; Liu, K.; Guo, Y.; Xu, J.; Shao, S. Oxidized Bis(indolyl)methane:  A Simple and Efficient Chromogenic-Sensing Molecule Based on the Proton Transfer Signaling Mode. Org. Lett. 2006, 8, 333–336. [Google Scholar] [CrossRef] [PubMed]
  75. Pirali, T.; Gatti, S.; DiBrisco, R.; Tacchi, S.; Zaninetti, R.; Brunelli, E.; Massarotti, A.; Sorba, G.; Canonico, P.L.; Moro, L.; et al. Estrogenic Analogues Synthesized by Click Chemistry. ChemMedChem 2007, 2, 437–440. [Google Scholar] [CrossRef] [PubMed]
Scheme 1. Synthesis of 2-(4-(naphthalen-2-yl)-1H-1,2,3-triazol-1-yl)phenol (NpTP).
Magnetochemistry 04 00015 sch001
Scheme 2. The proposed binding mode of NpTP and fluoride anion.
Magnetochemistry 04 00015 sch002
Figure 1. 1H-NMR spectra of NpTP molecule in various deuterated solvents showing the expansion of the aromatic region from δ 6.80–9.2 ppm of NpTP.
Magnetochemistry 04 00015 g001
Figure 2. Full 1H-NMR spectrum (400 MHz, (CD3)2S=O, RT) of NpTP; selected few peaks are assigned (for the expanded version of the aromatic region, see Figure 1).
Magnetochemistry 04 00015 g002
Figure 3. The 2D-COSY spectrum (400 MHz, (CD3)2S=O, RT) of NpTP molecule, the correlation with all aromatic protons is seen.
Magnetochemistry 04 00015 g003
Figure 4. The 13C-NMR spectrum (100 MHz, (CD3)2S=O, RT) showing the expansion from δ 110–162 ppm of NpTP. (For the full version, see Figure S2.)
Magnetochemistry 04 00015 g004
Figure 5. The 2D HSQC spectrum of NpTP, showing single bond carbon hydrogen correlation (all the C–H bonds are marked).
Magnetochemistry 04 00015 g005
Figure 6. Changes in partial 1H-NMR (400 MHz) spectra of NpTP (6.2 × 10⁻² M) in CD3CN upon increasing equivalents of TBAF (0 to 4.0 eq.).
Magnetochemistry 04 00015 g006
Figure 7. Job’s plot through NMR titration of NpTP upon the addition of TBAF in CD3CN.
Magnetochemistry 04 00015 g007
Figure 8. Absorption spectra and bars (in the inset) representing the spectral response of NpTP (~1 × 10⁻⁵ M) upon the addition of 4 × 10⁻⁴ M of various anions in acetonitrile. The bars in the inset are plotted by monitoring the absorbance of NpTP at 355 nm in presence of anions.
Magnetochemistry 04 00015 g008
Figure 9. Fluorescence spectra of NpTP (~1 × 10⁻⁶ M) upon the addition of 4 × 10⁻⁴ M of various anions in acetonitrile. λexc = 300 nm.
Magnetochemistry 04 00015 g009
Figure 10. Fluorescence spectra of NpTP (~1 × 10⁻⁶ M) upon the addition of TBAF in acetonitrile. Concentrations of TBAF are provided on the legends. λexc = 300 nm.
Magnetochemistry 04 00015 g010
Figure 11. Emission (red) and fluorescence excitation (black) spectra of NpTP (~1 × 10⁻⁶ M) in acetonitrile for (a) λexc is 350 nm to obtain emission spectrum and λem is monitored at 530 nm for excitation scan; (b) λexc is 300 nm to obtain emission spectrum and λem is monitored at 410 nm for excitation scan.
Magnetochemistry 04 00015 g011
Figure 12. Color changes of NpTP under a UV lamp of long wavelength (365 nm) upon addition of ~2 × 10⁻² M of anions to ~1 × 10⁻³ M sensor in acetonitrile.
Magnetochemistry 04 00015 g012
Figure 13. A view of the molecular structure of NpTP, showing the atom labeling. Displacement ellipsoids are drawn at the 50% probability level.
Magnetochemistry 04 00015 g013
Table 1. Experimental details for NpTP molecule for single X-ray crystal studies.
Crystal Data for NpTP
Chemical formulaC18H13N3O
Mr287.31
Crystal system, space groupTetragonal, P43
Temperature (K)173
a, b, c (Å)7.3806 (16), 7.3806 (16), 50.665 (16)
V3)2759.9(13)
Z8
Radiation typeMo Kα
µ (mm−1)0.09
Crystal size (mm)0.07 × 0.07 × 0.07
Data collection for NpTP
DiffractometerBruker D8 Venture Photon 100 diffractometer
Absorption correctionMulti-scan
SADABS, Bruker
Tmin, Tmax0.883, 1.00
No. of measured, independent and observed [F2 > 2.0σ(F2)] reflections17713, 5409, 4263
Rint0.045
Refinement
R[F2 > 2σ(F2)], wR(F2), S0.049, 0.096, 1.02
No. of reflections5409
No. of parameters398
H-atom treatmentH-atom parameters constrained
Δρmax, Δρmin (e Å−3)0.16, −0.20
Special treatmentRefined as a 2-component inversion twin
Computer programs: Data collection: Bruker APEX3; cell refinement: Bruker SAINT; data reduction: Bruker SAINT; program(s) used to solve structure: SHELXT-2014 (Sheldrick 2014); program(s) used to refine structure: SHELXL2014 (Sheldrick 2014).

