Abstract
The alloy Pr2Fe16.75Ni0.25 has been examined to investigate its structural properties, critical behavior, and magnetocaloric effects. Rietveld’s refinement of X-ray diffraction patterns has revealed a rhombohedral structure with an space group. Pr2Fe16.9Ni0.25 also demonstrates a direct magnetocaloric effect near room temperature, accompanied by a moderate magnetic entropy change ( = 5.5 J kg−1 K−1 at T) and a broad working temperature range. Furthermore, the Relative Cooling Power (RCP) is approximately 89% of the widely recognized gadolinium (Gd) for T. This compound exhibits a commendable magnetocaloric response, on par with or even surpassing that of numerous other intermetallic alloys. Critical behavior was analyzed using thermo-magnetic measurements, employing methods such as the modified Arrott plot, critical isotherm analysis, and Kouvel-Fisher techniques. The obtained critical exponents (, , and ) exhibit similarities to those of the 3D-Ising model, characterized explicitly by intermediate range interactions.
1. Introduction
Magnetic refrigeration, which has been hailed as a promising and environmentally friendly technology, offers an attractive opportunity to achieve a superior level of energy conversion efficiency [1]. At the heart of this innovative approach is the magnetocaloric effect (MCE), defined as a reversible thermal change induced by alterations in an externally applied magnetic field. The discovery of a significant MCE in the alloy Gd5Si2Ge2 near room temperature stimulated an intensification of research in this field, fuelled by the desire to replace traditional gas compression and expansion techniques with magnetic refrigeration [2,3,4].
As a consequence, there is a distinct preference for the exploration of novel magnetic materials boasting robust magnetic entropy properties, particularly those exhibiting significant magnetization fluctuations near the temperature associated with the magnetic transition. This encompasses materials founded on La-Fe-Si [5], Mn-As [6], Fe-Rh [7], and RE-Mn-O manganites (where RE represents a rare earth element) [8,9,10,11]. Over the past two decades, extensive investigation has been dedicated to refining these compounds, with the overarching goal of optimizing both the magnitude and range of temperatures over which the MCE operates.
Incorporating these materials into magnetic refrigeration systems necessitates a careful consideration of the Relative Cooling Power (RCP), a pivotal parameter that quantifies the capacity of the magnetic refrigerant to transport heat between hot and cold reservoirs in an ideal thermodynamic cycle [12]. Materials exhibiting second-order phase transitions typically display a lower peak of isothermal magnetic entropy change compared to those undergoing first-order magnetic transitions [13,14], often offer higher RCP values. This is attributed to their broader operational temperature range and a lack of magnetic field hysteresis.
Noteworthy among the array of rare-earth iron-rich intermetallic compounds are materials such as (Ce, R)2Fe17 (where R can be Pr, Dy, Y) [15], Pr2Fe17−xAlx [16], Pr2Fe17−xMnx [17], Pr2Fe17−xTix [18], Tb2Fe17 [19], Nd2Fe17−xCox [20], Pr1−xNdxFe17 [21], Nd2Fe17−xSix [22], Sm2Fe17−xNix [23], and Pr1.67Sm0.36Fe17 [24], which have demonstrated RCP values comparable to those of magnetic materials based on Gd. Additionally, binary alloys based on Pr-Fe with a crystal structure similar to Th2Zn17 are particularly attractive due to the reduced costs stemming from their main constituent (Fe). Such alloys require a substantial magnetic moment below their Curie temperature () to generate a notable entropy variation at the magnetic transition, also exhibit a magnetic ordering temperature in close proximity to 285 K. Their production processes are straightforward, and they are devoid of detrimental hysteresis effects [25]. Furthermore, the Curie temperature () in these 2:17-type intermetallics can be precisely adjusted by partially replacing Fe atoms with other non-magnetic substituents [15,16,17,22,23,24,26].
In this work, we investigate the influence of partially substituting Fe with Ni in the Pr2Fe17 compound, focusing on its implications for the magnetocaloric effect (MCE), as well as structural and magnetic properties. Nickel was selected as a substituent for several reasons. As a ferromagnetic element, like Fe and Co, Ni possesses the ability to maintain the magnetic character of the compound, albeit with a lower magnetic moment than Fe. Importantly, Ni preferentially occupies the 6c crystallographic sites, where Fe–Fe interactions are antiferromagnetic in the parent compound. By replacing Fe in these sites, Ni reduces the antiferromagnetic couplings, leading to an overall enhancement of the magnetization—an essential factor for optimizing the magnetocaloric effect. Additionally, Ni has an atomic radius similar to Fe, preserving the structural stability while subtly modifying the 6c–6c exchange interactions. This controlled tuning of exchange pathways enables a precise adjustment of the Curie temperature, driving it closer to room temperature for practical refrigeration applications. Our material exhibits a promising MCE response, combining a moderate magnetic entropy change with a broad operating temperature span. A significant upward shift in the Curie temperature () toward ambient conditions is also observed. Furthermore, we perform a detailed evaluation of the critical exponents near the ferromagnetic–paramagnetic phase transition using several analytical approaches. The extracted critical parameters are found to be consistent with the 3D Ising model governed by an intermediate magnetic interaction, which appears to typify the behavior of this system.
2. Experimental Techniques
The polycrystalline compound Pr2Fe16.75Ni0.25 was synthesized by arc melting high-purity precursor elements: Pr (99.98%), Fe (99.99%), and Ni (99.99%) in an argon-controlled atmosphere. To ensure compositional homogeneity, the sample was remelted at least five times, with each remelting followed by flipping the ingot. An excess of 20 wt.% of Pr was introduced to counterbalance the losses due to evaporation during the melting process. The resulting ingot was encapsulated in tantalum foil, then sealed under high vacuum ( bar) within a quartz tube and subsequently annealed at 950 °C for 7 days to enhance structural homogeneity. Post-annealing, the ingot was rapidly quenched in water to preserve the high-temperature phase. The resulting material was manually ground into fine powder and sieved through a metallic mesh for further characterizations.
Surface morphology and chemical composition analyses of the prepared samples were estimated using scanning electron microscope (SEM) Hitachi S3500 (Tokyo, Japan), integrated with an energy-dispersive X-ray spectroscopy (EDS) microanalyzer from Kevex operating at 132 keV. Phase identification and structural analysis were performed at room temperature by X-ray diffraction (XRD) using a Bruker D8 diffractometer (Bruker D8 DAVINCI, Bruker AXS GmbH, Karlsruhe, Germany) equipped with Cu K radiation ( Å). The diffraction patterns were recorded over the range from 10° to 120°, using a step size of 0.02 and a counting time of 6 s per step. The collected data were refined using the Rietveld method [27], implemented in the FullProf suite [28].
Magnetic characterizations at low temperatures were conducted using a Quantum Design Physical Property Measurement System (PPMS-Model 6000, Quantum Design Inc., San Diego, CA, USA), with the external magnetic field varied between 0 and 5 T. The temperature-dependent magnetization, , was recorded from 100 K to 380 K under a magnetic field of T to determine the Curie temperature . In addition, isothermal magnetization measurements were acquired over the same field range to explore the magnetocaloric properties and critical behavior. The magnetic entropy change was evaluated via numerical integration of the isothermal curves.
In order to correct for demagnetization effects, the internal magnetic field H was evaluated using the relation , where is the externally applied field, M is the measured magnetization, and N represents the demagnetization factor. This factor was extracted from low-field M versus curves in the ferromagnetic regime, following the procedure described in Refs. [29,30]. The resulting internal field values were subsequently utilized in the scaling analysis.
3. Results and Discussion
3.1. SEM-EDX Analysis
Following the synthesis process, it is essential to verify the chemical homogeneity of the compound and to assess whether the small amount of nickel has been successfully incorporated into the entire structure. To this end, the elemental composition of the Pr2Fe16.75Ni0.25 sample was investigated using energy-dispersive X-ray spectroscopy (EDX) coupled with scanning electron microscopy (SEM). The resulting SEM micrograph and EDX spectrum are presented in Figure 1.
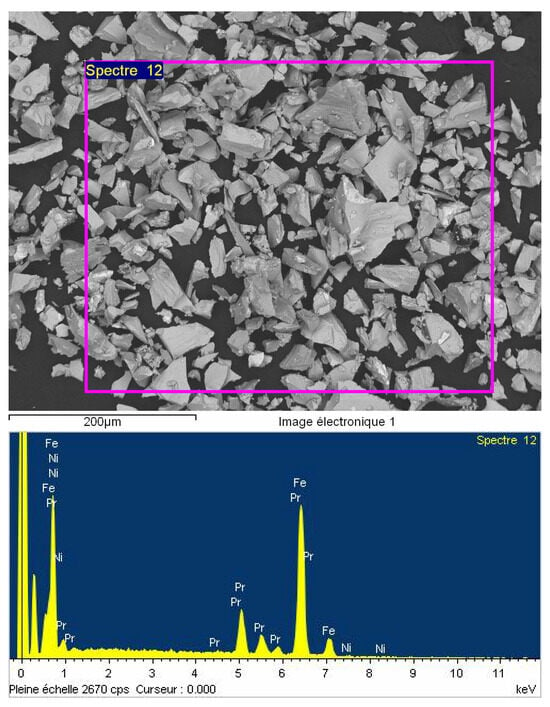
Figure 1.
SEM image and EDX spectrum of Pr2Fe16.75Ni0.25 alloy.
The EDX analysis revealed distinct signals corresponding to the presence of praseodymium (Pr), iron (Fe), and nickel (Ni), with respective atomic percentages of 13.63% for Pr, 85.53% for Fe, and 0.84% for Ni, as summarized in Table 1. These values are in reasonable agreement with the nominal stoichiometry, and they suggest an approximate empirical formula of Pr2.6Fe16.25Ni0.16. The observed excess of praseodymium is attributed to the Pr layer intentionally added to the ingot surface during polishing to eliminate any oxidized outer layer prior to the X-Ray Diffraction (XRD) measurements.

Table 1.
EDX analysis (atomic %) of Pr2Fe16.75Ni0.25.
3.2. Crystal Structure and Rietveld Refinement
The binary Pr-Fe alloy with a 2:17 stoichiometry adopts a rhombohedral crystal structure belonging to the space group and conforms to the Th2Zn17 structural prototype. This framework originates from the CaCu5-type structure through a specific atomic substitution, where each Pr atom is effectively replaced by a Fe–Fe dumbbell situated at the site. In this configuration, the Wyckoff position is exclusively occupied by Pr atoms, while the Fe atoms are distributed across four inequivalent crystallographic sites: , , , and [31,32]. A schematic depiction of the rhombohedral structure of Pr2Fe16.75Ni0.25 is presented in Figure 2.
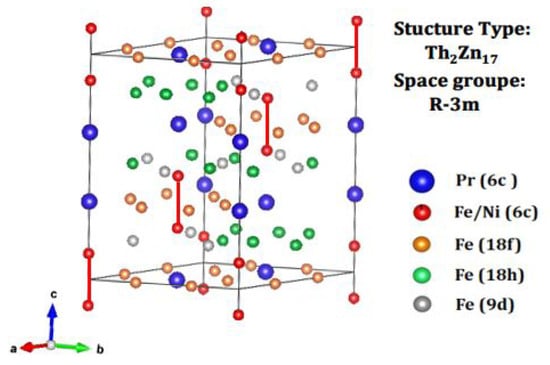
Figure 2.
The rhombohedral crystal structure of Pr2Fe16.75Ni0.25.
The X-ray diffraction (XRD) pattern recorded at ambient temperature, as displayed in Figure 3, confirms that the Pr2Fe16.75Ni0.25 compound crystallizes in a single-phase structure without any traceable secondary phases such as Fe-Ni, typically formed due to compositional inhomogeneity. This phase purity is attributed to the intentional addition of excess praseodymium, which compensates for its volatility during the synthesis process.
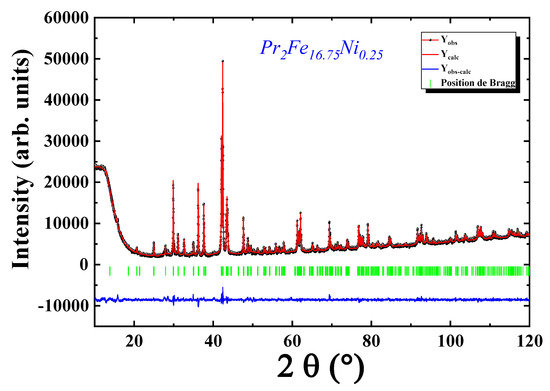
Figure 3.
Refined X-ray diffraction patterns of Pr2Fe16.75Ni0.25 compound.
The diffraction peaks were unambiguously indexed within a rhombohedral crystal system, corresponding to the Th2Zn17-type structure, and associated with the space group. This structure is characteristic of the 2:17-type intermetallics frequently reported in rare-earth-transition-metal systems.
In literature, it has been established that in R2Fe17−xMx compounds (where R = Nd, Sm and M = Cr, Zr, Mo, Ti, V), the substituent atoms tend to preferentially occupy the 6c crystallographic site within the structure [33,34,35,36]. Supporting this, Guetari et al. [16] have shown through structural refinements that in Pr2Fe17−xAlx alloys, aluminum atoms favor the 6c site, while systematically avoiding the , , and Wyckoff positions.
To investigate the site preference of nickel atoms in our Pr2Fe16.75Ni0.25 sample, we performed a detailed Rietveld refinement analysis. This involved placing Ni atoms alternately at each of the four non-equivalent positions-, , , and -followed by a comparison of the corresponding reliability factors (). The lowest value was obtained when Ni was located at the 6c site, suggesting a preferential occupation of this position by Ni atoms.
Nevertheless, it should be noted that the close atomic numbers of Fe (Z = 26) and Ni (Z = 28) result in minimal contrast in X-ray scattering, which limits the sensitivity of the Rietveld refinement in definitively identifying Ni site occupancy. This limitation implies that a more advanced technique, such as resonant X-ray diffraction using synchrotron radiation, would be required to provide conclusive information. For instance, such an approach was successfully employed by T. Bartoli et al. [37] in the Sm2Fe17−xCox system to accurately determine the preferential substitution sites of cobalt atoms.
The refined unit cell parameters, atomic positions, reliability factor , and goodness-of-fit indicator obtained from the best Rietveld refinement of the Pr2Fe16.75Ni0.25 compound are summarized in Table 2. The extracted lattice parameters are Å, Å, and the unit cell volume is calculated to be 797.06(2) Å3. These values are slightly larger than those reported for the parent Pr2Fe17 alloy [16], likely due to the incorporation of nickel. Such structural variations can influence the magnetic behavior of the material. A detailed analysis of its intrinsic magnetic properties will help elucidate the extent to which these changes in lattice dimensions affect the overall magnetic response of the system.

Table 2.
Structural parameters and agreement factors from Rietveld refinement for Pr2Fe16.75Ni0.25 compound.
3.3. Intrinsic Magnetic Properties
Figure 4 shows the temperature-dependent magnetization curve (left axis) recorded under an applied magnetic field of 0.05 T for the bulk Pr2Fe16.75Ni0.25 sample. A clear ferromagnetic–paramagnetic (FM–PM) phase transition is observed at the Curie temperature K, as determined by the minimum in the first derivative of magnetization with respect to temperature (), illustrated in the inset of Figure 4.
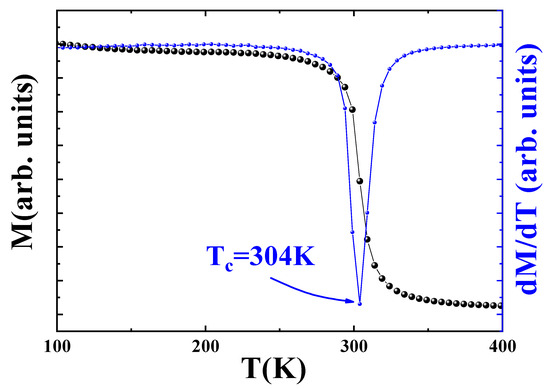
Figure 4.
Variation of magnetization M as a function of temperature for Pr2Fe16.75Ni0.25 at = 0.05 T, the blue plot shows the curve of dM/dT as a function of temperature.
In rare-earth–transition-metal intermetallics, the Curie temperature () is strongly influenced by the nature and strength of exchange interactions. Pioneering work by Givord et al. [38] on R2Fe17, later corroborated by Morrish et al. [39] in the case of Sm2Fe17, demonstrated a direct correlation between the magnitude of exchange integrals and the interatomic Fe–Fe separations. Specifically, an increase in the Fe–Fe distance tends to enhance the exchange integrals, thereby raising , whereas a reduction in spacing leads to weaker, and even negative, interactions that lower . These findings suggest that antiferromagnetic contributions stemming from short Fe–Fe distances are the principal cause of the low Curie temperatures typically observed in R2M17 compounds. For instance, Pr2Fe17 exhibits a relatively low of 285 K [16], which is attributed to the short Fe–Fe distances associated with specific crystallographic pairs: – dumbbells, –, –, and –, with corresponding values of 2.31 Å, 2.43 Å, 2.44 Å, and 2.43 Å, respectively. These interatomic distances fall below the critical threshold of 2.45 Å established by Morrish et al. [39], below which antiferromagnetic coupling predominates. Among these, the – dumbbell pairs exhibit the largest deviation from the threshold, making them particularly influential in determining the strength and sign of the Fe–Fe exchange interaction .
Upon substitution of Fe with Ni, as shown in Table 3, these critical distances increase, leading to an overall expansion of the unit cell volume. This structural change promotes ferromagnetic exchange coupling, thereby contributing to the observed increase in Curie temperature to approximately 305 K. This enhancement in can also be linked to the electronic effect of Ni incorporation, which partially fills the Fe band and strengthens the positive − exchange interactions, in agreement with the findings reported by L. Bessais et al. [40].

Table 3.
Interatomic distances () and number of iron near neighbors for the rhombohedral structure type for Pr2Fe17−xNix.
Isothermal magnetization curves were recorded in the vicinity of the Curie temperature under applied magnetic fields ranging from 0 to 5 T, as presented in Figure 5. Below , a pronounced and rapid increase in magnetization is observed even under relatively low magnetic fields, reflecting the ferromagnetic nature of the compound in this temperature regime. In contrast, above , the magnetization increases gradually with the applied field, consistent with a paramagnetic response.
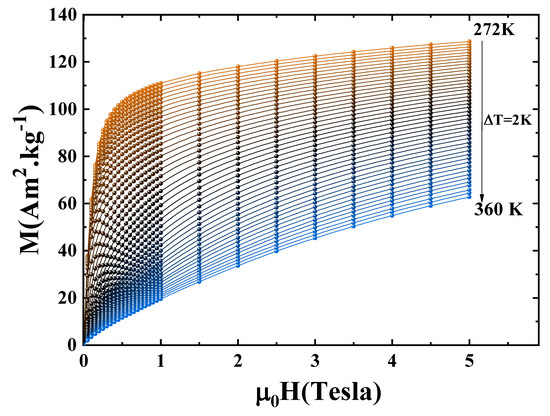
Figure 5.
Variation of magnetization M as a function of for the compound Pr2Fe16.75Ni0.25.
In order to ensure the reliability of the subsequent magnetic analyses, a correction of the magnetic isotherms was performed by accounting for the demagnetizing field. This step is crucial, as the internal magnetic field experienced by the sample can differ significantly from the applied field due to shape-dependent demagnetizing effects. To estimate the demagnetizing factor, the tangent method was applied in the low-field region of the magnetization curves, where the initial linear slope reflects the combined influence of the intrinsic susceptibility and the demagnetizing field. This approach is illustrated in Figure 6, which shows the linear fit used to extract the slope in the low-field regime. Neglecting this correction could lead to misinterpretation of critical behavior and magnetocaloric properties. By applying this correction, we aimed to eliminate all extrinsic contributions and isolate the true magnetic response of the material.
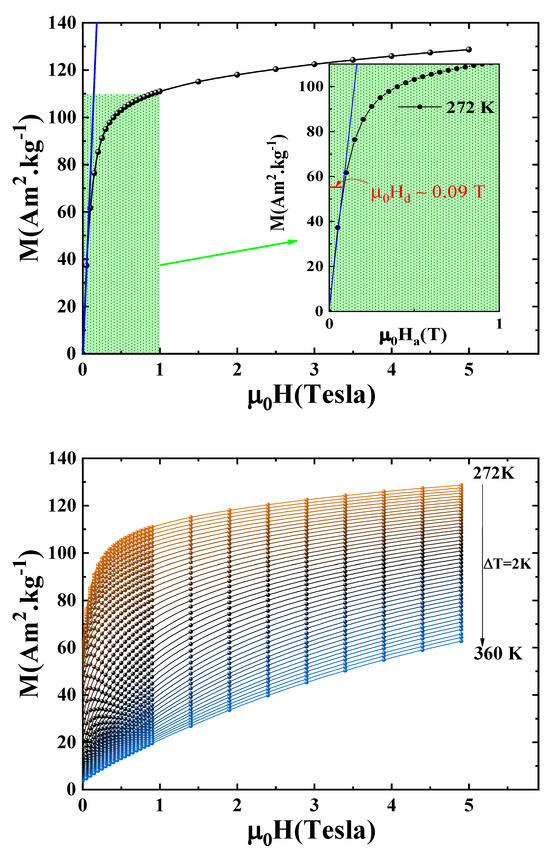
Figure 6.
Estimation and correction of the demagnetizing field: (top) determination of the demagnetizing factor N using the tangent method in the low-field region; (bottom) corrected magnetic isotherms as a function of the internal magnetic field .
3.4. Arrot Plots and Critical Phenomena
The nature of the magnetic phase transition can be assessed using Banerjee’s criterion, which relies on the analysis of Arrott plots, where is plotted as a function of [42]. A positive slope in these plots near the Curie temperature is indicative of a second-order transition, while a negative slope suggests a first-order transition. For the Pr2Fe16.75Ni0.25 alloy, the Arrott plots displayed in Figure 7 reveal that all isotherms in the vicinity of exhibit a positive slope, confirming that the magnetic transition is of second order.
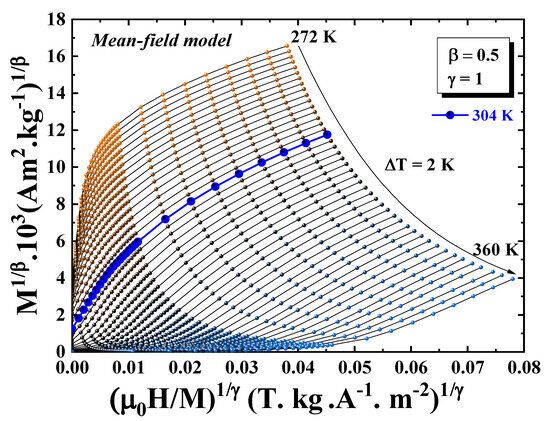
Figure 7.
Arrott plots ( vs. ) for Pr2Fe16.75Ni0.25 compound measured at different temperatures.
A more detailed analysis of the magnetic phase transition can be verified by examining the critical properties.
As illustrated in Figure 7, the isothermal curves display a non-linear and concave profile, even under high magnetic fields. This deviation from linearity indicates that the mean-field approximation is not valid for this system, and that short-range magnetic interactions govern the phase transition. Such behavior is characteristic of critical phenomena associated with isotropic three-dimensional ferromagnetic systems.
This deviation from ideal mean-field behavior justifies a deeper analysis of the critical phenomena near the Curie point. In this regard, the critical behavior can be described by a set of interrelated critical exponents: , which characterizes the spontaneous magnetization below ; , associated with the divergence of the initial magnetic susceptibility above ; and , which describes the magnetic field dependence of the magnetization at . The set of critical exponents characterizing the magnetic phase transition can be extracted from magnetization data by employing the following theoretical relationships [43]:
- For temperatures below the Curie point (), the spontaneous magnetization , defined as , follows a power-law behavior governed by the exponent :
- Above , the inverse of the initial magnetic susceptibility varies with temperature according to the exponent :
- At the critical temperature (), the relationship between magnetization M and applied field follows a power law defined by the critical exponent :
- The scaling hypothesis further provides a generalized magnetic equation of state relating M, , and as:where and represent regular analytic functions for and , respectively.
Here, is the reduced temperature, and , , and D are material-specific critical amplitudes.
To identify the most appropriate model describing the critical behavior, we constructed a Modified Arrott Plot (MAP) based on the Arrott–Noakes equation of state, expressed as [44]:
where a and b are constants.
Using the theoretical values of critical exponents from the three-dimensional Heisenberg, Ising, XY models, and the mean-field tricritical model, the isotherms are linear and parallel for sufficiently high fields (1–5 T) (Figure 8).
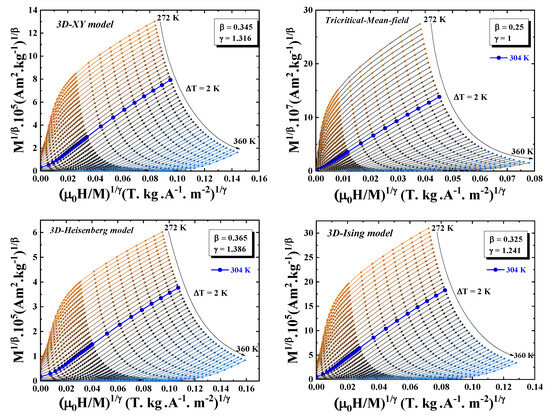
Figure 8.
Modified Arrott plots: (3D-Heisenberg model, 3D-Ising model, 3D-XY model, and mean-field tricritical model) for the Pr2Fe16.75Ni0.25 compound.
In order to evaluate which theoretical model most accurately captures the magnetic phase transition behavior of the sample, normalized slope (NS) values were calculated and compared to the ideal reference value of unity [45]. The normalized slope is defined as:
where denotes the slope extracted from the Modified Arrott Plot (MAP) at a given temperature T, and corresponds to the slope evaluated precisely at the Curie temperature .
Figure 9 presents the variation of the normalized slope () as a function of temperature for three theoretical models. The analysis clearly indicates that the 3D Ising model provides the best fit to the experimental data, as its values remain closest to unity across the temperature range investigated.
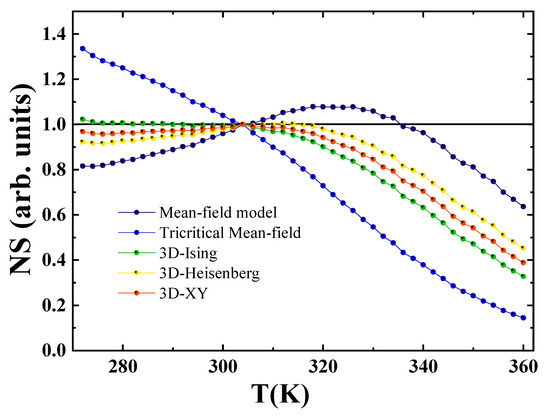
Figure 9.
Temperature dependence of the normalized slope, defined as , for the Pr2Fe16.75Ni0.25 compound.
From the Modified Arrott Plot (MAP), linear extrapolation of the high-field region of each isotherm allows for the determination of the spontaneous magnetization and the inverse initial susceptibility . These quantities correspond to the intercepts on the and axes, respectively. The resulting temperature-dependent behaviors of and are displayed in Figure 10.
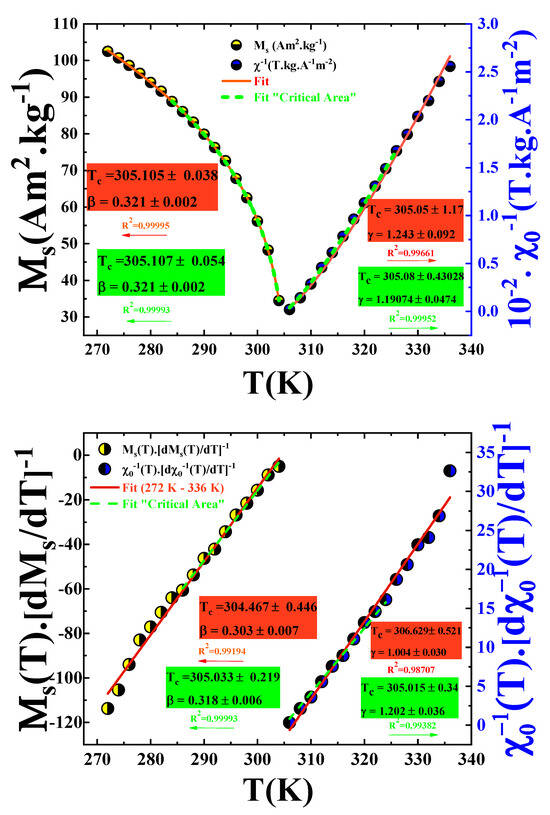
Figure 10.
Temperature dependence of spontaneous magnetization (left axis) and inverse initial susceptibility (right axis)/ Kouvel-Fisher plots for the spontaneous magnetization and the inverse initial susceptibility .
By fitting the and curves over the full temperature range (from 272 K to 360 K) using Equations (1) and (2), respectively, we obtained the critical exponents with K and with K.
To minimize the fitting error and to better approximate the critical exponents of our alloy, the fit must be restricted to the critical region, more precisely within a few kelvins around the magnetic phase transition. Accordingly, the slightly different values obtained are: with K and with K.
The Curie temperature K determined from the Modified Arrott Plot (MAP) analysis is consistent with the value previously extracted from the inflection point of the curve.
To refine the determination of the critical exponents , , and , the Kouvel–Fisher (KF) method was employed. This approach involves constructing two functions based on the following expressions [46]:
According to this method, the quantities and should vary linearly with temperature. The slopes of these lines correspond to and , respectively.
Linear fits of the KF plots presented in Figure 10 yield the following parameters: with K, and with K. These values are in excellent agreement with those previously obtained from the MAP analysis.
The critical exponents derived from both methods, along with theoretical predictions from standard universality classes, are summarized in Table 4. The critical exponents determined for the Pr2Fe17-based compounds are in good agreement with those predicted by the three-dimensional (3D) Ising model, with the exception of Pr2Fe16Al [47]. This deviation may be attributed to the relatively higher substitution level of Fe by Al in this compound, compared to the other studied systems. Since aluminum is a non-magnetic element with a larger atomic radius than iron, its presence may induce significant local distortions and weaken magnetic exchange interactions, thus affecting the critical behavior.

Table 4.
Comparison of the critical exponents of the Pr2Fe17−xNix series ( and ) with various theoretical models.
The close agreement between the results of the MAP and KF approaches reinforces the reliability of the extracted critical parameters. To further validate the consistency of the and values, a scaling analysis based on the magnetic equation of state will be carried out in the subsequent section.
To accurately determine the value of the exponent from Equation (5), we plotted, on Figure 11, in a log-log scale, the variation of the critical magnetic isotherm at K as well as two other isotherms, one below and one above , as a function of the magnetic field for our compound to assess the accuracy of the value of closest to 3D-Ising. The result clearly demonstrates that at a temperature equal to that determined by both the and methods ( K), we obtained . Even a deviation of just 1 K leads to a remarkable change in the value of , underscoring the validity and precision of our work.
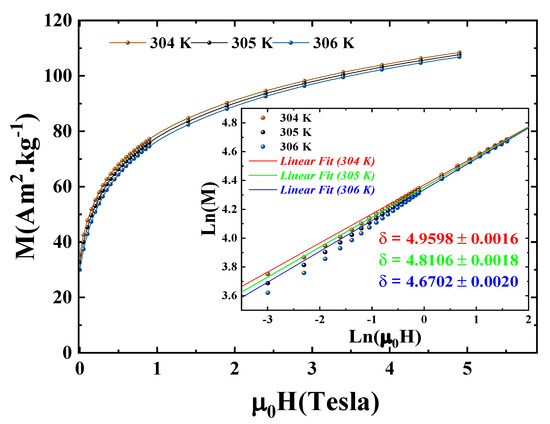
Figure 11.
Critical isotherm (M vs. ) for Pr2Fe16.75Ni0.25 sample. The inset exhibits the same curve as an ln-ln scale.
The linear fitting of these isotherms in the high field region yields values comparable to those theoretically obtained by the Widom scaling relation:
A final validation of the critical exponents derived in this study can be achieved by verifying whether the magnetic equation of state (Equation (4)) is satisfied using the extracted values of and . Employing the parameters obtained from the MAP analysis, a scaling plot was constructed by graphing the rescaled magnetization against the rescaled field . As shown in Figure 12, the data collapse onto two distinct universal curves corresponding to and , respectively. This successful data collapse provides compelling evidence supporting the reliability and consistency of the critical behavior analysis conducted in this work.
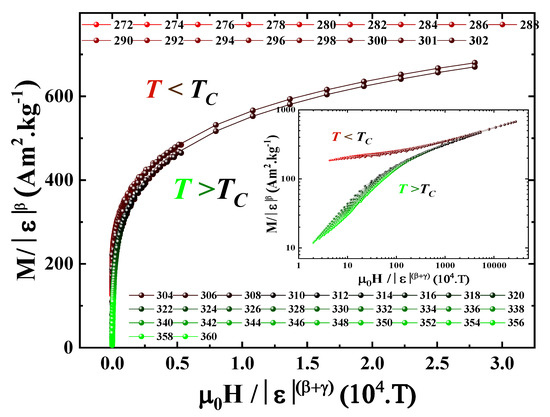
Figure 12.
Scaling plot of versus for the Pr2Fe16.75Ni0.25 compound, showing distinct branches below and above the Curie temperature . The inset displays the same data on a log–log scale to highlight the power-law behavior.
In addition to identifying the critical exponents, it is essential to determine both the nature and spatial range of the magnetic interactions in the studied material. In the case of a homogeneous magnetic system, the universality class governing the phase transition is strongly influenced by the behavior of the exchange interaction as a function of distance. Fisher et al. conducted a renormalization group analysis for systems in which the exchange interaction decays with distance according to [50], where d represents the spatial dimensionality of the system and characterizes the interaction range. Within this framework, the value of the parameter provides insight into whether the spin interactions are of short- or long-range character. Specifically, the classification depends on the threshold values of relative to d and other critical exponents. In a three-dimensional isotropic system, if , the interaction follows a short-range pattern, implying that decreases faster than and aligns with the 3D-Heisenberg model. Conversely, if , the interaction is considered long-range, and the Mean-field model becomes appropriate as decays slower than . Between these limits, specifically for , the system falls into an intermediate range category. In this intermediate range, the interaction strength decays at a rate slower than but faster than , leading to critical exponents whose values depend closely on the exact value of .
Moreover, this model enables prediction of the susceptibility exponent , derived through the renormalization group approach, as expressed by [50,51,52]:
where and .
To accurately match the range of interaction , as well as lattice (d) and spin dimensionality (n), we evaluated various combinations , tuning within the above equation (Equation (10)) to reproduce the experimentally observed susceptibility exponent . Subsequently, the corresponding exponents were obtained using standard scaling relations: , , , and .
For the present compound, the optimal combination was found to be , yielding a value , placing the system clearly within the intermediate range interaction category. Consequently, the spin interaction follows a power-law decay given by , producing critical exponents (, , and ) very close to our experimentally determined values. These results strongly suggest that the spin interactions belong to a 3D-Ising type system (), characterized explicitly by intermediate range interactions.
3.5. Magnetocaloric Properties
Owing to its soft magnetic character and a Curie temperature near ambient conditions, the Pr2Fe16.75Ni0.25 alloy appears to be a promising candidate for magnetocaloric applications. The magnetocaloric effect (MCE) was indirectly evaluated based on isothermal magnetization measurements, using the Maxwell relation [53]:
For practical purposes, the entropy change was calculated numerically over discrete temperature steps using:
Figure 13 presents the evolution of as a function of temperature under different magnetic field strengths. As expected, the peak of entropy change occurs in the vicinity of the Curie temperature . The values obtained are summarized in Table 5, showing that the partial substitution of Fe by Ni induces only minor variations in the magnitude of the entropy change.
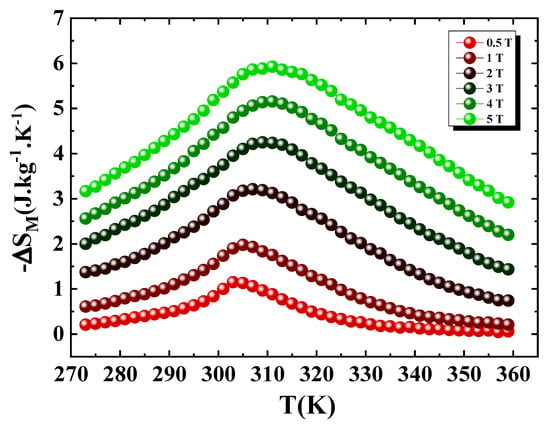
Figure 13.
Temperature dependence of the magnetic entropy change under various magnetic fields for Pr2Fe16.75Ni0.25.

Table 5.
Comparison of Curie temperature , full width at half maximum , maximum entropy change , and relative cooling power (RCP) for Pr2Fe16.75Ni0.25 and other magnetocaloric materials.
As shown in Figure 13, the peak of increases steadily with the magnetic field, reaching 5.92 J.kg−1.K−1 under a 5 T. This value is slightly higher than that of the parent Pr2Fe17 compound (5.5 J.kg−1.K−1) [16] and compares favorably with other well-known magnetocaloric systems, including R2Fe17−xMx alloys (R = Pr, Nd, Sm, Ho; M = Al, Mn, Ti) [16,17,18,21,24].
A key figure of merit for magnetocaloric materials is the relative cooling power (RCP), which quantifies the amount of heat transferable in a thermodynamic cycle. Introduced by Gschneidner and Pecharsky [12], RCP is calculated as:
where is the full width at half maximum of the curve.
Several magnetocaloric materials have been extensively investigated for their potential use in magnetic refrigeration near room temperature. Among these are Gd5(Ge,Si)4[2,54], MnAs-based alloys [55], and La(Fe,Co,Si)13(H,C) [56,57], along with related alloys and compounds. In these materials, the magnetic transition from a ferromagnetic to a paramagnetic state is of first-order nature. This results in a large magnetic entropy change near the operating temperature. However, they typically exhibit a low relative cooling power, due to their narrow effective temperature span , which is approximately 10 K. This contrasts with materials exhibiting second-order transitions, such as our compound, which shows a wide working temperature range ( K at H = 5 T). For Pr2Fe16.75Ni0.25, the RCP increases with the applied magnetic field, reaching 176.64 J kg−1 and 521.5 J kg−1 at 2 T and 5 T, respectively. These values correspond to approximately 90% of the RCP of Gd [3], a benchmark magnetocaloric material, highlighting the excellent potential of our compound for room-temperature magnetic refrigeration.
4. Conclusions
To conclude, we conducted an in-depth analysis of the structural, magnetic, critical, and magnetocaloric properties of the Pr2Fe16.75Ni0.25 intermetallic compound, synthesized by arc melting followed by thermal treatment at 1223 K for seven days. The X-ray diffraction patterns, refined through the Rietveld method, confirm that the compound crystallizes in the Th2Zn17-type rhombohedral phase with a space group of , with Ni atoms preferentially occupying the 6c site.
Magnetization measurements reveal a second-order magnetic phase transition occurring just above room temperature, at a Curie temperature higher than that of pristine Pr2Fe17 (285 K), indicating that Ni substitution enhances the exchange interactions. To explore the critical behavior near , we employed several complementary approaches, including the modified Arrott plot, Kouvel-Fisher method, and analysis of critical isotherms. The extracted exponents , , and are close to those expected for the three-dimensional Ising model, with an intermediate range interaction decaying as , and effective dimensionality , .
The magnetocaloric performance was evaluated using isothermal magnetization curves around the transition region. A peak of magnetic entropy change of 5.92 J kg−1 K−1 was recorded under a magnetic field change of 5 T, while the relative cooling power reached 176 J kg−1 and 521 J kg−1 for fields of 2 T and 5 T, respectively. These values highlight the material’s potential for room-temperature magnetic refrigeration, due to its balance between moderate entropy change and broad operating temperature range.
Author Contributions
Conceptualization, J.H. and S.G.; methodology, J.H. and E.D.; software, J.H. and S.G.; data curation, J.H. and H.J.; investigation, H.J. and L.B.; visualization, S.G.; supervision, E.D. and L.B.; resources, L.B.; writing—original draft preparation, J.H. and H.J.; writing—review and editing, S.G., E.D. and L.B. All authors have read and agreed to the published version of the manuscript.
Funding
This research received no external funding.
Institutional Review Board Statement
Not applicable.
Informed Consent Statement
Not applicable.
Data Availability Statement
The data used to support the findings of this study are available from the corresponding author upon request.
Acknowledgments
This work was supported by the National Center for Scientific Research (CNRS), France, and by the “Ministère de l’Enseignement Supérieur et de la Recherche Scientifique”, (LPA) Laboratory, University of Sfax, Tunisia.
Conflicts of Interest
The authors declare no conflicts of interest.
References
- Gschneidner, K.A.; Pecharsky, V.K.; Tsokol, A.O. Recent developments in magnetocaloric materials. Rep. Prog. Phys. 2005, 68, 1479. [Google Scholar] [CrossRef]
- Pecharsky, V.K.; Gschneidner, K.A. Giant Magnetocaloric Effect in Gd5(Si2Ge2). Phys. Rev. Lett. 1997, 78, 4494. [Google Scholar] [CrossRef]
- Gutfleisch, O.; Willard, M.A.; Brück, E.; Chen, C.H.; Sankar, S.G.; Liu, J.P. Magnetic Materials and Devices for the 21st Century: Stronger, Lighter, and More Energy Efficient. Adv. Mat. 2011, 23, 821–842. [Google Scholar] [CrossRef]
- Morrison, K.; Lyubina, J.; Moore, J.D.; Sandeman, K.G.; Gutfleisch, O.; Cohen, L.F.; Caplin, A.D. Magnetic refrigeration: Phase transitions, itinerant magnetism and spin fluctuations. Philos. Mag. 2012, 92, 292–303. [Google Scholar] [CrossRef]
- Chen, Y.F.; Wang, F.; Shen, B.G.; Hu, F.X.; Sun, J.R.; Wang, G.J.; Cheng, Z.H. Magnetic properties and magnetic entropy change of LaFe11.5Si1.5Hy interstitial compounds. J. Phys. Condens. Matter 2003, 15, L161. [Google Scholar] [CrossRef]
- Wada, H.; Tanabe, Y. Giant magnetocaloric effect of MnAs1−xSbx. Appl. Phys. Lett. 2001, 79, 3302–3304. [Google Scholar] [CrossRef]
- Manekar, M.; Roy, S.B. Reproducible room temperature giant magnetocaloric effect in Fe–Rh. J. Phys. D Appl. Phys. 2008, 41, 192004. [Google Scholar] [CrossRef]
- Guo, Z.B.; Du, Y.W.; Zhu, J.S.; Huang, H.; Ding, W.P.; Feng, D. Large Magnetic Entropy Change in Perovskite-Type Manganese Oxides. Phys. Rev. Lett. 1997, 78, 1142–1145. [Google Scholar] [CrossRef]
- Phan, M.H.; Yu, S.C. Review of the magnetocaloric effect in manganite materials. J. Magn. Magn. Mater. 2007, 308, 325–340. [Google Scholar] [CrossRef]
- Skini, R.; Khlifi, M.; Dhahri, E.; Hlil, E.K. Magnetocaloric-Transport Properties Correlation in La0.8Ca0.2MnO3-Doped Manganites. J. Supercond. Nov. Magn. 2017, 30, 3091–3095. [Google Scholar] [CrossRef]
- Gharbi, S.; Marouani, Y.; Issaoui, F.; Dhahri, E.; Hlil, E.K.; Barille, R.; Costa, B.F.O. Assessment of structural, optical, magnetic, magnetocaloric properties and critical phenomena of La0.57Nd0.1Sr0.18Ag0.15MnO3 system at room temperature. J. Mater. Sci. Mater. Electron. 2020, 31, 11983–11996. [Google Scholar] [CrossRef]
- Pecharsky, V.K.; Gschneidner, K.A. Magnetocaloric effect from indirect measurements: Magnetization and heat capacity. J. Appl. Phys. 1999, 86, 565–575. [Google Scholar] [CrossRef]
- Gschneidner, K.A. The magnetocaloric effect, magnetic refrigeration and ductile intermetallic compounds. Acta Mater. 2009, 57, 18–28. [Google Scholar] [CrossRef]
- Lyubina, J.; Schäfer, R.; Martin, N.; Schultz, L. Novel Design of La(Fe,Si)13 Alloys Towards High Magnetic Refrigeration Performance. Adv. Matter 2010, 22, 3735–3739. [Google Scholar] [CrossRef]
- Alvarez, P.; Gorria, P.; Sanchez-Llamazares, J.; Perez, M.J.; Franco, V.; Reiffers, M.; Curlik, I.; Gazo, E.; Kovac, J.; Blanco, J.A. Magnetic properties and magneto-caloric effect in pseudo-binary intermetallic (Ce,R)2Fe17 compounds (R = Y, Pr and Dy). Intermetallics 2011, 19, 982–987. [Google Scholar] [CrossRef]
- Guetari, R.; Bez, R.; Belhadj, A.; Zehani, K.; Bezergheanu, A.; Mliki, N.; Bessais, L.; Cizmas, C.B. Influence of Al substitution on magnetocaloric effect of Pr2Fe17−xAlx. J. Alloys Compd. 2014, 588, 64–69. [Google Scholar] [CrossRef]
- Zhong, X.C.; Liu, Z.W.; Zeng, D.C.; Gschneidner, K.A.; Pecharsky, V.K. Magnetocaloric effect of Pr2Fe17−xMnx alloys. Rare Met. 2014, 33, 552–555. [Google Scholar] [CrossRef]
- Cengiz, N.E.; Pektas, M.; Kaya, A.O.; Bayri, N.; Izgi, T.; Gencer, H.; Kolat, V.S.; Atalay, S. Influence of Ti substitution on magnetic and magnetocaloric properties of Pr2Fe17−xTix intermetallic compounds. J. Mater. Sci. Mater. Electron. 2023, 34, 346. [Google Scholar] [CrossRef]
- Charfeddine, S.; Zehani, K.; Bessais, L.; Korchef, A. Structural, magnetic, magneto-caloric and Mössbauer spectral study of Tb2Fe17 compound synthesized by arc melting. J. Solid State Chem. 2016, 238, 15–20. [Google Scholar] [CrossRef]
- Bouchaala, N.; Jemmali, M.; Bartoli, T.; Nouri, K.; Hentech, I.; Walha, S.; Bessais, L.; Ben Salah, A. Influence of Fe-substitution on structural, magnetic and magnetocaloric properties of Nd2Fe17−xCox solid solutions. J. Solid State Chem. 2018, 258, 501–509. [Google Scholar] [CrossRef]
- Dahal, B.; Kharel, P.; Ott, T.; Zhang, W.; Valloppilly, S.; Skomski, R.; Sellmyer, D. Magnetic and magnetocaloric properties of Pr2−xNdxFe17 ribbons. AIP Adv. 2019, 9, 035211. [Google Scholar] [CrossRef]
- Bouzidi, W.; Nouri, K.; Bartoli, T.; Sedek, R.; Lassri, H.; Moscovici, J.; Bessais, L. Study of the magnetic and magnetocaloric properties at low-field in Nd2Fe17−xSix intermetallics. J. Magn. Magn. Mater. 2020, 497, 166018. [Google Scholar] [CrossRef]
- Nouri, K.; Saidi, M.; Bessais, L.; Jemmali, M. Structural, magnetic and magnetocaloric study of Sm2Fe17−xNix (x = 0, 0.25, 0.35 and 0.5) compounds. Appl. Phys. A 2021, 127, 442. [Google Scholar] [CrossRef]
- Jaballah, H.; Bouzidi, W.; Fersi, R.; Mliki, N.; Bessais, L. Structural, magnetic and magnetocaloric properties of (Pr,Sm)2Fe17 compound at room temperature. J. Phys. Chem. Solids 2022, 161, 110438. [Google Scholar] [CrossRef]
- Sanchez-Llamazares, J.; Perez, M.J.; Alvarez, P.; Santos, J.D.; Sanchez, M.L.; Hernando, B.; Blanco, J.A.; Marcos, J.S.; Gorria, P. The effect of ball milling in the microstructure and magnetic properties of Pr2Fe17 compound. J. Alloys Compd. 2009, 483, 682–685. [Google Scholar] [CrossRef]
- Nouri, K.; Bartoli, T.; Chrobak, A.; Moscovici, J.; Bessais, L. Magnetism and Hyperfine Parameters in Iron Rich Gd2Fe17−xSix Intermetallics. J. Electron. Mater. 2018, 47, 3836–3846. [Google Scholar] [CrossRef]
- Rietveld, H. A profile refinement method for nuclear and magnetic structures. J. Appl. Crystallogr. 1969, 2, 65–71. [Google Scholar] [CrossRef]
- Rodríguez-Carvajal, J. Recent advances in magnetic structure determination by neutron powder diffraction. Physica. B 1993, 192, 55–59. [Google Scholar] [CrossRef]
- Cullity, B.D.; Graham, C.D. Introduction to Magnetic Materials; John Wiley & Sons: Hoboken, NJ, USA, 2011. [Google Scholar]
- Khelifi, J.; Tozri, A.; Issaoui, F.; Dhahri, E.; Hlil, E. The influence of disorder on critical behavior near the paramagnetic to ferromagnetic phase transition temperature in (La1−xNdx)2/3(Ca1−ySry)1/3MnO3 doped manganite. J. Alloys Compd. 2014, 584, 617–624. [Google Scholar] [CrossRef]
- Kou, X.C.; de Boer, F.R.; Grössinger, R.; Wiesinger, G.; Suzuki, H.; Kitazawa, H.; Takamasu, T.; Kido, G. Magnetic anisotropy and magnetic phase transitions in R2Fe17 with R = Y, Ce, Pr, Nd, Sm, Gd, Tb, Dy, Ho, Er, Tm and Lu. J. Magn. Magn. Mater. 1998, 177–181, 1002–1007. [Google Scholar] [CrossRef]
- Zehani, K.; Bez, R.; Boutahar, A.; Hlil, E.; Lassri, H.; Mliki, J.M.N.; Bessais, L. Structural, magnetic, and electronic properties of high moment FeCo nanoparticles. J. Alloys Compd. 2014, 591, 58–64. [Google Scholar] [CrossRef]
- Grandjean, F.; Ezekwenna, P.C.; Long, G.J.; Pringle, O.A.; l’Heritier, P.; Ellouze, M.; Luo, H.P.; Yelon, W.B. Neutron diffraction and Mössbauer spectral study of Nd2Fe16Ti and its nitride. J. Appl. Phys. 1998, 84, 1893–1900. [Google Scholar] [CrossRef]
- Hao, S.Q.; Chen, N.X.; Shen, J. Atomistic study on the structure and Curie temperature for Nd2Fe17−xCrx. J. Magn. Magn. Mater. 2002, 246, 115–123. [Google Scholar] [CrossRef]
- Hao, S.Q.; Chen, N.X.; Shen, J. Phase stability and site preference of Nd2Fe17−xTx (T V, Ti, Nb) and Nd2−xZrxFe17. J. Alloys Compd. 2002, 343, 53–59. [Google Scholar] [CrossRef]
- Khazzan, S.; Mliki, N.; Bessais, L.; Djega-Mariadassou, C. Rare-earth iron-based intermetallic compounds and their carbides: Structure and magnetic behaviors. J. Magn. Magn. Mater. 2010, 322, 224–229. [Google Scholar] [CrossRef]
- Bartoli, T.; Joubert, J.; Provost, K.; Elkaim, E.; Paul-Boncour, V.; Monnier, J.; Moscovici, J.; Bessais, L. Site Occupancy Determination in Th2Zn17- and TbCu7-types Sm2Fe17−xCox Compounds using Synchrotron Resonant Diffraction. Inorg. Chem. 2021, 60, 1533–1541. [Google Scholar]
- Givord, D.; Lemaire, R. Magnetic transition and anomalous thermal expansion in R2Fe17compounds. IEEE Trans. Magn. 1974, 10, 109–113. [Google Scholar] [CrossRef]
- Li, Z.; Morrish, A. Negative exchange interactions and Curie temperatures for Sm2Fe17 and Sm2Fe17Ny. Phys. Rev. B 1997, 55, 3670–3676. [Google Scholar] [CrossRef]
- Bessais, L.; Younsi, K.; Khazzan, S.; Mliki, N. X-ray and intrinsic magnetic properties of nanocrystalline Sm2(Fe,M)17 (M = Si, Ga, Co, Cr, Zr or Mo). Intermetallics 2011, 19, 997–1004. [Google Scholar] [CrossRef]
- Horcheni, J.; Nouri, K.; Dhahri, E.; Bessais, L. Crystal structure, critical phenomena and magnetocaloric properties of Ni-substituted ferromagnetic Pr2Fe17 intermetallic compound around room temperature. J. Solid State Chem. 2023, 326, 124219. [Google Scholar] [CrossRef]
- Banerjee, B.K. On a generalised approach to first and second order magnetic transitions. Phys. Lett. 1964, 2, 16–17. [Google Scholar] [CrossRef]
- Moutis, N.; Panagiotopoulos, I.; Pissas, M.; Niarchos, D. Structural and magnetic properties of La0.67(BaxCa1−x)0.33MnO3 perovskites (0 < x < 1). Phys. Rev. B 1999, 59, 1129–1133. [Google Scholar]
- Arrott, A.; Noakes, J.E. Approximate Equation of State For Nickel Near its Critical Temperature. Phys. Rev. Lett. 1967, 19, 786–789. [Google Scholar] [CrossRef]
- Dhahri, K.; Dhahri, N.; Dhahri, J.; Taibi, K.; Hlil, E.K.; Belmabrouk, H.; Zaidi, M. Magnetic, magnetocaloric and critical behavior investigation of La0.7Ca0.1Pb0.2Mn1−x−yAlxSnyO3 (x, y = 0.0, 0.05 and 0.075) prepared by a sol–gel method. RSC Adv. 2017, 7, 43410–43423. [Google Scholar] [CrossRef]
- Kouvel, J.S.; Fisher, M.E. Detailed Magnetic Behavior of Nickel Near its Curie Point. Phys. Rev. 1964, 136, A1626–A1632. [Google Scholar] [CrossRef]
- Jaballah, H.; Guetari, R.; Mliki, N.; Bessais, L. Magnetic properties, critical behavior and magnetocaloric effect in the nanocrystalline Pr2Fe16Al. J. Phys. Chem. Solids 2022, 169, 110752. [Google Scholar] [CrossRef]
- Zhang, L.; Menzel, D.; Jin, C.; Du, H.; Ge, M.; Zhang, C.; Pi, L.; Tian, M.; Zhang, Y. Critical behavior of the single-crystal helimagnet MnSi. Phys. Rev. B 2015, 91, 024403. [Google Scholar] [CrossRef]
- Jaballah, H.; Greneche, J.-M.; Mliki, N.; Bessais, L. Magnetic phase transition and critical behavior in (Pr,Sm)2Fe17 compounds: A comprehensive study using macroscopic and local experimental approaches. Mater. Res. Bull. 2024, 180, 113022. [Google Scholar] [CrossRef]
- Fisher, M.E.; Ma, S.k.; Nickel, B. Critical Exponents for Long-Range Interactions. Phys. Rev. Lett. 1972, 29, 917–920. [Google Scholar] [CrossRef]
- Pramanik, A.; Banerjee, A. Critical behavior at paramagnetic to ferromagnetic phase transition in Pr0.5Sr0.5MnO3: A bulk magnetization study. Phys. Rev. B 2009, 79, 214426. [Google Scholar] [CrossRef]
- Horcheni, J.; Nouri, K.; Jaballah, H.; Bessais, L.; Dhahri, E.; Jemmali, M. Magnetocaloric Properties and Critical Behaviour of the Sm2Ni17 Compound. Appl. Sci. 2023, 13, 6575. [Google Scholar]
- Zhong, W.; Chen, W.; Ding, W.P.; Zhang, N.; Hu, A.; Du, Y.W.; Yan, Q.J. Structure, composition and magnetocaloric properties in polycrystalline La1−xAxMnO3+δ (A = Na, K). J. Eur. Phys. B 1998, 3, 169–174. [Google Scholar] [CrossRef]
- Pecharsky, V.K.; Gschneidner, K.A. Effect of alloying on the giant magnetocaloric effect of Gd5(Si2Ge2). J. Magn. Magn. Mater. 1997, 167, L179–L184. [Google Scholar] [CrossRef]
- Habiba, U.e.; Khattak, K.S.; Ali, S.; Khan, Z.H. MnAs and MnFeP1−xAsx-based magnetic refrigerants: A review. Mater. Res. Express 2020, 7, 046106. [Google Scholar] [CrossRef]
- Fujita, A.; Fujieda, S.; Fukamichi, K. Influence of hydrogenation on the electronic structure and the itinerant-electron metamagnetic transition in strong magnetocaloric compound La(Fe0.88Si0.12)13. J. Magn. Magn. Mater. 2009, 321, 3553–3558. [Google Scholar] [CrossRef]
- Jasinski, M.; Liu, J.; Jacobs, S.; Zimm, C. La(Fe, Co, Si)13 bulk alloys and ribbons with high temperature magnetocaloric effect. Appl. Phys. 2010, 107, 09A902. [Google Scholar] [CrossRef]
Disclaimer/Publisher’s Note: The statements, opinions and data contained in all publications are solely those of the individual author(s) and contributor(s) and not of MDPI and/or the editor(s). MDPI and/or the editor(s) disclaim responsibility for any injury to people or property resulting from any ideas, methods, instructions or products referred to in the content. |
© 2025 by the authors. Licensee MDPI, Basel, Switzerland. This article is an open access article distributed under the terms and conditions of the Creative Commons Attribution (CC BY) license (https://creativecommons.org/licenses/by/4.0/).