Article

Evolution of Griffiths-like Anomaly in Isostructural Swedenborgite Compounds Ho1−xErxBaCo4O7+δ

1
School of Materials Science, Indian Association for the Cultivation of Science, Jadavpur, Kolkata 700032, India
2
cMACS, Department of Microbial and Molecular Systems, KU Leuven, Celestijnenlaan 200F, 3001 Heverlee, Belgium
3
Dipartimento di Scienze, Universitá Roma Tre, Via della Vasca Navale 84, 00146 Roma, Italy
4
Laboratoire de Physique des Solides, CNRS, Université Paris-Saclay, 91405 Orsay, France
*
Author to whom correspondence should be addressed.
These authors contributed equally to this work.
Magnetochemistry 2025, 11(7), 55; https://doi.org/10.3390/magnetochemistry11070055
Submission received: 9 May 2025 / Revised: 18 June 2025 / Accepted: 19 June 2025 / Published: 30 June 2025

Abstract

In this study, we investigate the presence of the Griffiths-like anomaly in the geometrically frustrated antiferromagnet HoBaCo 4 O 7 + δ and globally its absence in ErBaCo 4 O 7 + δ , despite only small differences in the ionic radii, f-electron occupancy, and the corresponding crystal structures of the Ho 3 + and Er 3 + -members. Previous studies have identified the Griffiths phase in the Dy-analog, DyBaCo 4 O 7 + δ , suggesting certain inherent features of this class of materials that regularly give rise to such anomalies. To explore the curious disappearance of such an anomalous feature in ErBaCo 4 O 7 + δ , we prepared a series of compounds with varying compositions Ho 1 x Er x BaCo 4 O 7 + δ ( 0 x 1 ) and systematically studied the evolution of various physical properties as a function of Er-doping. Our experimental studies, including X-ray diffraction (XRD), magnetic, X-ray absorption spectroscopy (XAS), X-ray photoelectron spectroscopy (XPS), heat capacity, and muon spin relaxation spectroscopy ( μ SR spectroscopy), revealed that while the Griffiths-like anomaly indeed disappears with doping at the macroscopic level, signatures of inhomogeneity are retained in ErBaCo 4 O 7 + δ too, at least at the local level. Overall, our results highlight the significant role of ionic radius and local structural distortions in stabilizing the Griffiths phase in this class of systems.

1. Introduction

Phase transitions in complex materials are often influenced by quenched disorder, which may arise from non-stoichiometry, impurities, and structural defects such as dislocations and grain boundaries. While it was initially believed that disorder could destroy any critical point since different spatial regions might order at different temperatures [1], it was found later that classical phase transitions can persist even in the presence of weak disorder since the boundaries are blurred, although discontinuous regions cannot undergo a phase transition in the true sense [2]. A key concept in disordered systems is the Griffiths phenomenon [3]: strongly coupled regions become locally ordered above the bulk magnetic ordering temperature. These regions remain magnetically ordered even when the bulk system is still in a disordered state. The slow dynamics of these locally ordered regions cause the singularity in free energy in the Griffiths phase (GP) region [3,4]. In this regime, magnetization exhibits non-analytic behavior; in particular, it deviates from the Curie-Weiss (C-W) law above the magnetic ordering temperature. Such anomalous magnetic response lies intermediate between a fully disordered paramagnetic phase and a magnetically ordered state. Several factors contribute to stabilizing such Griffiths phases in a material: among them, chemical doping, Jahn–Teller distortions [5], variation in the cation size of the A-site in A B O 3 -type structures [6], finite-size effects, and magnetic site dilution [7] are noteworthy. Therefore, research on Griffiths phase behavior has attracted a lot of interest, especially in the field of strongly correlated electron systems such as transition metal oxides [8], chemically substituted f-electron systems [9,10], and magnetocaloric intermetallic compounds [9,11].
Although there is a large variety of GP compounds showing a bulk ferromagnetic order [12,13,14,15,16,17,18,19], its manifestation in antiferromagnetic (AFM) systems has received comparatively less attention, few examples being systems like R 5 Si 4 x Ge 4 4 x (R = Gd, Tb, Dy, Ho) [11], GdFe 0.17 Sn 2 [14], Ca 3 CoMnO 6 [20], DyBaCo 4 O 7 + δ [21], etc. Following the proof of the Griffiths phase in DyBaCo 4 O 7 + δ , a member of the Swedenborgite family [21], these compounds have emerged as compelling systems for investigating Griffiths phase behavior. In this context, we focus on the Co-based Swedenborgite compounds R BaCo 4 O 7 + δ (R = Ho and Er), which featuress multiple Co oxidation states (+2 and +3), while the structure consists of geometrically frustrated Co 2 + triangular layers and Co 3 + kagome. Despite strong antiferromagnetic interactions among Co spins, the system exhibits a disordered magnetic ground state due to geometric frustration within the CoO 4 tetrahedral network. Experimental and theoretical studies have emphasized the role of competing intra-kagome and kagome-triangular exchange interactions, as well as the impact of oxygen non-stoichiometry [22,23,24,25,26,27,28,29]. Such a situation makes this series of compounds a fertile ground to probe disorder-dominated magnetic ground states.
The purpose of this study is to experimentally investigate the evolution of geometric frustration and quenched disorder as a function of Er-doping in HoBaCo 4 O 7 + δ (Ho 1 x Er x BaCo 4 O 7 + δ (HEBCO); x = 0.0, 0.25, 0.50, 0.75, 1.0). Interestingly, HoBaCo 4 O 7 + δ (HBCO) (x = 0.00) exhibits a Griffiths phase, while ErBaCo 4 O 7 + δ (EBCO) (x = 1.0) does not, according to the bulk magnetization data. This makes it the ideal system for studying the factors that either support the presence of the Griffiths phase in the series or lead to its disappearance. We investigated the systems through structural, magnetic, and local probe ( μ SR) measurements, which reveal that there are indications of Griffiths-like anomaly even within EBCO, albeit only at a local level, which does not manifest itself in the bulk magnetization data, and consequently, the Griffiths-like feature appears to be gradually decreasing with progressive Er-doping.

2. Materials and Methods

Polycrystalline samples of Ho 1 x Er x BaCo 4 O 7 + δ were synthesized using the conventional solid state technique. High-purity powders of Ho 2 O 3 , BaCO 3 (99.999%, Sigma-Aldrich, St. Louis, MO, USA), and Co 3 O 4 (99.999%, Sigma-Aldrich, St. Louis, MO, USA) were taken in stoichiometric proportions and thoroughly wet-ground in an agate mortar with ethanol. Subsequently, the mixture was calcined at 900 °C, 1000 °C, and 1100 °C with intermediate grindings. After the final sintering at 1100 °C, the samples were quenched directly to room temperature by rapidly removing them from the furnace and cooling them in ambient air in order to minimize excess oxygen uptake. Subsequently, the oxygen content ( δ ) of each sample was estimated using iodometric titration (see Table 1).
Phase purity and structural characterization were confirmed by powder X-ray diffraction (XRD) using a Bruker AXS D8 Advance diffractometer with Cu K α radiation and a RIGAKU SmartLab (9 kW) X-ray generator. The XRD data were refined using FULLPROF program [30]. Furthermore, Co K-edge X-ray absorption fine structure (XAFS) spectra were collected at the XAFS beamline of the Elettra Synchrotron Center, Italy (Exp. No.: 20200283). DC magnetic measurements were recorded in the temperature range of 2 to 300 K, in magnetic fields of about ± 5 Tesla, using a superconducting quantum interference device magnetometer (SQUID) (Quantum Design, San Diego, CA, USA). A vibrating sample magnetometer (Quantum Design, San Diego, CA, USA) was used for additional magnetic characterization in the temperature range of 2 to 400 K. The relaxation of muon spin was investigated using the MUSR spectrometer at the ISIS facility, Rutherford Appleton Laboratory, Didcot, UK, in zero field and longitudinal fields up to 3200 G. To reduce background noise, we mounted the sample on a high-purity silver sample holder, and measurements were performed at various temperatures.

3. Results and Discussion

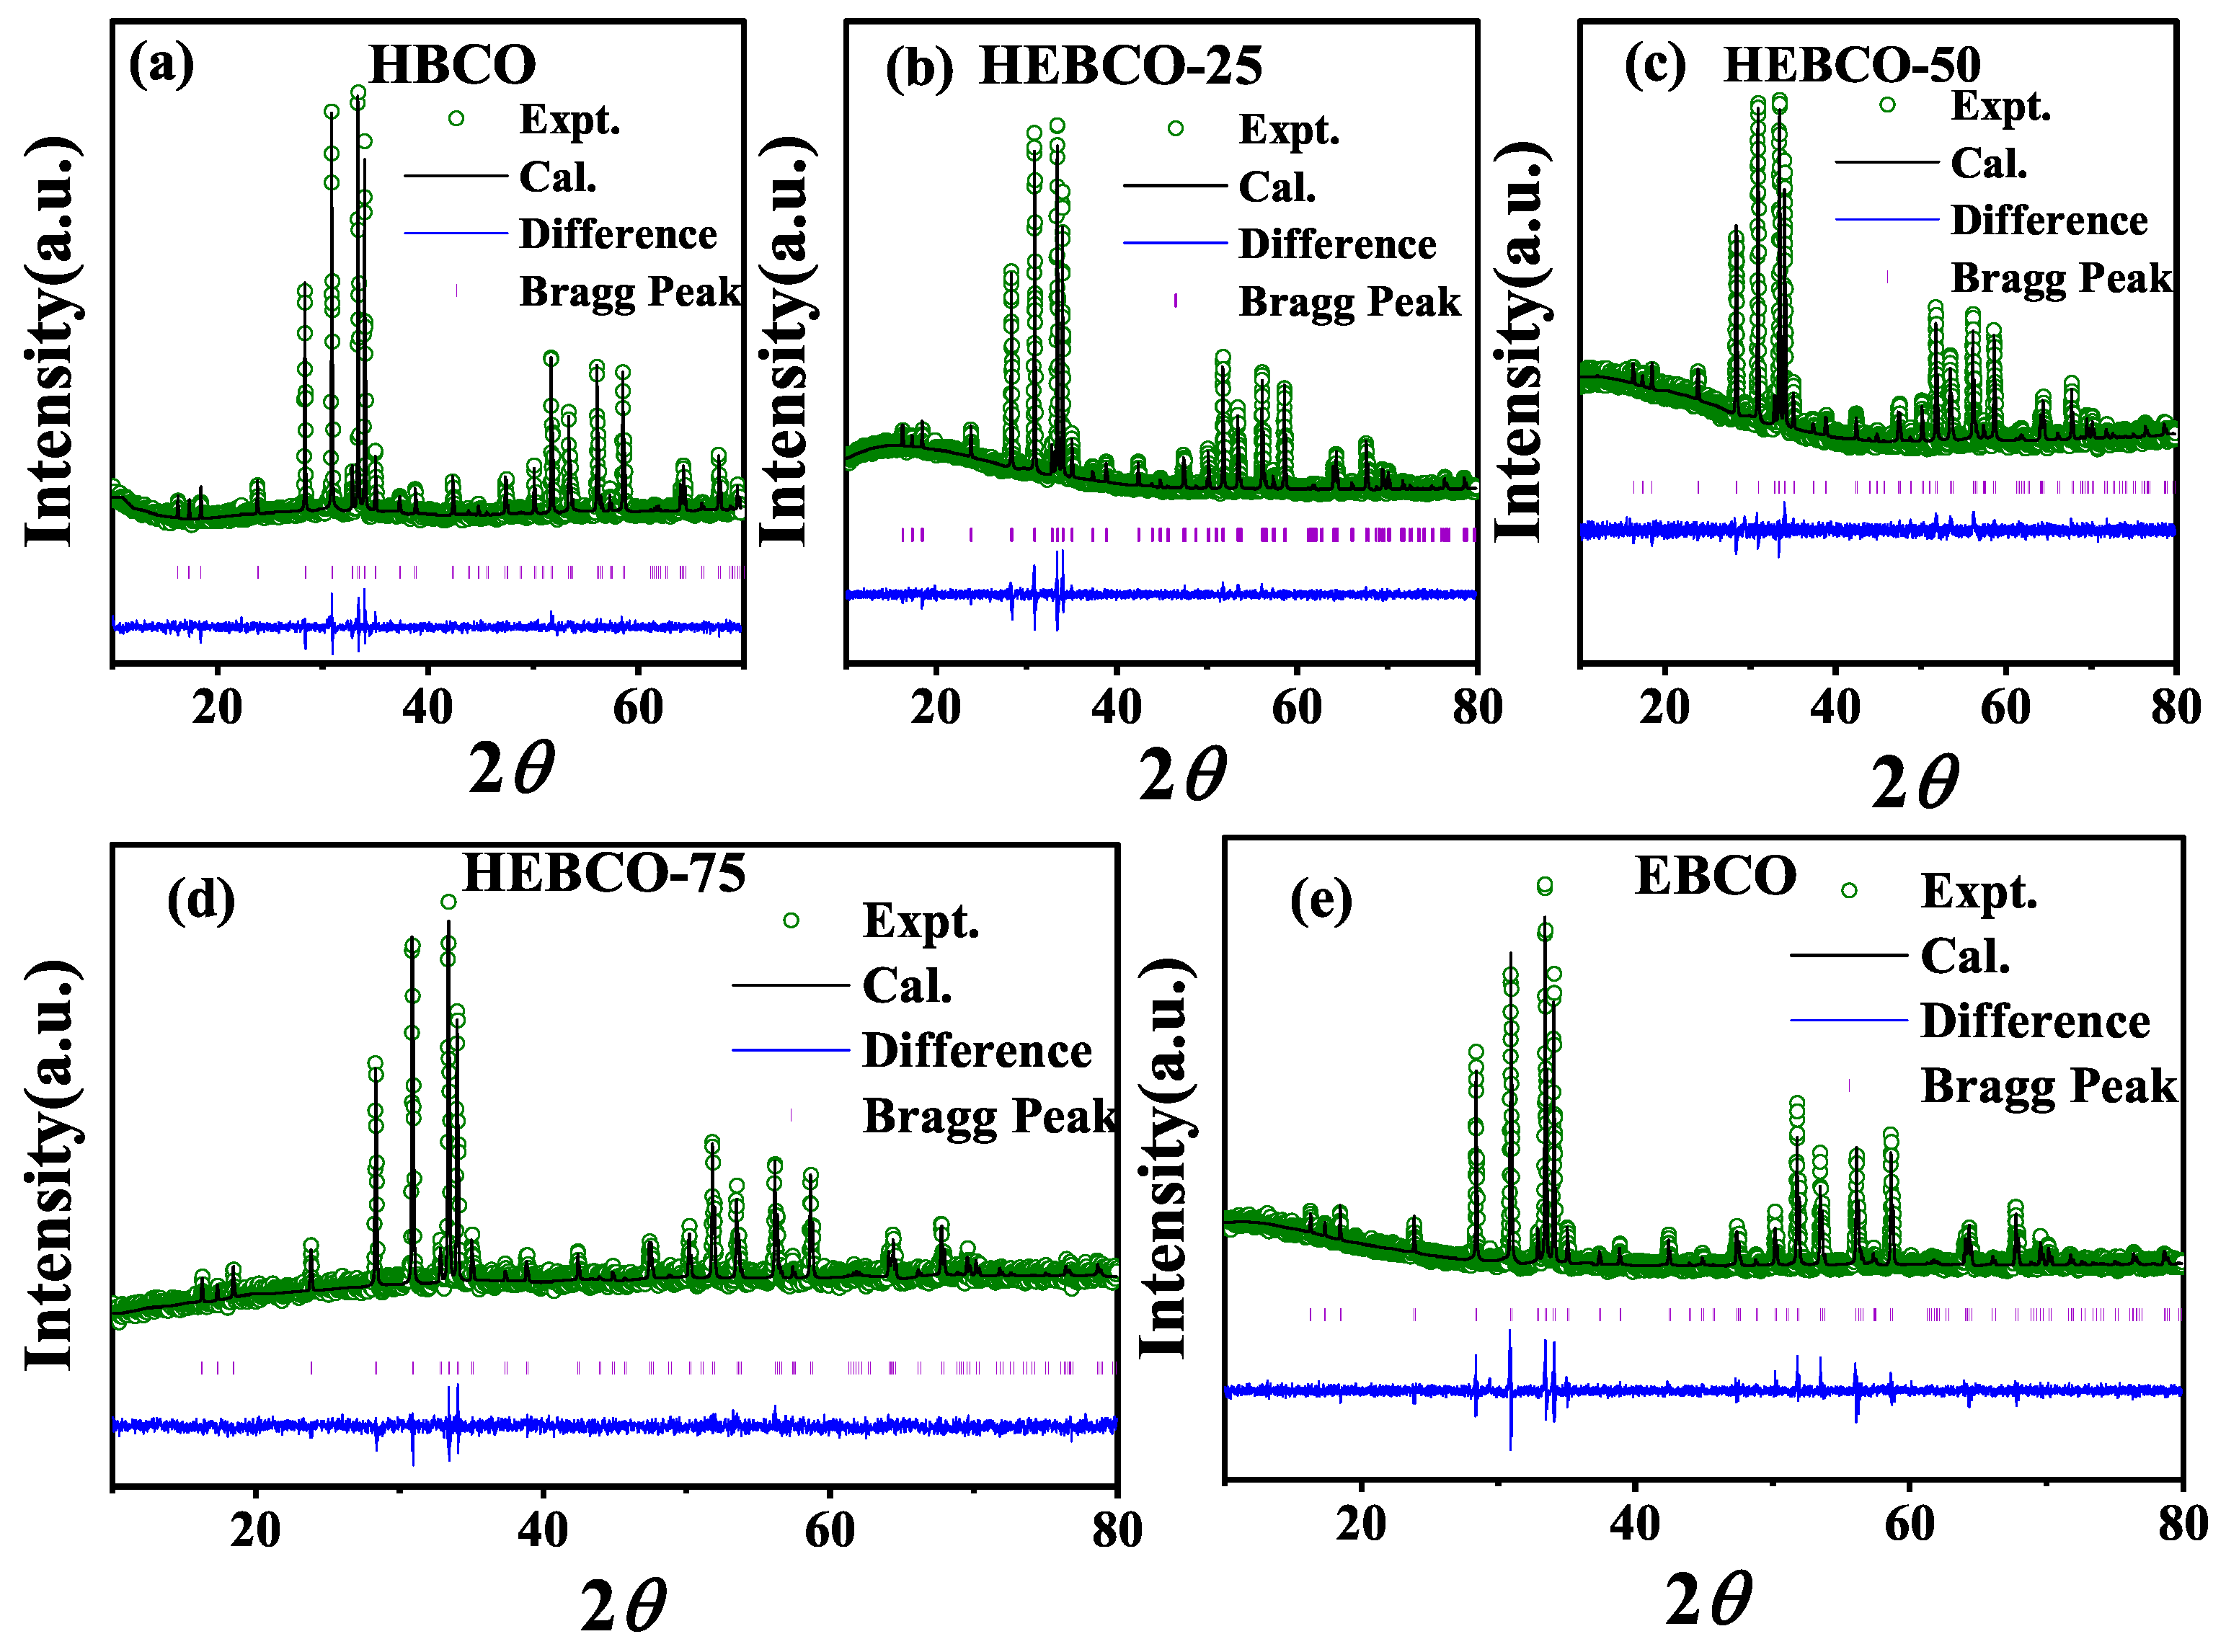
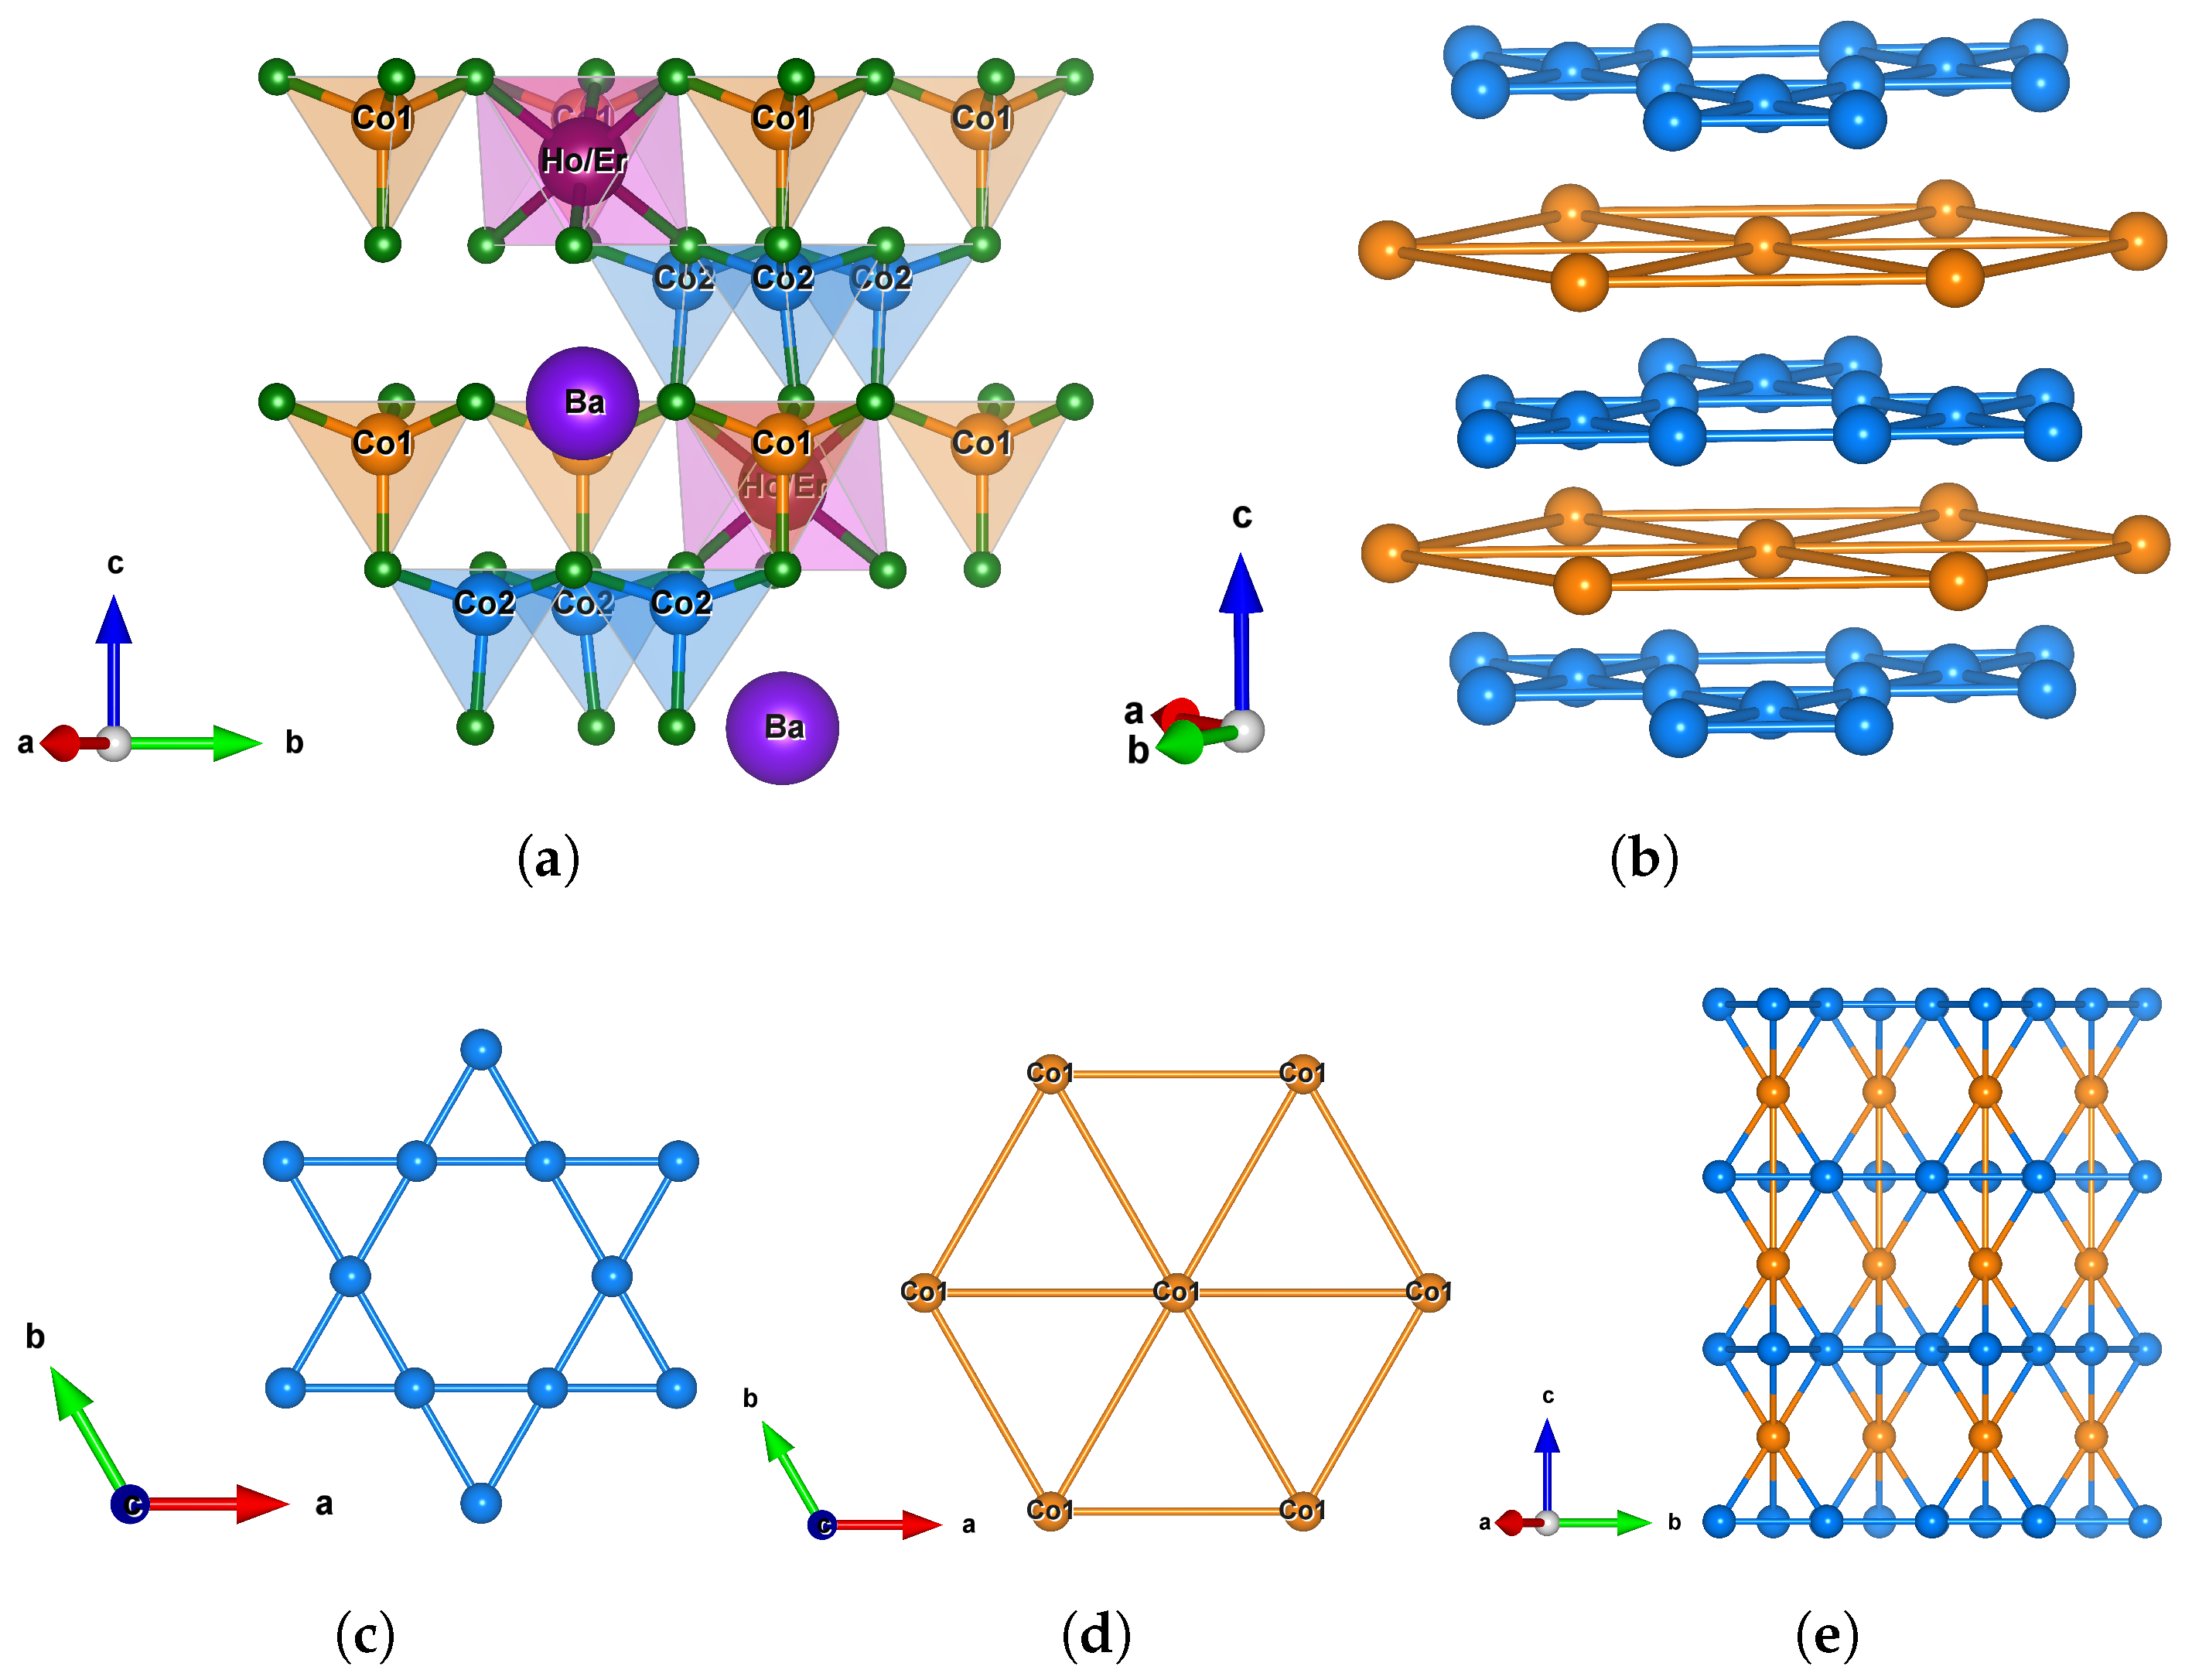
3.1. Structural Characterization

3.1.1. XRD and Structure

Room temperature X-ray diffraction (XRD) patterns of Ho 1 x Er x BaCo 4 O 7 + δ (x = 0.0, 0.25, 0.50, 0.75, 1.0) ensure pure single phase of all the samples, and satisfactory structural refinements have been performed by considering high symmetry trigonal P31c space group (see Figure 1). The presence of oxygen non-stoichiometry δ influences the crystal structure, leading to the adoption of the P31c space group rather than the orthorhombic P n a 2 1 symmetry [31,32].
The lattice parameters, space group, and oxygen non-stoichiometry ( δ ) of this series of compounds are listed in the table (see Table 1).The Rietveld-refined Bragg reflection planes and refinement goodness-of-fit parameters are provided in Supplementary Figure S1 and Table S1, respectively. The lattice parameters gradually decrease by going from x = 0.0 to x = 1.0 as the ionic radius of Er 3 + (r Er 3 + = 0.89 Å) is less than the ionic radius of Ho 3 + (r Ho 3 + = 0.901 Å). There are two formula units in one unit cell, and the refined crystal structure has two types of Co atoms, each of which coordinates with four oxygen atoms, forming a tetrahedral environment (see Figure 2a). It also seems that the Ho/Er atoms in the structure form octahedra (Ho/Er) O 6 with six oxygen atoms. It is known from prior crystallographic and spectroscopic studies on similar Swedenborgite systems [21,31,32] that Co 3 + forms the kagome layer, while Co 2 + forms the alternating triangular layer. Naturally, multiple Co atoms, having different charge states, cause various tetrahedral distortions, which in turn give rise to multiple Co-O-Co exchange pathways in the system.

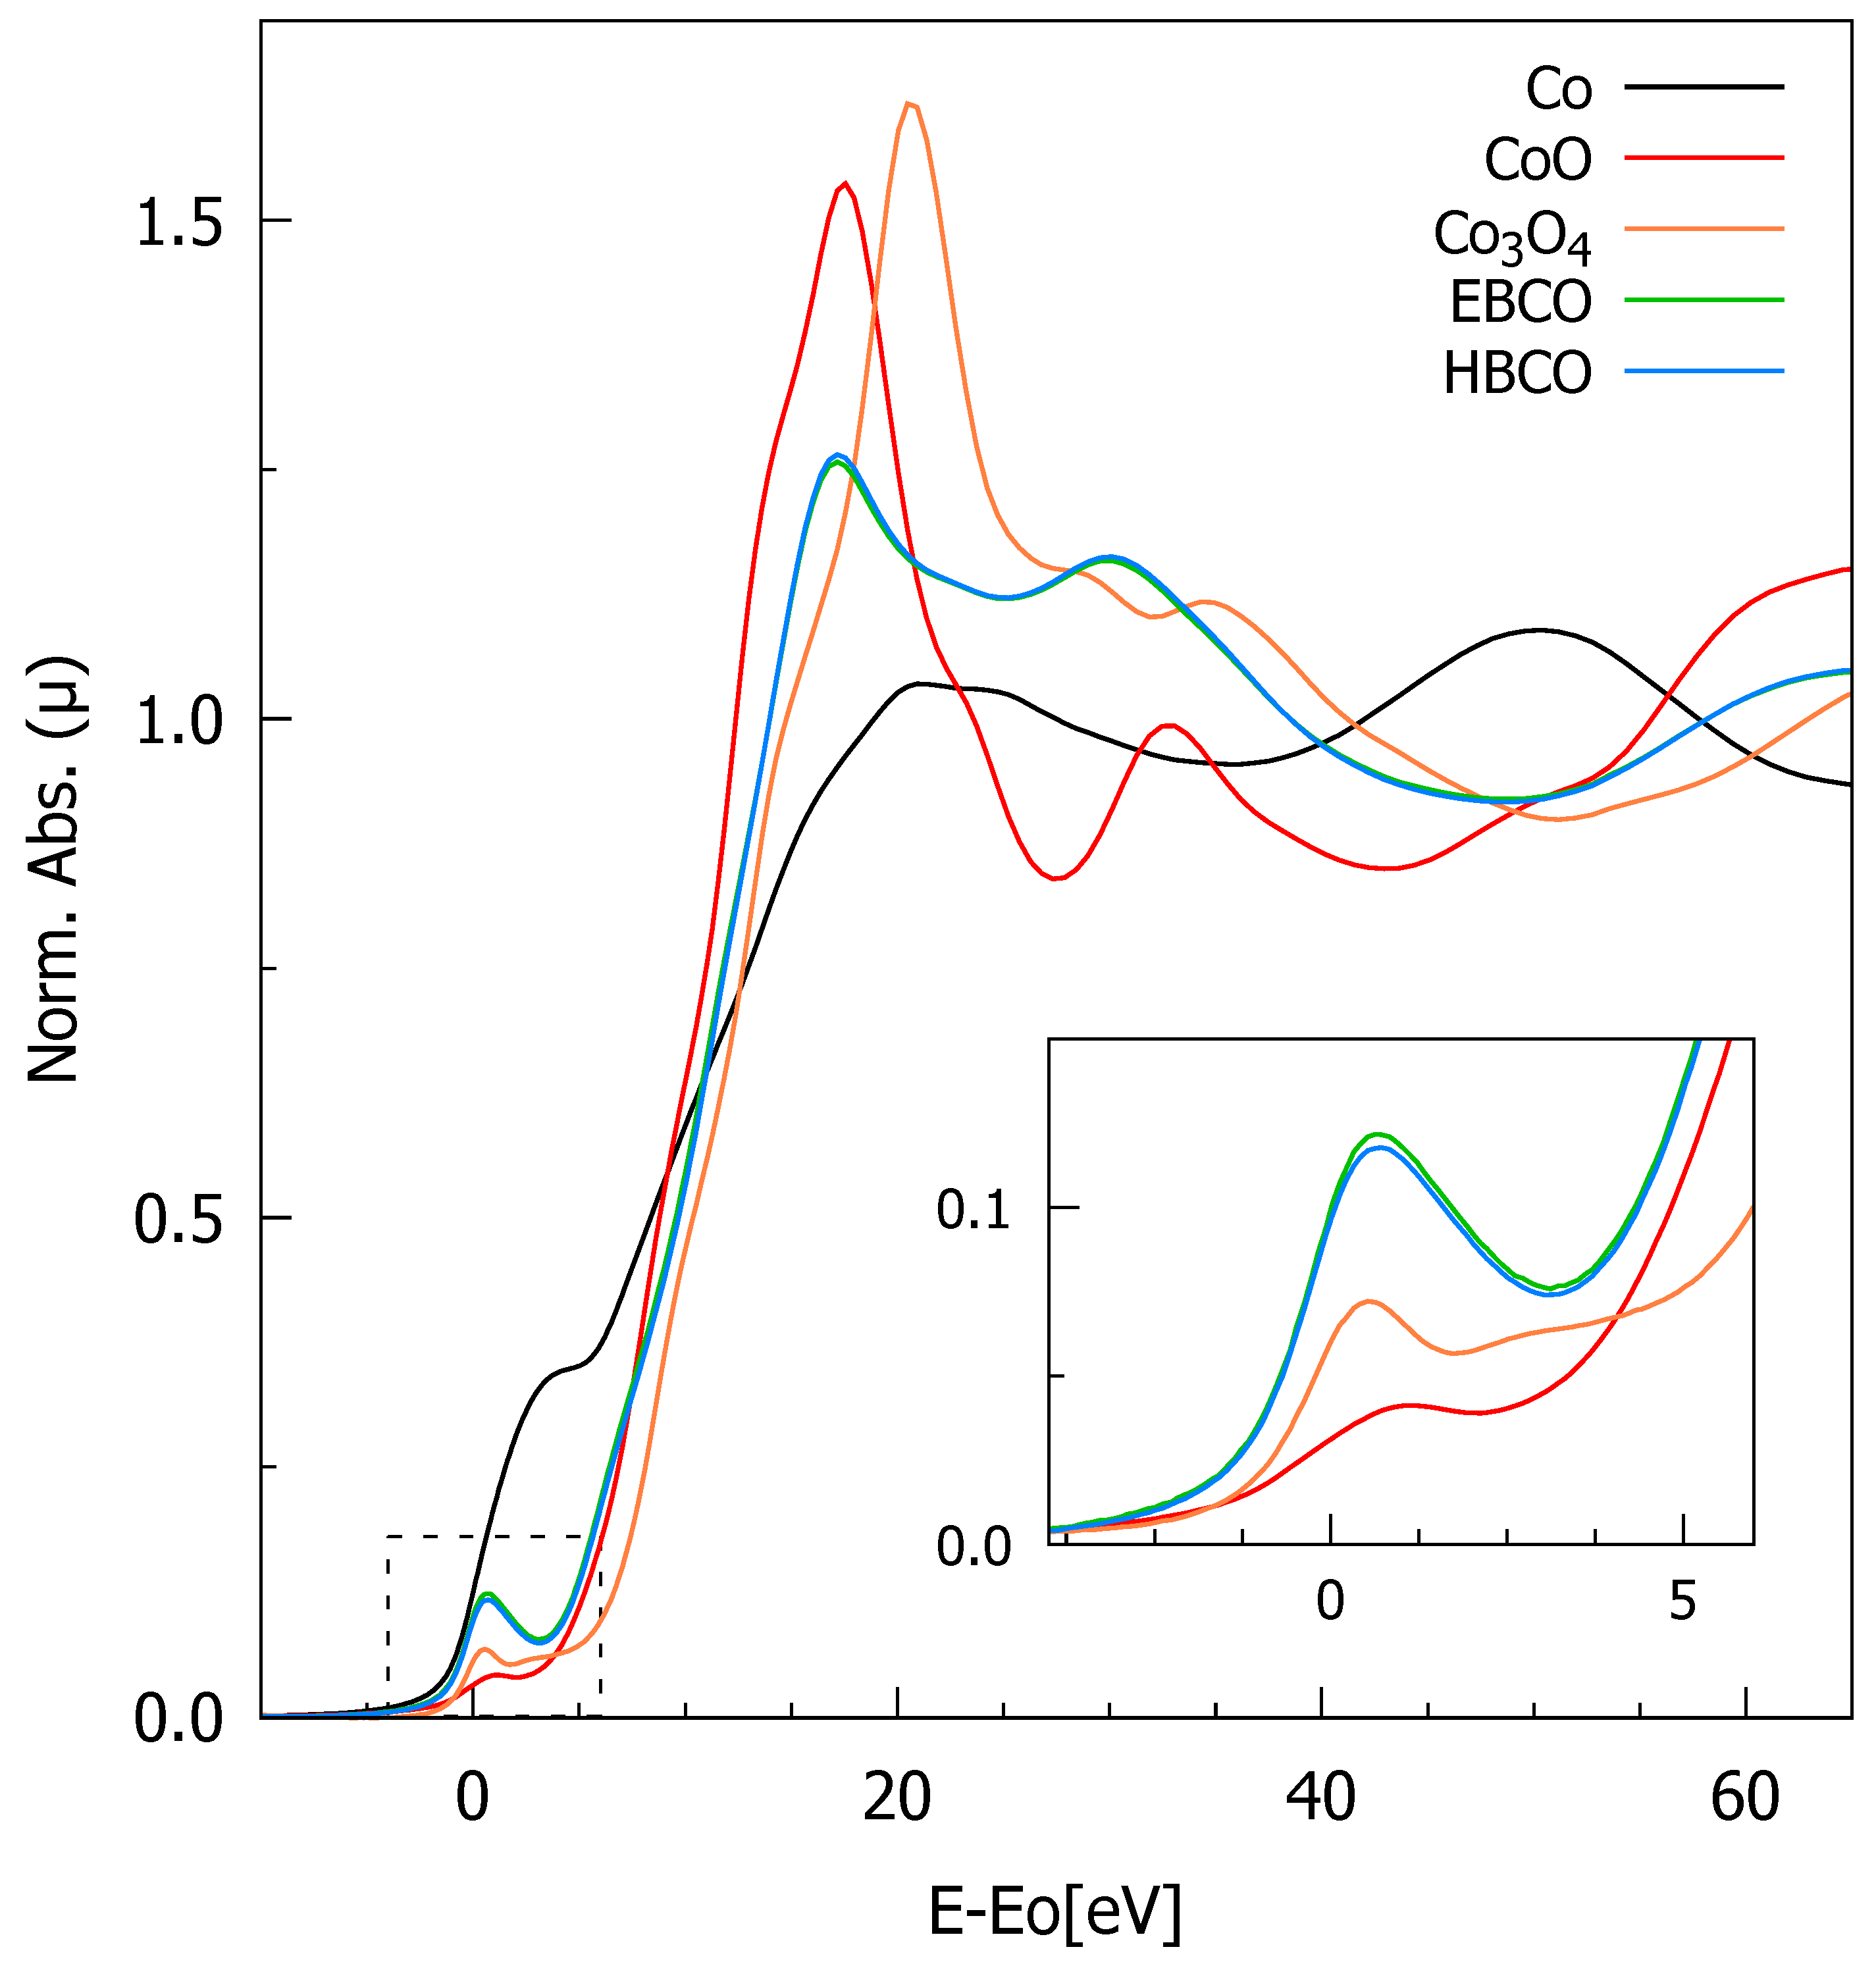
3.1.2. Valence State of Co-Ions from XANES (X-Ray Absorption near Edge Spectroscopy) Studies

Based on its oxygen stoichiometric content, the average valency of Co in HBCO is expected to be approximately 2.3+. In order to confirm the oxidation state of Co in our samples, Co K-edge XANES measurements were performed on the two end members, HBCO and EBCO, at room temperature in transmission mode. A cobalt foil, placed downstream of the sample, was measured simultaneously to ensure proper energy scale calibration. For comparison, absorption spectra of reference compounds CoO and Co 3 O 4 were also recorded. Due to the proximity of the Ho- L 3 (at 8071 eV) absorption edges, a reliable analysis of the extended (EXAFS) region of the spectra was not feasible, and so the analysis was kept limited to the XANES region. The normalized XANES spectra of the Swedenborgite samples and reference compounds are shown in Figure 3. The XANES features of HBCO and EBCO are quite similar in the whole range, indicating a nearly identical average local atomic structure, coordination symmetry, and valence state for Co ions in the two end members and, consequently, throughout the series.
In oxides, the absorption edge energy—defined as the point where the normalized absorption coefficient μ ( E ) reaches 0.5—is directly related to the average oxidation state of the absorbing atom. For cobalt oxides, the edge position increases linearly with valence by approximately 2.7 eV per oxidation state unit [33]. As shown in Figure 3, the Co K-edge energies of the three Swedenborgite samples lie between those of CoO (Co 2 + ) and Co 3 O 4 (average Co 2.66 + ), suggesting an intermediate Co valence of approximately 2.4+, probably indicating the presence of a significant amount of excess oxygen in the unit cell. The inset of Figure 3 highlights weak pre-edge features, which are attributed to electronic transitions from 1s core levels to unoccupied 3d-like states. Although these transitions are dipole-forbidden, hybridization with O 2p orbitals, particularly in non-centrosymmetric environments, can induce dipole-allowed character, enhancing the pre-edge intensity. Hybridization is absent in centrosymmetric octahedral ( O h ) environments but is promoted in tetrahedral ( T d ) geometries, where inversion symmetry is broken. This behavior is evident when comparing the weak pre-edge features in CoO, where Co is octahedrally coordinated, to the stronger pre-edge in Co 3 O 4 , which contains 1/3 of Co 2 + sites in T d symmetry. In Swedenborgite compounds, the pre-edge peak is definitively the highest, which is consistent with the fact that all the Co ions in the compounds are tetrahedrally coordinated.

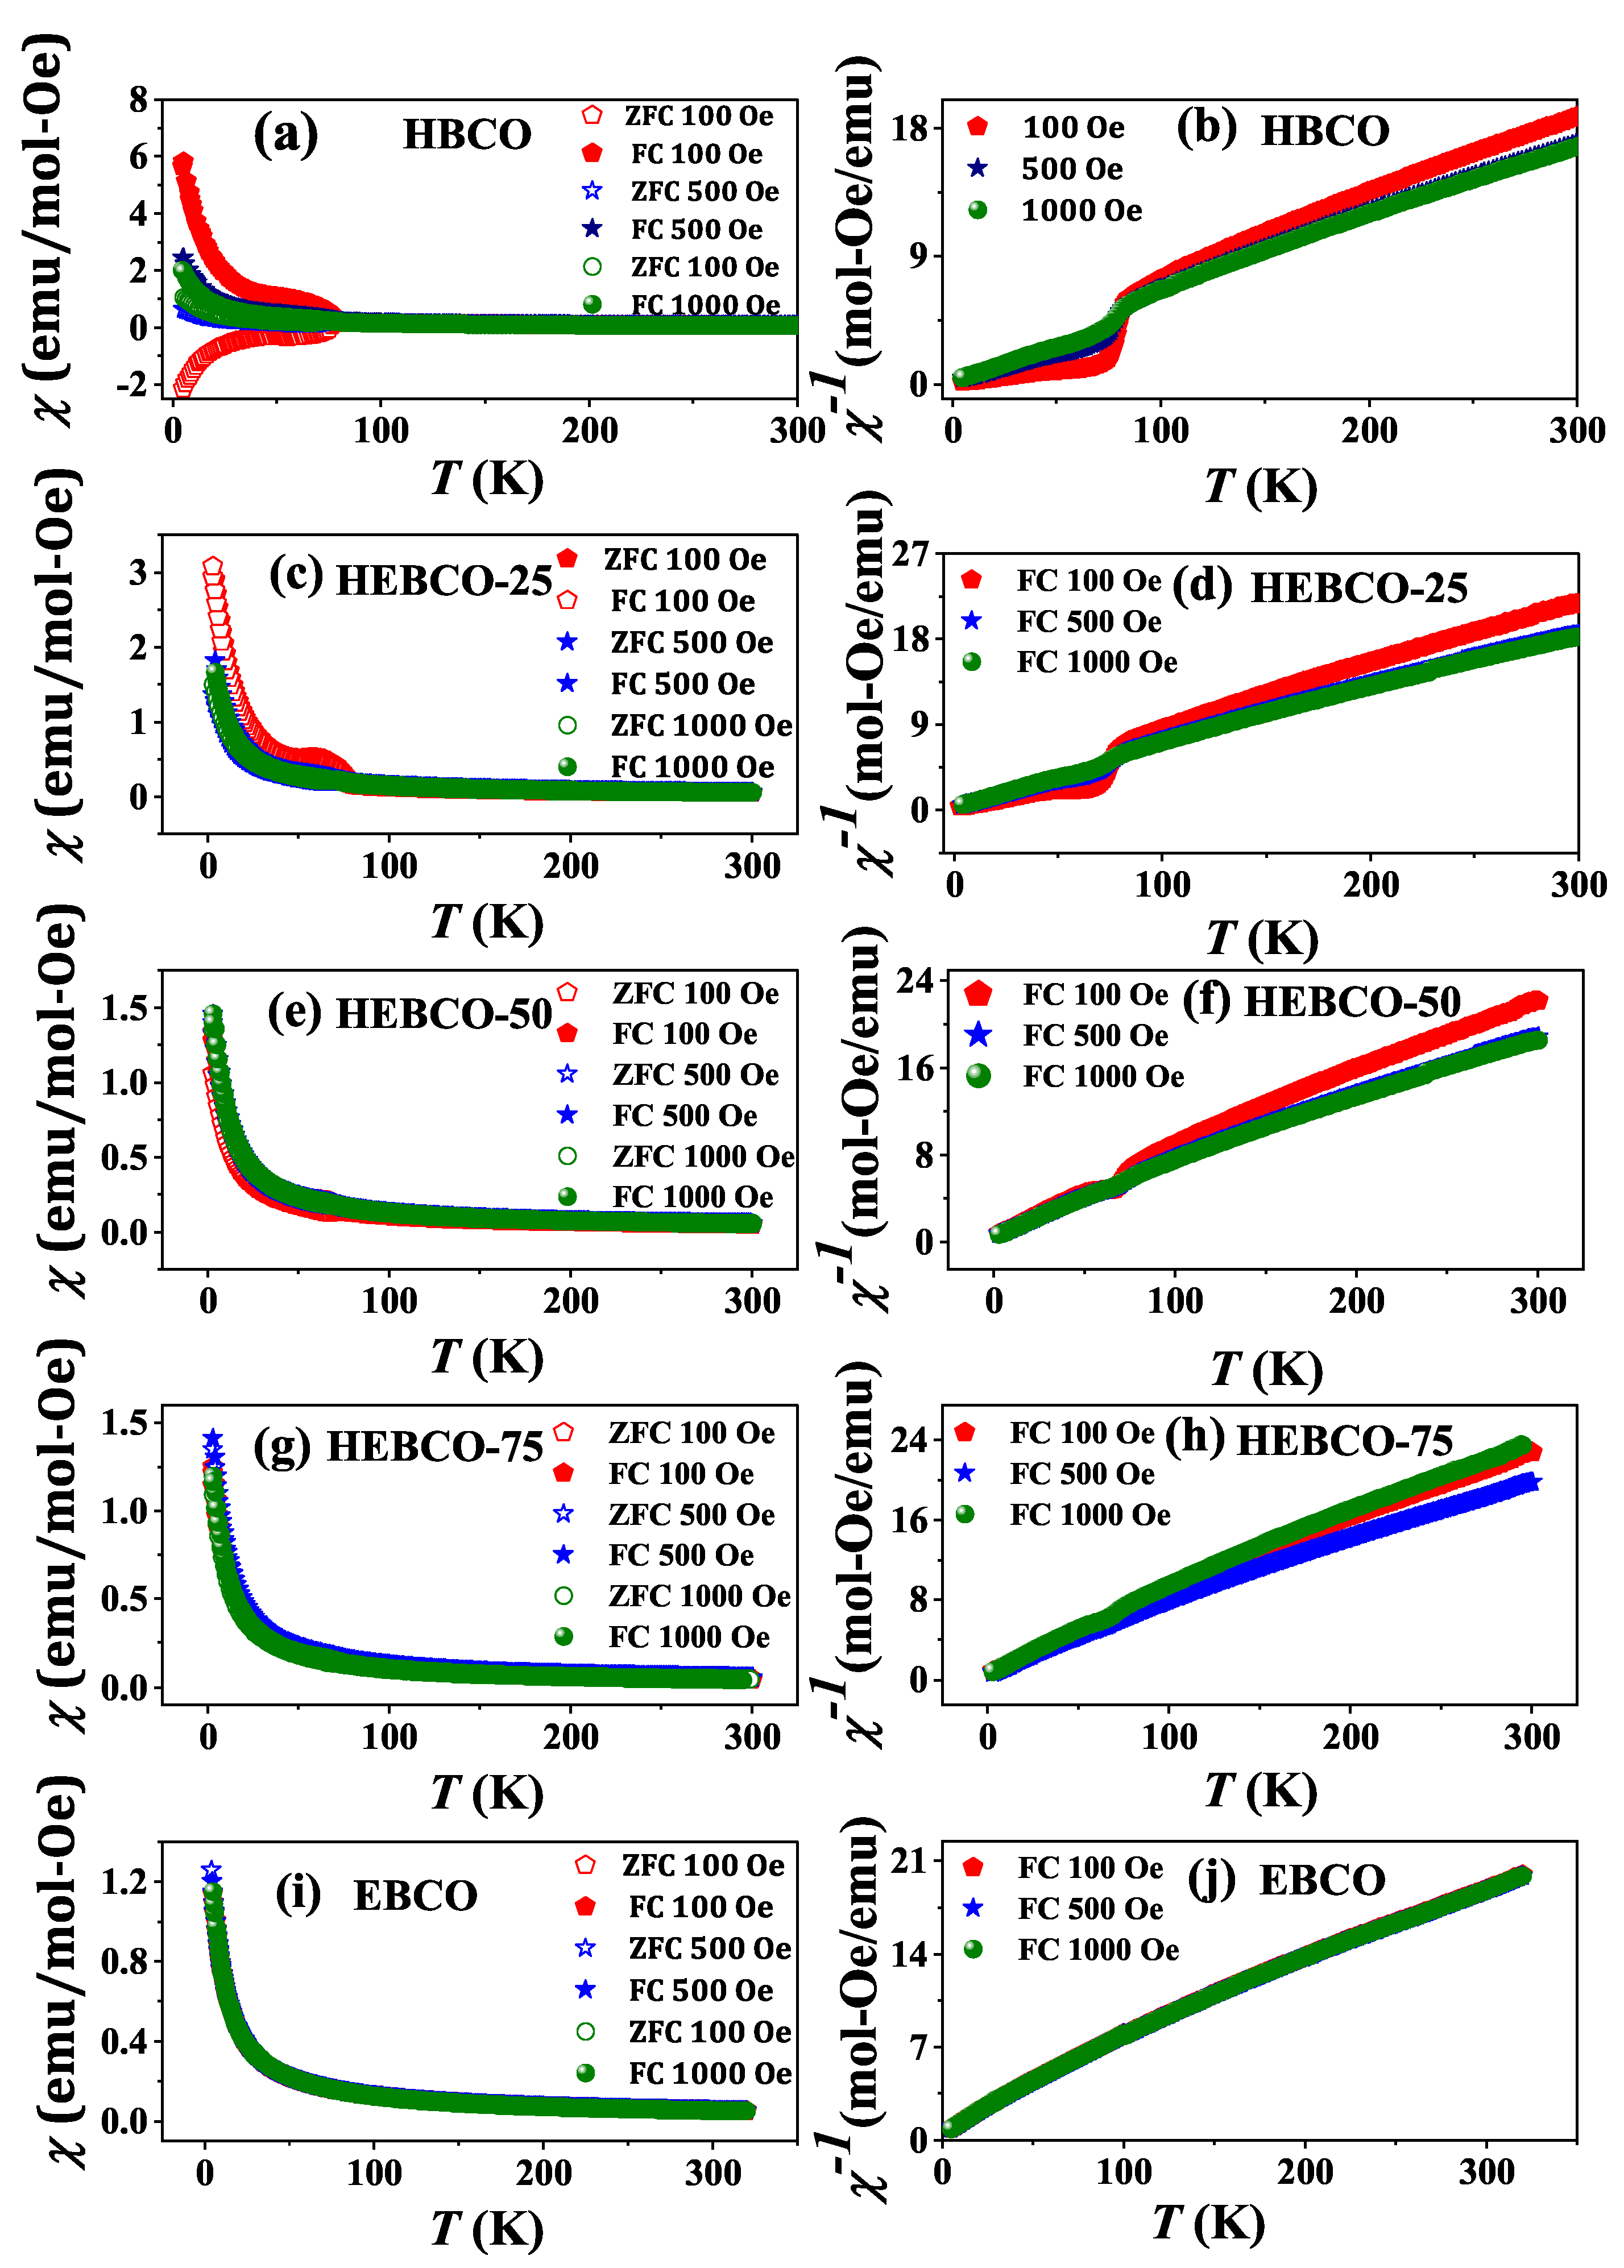
3.2. Magnetic Properties

In order to understand the Griffiths phase behavior, we focused on probing the evolution of magnetic properties of Ho 1 x Er x BaCo 4 O 7 + δ as a function of doping. Therefore, the temperature dependence of the d c magnetic susceptibility ( χ ) for all the compounds was examined in the zero-field cooled (ZFC) and field-cooled (FC) protocols over the temperature range of 2 to 320 K (see Figure 4). The χ ( T ) data of the compounds are shown in the left panels of Figure 4, while the χ 1 (T) data are all presented in the corresponding right panels. The graph of HBCO (x = 0) shows a hump-shaped anomaly at a temperature of nearly 70 K in both the ZFC and FC measurements. Severe bifurcation between FC and ZFC data is also observed under low magnetic field conditions, which develops from 80 K and persists down to the lowest measuring temperature of 2 K. The bifurcation gets suppressed by increasing the magnetic field to 1000 Oe. Next, the data is fitted using the Curie–Weiss equation χ = χ 0 + C T θ C W , where χ 0 is the temperature-independent paramagnetic susceptibility, C is the Curie constant related to the effective moment, and θ C W is the Weiss constant. The 1000 Oe FC data are fitted over the temperature range of 115–300 K, and the value of θ C W was found to be −11.64 K, indicating antiferromagnetic nearest-neighbor interaction between the cobalt spins. The effective moment of the system is found to be μ e f f = 11.12 μ B , which is less than the theoretically calculated value (13.47 μ B ) for the whole system considering the high spin state of cobalt in the tetrahedral environment. The ratio of Co ions in the crystal is Co 2 + : Co 3 + = 3:1 (mean valence +2.25), and all Co ions are in a tetrahedral environment, which is in good agreement with XANES results. The moment values have been calculated considering both the low-spin (LS) state and high-spin (HS) states of cobalt, as shown in Table 2, from which we can see the difference between the calculated and experimental moment values. This difference may arise because of several factors, including covalency effects between Co–O bonds, spin-state fluctuations of Co ions, and local lattice distortions that can stabilize intermediate spin states.
Interestingly, the anomalous hump correspondingly translates to a downward deviation in χ 1 (T) (see Figure 4b) of HBCO, typical of Griffiths-like systems having ferromagnetic ’rare regions’, different from global AFM interactions. This deviation gradually gets suppressed with increasing applied magnetic field from 100 to 1000 Oe. Such a downward deviation and suppression within the field is a signature of the presence of ferromagnetically polarized clusters within the overall paramagnetic regime, and it can also be attributed to the polarization of spins outside of FM clusters [12,14,18]. The existence of rare regions in the systems drastically affects the dynamics of magnetic susceptibility. In the high-temperature paramagnetic regime, the system exhibits an exponential decay of magnetic susceptibility consistent with the overall paramagnetic configuration. However, the Griffiths phase system requires a longer duration for magnetically ordered clusters, leading to non-exponential decay. The spin-autocorrelation function experiences non-exponential decay because of this effect [34]. If we consider diluted ferromagnetic systems, this decay can be calculated using the relation e [ A ( ln t d d 1 ) ] and e B t 0.5 , for Ising and Heisenberg spin systems, respectively [35] here B characterizes the rate at which correlations decay over time in Heisenberg spin systems, with larger values indicating faster decay. Here, in the expression, d indicates the spatial dimension, t is the time, and A represents a system-dependent parameter that characterizes the rate of decay of the spin-autocorrelation function. To understand the type of interaction, we have carried out isothermal remanent magnetization (IRM) measurement in the Griffiths phase region (nearly about 80 K) and observed the relaxation behavior as a function of time (see Figure 5a). The IRM data could be fitted well using the stretched exponential function, e B t 0.5 below T G (Griffiths temperature), signifying the presence of magnetic clusters [36,37] and the Heisenberg-like interaction between them. On the other hand, the inverse susceptibility ( χ 1 ) follows the power law behavior: ( T T 0 ) 1 λ , where λ is the magnetic susceptibility exponent and T 0 is the critical temperature of the random ferromagnetic cluster at which the susceptibility diverges (Figure 5b), as is expected in Griffiths phase systems. However, the power dependence is known to have a field dependence and varies regularly ( 0 < λ < 1 ) depending on the applied magnetic field [9,14].
However, in EBCO (x = 1.0), such an anomaly disappears in the d c magnetization data. Field-dependent magnetic susceptibility clearly indicates a paramagnet-like behavior in the system without having any signature of ZFC and FC divergence. Field-cooled χ ( T ) data at 1000 Oe enables a reliable Curie–Weiss fitting within the 160 to 320 K temperature range. The Weiss constant of EBCO turned out to be θ C W = −5.65 K, which once again supports the presence of antiferromagnetic-like (AFM) interaction between Co atoms, albeit of lower strength. The effective magnetic moment of EBCO has been found to be μ e f f = 9.90 μ B , which once again turns out to be lower than the theoretically calculated moment values, even less than the value obtained by considering the low-spin state of Co.
In order to understand the reason behind the disappearance of the Griffiths phase in EBCO, d c magnetic measurements of the remaining compounds of the series were also performed. While the χ (T) curve of Ho 0.75 Er 0.25 BaCo 4 O 7 + δ (HEBCO-25) appears almost similar to HBCO, with increasing Er content, the anomaly seems to get gradually suppressed. Even for the x = 0.25 system, there is an indication that the Griffiths phase is shrinking with the introduction of Er in place of Ho in the system. As the gradual shrinking of Griffiths-like signature with Er-doping becomes clear from Figure 4, the regular drop-in μ e f f could also be visibly tracked (Table 2).
The disappearance of the Griffiths-like phase in the Ho 1 x Er x BaCo 4 O 7 + δ system is driven by changes in structural distortions and, consequently, magnetic frustration strengths, which likely modify the equilibrium between interlayer and intralayer interactions. The parallel arrangement of kagome and triangular layers induces competing intra- and interlayer interactions, along with disorder, which may lead to the formation of short-range magnetic clusters characteristic of a Griffiths phase [22,24,25]. The substitution of Ho 3 + with Er 3 + induces a lattice contraction, modifying the Co-O bond lengths and angles, thereby changing the intra- and interlayer competition, which probably adversely affects the formation of magnetic clusters, leading to the suppression of the Griffiths-like anomaly at x = 1. However, it has been mentioned earlier that we could not demonstrate this by XAFS changes in Co-O coordination, and instead, XANES demonstrates a very equal Co environment, which suggests that the effect mainly originates from next-neighbor intra- or inter-layer interactions, influenced by Ho/Er cations instead of local distortions around Co.

4. μ SR Measurement

In order to precisely understand the nature of the magnetic states of the HoBaCo 4 O 7 + δ and also ErBaCo 4 O 7 + δ samples at the microscopic level, we have performed zero-field μ SR experiments. The μ SR technique, which involves spin-polarized positive muons μ + implanted in the sample is highly sensitive [38] to the local magnetic environment. We have performed μ SR measurements using the MUSR spectrometer at the ISIS facility, where spin-polarized positive muons with lifetime τ μ = 2.2 μ s and a gyromagnetic ratio γ μ = 2 π × 135.5 MHz T 1 were implanted into randomly oriented polycrystalline samples. The asymmetry of the positron emission A(t) is directly related to the muon spin polarization P(t) just before the muon decay; this experiment provides reliable information about the magnetic ground state of the sample and internal magnetic fields [31,39,40,41,42].
The time evolution of the asymmetry A(t) measured in zero magnetic field (ZF mode) is shown for some temperatures in Figure 6. For the EBCO sample, all data could be fitted using a stretched exponential function: A ( t ) = A 0 + A 1 · exp [ ( λ · t ) β ] . In contrast, for the HBCO sample, the evolution of the asymmetry is more complex and two different fitting functions were used depending on the temperature range. For the high-temperature paramagnetic regime (80 K–250 K), we could also use a single stretched exponential function A ( t ) = A 0 + A 1 · exp [ ( λ · t ) β ] . At variance, for the low-temperature range (10 K–76 K), the function used was A ( t ) = A 0 + A 1 · 2 3 · exp ( λ · t ) β + 1 3 · exp ( λ · t ) β , where the so-called ‘1/3 tail’ is characteristic of quasi-static magnetism in a polycrystalline sample. In these fitting functions, A ( t ) is the time-dependent muon asymmetry, A 0 is the background asymmetry, A 1 is the amplitude of the relaxing asymmetry from the sample, λ and λ are the muon depolarization rates, and β and β are the stretched parameters that provide information about the distribution of local magnetic environments. Figure 6b,c,e,f illustrate the temperature dependence of λ and β for the HBCO and EBCO.
At 250 K, the two compounds show β 1 , indicating a conventional paramagnetic state with an exponential relaxation [43,44] consistent with d c magnetic susceptibility data. As the temperature is reduced to about 100 K, still in the paramagnetic phase, the parameter β decreases, and the relaxation rate increases significantly and quite similarly for the two compounds. Because of the limited time resolution at the ISIS pulsed muon source, this very fast relaxation appears as a “loss” of the early-time asymmetry [45]. The gradual development of a fast relaxation in the asymmetry curves signifies that magnetic correlations are growing, yielding a distribution of magnetic environments witnessed by the decrease in β . This behavior possibly manifests the combined effect of magnetic correlations of Ho-Co and Co-Co and also the slowing down of the Ho large spin fluctuations. It is interesting to note the similarity in the muon spin relaxation ( μ SR) spectra for HoBaCo 4 O 7 + δ (HBCO) and ErBaCo 4 O 7 + δ (EBCO) above 80 K, consistent with d c magnetic susceptibility data. This suggests that in this temperature range, the magnetic behavior and muon response are primarily determined by the Co 4 O 7 framework rather than by the rare-earth magnetic moments (Ho or Er), and consistent with the nearly unchanged local Co environment revealed by XANES, the relaxation rates are observed to remain essentially the same for both compounds.
On the contrary, the low-temperature behaviors depend strongly on the rare earth. In the Ho compound, below the transition temperature, the long-time asymmetry increases to about 1 3 rd of the initial asymmetry, in line with static magnetism in a powder sample. Note that the low early time resolution likely prevents the observation of fast spontaneous oscillations if present. The observed sharp decrease in the β value below 75 K also correlates with the breakdown of Curie–Weiss behavior. The value of β 0.5 indicates a strong inhomogeneity typical of the Griffiths phase. More surprisingly, at still lower temperatures, the 1 3 th tail vanishes, signaling the re-entry of a slow dynamical behavior. This suggests the approach to a second transition, which takes place at a lower temperature. A possible scenario could be that, due to weak Co-Ho coupling, the Co gets first magnetically ordered, while the Ho spins order at a lower temperature. At variance and in line with the susceptibility data, there is no sign of a magnetic transition down to 10 K in the Er counterpart, but just a monotonic increase in the relaxation. Nonetheless, the relaxation shoots up around 80 K, suggesting that a strong short-range correlation builds up in the same energy range. Only at the lowest 1.6 K temperature may a slight decrease in the relaxation signal a magnetic transition.
Thus, despite the disappearance of the Griffiths phase in EBCO, the fundamental spin dynamics, driven by cobalt valency and exchange interactions, remain within the same μ SR detection window, leading to nearly identical spectra above 80 K. At a lower temperature, most of the relaxation is lost due to the pulsed muon source at ISIS preventing a comprehensive study of the ground states. Further experiments at a continuous muon source in the mixed Ho-Er compounds would be insightful for investigating the detailed evolution of local magnetic correlations and the dynamics of spin clusters across the composition range, particularly near the disappearance of the Griffiths phase.

5. Conclusions

In conclusion, we studied the development of the Griffiths-like anomaly within the iso-structural Swedenborgite compounds Ho 1 x Er x BaCo 4 O 7 + δ . We used systematic structural, magnetic, and local probe measurements ( μ SR) to demonstrate that HoBaCo 4 O 7 + δ features a Griffiths-like phase, but this phase gradually vanishes as Er concentrations increase. XRD and XANES results confirm the structural integrity of the compounds, while dc magnetization data reveal that Er doping eliminates the Griffiths phase behavior. Local-scale inhomogeneous magnetism remains detectable by μ SR, although the anomaly disappears in macroscopic observations. The nearly unchanged coordination environment and valence state of Co in the end members, along with the similar μ SR relaxation rates, indicate that distortions of the CoO 4 units play a minor role. Instead, these results suggest that interlayer connectivity and weak magnetic frustration are the primary factors governing the suppression of the Griffiths phase in EBCO. The results establish the role of intermediate-scale interactions as essential factors in stabilizing Griffiths phase behavior in such frustrated antiferromagnetic materials. Finally, the downward deviation in the inverse DC susceptibility (at 100 K) might suggest the emergence of ferromagnetic clusters. Interestingly, it is the same temperature region around which the μ SR asymmetry curves, as well as the fitting parameters, unveil sudden changes. On the other hand, our Curie–Weiss analysis of the DC susceptibility data reveals the existence of considerable antiferromagnetic interactions. At this point, we may qualitatively argue the emergence of ferromagnetic clusters within a predominantly antiferromagnetic matrix in both of these compounds.

Supplementary Materials

The following supporting information can be downloaded at: https://www.mdpi.com/article/10.3390/magnetochemistry11070055/s1, Figure S1: Rietveld-refined X-ray diffraction (XRD) pattern of the sample. The observed data are shown as green circles, the calculated pattern as a black line, the difference curve as a blue line, and the Bragg reflection positions as purple vertical ticks. The close match between the observed and calculated patterns confirms the phase purity and reliability of the structural model. Table S1: Refinement parameters obtained from Rietveld analysis of Ho 1 x Er x BaCo 4 O 7 samples ( x = 0.0 , 0.25, 0.5, 0.75, 1.0). R wp and R exp denote the weighted profile and expected R-factors, respectively, and χ 2 represents the goodness-of-fit. The values indicate good agreement between the observed and calculated diffraction profiles across the series.

Author Contributions

B.P. carried out most of the experiments and prepared the manuscript. R.A.S. conceived the project and initiated the experimental work. C.M. carried out the XAS and EXAFS experiments and analysis, and also contributed to drafting the manuscript. F.B. assisted in carrying out the μ SR experiments and their analysis. S.K. participated in the laboratory experiments. S.R. conceived the project, supervised the work overall, and finalized the manuscript. All authors have read and agreed to the published version of the manuscript.

Funding

S.R. acknowledges the Science and Engineering Research Board (SERB), DST, India (Project no. CRG/2023/001060), for their funding. S.R. also thanks the UGC-DAE CSR scheme (CRS/2023-24/1646). The authors are grateful to the Technical Research Centre (TRC) and the Indian Association for the Cultivation of Science, Kolkata, for their research support. C.M. acknowledges the Grant of Excellence Departments MIUR (ARTICOLO 1, COMMI 314-337 LEGGE 232/2016).

Institutional Review Board Statement

Not applicable.

Informed Consent Statement

Not applicable.

Data Availability Statement

The original contributions presented in this study are included in the article. Further inquiries can be directed to the corresponding author.

Acknowledgments

B.P. thanks IACS for supporting the fellowship and Department of Central Scientific Services (CSS) and Technical Research Center (TRC) of IACS for providing experimental facilities. The authors also acknowledge the ISIS muon facility, UK, for providing resources for the μ SR measurements and help from Adrian Hiller and Peter Baker during the measurements.

Conflicts of Interest

The authors declare no conflicts of interest.

References

  1. Grinstein, G. Fundamental Problems in Statistical Mechanics VI, 4th ed.; Elsevier: New York, NY, USA, 1985. [Google Scholar]
  2. Vojta, T. Disorder-Induced Rounding of Certain Quantum Phase Transitions. Phys. Rev. Lett. 2003, 90, 107202. [Google Scholar] [CrossRef]
  3. Griffiths, R.B. Nonanalytic Behavior Above the Critical Point in a Random Ising Ferromagnet. Phys. Rev. Lett. 1969, 23, 17–19. [Google Scholar] [CrossRef]
  4. McCoy, B.M. Incompleteness of the Critical Exponent Description for Ferromagnetic Systems Containing Random Impurities. Phys. Rev. Lett. 1969, 23, 383–386. [Google Scholar] [CrossRef]
  5. Deisenhofer, J.; Braak, D.; Krug von Nidda, H.A.; Hemberger, J.; Eremina, R.M.; Ivanshin, V.A.; Balbashov, A.M.; Jug, G.; Loidl, A.; Kimura, T.; et al. Observation of a Griffiths Phase in Paramagnetic La1-xSrxMnO3. Phys. Rev. Lett. 2005, 95, 257202. [Google Scholar] [CrossRef]
  6. Jiang, W.; Zhou, X.; Williams, G.; Mukovskii, Y.; Glazyrin, K. Griffiths phase and critical behavior in single-crystal La0.7Ba0.3MnO3: Phase diagram for La1-xBaxMnO3 (x⩽0.33). Phys. Rev. B 2008, 77, 064424. [Google Scholar] [CrossRef]
  7. Zhou, S.; Guo, Y.; Zhao, J.; He, L.; Shi, L. Size-induced Griffiths phase and second-order ferromagnetic transition in Sm0.5Sr0.5MnO3 nanoparticles. J. Phys. Chem. C 2011, 115, 1535–1540. [Google Scholar] [CrossRef]
  8. Pramanik, A.K.; Banerjee, A. Griffiths phase and its evolution with Mn-site disorder in the half-doped manganite Pr0.5Sr0.5Mn1-yGayO3 (y=0.0, 0.025, and 0.05). Phys. Rev. B 2010, 81, 024431. [Google Scholar] [CrossRef]
  9. Castro Neto, A.H.; Castilla, G.; Jones, B.A. Non-Fermi Liquid Behavior and Griffiths Phase in f-Electron Compounds. Phys. Rev. Lett. 1998, 81, 3531–3534. [Google Scholar] [CrossRef]
  10. Zhang, H.; Wang, Y.; Wang, H.; Huo, D.; Tan, W. Room-temperature magnetoresistive and magnetocaloric effect in La1-xBaxMnO3 compounds: Role of Griffiths phase with ferromagnetic metal cluster above Curie temperature. J. Appl. Phys. 2022, 131, 043901. [Google Scholar] [CrossRef]
  11. Pereira, A.M.; Morellon, L.; Magen, C.; Ventura, J.; Algarabel, P.A.; Ibarra, M.R.; Sousa, J.B.; Araújo, J.P. Griffiths-like phase of magnetocaloric R5(SixGe1-x)4 (R=Gd, Tb, Dy, and Ho). Phys. Rev. B 2010, 82, 172406. [Google Scholar] [CrossRef]
  12. Krivoruchko, V.N. The Griffiths phase and the metal-insulator transition in substituted manganites (Review Article). Low Temp. Phys. 2014, 40, 586–599. [Google Scholar] [CrossRef]
  13. Magen, C.; Algarabel, P.A.; Morellon, L.; Araújo, J.P.; Ritter, C.; Ibarra, M.R.; Pereira, A.M.; Sousa, J.B. Observation of a Griffiths-like Phase in the Magnetocaloric Compound Tb5Si2Ge2. Phys. Rev. Lett. 2006, 96, 167201. [Google Scholar] [CrossRef]
  14. Ghosh, K.; Mazumdar, C.; Ranganathan, R.; Mukherjee, S. Griffiths phase behaviour in a frustrated antiferromagnetic intermetallic compound. Sci. Rep. 2015, 5, 15801. [Google Scholar] [CrossRef] [PubMed]
  15. Lin, J.; Tong, P.; Cui, D.; Yanh, J.; Lin, S.; Wang, B.; Tong, W.; Zhang, L.; Zou, Y.; Sun, Y. Unusual ferromagnetic critical behavior owing to short-range antiferromagnetic correlations in antiperovskite Cu1-xNMn3+x (0.1 ≤ x ≤ 0.4). Sci. Rep. 2015, 5, 7933. [Google Scholar] [CrossRef]
  16. Ubaid-Kassis, S.; Vojta, T.; Schroeder, A. Quantum Griffiths Phase in the Weak Itinerant Ferromagnetic Alloy Ni1-xVx. Phys. Rev. Lett. 2010, 104, 066402. [Google Scholar] [CrossRef]
  17. Wang, R.; Gebretsadik, A.; Ubaid-Kassis, S.; Schroeder, A.; Vojta, T.; Baker, P.J.; Pratt, F.L.; Blundell, S.J.; Lancaster, T.; Franke, I.; et al. Quantum Griffiths Phase Inside the Ferromagnetic Phase of Ni1-xVx. Phys. Rev. Lett. 2017, 118, 267202. [Google Scholar] [CrossRef] [PubMed]
  18. Ahad, A.; Shukla, D.; Rahman, F.; Gautam, K.; Dey, K.; Majid, S.; Sharma, S.; Coaquira, J. Griffiths-like phase and charge-spin glass state in La1.5Sr0.5CoO4. Appl. Phys. Lett. 2018, 113, 102405. [Google Scholar] [CrossRef]
  19. Lu, C.L.; Wang, K.F.; Dong, S.; Wan, J.G.; Liu, J.M.; Ren, Z.F. Specific heat anomalies and possible Griffiths-like phase in La0.4Ca0.6MnO3 nanoparticles. J. Appl. Phys. 2008, 103, 07F714. [Google Scholar] [CrossRef]
  20. Ouyang, Z.W.; Xia, N.M.; Wu, Y.Y.; Sheng, S.S.; Chen, J.; Xia, Z.C.; Li, L.; Rao, G.H. Short-range ferromagnetic correlations in the spin-chain compound Ca3CoMnO6. Phys. Rev. B 2011, 84, 054435. [Google Scholar] [CrossRef]
  21. Kumar, J.; Panja, S.N.; Dengre, S.; Nair, S. Identification of a Griffiths singularity in a geometrically frustrated antiferromagnet. Phys. Rev. B 2017, 95, 054401. [Google Scholar] [CrossRef]
  22. Khalyavin, D.D.; Manuel, P.; Mitchell, J.F.; Chapon, L.C. Spin correlations in the geometrically frustrated RBaCo4O7 antiferromagnets: Mean-field approach and Monte Carlo simulations. Phys. Rev. B 2010, 82, 094401. [Google Scholar] [CrossRef]
  23. Raveau, B. The crucial role of mixed valence in the magnetoresistance properties of manganites and cobaltites. Philos. Trans. R. Soc. A Math. Phys. Eng. Sci. 2007, 366, 83–92. [Google Scholar] [CrossRef]
  24. Chapon, L.C.; Radaelli, P.G.; Zheng, H.; Mitchell, J.F. Competing magnetic interactions in the extended Kagomé system YBaCo4O7. Phys. Rev. B 2006, 74, 172401. [Google Scholar] [CrossRef]
  25. Buhrandt, S.; Fritz, L. Antiferromagnetic Ising model on the swedenborgite lattice. Phys. Rev. B 2014, 90, 094415. [Google Scholar] [CrossRef]
  26. Gao, S.; Kocsis, V.; Soda, M.; Ye, F.; Liu, Y.; May, A.F.; Taguchi, Y.; Tokura, Y.; Arima, T.h.; Schweika, W.; et al. Suppressed incommensurate order in swedenborgite Ca0.5Y0.5BaCo4O7. Phys. Rev. B 2021, 104, L140408. [Google Scholar] [CrossRef]
  27. Schweika, W.; Valldor, M.; Reim, J.D.; Rößler, U.K. Chiral Spin Liquid Ground State in YBaCo3FeO7. Phys. Rev. X 2022, 12, 021029. [Google Scholar] [CrossRef]
  28. Kazei, Z.A.; Snegirev, V.V.; Stolyarenko, M.S. Phase Transitions in Frustrated Slightly Nonstoichiometric ErBaCo4O7 + x (x≈ 0 and 0.03) Cobaltites. JETP Lett. 2020, 112, 180–185. [Google Scholar] [CrossRef]
  29. Kazei, Z.A.; Snegirev, V.V.; Stolyarenko, M.S. Phase Transitions in Frustrated ErBaCo4O7 + x (x = 0–0.06) Cobaltites at a Small Deviation from Stoichiometry. J. Exp. Theor. Phys. 2021, 133, 591–598. [Google Scholar] [CrossRef]
  30. Rodríguez-Carvajal, J. Recent advances in magnetic structure determination by neutron powder diffraction. Phys. B Condens. Matter 1993, 192, 55–69. [Google Scholar] [CrossRef]
  31. Huq, A.; Mitchell, J.; Zheng, H.; Chapon, L.; Radaelli, P.; Knight, K.; Stephens, P. Structural and magnetic properties of the Kagomé antiferromagnet YbBaCo4O7. J. Solid State Chem. 2006, 179, 1136–1145. [Google Scholar] [CrossRef]
  32. Avci, S.; Chmaissem, O.; Zheng, H.; Huq, A.; Manuel, P.; Mitchell, J.F. Oxygen Stoichiometry in the Geometrically Frustrated Kagomé System YBaCo4O7+δ: Impact on Phase Behavior and Magnetism. Chem. Mater. 2013, 25, 4188–4196. [Google Scholar] [CrossRef]
  33. Schiesaro, I.; Battocchio, C.; Venditti, I.; Prosposito, P.; Burratti, L.; Centomo, P.; Meneghini, C. Structural characterization of 3d metal adsorbed AgNPs. Phys. E Low-Dimens. Syst. Nanostruct. 2020, 123, 114162. [Google Scholar] [CrossRef]
  34. Randeria, M.; Sethna, J.P.; Palmer, R.G. Low-Frequency Relaxation in Ising Spin-Glasses. Phys. Rev. Lett. 1985, 54, 1321–1324. [Google Scholar] [CrossRef] [PubMed]
  35. Bray, A.J. Dynamics of dilute magnets above Tc. Phys. Rev. Lett. 1988, 60, 720–723. [Google Scholar] [CrossRef]
  36. Bray, A.J. Nature of the Griffiths phase. Phys. Rev. Lett. 1987, 59, 586–589. [Google Scholar] [CrossRef] [PubMed]
  37. Vazquez, F.; Bonachela, J.A.; López, C.; Muñoz, M.A. Temporal Griffiths Phases. Phys. Rev. Lett. 2011, 106, 235702. [Google Scholar] [CrossRef] [PubMed]
  38. Blundell, S.J. Spin-polarized muons in condensed matter physics. Contemp. Phys. 1999, 40, 175–192. [Google Scholar] [CrossRef]
  39. Ryan, D.H.; van Lierop, J.; Cadogan, J.M. Zero-field muon spin relaxation studies of frustrated magnets: Physics and analysis issues. J. Phys. Condens. Matter 2004, 16, S4619–S4638. [Google Scholar] [CrossRef]
  40. de Réotier, P.D.; Yaouanc, A. Muon spin rotation and relaxation in magnetic materials. J. Phys. Condens. Matter 1997, 9, 9113–9132. [Google Scholar] [CrossRef]
  41. Sannigrahi, J.; Pramanick, S.; Chatterjee, S.; Lord, J.S.; Khalyavin, D.; Hillier, A.D.; Adroja, D.T.; Majumdar, S. Magnetic states of Ni-Mn-Sn based shape memory alloy: A combined muon spin relaxation and neutron diffraction study. Phys. Rev. B 2019, 99, 224401. [Google Scholar] [CrossRef]
  42. Lee, S.; Lee, W.; Lee, K.J.; Kim, B.; Suh, B.J.; Zheng, H.; Mitchell, J.F.; Choi, K.Y. Muon spin relaxation study of spin dynamics in the extended kagome systems YBaCo4O7+δ(δ=0,0.1). Phys. Rev. B 2018, 97, 104409. [Google Scholar] [CrossRef]
  43. Teyssier, J.; Giannini, E.; Guritanu, V.; Viennois, R.; van der Marel, D.; Amato, A.; Gvasaliya, S.N. Spin-glass ground state in Mn1-xCoxSi. Phys. Rev. B 2010, 82, 064417. [Google Scholar] [CrossRef]
  44. Uemura, Y.J.; Harshman, D.R.; Senba, M.; Ansaldo, E.J.; Murani, A.P. Zero-field muon-spin relaxation in CuMn spin-glasses compared with neutron and susceptibility experiments. Phys. Rev. B 1984, 30, 1606–1608. [Google Scholar] [CrossRef]
  45. Tripathi, R.; Das, D.; Biswas, P.K.; Adroja, D.T.; Hillier, A.D.; Hossain, Z. Quantum Griffiths phase near an antiferromagnetic quantum critical point: Muon spin relaxation study of Ce(Cu 1-xCox)2Ge2. Phys. Rev. B 2019, 99, 224424. [Google Scholar] [CrossRef]
Figure 1. (ae) Rietveld refined XRD pattern of Ho 1 x Er x BaCo 4 O 7 + δ (x = 0.0, 0.25, 0.50, 0.75, 1.0). Green open circles represent the experimental data, and the solid black line represents the calculated pattern. The blue line represents the difference between the observed and calculated pattern, while magenta vertical lines signify the positions of the Bragg peaks.
Magnetochemistry 11 00055 g001
Figure 2. (a) Refined crystal structure of HEBCO. (b) Co1 network (light orange network) form triangular layer, while three Co2 form kagome network (blue network). (c,d) panels show Kagome and triangular layer, respectively, while panel (e) shows one Co1 and three Co2 forming tetrahedra where two tetrahedra are connected with single Co1.
Magnetochemistry 11 00055 g002
Figure 3. Normalized Co K-edge XANES spectra measured on EBCO (violet) and HBCO (cyan) samples and on reference compounds: Co-metal (black), CoO (red), and Co 3 O 4 (orange). The inset highlight the pre-edge region for sake of comparison.
Magnetochemistry 11 00055 g003
Figure 4. Temperature−dependent dc magnetic susceptibility χ ( T ) and inverse susceptibility χ 1 ( T ) for Ho 1 x Er x BaCo 4 O 7 + δ measured under different applied magnetic fields in both zero-field-cooled (ZFC) and field-cooled (FC) modes. (a,b) HoBaCo 4 O 7 + δ , (c,d) Ho 0.75 Er 0.25 BaCo 4 O 7 + δ , (e,f) Ho 0.50 Er 0.50 BaCo 4 O 7 + δ , (g,h) Ho 0.25 Er 0.75 BaCo 4 O 7 + δ , and (i,j) ErBaCo 4 O 7 + δ . Measurements were performed at applied magnetic fields of 100 Oe, 500 Oe, and 1000 Oe. The χ 1 ( T ) plots indicate deviations from Curie–Weiss behavior with increasing Er concentration.
Magnetochemistry 11 00055 g004
Figure 5. (a) Isothermal remanent magnetization (IRM) relaxation as a function of time for HBCO at 85 K, fitted with a stretched exponential function ( y = exp ( B t β ) ) with ( β = 0.5 ). (b) Log−log plot of inverse susceptibility ( χ 1 ) vs. reduced temperature ( T T 0 ) at 100 Oe, showing power−law behavior with an exponent ( λ = 0.34 ).
Magnetochemistry 11 00055 g005
Figure 6. (a) Time evolution of the muon spin polarization in HBCO under zero external field at different temperatures. Solid lines represent fits using the functions described in the text. (b,c) Temperature dependence of the fitting parameters: relaxation rate ( λ ) and stretched exponent ( β ), respectively, for HBCO. (d) Time evolution of the muon spin polarization in EBCO in zero external field at selected temperatures, with fits shown as solid lines. (e,f) Temperature dependence of the fitting parameters λ and β for EBCO, respectively. The fitting functions used in each case are detailed in the text.
Magnetochemistry 11 00055 g006
Table 1. Structural parameters and oxygen non-stoichiometry ( δ ) of Ho 1 x Er x BaCo 4 O 7 + δ for different values of x.
Parameter Ho 1 x Er x BaCo 4 O 7 + δ
x = 0.0 x = 0.25 x = 0.50 x = 0.75 x = 1.0
δ 0.120.150.090.120.09
Space groupP31cP31cP31cP31cP31c
a (Å)6.303 (1)6.30 (1)6.29 (7)6.29 (4)6.29 (1)
b (Å)6.30 (7)6.30 (1)6.29 (7)6.29 (4)6.29 (1)
c (Å)10.24 (7)10.24 (4)10.24 (2)10.23 (5)10.24 (2)
Table 2. Comparison of theoretical and experimental effective magnetic moments for Ho 1 x Er x BaCo 4 O 7 + δ series. Calculations consider different spin states of Co 2 + and Co 3 + .
Sample Ho 3 + & Er 3 + Co 2 + Co 3 + (LS) Co 3 + (HS)Cal. Value (HS)Cal. Value (LS)Expt. Value
x = 010.613.872.824.913.4712.9711.12
x = 0.2510.353.872.824.913.2712.7710.55
x = 0.5010.093.872.824.913.0812.5610.27
x = 0.759.833.872.824.912.8812.3610.10
x = 1.09.583.872.824.912.6712.149.90
Disclaimer/Publisher’s Note: The statements, opinions and data contained in all publications are solely those of the individual author(s) and contributor(s) and not of MDPI and/or the editor(s). MDPI and/or the editor(s) disclaim responsibility for any injury to people or property resulting from any ideas, methods, instructions or products referred to in the content.

