Article

Effects of Sulfate on the Physiology, Biochemistry, and Activity of Group 1 Sulfate Transporters in Seedlings of Brassica pekinensis

1
Department of Biotechnology, Smt. S.S. Patel Nootan Science and Commerce College, Sankalchand Patel University, Visnagar 384315, Gujarat, India
2
Laboratory of Plant Physiology, Groningen Institute for Evolutionary Life Sciences, University of Groningen, P.O. Box 11103, 9700 Groningen, The Netherlands
3
Department of Life Sciences, Hemchandracharya North Gujarat University, Patan 384265, Gujarat, India
4
Department of Zoology, College of Science, King Saud University, P.O. Box 2455, Riyadh 11451, Saudi Arabia
5
Department of Biosciences, Saurashtra University, Rajkot 360005, Gujarat, India
*
Authors to whom correspondence should be addressed.
Horticulturae 2023, 9(7), 821; https://doi.org/10.3390/horticulturae9070821
Submission received: 8 June 2023 / Revised: 13 July 2023 / Accepted: 15 July 2023 / Published: 17 July 2023
(This article belongs to the Special Issue New Advances in Green Leafy Vegetables)

Abstract

:
It is well known that some plants have the capability of taking up sulfur as a nutrient from the atmosphere through foliar absorption and can survive well in polluted environments. In order to observe the effects of the relationship between atmospheric hydrogen sulfide (H2S) deposition and soil sulfur nutrition, the current study used Brassica pekinensis as a model plant. The objective in conducting this study was to understand the regulatory mechanisms engaged in the uptake and assimilation of sulfate (SO42−) in plants by studying the modulation of transcription levels of sulfate transporter genes (STGs) (Sultr1;1 and Sultr1;2), changes in growth physiology, and the potential of roots to uptake the SO42− when allowed to grow in the presence or absence of SO42− in a hydroponic nutrient solution. Changes in growth, physico-chemical parameters, and gene expression levels of Group 1 STGs were observed when sulfur-treated and non-treated plants were exposed to phytotoxic H2S levels in the air. Sulfur deficiency enhanced nitrate and free amino acid (FAA) concentrations in the shoot and root regions of the plant. However, there was a significant decrease in the biomass, shoot/root ratio (SRR), chlorophyll content, and thiol content, with p-values < 0.01. This, in turn, increased the sulfur-uptake capacity of plants from the atmosphere through foliar absorption. When the sulfur-uptake capacity of plants increased, there was an increase in the expression level of Group 1 sulfate transporter genes (Sultr1;1 and Sultr1;2), which regulate sulfur transportation through roots. The growth, physico-chemical characteristics, and level of gene expression of Group 1 STGs were unaffected by the availability of excess sulfur in the atmosphere of up to 0.3 μL l−1.

1. Introduction

Brassica is a plant genus in the mustard family (Brassicaceae), also referred to as cruciferous vegetables. Cabbage, cauliflower, broccoli, and Brussels sprouts are all members of the Brassica family, and certain seeds are commonly consumed. Important horticultural and agricultural crops belong to this genus. Brassica plants have a high growth need for sulfur [1,2,3]. Sulfur is present in amino acids (cysteine and methionine), oligopeptides (phytochelatins and glutathione (GSH)), and cofactors and vitamins (thiamine, biotin, CoA, and S-adenosyl-methionine). In addition, sulfur is also present in the form of secondary sulfur compounds; for instance, glucosinolates (cruciferous vegetables) and allyl-cysteine sulfoxides (allium) [4,5,6,7]. Sulfur deficiency in plants may lead to a loss in crop output and quality as well as a reduction in their ability to withstand environmental stress and pests [2,7,8].
Sulfate uptake by the root, as well as its successive reduction and dispersion, are all influenced and controlled by the conditions of sulfur (S) in the plant and the demand for S for growth [9,10]. When a plant is deprived of SO42− in the root surroundings, its SO42− uptake, reduction potential, distribution, and efficiency to assimilate are often improved by physiological and morphological changes [9,11,12]. The SO42− transporters that are engaged in the up taking and distribution of SO42− in plants can be categorized into numerous SO42− transporter categories based on their gene sequence, role, and cellular location [9,13]. Brassicaceae family members have been shown to have cDNAs for up to 14 distinct putative STGs that are divided into five groups [14,15]. The Group 1 sulfate transporters (G1STs) Sultr1.1 and Sultr1.2 have high affinity, while Sultr1.3 is mainly responsible for the primary SO42− uptake across the plasma membrane, particularly in the root [16,17,18]. From various experimental evidence, it has been found that in the S-deficient plant tissue, there is a reduced level of thiol compounds, SO42−, and proteins. In addition to this, it has also been found that such plants have increased levels of nitrate (NO32−) and FAAs [7,8]. Atmospheric sulfur dioxide (SO2) is directly absorbed by plant shoots, primarily through the stomata, and is removed from the atmosphere [19,20]. Obviously, sulfur fumes (namely H2S and SO2) have the potential to be phytotoxic, but they can also be used as a source of sulfur, and they are even useful when the root is not sufficiently fertilized with sulfur [21,22]. Excessive quantities of H2S or SO2 can harm plant growth, and particularly high levels can cause immediate observable damage in plants [19]. According to Ausma and De Kok, H2S uptake by foliage exhibits saturation kinetics in relation to the concentration of hydrogen sulfide in the air, which can be explained by the Michaelis–Menten equation. The rate at which SO2 is taken up varies significantly among species, which may account for the variations in plant sulfur requirements [2,20,23,24]. The rate of uptake of SO2 is dominated by the apparent internal (mesophyll) resistance of the shoots, which represents the rate of sulfide metabolism [19,22,24,25,26].
It is currently unclear how signal transduction pathways concerned with the SO42− uptake, assimilation, and coordination from shoot to root have been affected. There is a possibility of quick responses to environmental changes, such as the supply of sulfur through the activation and deactivation of sulfur absorption enzymes by metabolites [27], or the expression and de-repression of genes producing SO42− transporters by metabolites [11,26,28]. Investigators have shown that the activity and expression of the adenosine 5′-phosphosulfate reductase (APR) enzyme in Brassica shoots and roots are reduced by hydrogen sulfide. The investigators found that that its reduction in curly kale was about 80% when H2S was 0.8 μL l−1 [21,26]. It has been observed that these features were unaffected by H2S for other SO42− assimilation enzymes, including adenosine triphosphate sulfurylase (ATPS), O-acetylserine (thiol) lyase (OAS-TL), and sulfite reductase (SIR) [24,29]. Plant SO42− transporter regulation can occur at the transcriptional, translational, and post-translational stages. More research is required to completely comprehend the signal transduction pathways involved in plants [14]. According to Amtmann and Armengaud [30] and Qian et al. [6], changing growing patterns, for instance, variations in root development and the shoot-to-root ratio, can regulate SO42− uptake and reduction. These also necessitate many cell–cell transport steps via various transmembrane inter- and intracellular transport channels [20].
To date, it is not clearly known to what level SO42− or other sulfur assimilation metabolites are directly engaged in sensing or serving as regulatory signals. Uncertainty exists regarding the comprehensive networks of the complete gene–protein–metabolite system of sulfur metabolism. Even today, many questions remain unanswered regarding the intricate signaling cascade of sulfur nutritional stress. Developing Brassica pekinensis seedlings cultivated in SO42−-sufficient and SO42−-deprived environments, as well as exposed to varying amounts of ambient H2S, will be used to examine the direct effect of sulfur with regard to its uptake and overall effect on the growth of the plant and metabolism. The main objective of this study is to determine the optimal hydrogen sulfide concentration for the growth of Brassica pekinensis in a hydroponic system and to understand how seedlings respond to exposure to both hydrogen sulfide from the air and sulfate from the hydroponic medium. We have assessed Group 1 STG expression and activity, SO42−-uptake capacity, and sulfur metabolite concentrations for these purposes.

2. Materials and Methods

2.1. Plant Materials and Growth Conditions in a Climate-Controlled Room

Seeds of Chinese cabbage (Brassica pekinensis cv. Vitimo F1) obtained from Nickerson-Zwaan, The Netherlands, were germinated in vermiculite in a climate-controlled room. Day and night temperatures were 22 and 18 °C (±1 °C), respectively, and the relative humidity was 60–70%. The photoperiod was 14 h at a photon fluence rate of 300 ± 20 μmol m−2 s−1 (within the 400–700 nm range) at plant height, supplied by Philips GreenPower LED (deep red/white 120) production modules. Ten-day-old seedlings were transferred to 30 L containers with either 0 mM sulfate (−S, S-deprived; all sulfate salts were replaced by chloride salts) or 0.5 mM sulfate (+S, S-sufficient) in 25% Hoagland nutrient solution. There were 20 plants per 30 L container. The 25% Hoagland nutrient solution was adjusted to a pH of 6.0 with KOH and contained 1.25 mM Ca(NO3)2·4H2O; 0.23 mM KH2PO4; 1.25 mM KNO3; 0.5 mM MgSO4·7H2O; 11.6 μM H3BO3; 2.3 μM MnCl2·4H2O; 0.24 μM ZnSO4·7H2O; 0.080 μM CuSO4·5H2O; and 0.13 μM Na2MoO4·2H2O. Plants were harvested 3 h after the onset of the light period, and the roots were rinsed in ice-cold, demineralized water (3 × 20 s). Roots were separated from the shoot, and their fresh weight was measured. For RNA isolation, the plant material was frozen immediately in liquid N2 and stored at −80 °C. For the measurement of the water-soluble non-protein thiol content, freshly harvested plant material was used, and for the analysis of dry matter and sulfate content, plant tissue was dried at 80 °C for 24 h (Figure 1) [31].

2.2. H2S Exposure and Growth Conditions in Fumigation Cabinets

For experiments on exposure to different levels of H2S, plants were transferred after 14 days to 13 L stainless steel containers (ten plant sets per container, three plants per set) containing 25% Hoagland solution with either 0 mM sulfate (−S, indicating S-deprived; all sulfate salts were replaced by chloride salts) or 0.5 mM sulfate (+S, indicating S-sufficient). These containers were placed in fumigation cabinets and exposed to 0, 0.1, 0.2, and 0.3 μL l−1 H2S for six days to study the interaction between atmospheric H2S and pedospheric S nutrition. H2S levels in the cabinets were controlled by an SO2 analyzer (model 9850) equipped with a H2S converter (model 8770, Monitor Laboratories, Measurement Controls Corporation, Englewood, CO, USA). In the fumigation cabinet, day and night temperatures were maintained at 21 and 18 °C (±1 °C), respectively, the relative humidity was 55 ± 5%, and the photoperiod was 14 h at a photon fluence rate of 300 ± 20 µmol m−2 s−1 (within the 400–700 nm range) at plant height, supplied by Philips GreenPower LED (deep red/white 120) production modules. The air temperature was controlled by adjusting the cabinet wall temperature. The air exchange was 40 L min−1, and the air inside the cabinets was circulated continuously by a ventilator. To prevent the absorption of atmospheric H2S by the solution, the nutrient solution was aerated, and the lids of containers and plant sets were sealed. Upon harvest, plants were removed from the nutrient solution, and then the roots were rinsed three times in ice-cold, demineralized water for 20 s each. Roots and shoots were harvested separately and weighed. The plant material was immediately frozen in liquid nitrogen and stored at −80 °C until further use. For estimation of dry matter content (DMC), plant tissue was dried at 80 °C for 24 h (Figure 1) [31].

2.3. Pigments

Weighed plant material was immediately frozen in liquid N2 and stored at −20 °C. Then, the plant material was homogenized in 96% ethanol (5 mL g−1 fresh weight) with an Ultra Turrax (0 °C). The homogenate was filtered through one layer of Miracloth. The filtrate was centrifuged at 800× g for 20 min. The supernatant was collected and diluted to 0.5:5 with 96% ethanol. The measuring mix was vortexed, and thereafter the content of chlorophyll a, b, and carotenoids was measured in duplicate at 470, 648.6, and 664.2 nm, respectively. The experiment was carried out in darkness, and the samples were kept on ice [31].

2.4. Anions

Frozen plant material was homogenized in demineralized water (10 mL per g FW) with an Ultra Turrax for 30 s at 0 °C and subsequently filtered through one layer of Miracloth and incubated at 100 °C in a boiling water bath for 10 min. The filtrate was centrifuged at 30,000× g for 15 min at 0 °C. The anions were separated by HPLC using IonoSpher A, an anion exchange column (250 × 4.6 mm; Varian Benelux, Bergen op Zoom, The Netherlands), and determined refractometrically [32]. Anions were separated by HPLC on an Agilent IonoSpher 5A anion exchange column (250 × 4.6 mm; Agilent Technologies, Amstelveen, The Netherlands), and the sulfate content was determined refractometrically according to Shahbaz et al. [33]. The HPLC system consisted of a Knauer HPLC pump model 100 and a Knauer differential refractometer model 98.00 (Knauer, Berlin, Germany). The mobile phase contained 25 mM potassium biphthalate (pH 4.3) with 0.02% NaN3 (w/v).

2.5. Water-Soluble Non-Protein Thiols

Fresh plant material was homogenized in an extraction medium with an Ultra Turrax at 0 °C (10 or 20 mL g−1 fresh weight). This medium contained 80 mM sulfosalicylic acid, 1 mM EDTA, and 0.15% (w/v) ascorbic acid and was aspirated with N2 to remove oxygen from the solution. The homogenate was filtered through one layer of Miracloth, and the filtrate was centrifuged at 30,000× g for 15 min at 0 °C. These samples were measured in duplicate. For the measurement, Ellman’s reagent (10 mM 5,5′-dithiobis[2-nitrobenzoic acid] (DTNB) in 0.02 M Tris, pH 7.0) and 0.4 M Tris-HCl, pH 8.0 were used. If DTNB reacts with an SH compound, it will become yellow and can be measured. The 1.0 mL supernatant of the sample, 0.1 mL of Ellman’s reagent, and 2.0 mL of Tris-HCl were mixed and measured at 413 nm. The SH concentration was calculated using a standard curve [23,34].

2.6. Free Amino Acids

Plant tissue extracts were prepared to a volume of 1 mL with distilled water, and then the ninhydrin reagent (1 mL) was added. The test tubes were placed in a boiling water bath for 20 min. After cooling the test tubes, 5 mL of diluent was added to each tube. At 570 nm, a spectrophotometer was used to determine the total amount of free amino acids [35].

2.7. RNA Extraction

Total RNA was isolated by a modified hot phenol method [36]. Frozen ground plant material was extracted in hot (80 °C) phenol/extraction buffer (1:1, v/v), 1 g mL−1. The extraction buffer contained 0.1 M Tris-HCl, 0.1 M LiCl, 1% SDS (w/v), 10 mM EDTA, pH 8.0. After mixing, 0.5 mL of chloroform–isoamyl alcohol (24:1, v/v) was added and centrifuged at 13,400× g for 5 min at 4 °C. The aqueous phases were transferred to a new tube, and an equal volume of chloroform and isoamyl alcohol was added. The total RNA was precipitated by 4 M LiCl overnight at 4 °C. Total RNA was collected and washed with 70% ethanol. Possible genomic DNA contamination was removed with a DNase, and total RNA was precipitated by ethanol and dissolved in diethylpyrocarbonate-treated water. The quantity and quality of RNA were checked using ThermoNanoDrop 2000, and the concentration of RNA was adjusted equally in each sample. If any impurity was found, phenol–chloroform–isoamyl alcohol and chloroform–isoamyl alcohol were used for further purification and removal. The integrity of RNA was checked by electrophoresis by loading 1 μg of RNA on a 1% TAE-agarose gel.

2.8. Relative Expression of Sultr1;1, Sultr1;2 by Real-Time Quantitative PCR

DNA-free intact RNA (1 µg) was reverse transcribed into cDNA with oligo-dT primers using a first-strand cDNA synthesis kit (Promega, USA) according to the manufacture’s supplied instructions. Subsequently, the cDNA was used as a template in real-time PCR experiments with gene-specific primers (Table 1). RT-PCR was performed on the Applied Bio Systems’ 7300 real-time PCR system using the SYBR Green master mix kit (Thermo Scientific) based on the manufacturer’s instructions. The transcript levels of the target gene and actin were measured using the comparative Ct method. Sultr1;1, Sultr1;2 relative expression was measured by qPCR in triplicate [33].

2.9. Sulfate-Uptake Capacity

Sulfate-uptake capacity was determined as described by Koralewska et al. [18]. Three sets of plants (3 plants per set) per treatment were transferred to a 25% Hoagland solution labeled with 35S-sulfate (2 MBq l−1) and incubated for 30 min at 25 °C at a photon fluence rate of 300 ± 20 µmol m−2 s−1 at plant height, supplied by Philips GreenPower LED (deep red/white 120) production modules. Subsequently, plants were removed and their roots rinsed in ice-cold non-labeled nutrient solution (3 × 20 s). Roots and shoots were separated and digested in 1 N HCl at room temperature for 7 days. The extracts were filtered through one layer of Miracloth (Calbiochem Corporation, La Jolla, CA, USA), and 100 µL of the filtrate was mixed with 1 mL Emulsifier plus (Perkin Elmer, Boston, MA, USA). Radioactivity was measured with a liquid scintillation counter (TRI-CARB 2000 CA Liquid Scintillation Analyzer, Perkin Elmer, Waltham, MA, USA).

2.10. Statistical Analysis

In the present study, Pearson’s correlation coefficient analyses were performed to assess the associations between different physico-chemical parameters and the transcription level of sulfur. Multivariate cluster analysis was conducted to construct a dendrogram based on the similarity matrix of the physico-chemical parameters using the paired group (UPGMA) method with arithmetic averages and a correlation similarity index. Non-metric multidimensional scaling was carried out to group the H2S-treated and non-treated plants on the basis of their similarity in different physico-chemical parameters. Comparison and similarity groupings of all measured parameters were performed by using a two-way ANOVA to determine any significant variation between the means. These analyses were performed using PAST: Palaeontological Statistics Software Package, version 4.05 [37]. All the measured parameters were subjected to principal component analysis using the web tool ClustVis (https://biit.cs.ut.ee/clustvis/ (accessed on 6 June 2023)) to determine any significant relationship between one component and another.

3. Results

3.1. Impact of Sulfur on Plant Growth, Physico-Chemical Parameters, and Sulfate Transporter Gene Expression

It was observed that when plants were allowed to grow in the presence of 0.5 mM sulfate, there was a positive correlation between the gradual increase in biomass of the whole plant with the SRR, a high SO42− composition in the shoot and root, a low nitrate composition in the shoot (Table 2), and a gradual increase in the expression level of the gene Sultr1;2 (Figure 2). This suggests that due to high SO42− levels in the root and shoot, there is a gradual increase in the growth of plants that consequently results in a gradual increase in biomass and SRR, a low nitrate content (Table 2), and a slow rise in the expression level of the gene Sultr1;2. Free amino acid and thiol levels in the shoot and root of sulfate-treated plants were positively correlated with the plant SO42−-uptake capacity, which implies that plants’ thiol content and their free amino acid content increase as their ability to absorb sulfate increases (Table 2 and Figure 2). There was a negative correlation between the nitrate content of roots and the gene expression level of Sultr1;1 in sulfate-treated plants, which suggests that with a decrease in nitrate content in treated plants, there is an increase in the expression level of the Sultr1;1 gene (Table 2 and Figure 2). In sulfate-sufficient roots, Sultr1;2 expression gradually increased, whereas Sultr1;1 expression was barely perceptible (determined by qRT-PCR) (Figure 2).
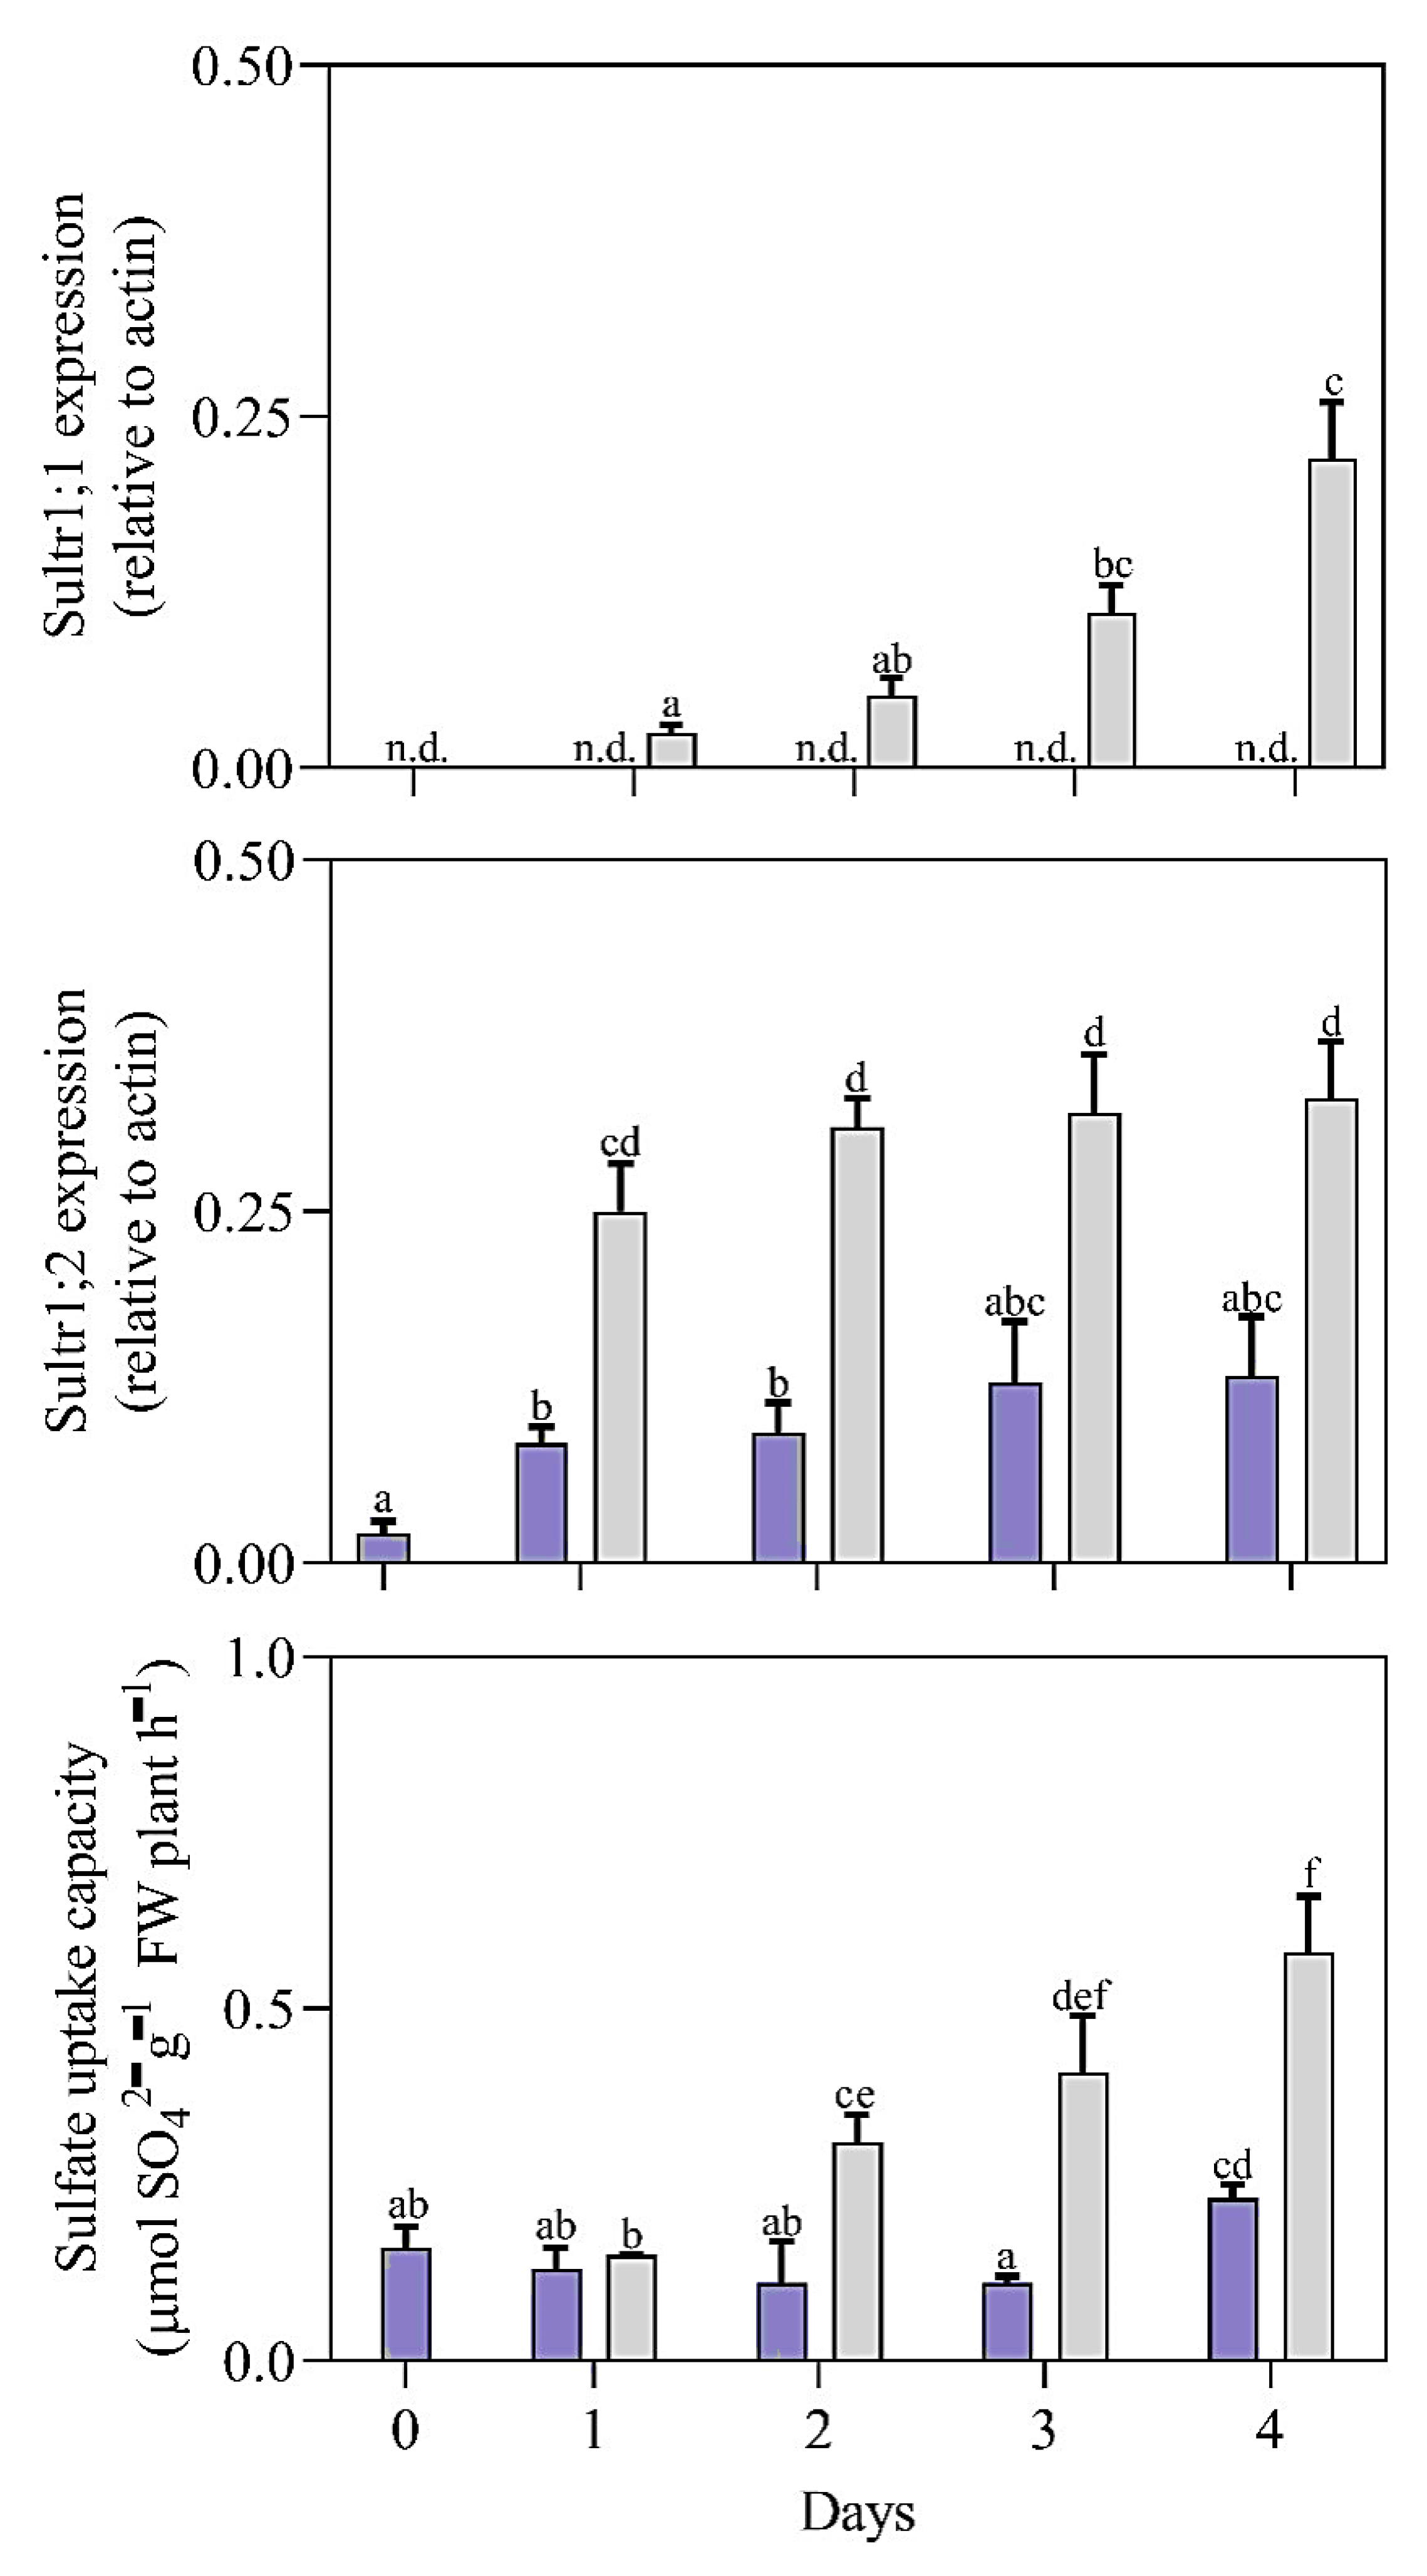
From the Pearson’s correlation coefficient analysis, it was observed that when plants were allowed to grow in the absence of SO42−, there was a positive correlation between an increase in the biomass of the whole plant, SRR, and the SO42−-uptake capacity of plants, a high nitrate content, a high free amino acid content in root and shoot, and an increase in gene expression level of Sultr1;2 (Table 2 and Figure 2). This suggests that in absence of sulfur, the transcription level of the Sultr1;2 gene increases, which in turn increases the nitrate content, free amino acid content, and SO42−-uptake capacity of plants. Due to the increase in nitrate content, there is an increase in root and shoot expansion, which in turn increases the biomass of the whole plant (Table 2). There was a negative correlation between the SO42− content of the root and shoot with the biomass of the whole plant, SRR, nitrate content, free amino acid content, and SO42− uptake capacity of plants. There was a negative correlation of SO42− content with the gene expression level of Sultr1;1 and Sultr1;2 in sulfur-nontreated plants, which suggests that due to the low level of SO42− in the shoot and root of plants, there is a significant increase in the gene expression level of Sultr1;1 and Sultr1;2 (Table 2 and Figure 2). The thiol content in the root and shoot is positively correlated with the SO42− content of the root and shoot, which suggests that there is a decrease in thiol content with a reduction in the SO42− content of plants (Table 2). The reduced biomass brought about by SO42− deprivation was more severe in shoots than in roots, resulting in a lower SRR compared with plants grown in SO42−-containing medium. The plants all displayed additional signs of sulfur shortage, including yellowing of the leaves caused by a loss of color, very low levels of SO42−, increased levels of nitrate and FAAs, especially in the shoots, as well as an increased shoot DMC (Table 2). The thiol content of the plants is negatively correlated with the free amino acid content and expression level of the Sultr1;1 gene, which suggests that with a decrease in thiol content, there is an increase in the free amino acid content and transcription level of the Sultr1;1 gene (Table 2 and Figure 2). Sulfate deficiency has an influence on the amount of water-soluble non-protein thiols (Table 2). In sulfate-sufficient plants, these were not altered after the fourth day, whereas their levels drastically dropped in sulfate-deprived plants. Sulfate-deprivation caused a rapid and significant increase in Sultr1;2 gene expression within one day, whereas Sultr1;1 gene expression did not begin to increase until two days after the SO42− deprivation. When developing seedlings were deficient in sulfate, the expression of Group 1 sulfate transporters increased, and this was accompanied by a significant improvement in SO42−-uptake capacity (up to 6-fold), which in turn gradually increased the SO42−-uptake capacity of the roots (Figure 2). From a two-way ANOVA, it was found that there was a significant variation (p < 0.01) in the growth physiology, physico-chemical parameters, and gene expression levels of STGs in plants grown in the presence of SO42− compared with plants grown in the absence of sulfate.

3.2. Effects of H2S Treatment on Growth, Physico-Chemical Parameters, and Sulfate Transporter Gene Expression in Plants Grown without and with Sulfate

Furthermore, plants grown in the presence of SO42− were treated with H2S for six days, and then changes in physico-chemical parameters and transcription levels of STGs were observed. There was a negative correlation between the DMC and SO42−-uptake capacity of the sulfur-treated plants, which suggested that after H2S treatment, there was an increase in DMC in plants and a decrease in the SO42−-uptake capacity of sulfur-treated plants (Table 3 and Figure 3).
Chlorophyll concentration and nitrate content in sulfur-treated plants exhibited a negative correlation, which suggests that there was an increase in chlorophyll content and a decrease in the nitrate content in the shoots of the sulfur-treated plants after H2S treatment. The root’s DMC and the shoot’s thiol content were negatively correlated, which suggests that after H2S treatment, there was an increase in DMC in the roots and a decrease in thiol content in the shoots of sulfur-treated plants. There was a negative correlation between the biomass of the whole plant and the SO42− content of the root, which suggests that with an increase in the SO42− content of the root, there was a significantly gradual increase in the growth of plants, which in turn elevated the biomass of the whole plant (Table 3). The sulfate content of roots, the sulfate content of shoots, and the plant’s ability to absorb sulfate are all positively connected (Figure 3). The DMC of the shoot is negatively correlated with the SO42−, nitrate, thiol, and free amino acid content of the root, which suggests that there is a decrease in SO42−, nitrate, thiol, and free amino acid content after H2S treatment (Table 3). There was a positive correlation between the SRR and the expression level of the Sultr1;2 gene, suggesting that there was an increase in the growth of root and shoot in plants after H2S treatment, which parallels the increased expression level of gene Sultr1;2. There was a positive correlation of thiol content of roots with the DMC, SO42−, and nitrate content in the roots of plants, which suggests that after H2S treatment, there was a reduction in the thiol, SO42−, and nitrate content in the roots of sulfur-treated plants (Table 3 and Figure 3).
When sulfur-nontreated plants were treated with different concentrations of H2S for six days, there was a positive correlation between the biomass of the whole plant and the SRR, the SO42− and thiol content in the shoot, whereas there was a negative correlation with the DMC content in the shoot, the free amino acid content in the shoot, and the transcription level of STG (Sultr1;1 and Sultr1;2). This suggests that after H2S treatment, there was a gradual decrease in DMC and FAA in shoots, whereas there was a gradual increase in SO42− and thiol content in the shoots of SO42− non-treated plants (Table 3).
There was a gradual increase in growth of the shoot and the root as well as a gradual decrease in transcription levels of STG (Sultr1;1 and Sultr1;2) in sulfur-non-treated plants after H2S treatment (Figure 3). There was a negative correlation between the SRR of plants and the SO42−-uptake capacity as well as nitrate and free amino acid contents in the shoot, which implies that with an increase in the SO42−-uptake capacity of the plant, there was an increase in the nitrate and free amino acid content in the shoot, but growth of the shoot and root was inhibited after H2S treatment. There was a negative correlation between the SRR of plants and the transcription level of both STGs, which suggests that there is a gradual increase in the expression level of these genes with the gradual increase in the growth of shoot and root due to H2S treatment. There was a positive correlation between the SO42−-uptake capacity of the plants and the transcription level of STGs, which suggests that H2S treatment increased the transcription level of both STGs, which, in turn, increased the SO42−-uptake capacity of plants. There was a negative correlation between chlorophyll and the SO42− content of the shoots and the SO42−-uptake capacity of the plants, which suggests that when SO42− and chlorophyll contents are low in plants, the SO42−-uptake capacity of the plants increases. There was a negative correlation between the DMC and thiol content in the shoot, which suggests that after H2S treatment, there was an increase in DMC and a decrease in thiol content in the shoots of sulfur-non-treated plants. There was a positive correlation of the chlorophyll content with the thiol content in the root, whereas there was a negative correlation of the chlorophyll content with the nitrate and free amino acid contents. This suggests that after H2S treatment, there was a decrease in the thiol content in the root and in the chlorophyll content in the shoot, whereas there was an increase in the nitrate and free amino acid contents in the shoots of sulfur-non-treated plants. There was a negative correlation of the SO42− content of shoots with nitrate, the FAA content of shoots, and transcription levels of both STGs, which suggests that after H2S treatment, there was a decrease in the SO42− content of shoots, which resulted in an increase in the transcription level of STGs, nitrate content, and FAA content in shoots of the sulfur non-treated plants. There was a negative correlation of the thiol content of shoots with FAAs and the transcription level of both STGs, which suggests that after H2S treatment, there was a decrease in thiol content, which, in turn, increased the transcription level of STGs and the free amino acid content in the shoots of sulfur non-treated plants (Table 3 and Figure 3).
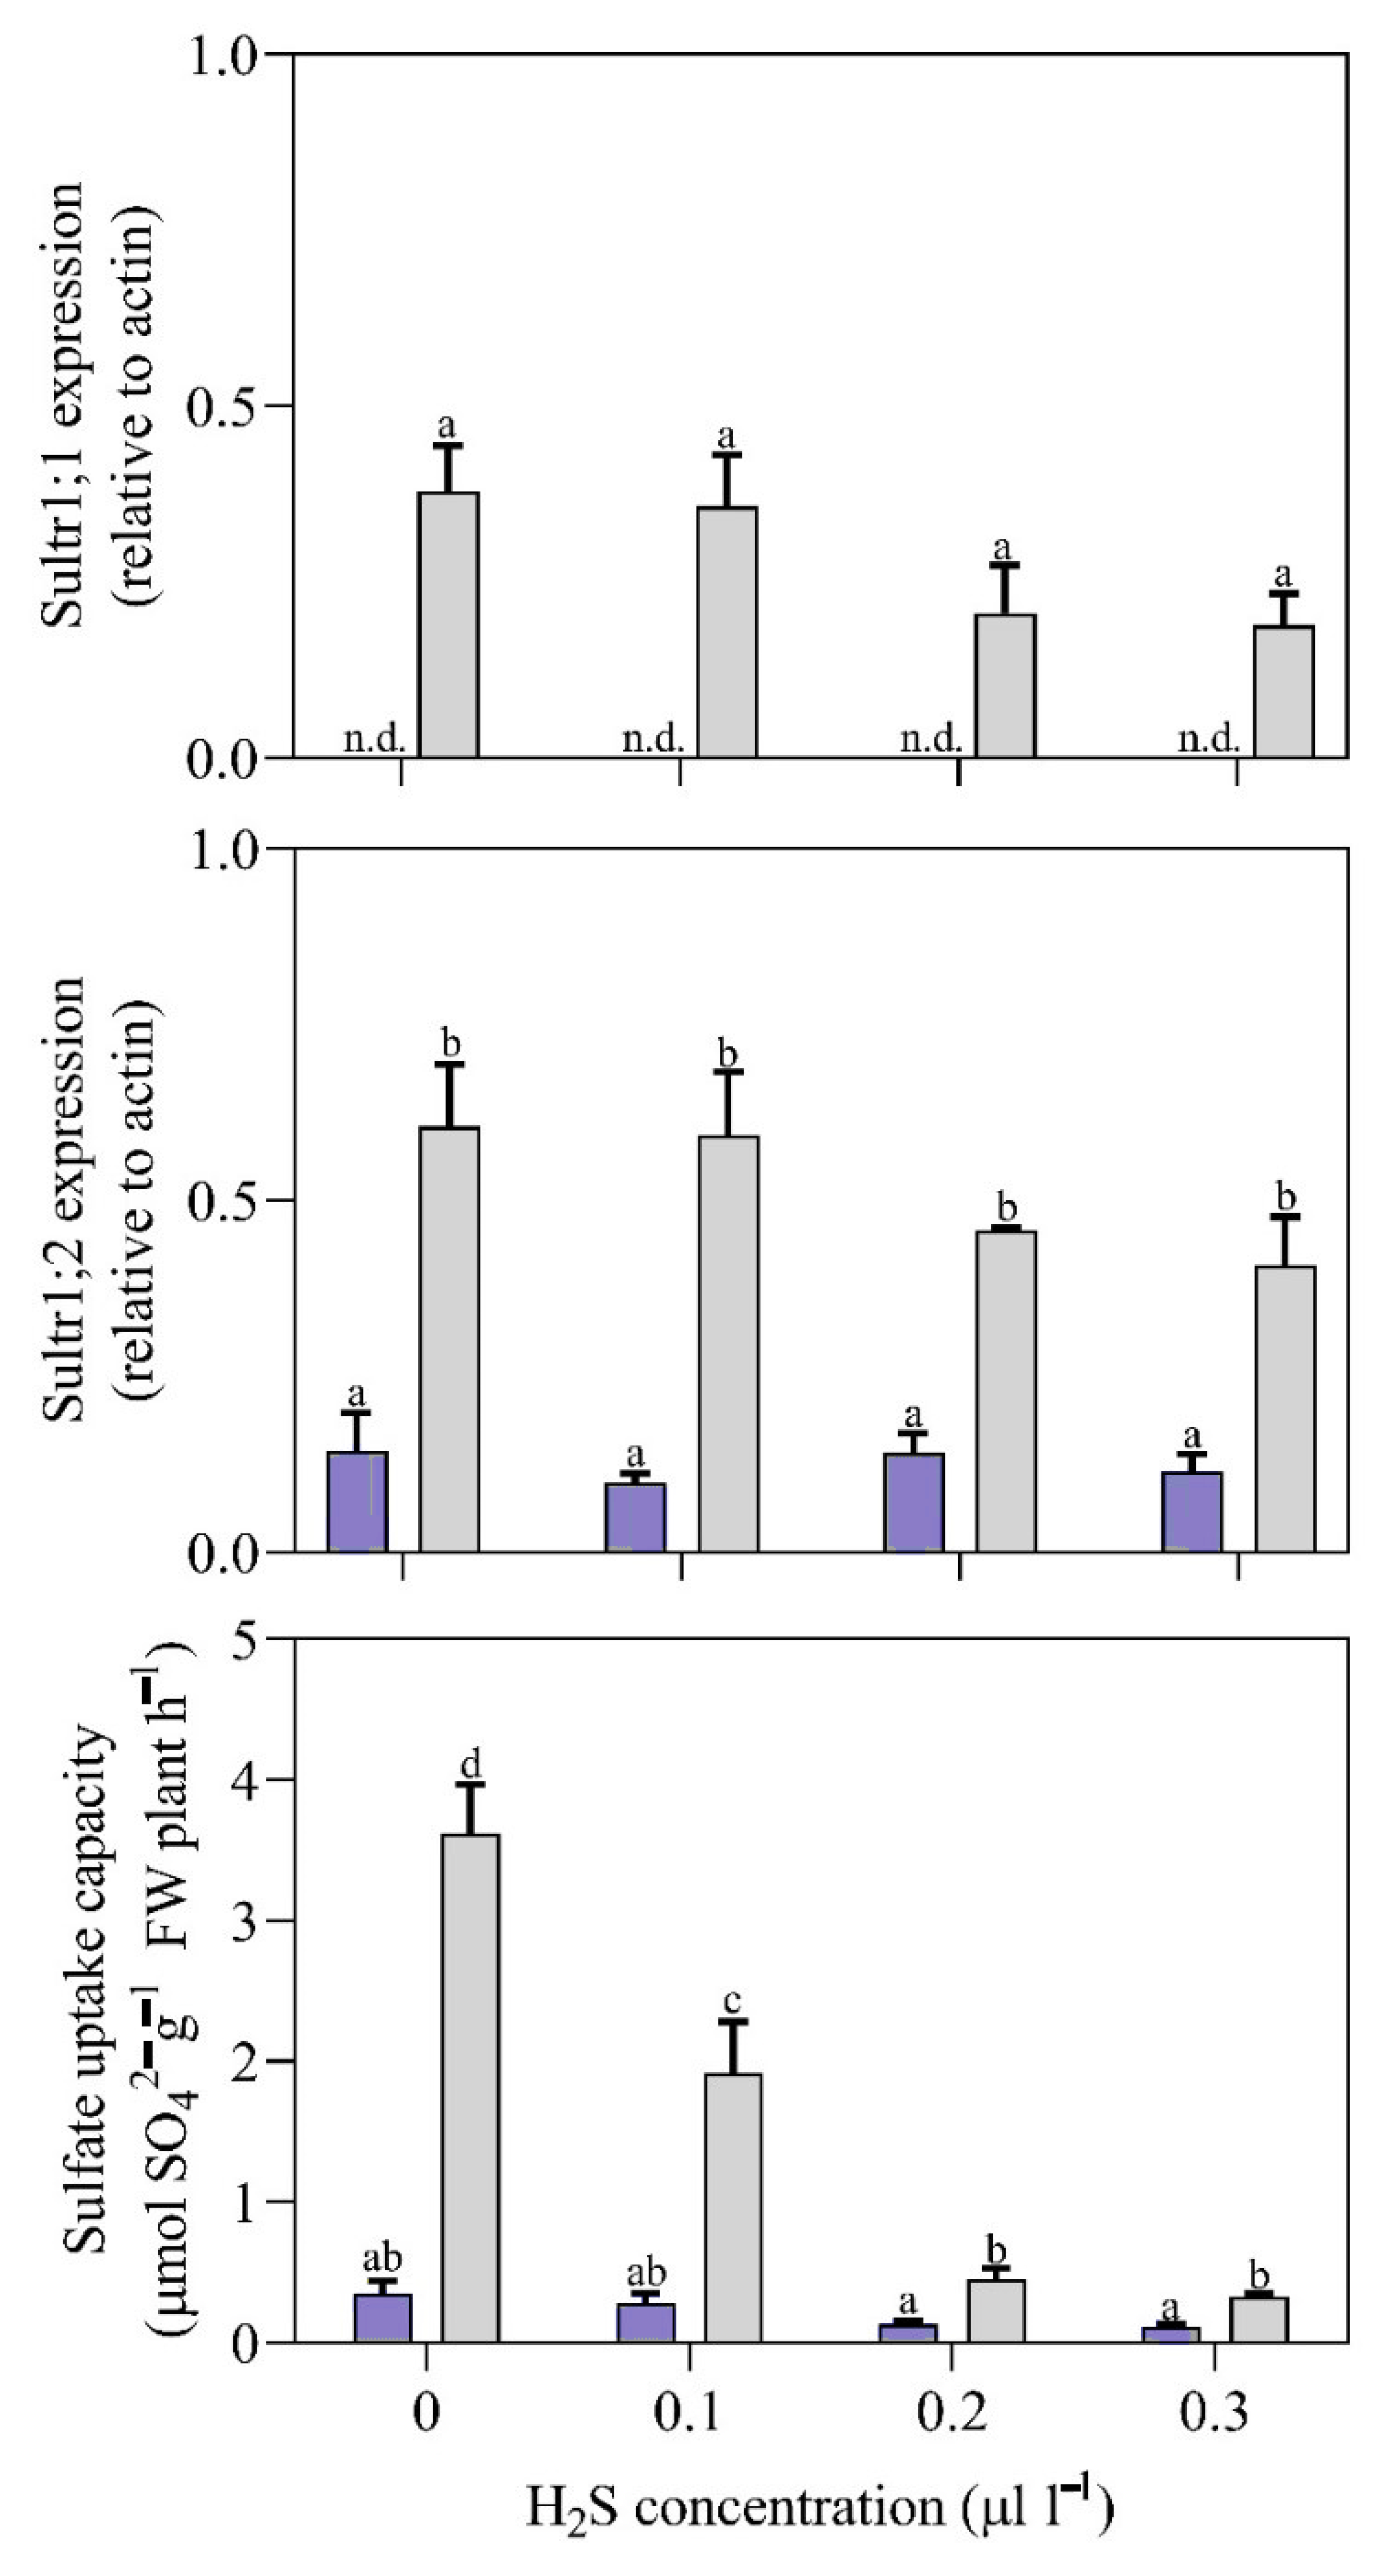
The growth of Brassica pekinensis in a nutritional solution containing SO42− was unaffected after 6 days of H2S exposure at 0.3 μL l−1, and the levels of SO42− in the plant organs were unaltered as well. When plants were grown in a sulfate-deficient condition for 4 days and then exposed to 0.1, 0.2, and 0.3 μL l−1H2S for 6 days, the symptoms of sulfur deficiency were largely alleviated. Plant growth was restored, and after 6 days of exposure, it was even on par with that of plants cultivated at the same time on sulfate or sulfate + 0.3 μL l−1 H2S. The expression of G1ST, Sultr1;1 and Sultr1;2 and, likewise, the SO42− and thiol contents are rarely modified after days under sulfate-sufficient conditions in a climate-controlled room or by increasing the H2S concentration in the roots of seedlings. Whereas Sultr1;1 was highly up-regulated in sulfate-deprived seedlings, Sultr1;2 was barely impacted, and the contents of SO42− and thiols were significantly decreased. Sultr1;1 and Sultr1;2 expression was up-regulated 10-fold and 2-fold simultaneously in sulfate-deprived seedlings compared with sulfate-sufficient seedlings. By increasing the H2S content in seedling roots, SO42− deprivation down-regulated Sultr1;1 and Sultr1;2 expression by around 1.8-fold and 0.5-fold, respectively (Table 3 and Figure 3).
When comparing between seedlings that received enough SO42− and those that didn’t, the expression of Sultr1;1 and Sultr1;2 was found to have increased 35-fold and 3.2-fold, respectively (Table 3 and Figure 3). Sultr1;1 was exclusively expressed when SO42− was not present in the root environment, but Sultr1;2 was expressed in both sufficient and deficient conditions. With SO42− deprivation, the expression of the sulfate transporter increased along with the SO42−-uptake capacity. Sulfate-uptake capacity in Brassica pekinensis gradually increased during SO42− deprivation in growing seedlings and decreased during an increase in H2S up to 0.3 μL l−1. However, while the expression level of Sultr1;2 was increased during sulfur deprivation, it was not significantly impacted in developing seedlings by increasing the H2S concentration (Figure 2 and Figure 3).

3.3. Effects of H2S Treatment on Sulfate Transporter Gene Expression in Plants Grown without and with Sulfate

While SO42− deprivation in developing seedlings gradually increased the Sultr1;1 expression level, t decreased with rising H2S concentrations, just like the SO42−-uptake capacity (Figure 2 and Figure 3). When seedlings were exposed to atmospheric H2S, the ability of both sulfate-sufficient and sulfate-deprived roots to absorb SO42− decreased in a concentration-dependent manner. Nevertheless, exposure to H2S had little impact on Sultr1;1 and Sultr1;2 expression (Figure 3). It was observed that H2S treatment had no direct relationship with an increase in the sulfur-uptake capacity of roots of the Brassica pekinensis seedling, regardless of whether they were grown in SO42−-containing or SO42− deficient media. From two-way ANOVA, it was observed that there was significant variation (p < 0.01) in the growth physiology, physico-chemical parameters, and gene expression levels of STGs in the SO42− treated and non-treated plants after H2S treatment (Table 3, Figure 3).

3.4. Multivariate Cluster Analysis, Non-Metric Multidimensional Scaling, and Principal Component Analysis

A multivariate cluster analysis was performed to detect similarities in the growth, physico-chemical parameters, and transcription levels of STGs in plants after and without sulfur treatment. The cluster analysis grouped the sulfur-treated and non-treated plants into five groups on the basis of changes in their growth, physico-chemical parameters, and transcription level of STGs. Group A included the initial non-treated plants of 0 day which had low biomass, moderate SRR, moderate SO42− content in the root and shoot, moderate SO42−-uptake capacity, and low nitrate, thiol and FAA content in the root and shoot. Even the transcription level of STGs (Sultr1;1 and Sultr1;2) was low at 0 day. Group B included sulfur-treated plants from the 1st and 2nd day that had a low biomass, moderate SRR, low SO42−-uptake capacity, high SO42− content in the root and shoot, low nitrate content in shoots, moderate nitrate content in the root, moderate thiol content in roots and shoots, moderate FAA content in the root and shoot, low expression level of the Sultr1;1 gene, and moderate expression level of the Sultr1;2 gene. Group C included sulfur-treated plants of 3rd- and 4th-day plants that had a high biomass, high SRR, moderate SO42−-uptake capacity, high SO42−, thiol, nitrate and FAA content in the root and shoot, low expression level of the Sultr1;1 gene, and moderate expression level of the Sultr1;2 gene. Group D included non-sulfur treated plants from the 1st and 2nd days that had a low biomass, low SRR, high SO42−-uptake capacity, moderate SO42− content in the shoot and root, moderate nitrate and FAA content in the root and shoot, high thiol content in the root and shoot, moderate gene expression level of Sultr1;1, and high expression level of Sultr1;2. Group E included sulfur non-treated plants from the 3rd and 4th day that had a high biomass, high SRR, high SO42−-uptake capacity, low SO42− content in the shoot and root, high nitrate and FAA contents in the root and shoot, moderate thiol content in the root and shoot, and high gene expression level of both STGs (Sultr1;1 and Sultr1;2) (Figure S1 Supplementary Data, Tables S1 and S2 Supplementary Data). Similar clusters were formed by non-metric multidimensional scaling (MDS) (Figure S2 Supplementary Data), which supported the results of the multivariate cluster analysis.
Principle component analysis (PCA) showed that there was a 56.1% variation in sulfur-treated plants from the initial stage and a 25.1% variation of non-sulfur treated plants from the initial stage (Figure 4). The heatmap of PCA suggested that when plants were grown in presence of 0.5 mM SO42− for 4 days, there was an increase in the biomass of the whole plant, SRR, and the nitrate, FAA, SO42− and thiol contents in the root and shoot, whereas there was a decrease in the expression level of STGs (Sultr1;1 and Sultr1;2) and the SO42−-uptake capacity of the plant. When plants were grown in absence of SO42− there was notable increase in biomass of whole plant, SRR, nitrate, FAA content in root and shoot as well as there was increase in expression level of STG (Sultr1;1 and Sultr1;2) whereas there was a decrease in the thiol and SO42− contents in the root and shoot of the plants (Figure 4).
The multivariate cluster analysis was performed to detect similarities in the growth, physico-chemical parameters, and transcription level of STGs following SO42− treatment and SO42− non-treatment after 6 days of H2S treatment. The cluster analysis grouped the H2S-treated plants into four major groups on the basis of changes in their growth, physico-chemical parameters, and transcription level of STGs.
Group A included plants grown in presence of 0.5 mM SO42− and further treated with 0 μL l−1 and 0.1 μL l−1 concentrations of H2S. Group B included plants grown in presence of 0.5 mM SO42− and further treated with 0.2 μL l−1 and 0.3 μL l−1 concentrations of H2S. Group C included plants grown in absence of SO42− and further treated with 0 μL l−1 and 0.1 μL l−1 concentrations of H2S. Group D included plants grown in absence of SO42− and further treated with 0.2 μL l−1 and 0.3 μL l−1 concentrations of H2S (Tables S3 and S4 Supplementary Data, Figure S3 Supplementary Data). Similar clusters were also formed by non-metric multidimensional scaling (MDS) (Figure S4 Supplementary Data), which supported the results of the multivariate cluster analysis.
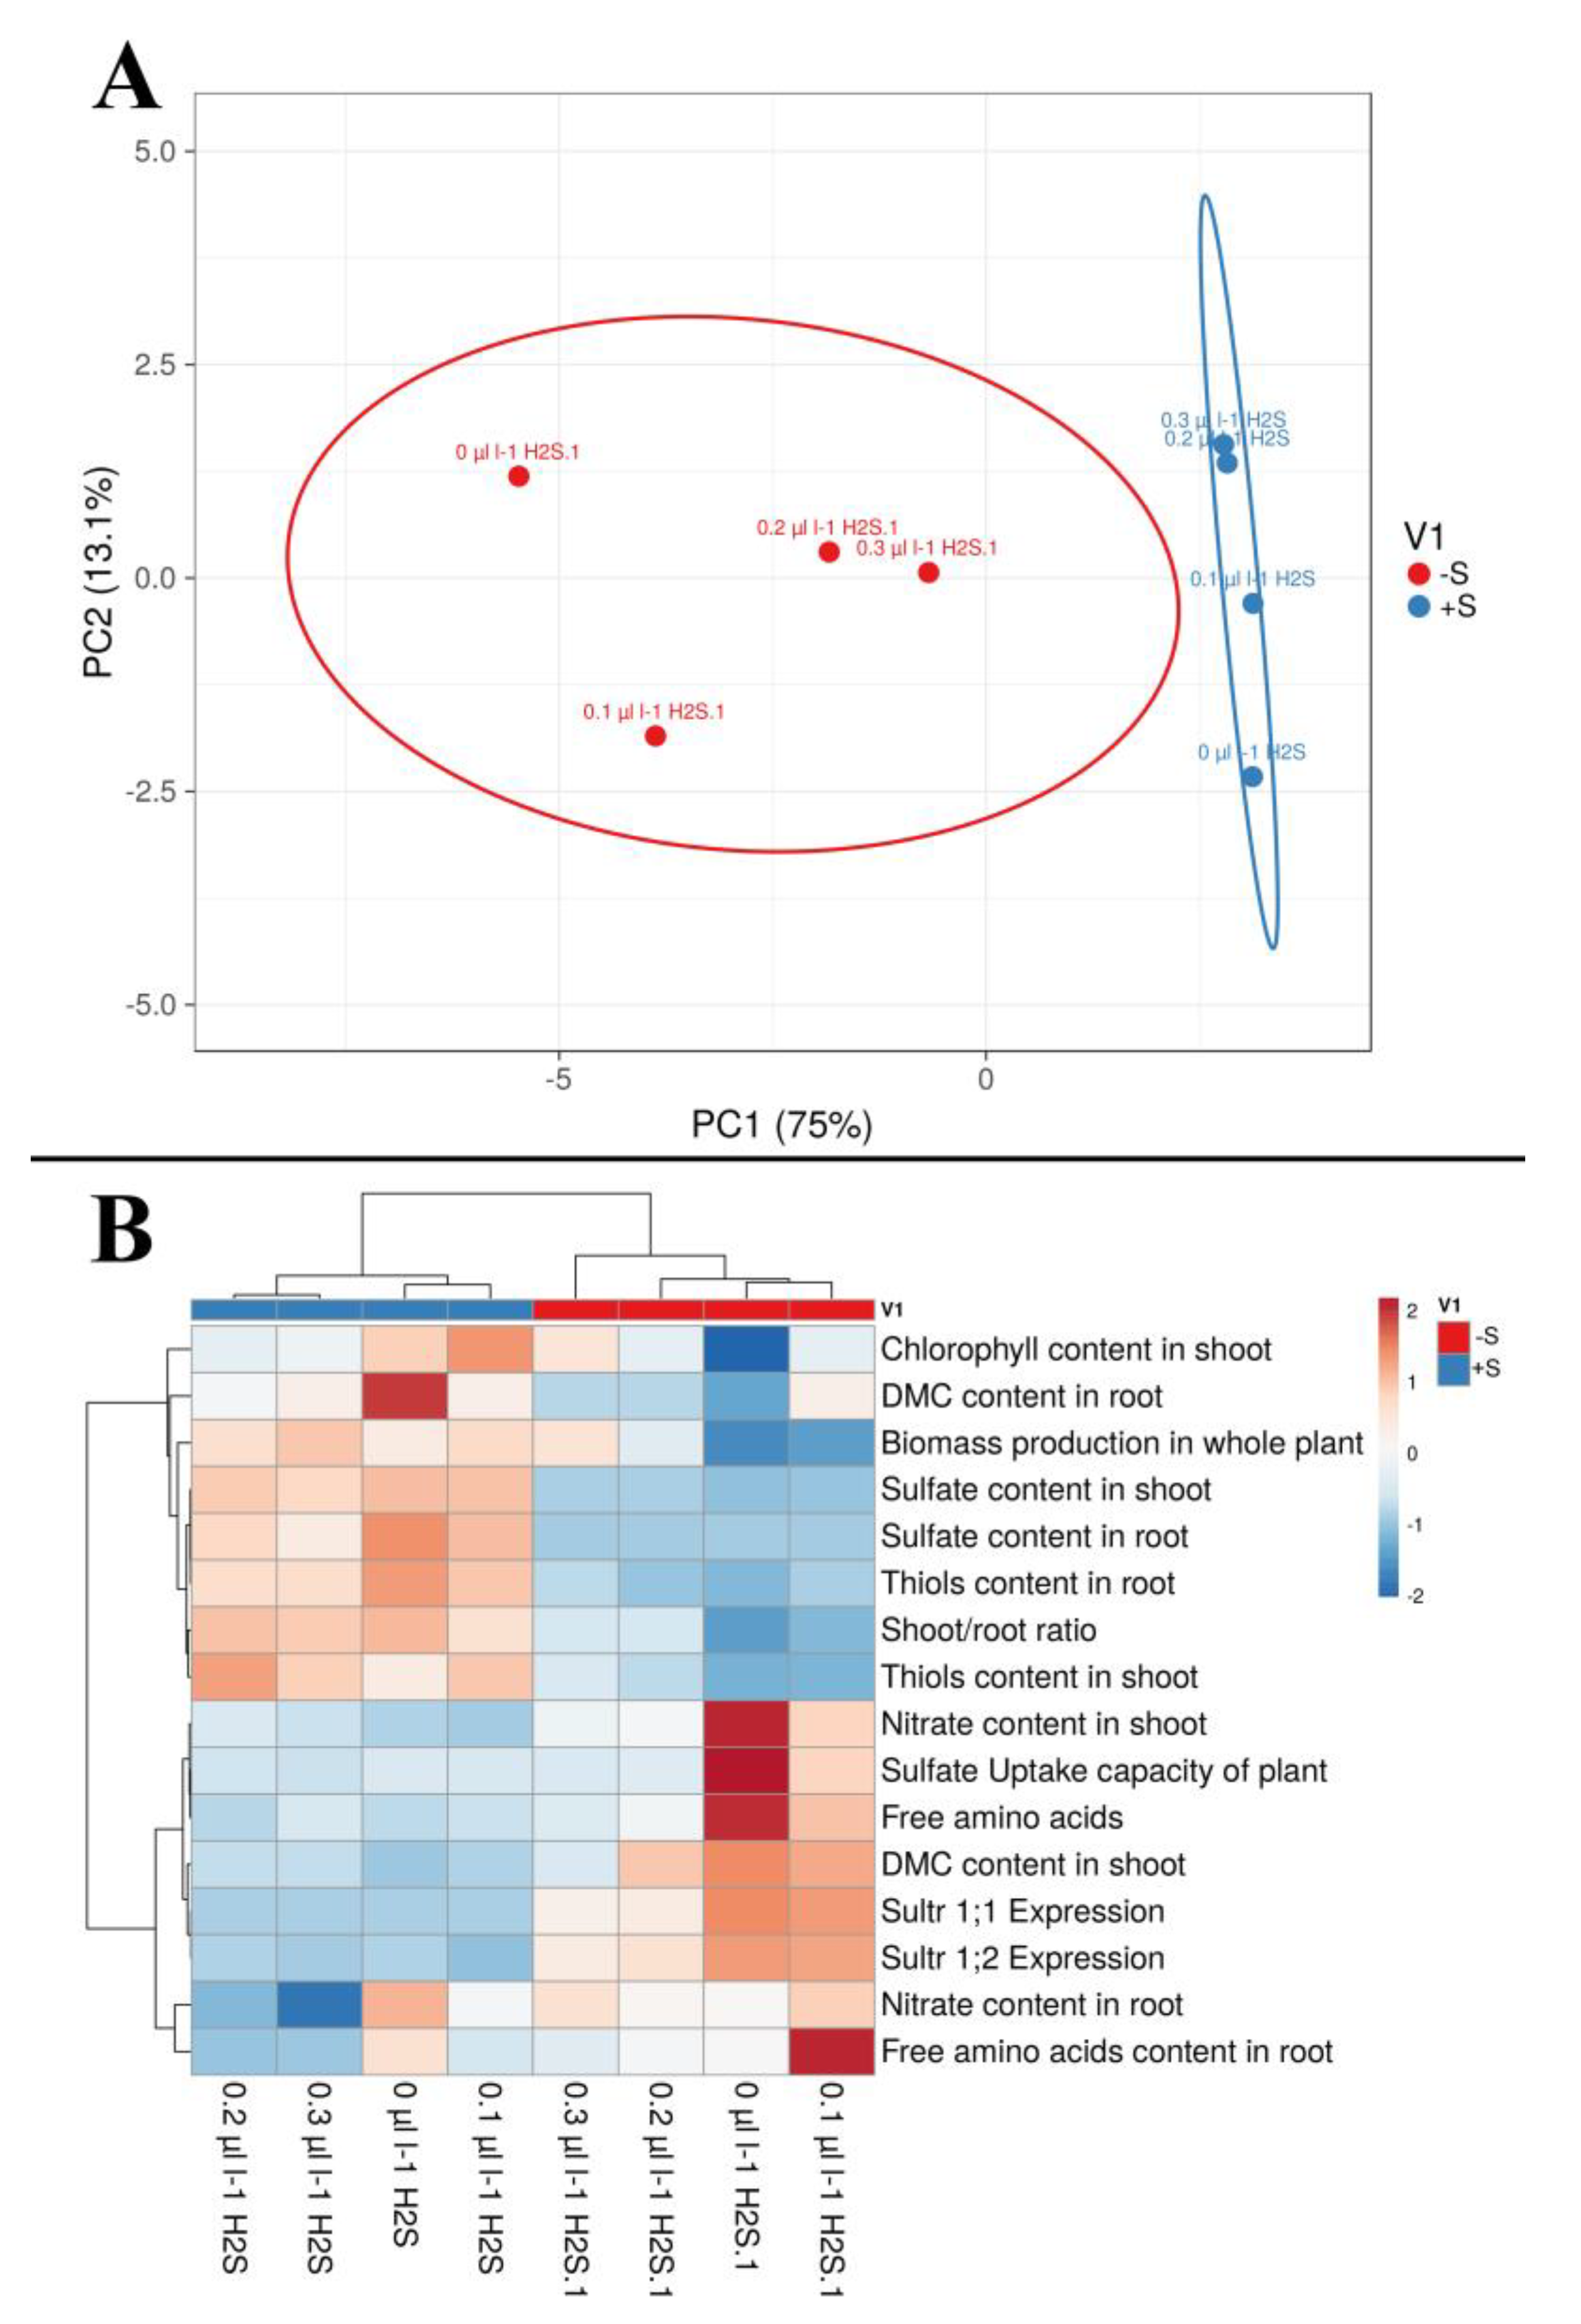
According to the PCA, there was a 75% variation in the growth, physico-chemical parameters, and STG expression levels of sulfur-treated plants after H2S treatment, and a 13.1% variation in the growth, physico-chemical parameters, and STG expression levels of sulfur-non-treated plants after H2S treatment (Figure 5). The heatmap of the PCA suggested that when plants grown in presence of 0.5 mM SO42− were treated with a low concentration (0.1 μL l−1) of H2S for 6 days, there was an increase in the biomass of whole plant, SRR, DMC in the root, and thiol and SO42− contents in the root and shoot, whereas there was low DMC in the shoot, low nitrate and low FAA content in the root and shoot, as well as a decrease in the expression level of STGs (Sultr1;1 and Sultr1;2) and SO42−-uptake capacity of plants. When plants grown in presence of 0.5 mM SO42− were treated with a high concentration (0.2 μL l−1 and 0.3 μL l−1) of H2S for 6 days, there was a moderate increase in the biomass of the whole plant, SRR, DMC in the root, and SO42− and thiol contents in the root and shoot, whereas there was low DMC in the shoot, low nitrate and low FAA content in the root and shoot as well as a decrease in the expression level of STGs (Sultr1;1 and Sultr1;2) and the SO42−-uptake capacity of plants (Figure 5). When plants grown in absence of sulfur were treated with a low concentration (0.1 μL l−1) of H2S for 6 days, there was a decrease in the biomass of the whole plant, SRR, DMC in the root, and SO42− and thiol contents in the root and shoot, whereas there was an increase in DMC in the shoot, an increase in the nitrate and FAA contents in the root and shoot as well as an increase in the expression level of STGs (Sultr1;1 and Sultr1;2) and the SO42−-uptake capacity of plants. When plants grown in absence of sulfur were treated with a high concentration (0.2 μL l−1 and 0.3 μL l−1) of H2S for 6 days, there was a decrease in the biomass of the whole plant, SRR, DMC in the root, and SO42− and thiol contents in the root and shoot, whereas there was moderate DMC in the shoot, moderate nitrate and FAA contents in the root and shoot as well as moderate STG (Sultr1;1 and Sultr1;2) expression levels and low SO42−-uptake capacity in the plants (Figure 5).

4. Discussion

The phytotoxic gases SO2 and H2S are taken up by plants through foliar absorption as a source of sulfur nutrition from polluted environments [38,39]. Studies influenced by SO2 and H2S are excellent resources for obtaining a better understanding of the metabolic regulation of plant SO42− uptake and assimilation. Hence, to observe the effects of the relationship between atmospheric hydrogen sulfide (H2S) deposition and soil sulfur nutrition, Brassica pekinensis was utilized as a model plant in this study. The aim of this investigation was to understand the regulation of uptake of SO42− and assimilation in plants by studying the modulation of transcription levels of STGs (Sultr1;1 and Sultr1;2), changes in growth physiology, and SO42−-uptake capacity of roots when grown in the absence or presence of SO42− in a hydroponic nutrient solution. Furthermore, changes in growth, physico-chemical parameters, and gene expression levels of STGs were observed when sulfur-treated and non-treated plants were exposed to phytotoxic H2S levels in the air.
Brassica species have an extreme tolerance to H2S in the atmosphere. Brassica seedling biomass production was only considerably reduced after extended exposure to ≥0.4 μL l−1 H2S [20,29]. Similarly, in other species, glutathione and cysteine levels were elevated in the shoot after H2S application, but their content in the root was unaffected [20,40]. Fumigating Brassica plants deficient in sulfur with 0.06 μL l−1 H2S restored the growth rate to that of sulfate-grown plants [26,41]. The level of SO42− in such plants was quite low. On the other hand, the water-soluble, non-protein thiol levels of the shoot was enhanced to the levels seen in SO42−-rich plants [26].
Sulfur is a necessary element for all living species. Sulfur-containing compounds play an important role in improving food quality, disease tolerance, and resistance in the plant, and they also have applications as herbal therapeutic remedies, which is why it is popular as a healing mineral [42,43]. The amount of sulfur a plant needs is determined by the plant’s species and stage of growth. Several secondary metabolites (SMs) of plants that are necessary for the physiological processes, growth, and development of the plant also contain sulfur. Sulfur is also engaged in the creation of disulfide bonds (s=s) in the monitoring of proteins and enzymes [7,44,45].
In the current study, sulfur deficiency led to a decline in biomass that was more marked in shoots than roots, ensuing in a decrease in the SRR. In sulfur-deprived plants, all symptoms of sulfur deficiency were observed, such as a decrease in biomass, yellowing of leaves due to the loss of chlorophyll content, and increases in free amino acid and nitrate contents [35,39]. In previous studies, it was suggested that sulfur-containing molecules, such as proteins containing Fe-S clusters, are necessary in a variety of biological functions, including energy generation, photosynthesis, metabolic reactions, and photoprotection. Sulfate assimilation occurs mostly in the leaves and starts with the activation of SO42− to adenosine 5′-phosphosulfate (APS) via ATP sulfurylase (ATPS) [7,46]. Methionine and cysteine are two amino acids that contain sulfur. It is also present in glutathione, phytochelatins, vitamins (biotin and thiamine), coenzyme A, chlorophyll, and S-adenosyl-methionine [45,47,48].
A significant increase in the DMC content was noticed in sulfate-deprived plants after H2S treatment, which may be due to higher amounts of soluble carbohydrates and the starch content [8,49,50]. Growth of Brassica pekinensis in a SO42−-containing nutrient solution was unaffected after 6 days of H2S treatment at 0.3 μL l−1 H2S, and the amounts of several metabolites, including sulfate, were unaffected. Plants cultivated in a sulfate-deficient medium and treated with 0.1, 0.2, and 0.3 μL l−1 H2S for 6 days relieved the symptoms of sulfur deficiency [29,39,51]. Plant growth was restored, and it was comparable between plants grown in containing 0.5 mM pedospheric SO42− and 0.5 mM pedospheric sulfate + 0.3 μL l−1 atmospheric H2S. In the present study, it was found that foliar-absorbed H2S increased the biomass and SRR after sulfate deficiency, which was also found in various earlier studies [14,22].
It was observed that the free amino acid content in Brassica pekinensis seedlings was negatively correlated with thiol concentration. In the root, there was a positive correlation of chlorophyll content with thiol content, whereas there was a negative correlation of chlorophyll content with free amino acid and nitrate contents [20,39].
Thiol content in the root and chlorophyll content in the shoot were down-regulated after H2S treatment, whereas free amino acid and nitrate contents were up-regulated in the shoots of sulfur-treated plants. Around 2% of the organically decreased sulfur in plants is found as the water-soluble thiol fraction, and under normal circumstances, the tripeptide glutathione makes up greater than 90% of this fraction. Plants synthesize glutathione in two stages and use it for a variety of purposes. Glutamylcysteine is created in the first stage by combining glutamate with cysteine. Glycine is linked to glutamylcysteine in the second stage; this is carried out by glutathione synthase, an enzyme that needs magnesium to be activated [7]. Expression of Group 1 STGs was affected by the thiol content in the root of Brassica pekinensis, according to Jobe et al. [52]; moderate increases and decreases in the thiol content of the root also influenced the expression of Sultr1;2. When seedlings are cultivated in sulfate-containing and SO42− deficient media were compared, in the sulfate-deficient seedlings, the SO42− and thiol contents decreased by about 16-fold and 2.1-fold, respectively; however, the ability of the roots to absorb sulfate increased by about 6-fold. Similarly, Ausma and De Kok [20] observed in barley plants that reduced sulfate and thiol levels are necessary for an increased sulfate-uptake capacity.
The results indicate that when plants were grown in sulfate-containing media in a climate-controlled environment and different concentrations of H2S were applied, the transcription level of the Group 1 STGs Sultr1;1 and Sultr1;2 as well as the SO42− and thiol levels were altered at a minor level. Sultr1;1 was strongly up-regulated in sulfate-deprived seedlings, but Sultr1;2 was minimally affected; sulfate and thiol levels were significantly reduced. When sulfate-adequate plants were exposed to different concentrations of H2S in this investigation, the thiol content gradually increased; however, according to Ausma and De Kok [20], thiol contents strongly increased when plants were exposed to H2S. Sultr1;1 and Sultr1;2 expression was simultaneously up-regulated 10-fold and 2-fold, respectively, in the sulfate-deprived seedlings compared with sulfate-sufficient seedlings. Related results were also found by Etienne et al. [41] while studying how Brassica oleracea regulates SO42− intake and the expression of STGs. This suggests that SO42−-transporter proteins use proton–sulfate co-transport to help plants absorb and transport SO42− through their roots [53]. As reported by Miyoshi and Stappenbeck [54] and Sacchi and Noscito [55], it is believed that G1STs are primarily accountable for the root’s uptake of SO42− from the growth media. By increasing the H2S exposure concentration into the roots of sulfate-free plants, Sultr1;1 and Sultr1;2 expression was reduced by around 1.8-fold and 0.5-fold, respectively. When comparing between seedlings that received enough SO42− and those that did not, the expression of Sultr1;1 and Sultr1;2 increased 35-fold and 3.2-fold, respectively. According to previous studies [14,15,55,56], the two genes of the Group 1 transporters, Sultr1;1 and Sultr1;2, have dissimilar regulatory patterns in the roots of Chinese cabbage. Sultr1;1 was exclusively expressed when SO42− was not present in the root environment, but Sultr1;2 was expressed in both adequate and deficient circumstances. The expression of the SO42− transporters was enhanced along with their capacity to absorb SO42− during SO42− deficiency [41]. The sulfate-uptake capacity in Brassica pekinensis was gradually up-regulated in sulfate-deprived developing seedlings and down-regulated with increasing H2S concentrations up to 0.3 μL l−1. In contrast, the expression level of Sultr1;2 was up-regulated in SO42−-deprived conditions, but it was hardly impacted in developing seedlings or with increasing H2S concentrations. While SO42− deprivation in growing seedlings gradually up-regulated the Sultr1;1 expression level, it was down-regulated with rising H2S concentrations, similar to the SO42−-uptake capacity. The correlations between root SO42−, thiol content, and SO42−-uptake potential of climate-controlled, sulfate-sufficient seedlings were little affected, whereas in sulfate-deprived seedlings, the SO42− content and the thiol content were significantly down-regulated 2.8-fold and 1.5-fold, respectively, at the same time. Reduced SO42− and thiol contents had a considerable, around 5-fold, up-regulated impact on SO42−-uptake capacity. It was observed that SO42− and thiol contents were down-regulated by 4.5 and 2.3-fold, respectively, while the SO42−-uptake capacity was up-regulated by 4-fold, according to a comparison of the correlation of SO42−, thiols, and root SO42−-uptake potential between SO42−-adequate and SO42−-deficient seedlings. When seedlings were exposed to various concentrations of ambient H2S, SO42−, thiols, and SO42−-uptake capacity were unaffected in sulfate-sufficient seedlings but were down-regulated by around 12-fold with increasing H2S exposure up to 0.3 μL l−1 in SO42−-deprived seedlings. This suggests that the regulation of sulfur uptake in plants through the roots is regulated by sulfur transporter genes in the response to SO42− and thiol contents in the plant. Similarly, in previous studies, sulfate transporters have been discovered to enhance SO42− uptake and dispersion in plants [9,28,56].

5. Conclusions

The current study found that Brassica pekinensis can flourish with simply ambient H2S as a sulfur supply source. According to the current study, when plants are deficient in sulfur, there is a significant increase in free amino acid and nitrate contents, while there is a decline in the biomass, SRR, chlorophyll content, and thiol content, which increases the sulfur-uptake capacity of plants from the atmosphere via foliar absorption. The transcription levels of the Group 1 STGs, Sultr1;1 and Sultr1;2, as well as the SO42− and thiol levels, were altered at a diminutive level when plants were grown in sulfate-containing medium in a climate-controlled room and given different concentrations of H2S. When the sulfate-uptake capacity of plants increases, there is a significant enhancement in the expression level of Group 1 STGs (Sultr1;1 and Sultr1;2), which regulate sulfur transportation through roots. Excess sulfur in the environment or media has less influence on seedling growth, physico-chemical parameters, or gene expression of Group 1 STGs.

Supplementary Materials

The following supporting information can be downloaded at: https://www.mdpi.com/article/10.3390/horticulturae9070821/s1, Figure S1: Dendogram based on the UPGMA paired-group algorithm using similarity index correlation for the clustering of sulfate-treated and non-treated plants on the basis of changes in physico-chemical parameters and transcription level of genes (Sultr1;1 and Sultr1;2) in response to incubation time. (1. Initial; 2. 1 day (+S); 3. 2 days (+S); 4. 3 days (+S); 5. 4 days (+S); 6. 1 day (−S); 7. 2 days (−S); 8. 3 days (−S); 9. 4 days (−S). Figure S2: The non-metric multidimensional scaling of sulfate-treated and non-treated plants on the basis of changes in physico-chemical parameters and transcription level of genes (Sultr1;1 and Sultr1;2) in response to incubation time (days). Figure S3: Dendrogram based on the UPGMA paired-group algorithm using similarity index correlation for the clustering of sulfate-treated and non-treated plants on the basis of changes in physico-chemical parameters and transcription level of genes (Sultr1;1 and Sultr1;2) in response to H2S treatment after 6 days (1. 1 day (+S); 2. 2 days (+S); 3. 3 days (+S); 4. 4 days (+S); 5. 1 day (−S); 6. 2 days (−S); 7. 3 days (−S); 8. 4 days (−S). Figure S4: The non-metric multidimensional scaling of sulfate-treated and non-treated plants on the basis of changes in physico-chemical parameters and transcription level of genes (Sultr1;1 and Sultr1;2) in response to H2S treatment after 6 days. Table S1: Correlation of physico-chemical parameters and transcription level of sulfate transporter genes of plants grown in 25% hoagland media having 0.5 mM sulfate. Table S2: Correlation of physico-chemical parameters and transcription level of sulfate transporter genes of plants grown in 25% hoagland media having 0 mM sulfate. Table S3: Correlation of physico-chemical parameters and transcription level of sulfate transporter genes of plants grown in 25% hoagland media and 0.5 mM sulfate and further treated with different concentrations of H2S for 6 days. Table S4: Correlation of physico-chemical parameters and transcription level of sulfate transporter genes of plants grown in 25% hoagland media in absence of sulfate and further treated with different concentrations of H2S for 6 days.

Author Contributions

Conceptualization and supervision: A.P. (Ashish Patel), J.T. and V.K.Y. Investigation and methodology: D.P., M.P., D.A., S.A. and A.P. (Anil Patani) Original draft preparation: A.P. (Ashish Patel), V.K.Y., D.P. and J.T. Review and final editing: A.P. (Ashish Patel), J.T., M.P. and V.K.Y. Software: A.P. and J.T. Funding acquisition and resources: D.A. and S.A. All authors have read and agreed to the published version of the manuscript.

Funding

This research received no external funding.

Data Availability Statement

Data is contained within the article and Supplementary Material.

Acknowledgments

This research was supported by the Researchers Supporting Project number (RSP2023R27), King Saud University, Riyadh, Saudi Arabia. The authors are grateful to the Laboratory of Plant Physiology, Groningen Institute for Evolutionary Life Sciences, University of Groningen, Groningen, The Netherlands and the Department of Life Sciences, Hemchandracharya North Gujarat University, Patan, Gujarat, India for providing the laboratory facilities to carry out the research work.

Conflicts of Interest

The authors declare no conflict of interest.

References

  1. Salehi, B.; Quispe, C.; Butnariu, M.; Sarac, I.; Marmouzi, I.; Kamle, M.; Tripathi, V.; Kumar, P.; Bouyahya, A.; Capanoglu, E.; et al. Phytotherapy and food applications from Brassica genus. Phytother. Res. 2021, 35, 3590–3609. [Google Scholar] [CrossRef] [PubMed]
  2. Reich, M.; Shahbaz, M.; Prajapati, D.H.; Parmar, S.; Hawkesford, M.J.; De Kok, L.J. Interactions of sulfate with other nutrients as revealed by H2S fumigation of Chinese cabbage. Front. Plant Sci. 2016, 7, 541. [Google Scholar] [CrossRef] [PubMed] [Green Version]
  3. De Kok, L.J.; Hawkesford, M.J.; Haneklaus, S.H.; Schnug, E. Sulfur Metabolism in Higher Plants-Fundamental, Environmental and Agricultural Aspects, (Proceedings of the International Plant Sulfur Workshop); Springer International Publishing: Cham, Switzerland, 2017; p. 243. [Google Scholar]
  4. Liu, T.; Chen, J.A.; Wang, W.; Simon, M.; Wu, F.; Hu, W.; Chen, J.B.; Zheng, H. A combined proteomic and transcriptomic analysis on sulfur metabolism pathways of Arabidopsis thaliana under simulated acid rain. PLoS ONE 2014, 9, e90120. [Google Scholar] [CrossRef] [PubMed]
  5. Aghajanzadeh, T.A.; Prajapati, D.H.; Burow, M. Copper toxicity affects indolic glucosinolates and gene expression of key enzymes for their biosynthesis in Chinese cabbage. Arch. Agron. Soil Sci. 2019, 66, 1288–1301. [Google Scholar] [CrossRef]
  6. Qian, Y.L.; Hua, G.K.H.; Scott, J.C.; Dung, J.K.; Qian, M.C. Evaluation of Sulfur-Based Biostimulants for the Germination of Sclerotium cepivorum Sclerotia and Their Interaction with Soil. J. Agric. Food Chem. 2022, 70, 15038–15045. [Google Scholar] [CrossRef]
  7. Hawkesford, M.J.; Cakmak, I.; Coskun, D.; De Kok, L.J.; Lambers, H.; Schjoerring, J.K.; White, P.J. Functions of macronutrients. In Marschner’s Mineral Nutrition of Plants; Marschner, P., Ed.; Elsevier: London, UK, 2023; pp. 201–281. [Google Scholar]
  8. Kovács, S.; Kutasy, E.; Csajbók, J. The Multiple Role of Silicon Nutrition in Alleviating Environmental Stresses in Sustainable Crop Production. Plants 2022, 11, 1223. [Google Scholar] [CrossRef]
  9. Shafiq, B.A.; Nawaz, F.; Majeed, S.; Aurangzaib, M.; Al Mamun, A.; Ahsan, M.; Ahmad, K.S.; Shehzad, M.A.; Ali, M.; Hashim, S.; et al. Sulfate-based fertilizers regulate nutrient uptake, photosynthetic gas exchange, and enzymatic antioxidants to increase sunflower growth and yield under drought stress. J. Soil Sci. Plant Nutr. 2021, 21, 2229–2241. [Google Scholar] [CrossRef]
  10. Aghajanzadeh, T.A.; Prajapati, D.H.; Burow, M. Differential partitioning of thiols and glucosinolates between shoot and root in Chinese cabbage upon excess zinc exposure. J. Plant Physiol. 2020, 244, 153088. [Google Scholar] [CrossRef]
  11. Shahzad, R.; Harlina, P.W.; Ayaad, M.; Ewas, M.; Nishawy, E.; Fahad, S.; Subthain, H.; Amar, M.H. Dynamic roles of microRNAs in nutrient acquisition and plant adaptation under nutrient stress: A review. Plant Omics 2018, 11, 58–79. [Google Scholar] [CrossRef]
  12. Li, Q.; Gao, Y.; Yang, A. Sulfur homeostasis in plants. Int. J. Mol. Sci. 2020, 21, 8926. [Google Scholar] [CrossRef]
  13. Ferrari, M.; Cozza, R.; Marieschi, M.; Torelli, A. Role of Sulfate Transporters in Chromium Tolerance in Scenedesmus acutus M. (Sphaeropleales). Plants 2022, 11, 223. [Google Scholar] [CrossRef] [PubMed]
  14. Heidari, P.; Hasanzadeh, S.; Faraji, S.; Ercisli, S.; Mora-Poblete, F. Genome-Wide Characterization of the Sulfate Transporter Gene Family in Oilseed Crops: Camelina sativa and Brassica napus. Plants 2023, 12, 628. [Google Scholar] [CrossRef]
  15. Kiefer, C.; Willing, E.M.; Jiao, W.B.; Sun, H.; Piednoël, M.; Hümann, U.; Hartwig, B.; Koch, M.A.; Schneeberger, K. Interspecies association mapping links reduced CG to TG substitution rates to the loss of gene-body methylation. Nat. Plants 2019, 5, 846–855. [Google Scholar] [CrossRef] [PubMed]
  16. Xu, Z.R.; Cai, M.L.; Chen, S.H.; Huang, X.Y.; Zhao, F.J.; Wang, P. High-Affinity Sulfate Transporter Sultr1;2 Is a Major Transporter for Cr(VI) Uptake in Plants. Environ. Sci. Technol. 2021, 55, 1576–1584. [Google Scholar] [CrossRef] [PubMed]
  17. Damiani, I.; Drain, A.; Guichard, M.; Balzergue, S.; Boscari, A.; Boyer, J.C.; Brunaud, V.; Cottaz, S.; Rancurel, C.; Da Rocha, M.; et al. Nod Factor Effects on Root Hair-Specific Transcriptome of Medicago truncatula: Focus on Plasma Membrane Transport Systems and Reactive Oxygen Species Networks. Front. Plant Sci. 2016, 7, 794. [Google Scholar] [CrossRef] [PubMed] [Green Version]
  18. Koralewska, A.; Posthumus, F.S.; Stuiver, C.E.E.; Buchner, P.; Hawkesford, M.J.; De Kok, L.J. The characteristic high sulfate content in Brassica oleracea is controlled by the expression and activity of sulfate transporters. Plant Biol. 2007, 9, 654–661. [Google Scholar] [CrossRef]
  19. Wei, X.; Lyu, S.; Yu, Y.; Wang, Z.; Liu, H.; Pan, D.; Chen, J. Phylloremediation of air pollutants: Exploiting the potential of plant leaves and leaf-associated microbes. Front. Plant Sci. 2017, 8, 1318. [Google Scholar] [CrossRef]
  20. Ausma, T.; De Kok, L.J. Atmospheric H2S: Impact on plant functioning. Front. Plant Sci. 2019, 10, 743. [Google Scholar] [CrossRef] [Green Version]
  21. Kuhn, R.; Bryant, I.M.; Jensch, R.; Böllmann, J. Applications of environmental nanotechnologies in remediation, wastewater treatment, drinking water treatment, and agriculture. Appl. Nano 2022, 3, 54–90. [Google Scholar] [CrossRef]
  22. Ausma, T.; Mulder, J.; Polman, T.R.; van der Kooi, C.J.; De Kok, L.J. Atmospheric H2S exposure does not affect stomatal aperture in maize. Planta 2020, 252, 63. [Google Scholar] [CrossRef]
  23. Taha, A.; Patón, M.; Rodríguez, J. Model-based design and operation of biotrickling filters for foul air H2S removal at wastewater networks. J. Environ. Chem. Eng. 2022, 10, 107372. [Google Scholar] [CrossRef]
  24. Aghajanzadeh, T.; Hawkesford, M.J.; De Kok, L.J. The significance of glucosinolates for sulfur storage in Brassicaceae seedlings. Front. Plant Sci. 2014, 5, 704. [Google Scholar] [CrossRef] [Green Version]
  25. Bharwana, S.A.; Ali, S.; Farooq, M.A.; Ali, B.; Iqbal, N.; Abbas, F.; Ahmad, M.S.A. Hydrogen sulfide ameliorates lead-induced morphological, photosynthetic, oxidative damages and biochemical changes in cotton. Environ. Sci. Pollut. Res. 2014, 21, 717–731. [Google Scholar] [CrossRef] [PubMed]
  26. Aghajanzadeh, T.; Hawkesford, M.J.; De Kok, L.J. Atmospheric H2S and SO2 as sulfur sources for Brassica juncea and Brassica rapa: Regulation of sulfur uptake and assimilation. Environ. Exp. Bot. 2016, 124, 10. [Google Scholar] [CrossRef]
  27. Koprivova, A.; Kopriva, S. Molecular mechanisms of regulation of sulfate assimilation: First steps on a long road. Front. Plant Sci. 2014, 5, 589. [Google Scholar] [CrossRef] [PubMed] [Green Version]
  28. Li, L.; Zhang, H.; Chai, X. Genome-wide identification and expression analysis of the MYC transcription factor family and its response to sulfur stress in cabbage (Brassica oleracea L.). Gene 2022, 814, 146116. [Google Scholar] [CrossRef] [PubMed]
  29. Ausma, T.; De Kok, L.J. Regulation of sulfate uptake and assimilation in Barley (Hordeum vulgare) as affected by rhizospheric and atmospheric sulfur nutrition. Plants 2020, 9, 1283. [Google Scholar] [CrossRef]
  30. Amtmann, A.; Armengaud, P. Effects of N, P, K and S on metabolism: New knowledge gained from multi-level analysis. Curr. Opin. Plant Biol. 2009, l12, 275–283. [Google Scholar] [CrossRef]
  31. Zuidersma, E.I.; Ausma, T.; Stuiver, C.E.E.; Prajapati, D.H.; Hawkesford, M.J.; De Kok, L.J. Molybdate toxicity in Chinese cabbage is not the direct consequence of changes in sulphur metabolism. Plant Biol. 2020, 22, 331–336. [Google Scholar] [CrossRef] [Green Version]
  32. Durenkamp, M.; De Kok, L.J. The Impact of Atmospheric H2S on Growth and Sulfur Metabolism of Allium cepa L. Phyton Ann. Rei Bot. 2002, 42, 55–63. [Google Scholar]
  33. Shahbaz, M.; Tseng, M.H.; Stuiver, C.E.; Koralewska, A.; Posthumus, F.S.; Venema, J.H.; Parmar, S.; Schat, H.; Hawkesford, M.J.; De Kok, L.J. Copper exposure interferes with the regulation of the uptake, distribution and metabolism of sulfate in Chinese cabbage. J. Plant Physiol. 2010, 167, 438–446. [Google Scholar] [CrossRef] [PubMed]
  34. Ellman, G.L. Tissue sulfhydryl groups. Arch. Biochem. 1959, 82, 70–77. [Google Scholar] [CrossRef]
  35. Patel, M.; Vurukonda, S.S.K.P.; Patel, A. Multi-trait Halotolerant Plant Growth-promoting Bacteria Mitigate Induced Salt Stress and Enhance Growth of Amaranthus viridis. J. Soil Sci. Plant Nutr. 2023, 23, 1860–1883. [Google Scholar] [CrossRef]
  36. Harris, K.S.; Durek, T.; Kaas, Q.; Poth, A.G.; Gilding, E.K.; Conlan, B.F.; Saska, I.; Daly, N.L.; Van Der Weerden, N.L.; Craik, D.J.; et al. Efficient backbone cyclization of linear peptides by a recombinant asparaginyl endopeptidase. Nat. Commun. 2015, 6, 10199. [Google Scholar] [CrossRef] [PubMed] [Green Version]
  37. Hammer, Ø.; Harper, D.A.; Ryan, P.D. PAST: Paleontological statistics software package for education and data analysis. Palaeontol. Electron. 2001, 4, 9. [Google Scholar]
  38. Ejaz, H.; Bibi, E.; Ali, W.; Ahmad, I.; Lashari, A.; Faiz, H.; Nazar, W. Sulphur and particulate matter affecting on soil and underground plants. J. Agric. Appl. Biol. 2022, 3, 40–49. [Google Scholar] [CrossRef]
  39. Patani, A.; Prajapati, D.; Ali, D.; Kalasariya, H.; Yadav, V.K.; Tank, J.; Bagatharia, S.; Joshi, M.; Patel, A. Evaluation of the growth-inducing efficacy of various Bacillus species on the salt-stressed tomato (Lycopersicon esculentum Mill.). Front. Plant Sci. 2023, 14, 1168155. [Google Scholar] [CrossRef]
  40. Li, H.; Chen, H.; Chen, L.; Wang, C. The Role of Hydrogen Sulfide in Plant Roots during Development and in Response to Abiotic Stress. Int. J. Mol. Sci. 2022, 23, 1024. [Google Scholar] [CrossRef]
  41. Etienne, P.; Sorin, E.; Maillard, A.; Gallardo, K.; Arkoun, M.; Guerrand, J.; Cruz, F.; Yvin, J.C.; Ourry, A. Assessment of Sulfur Deficiency under Field Conditions by Single Measurements of Sulfur, Chloride and Phosphorus in Mature Leaves. Plants 2018, 7, 37. [Google Scholar] [CrossRef] [Green Version]
  42. Zenda, T.; Liu, S.; Dong, A.; Duan, H. Revisiting Sulfur-The once neglected nutrient: It’s roles in plant growth, metabolism, stress tolerance and crop production. Agriculture 2021, 11, 626. [Google Scholar] [CrossRef]
  43. Abdalla, M.A.; Lentz, C.; Mühling, K.H. Crosstalk between selenium and sulfur is associated with changes in primary metabolism in lettuce plants grown under Se and S enrichment. Plants 2022, 11, 927. [Google Scholar] [CrossRef] [PubMed]
  44. Chorianopoulou, S.N.; Bouranis, D.L. The Role of Sulfur in Agronomic Biofortification with Essential Micronutrients. Plants 2022, 11, 1979. [Google Scholar] [CrossRef] [PubMed]
  45. Narayan, O.P.; Kumar, P.; Yadav, B.; Dua, M.; Johri, A.K. Sulfur nutrition and its role in plant growth and development. Plant Signal. Behav. 2022, 2030082. [Google Scholar] [CrossRef] [PubMed]
  46. Przybyla-Toscano, J.; Roland, M.; Gaymard, F.; Couturier, J.; Rouhier, N. Roles and maturation of iron-sulfur proteins in plastids. J. Biol. Inorg. Chem. 2018, 23, 545–566. [Google Scholar] [CrossRef] [Green Version]
  47. Aarabi, F.; Naake, T.; Fernie, A.R.; Hoefgen, R. Coordinating Sulfur Pools under Sulfate Deprivation. Trends Plant Sci. 2020, 25, 1227–1239. [Google Scholar] [CrossRef]
  48. Chung, J.S.; Kim, H.C.; Yun, S.M.; Kim, H.J.; Kim, C.S.; Lee, J.J. Metabolite analysis of lettuce in response to sulfur nutrition. Horticulturae 2022, 8, 734. [Google Scholar] [CrossRef]
  49. Schmidt, F.; De Bona, F.D.; Monteiro, F.A. Sulfur limitation increases nitrate and amino acid pools in tropical forages. Crop Pasture Sci. 2013, 64, 51–60. [Google Scholar] [CrossRef]
  50. Ristova, D.; Kopriva, S. Sulfur signaling and starvation response in Arabidopsis. iScience 2022, 25, 104242. [Google Scholar] [CrossRef]
  51. Zhang, L.; Pei, Y.; Wang, H.; Jin, Z.; Liu, Z.; Qiao, Z.; Fang, H.; Zhang, Y. Hydrogen Sulfide Alleviates Cadmium-Induced Cell Death through Restraining ROS Accumulation in Roots of Brassica rapa L. ssp. pekinensis. Oxid. Med. Cell. Longev. 2015, 2015, 804603. [Google Scholar] [CrossRef] [Green Version]
  52. Jobe, T.O.; Sung, D.Y.; Akmakjian, G.; Pham, A.; Komives, E.A.; Mendoza-Cózatl, D.G.; Schroeder, J.I. Feedback inhibition by thiols outranks glutathione depletion: A luciferase-based screen reveals glutathione-deficient γ-ECS and glutathione synthetase mutants impaired in cadmium-induced sulfate assimilation. Plant J. 2012, 70, 783–795. [Google Scholar] [CrossRef] [Green Version]
  53. Takahashi, H. Sulfate transport systems in plants: Functional diversity and molecular mechanisms underlying regulatory coordination. J. Exp. Bot. 2019, 70, 4075–4087. [Google Scholar] [CrossRef] [PubMed]
  54. Miyoshi, H.; Stappenbeck, T.S. In vitro expansion and genetic modification of gastrointestinal stem cells in spheroid culture. Nat. Protoc. 2013, 8, 2471–2482. [Google Scholar] [CrossRef] [PubMed]
  55. Sacchi, G.A.; Nocito, F.F. Plant Sulfate Transporters in the Low Phytic Acid Network: Some Educated Guesses. Plants 2019, 8, 616. [Google Scholar] [CrossRef] [PubMed] [Green Version]
  56. Neves, M.I.; Prajapati, D.H.; Parmar, S.; Aghajanzadeh, T.A.; Hawkesford, M.J.; De Kok, L.J. Manganese toxicity hardly affects sulfur metabolism in Brassica rapa. In Sulfur Metabolism in Higher Plants-Fundamental, Environmental and Agricultural Aspects; De Kok, L.J., Hawkesford, M.J., Haneklaus, S.H., Schnug, E., Eds.; Springer: Cham, Switzerland, 2017; pp. 155–162. [Google Scholar] [CrossRef]
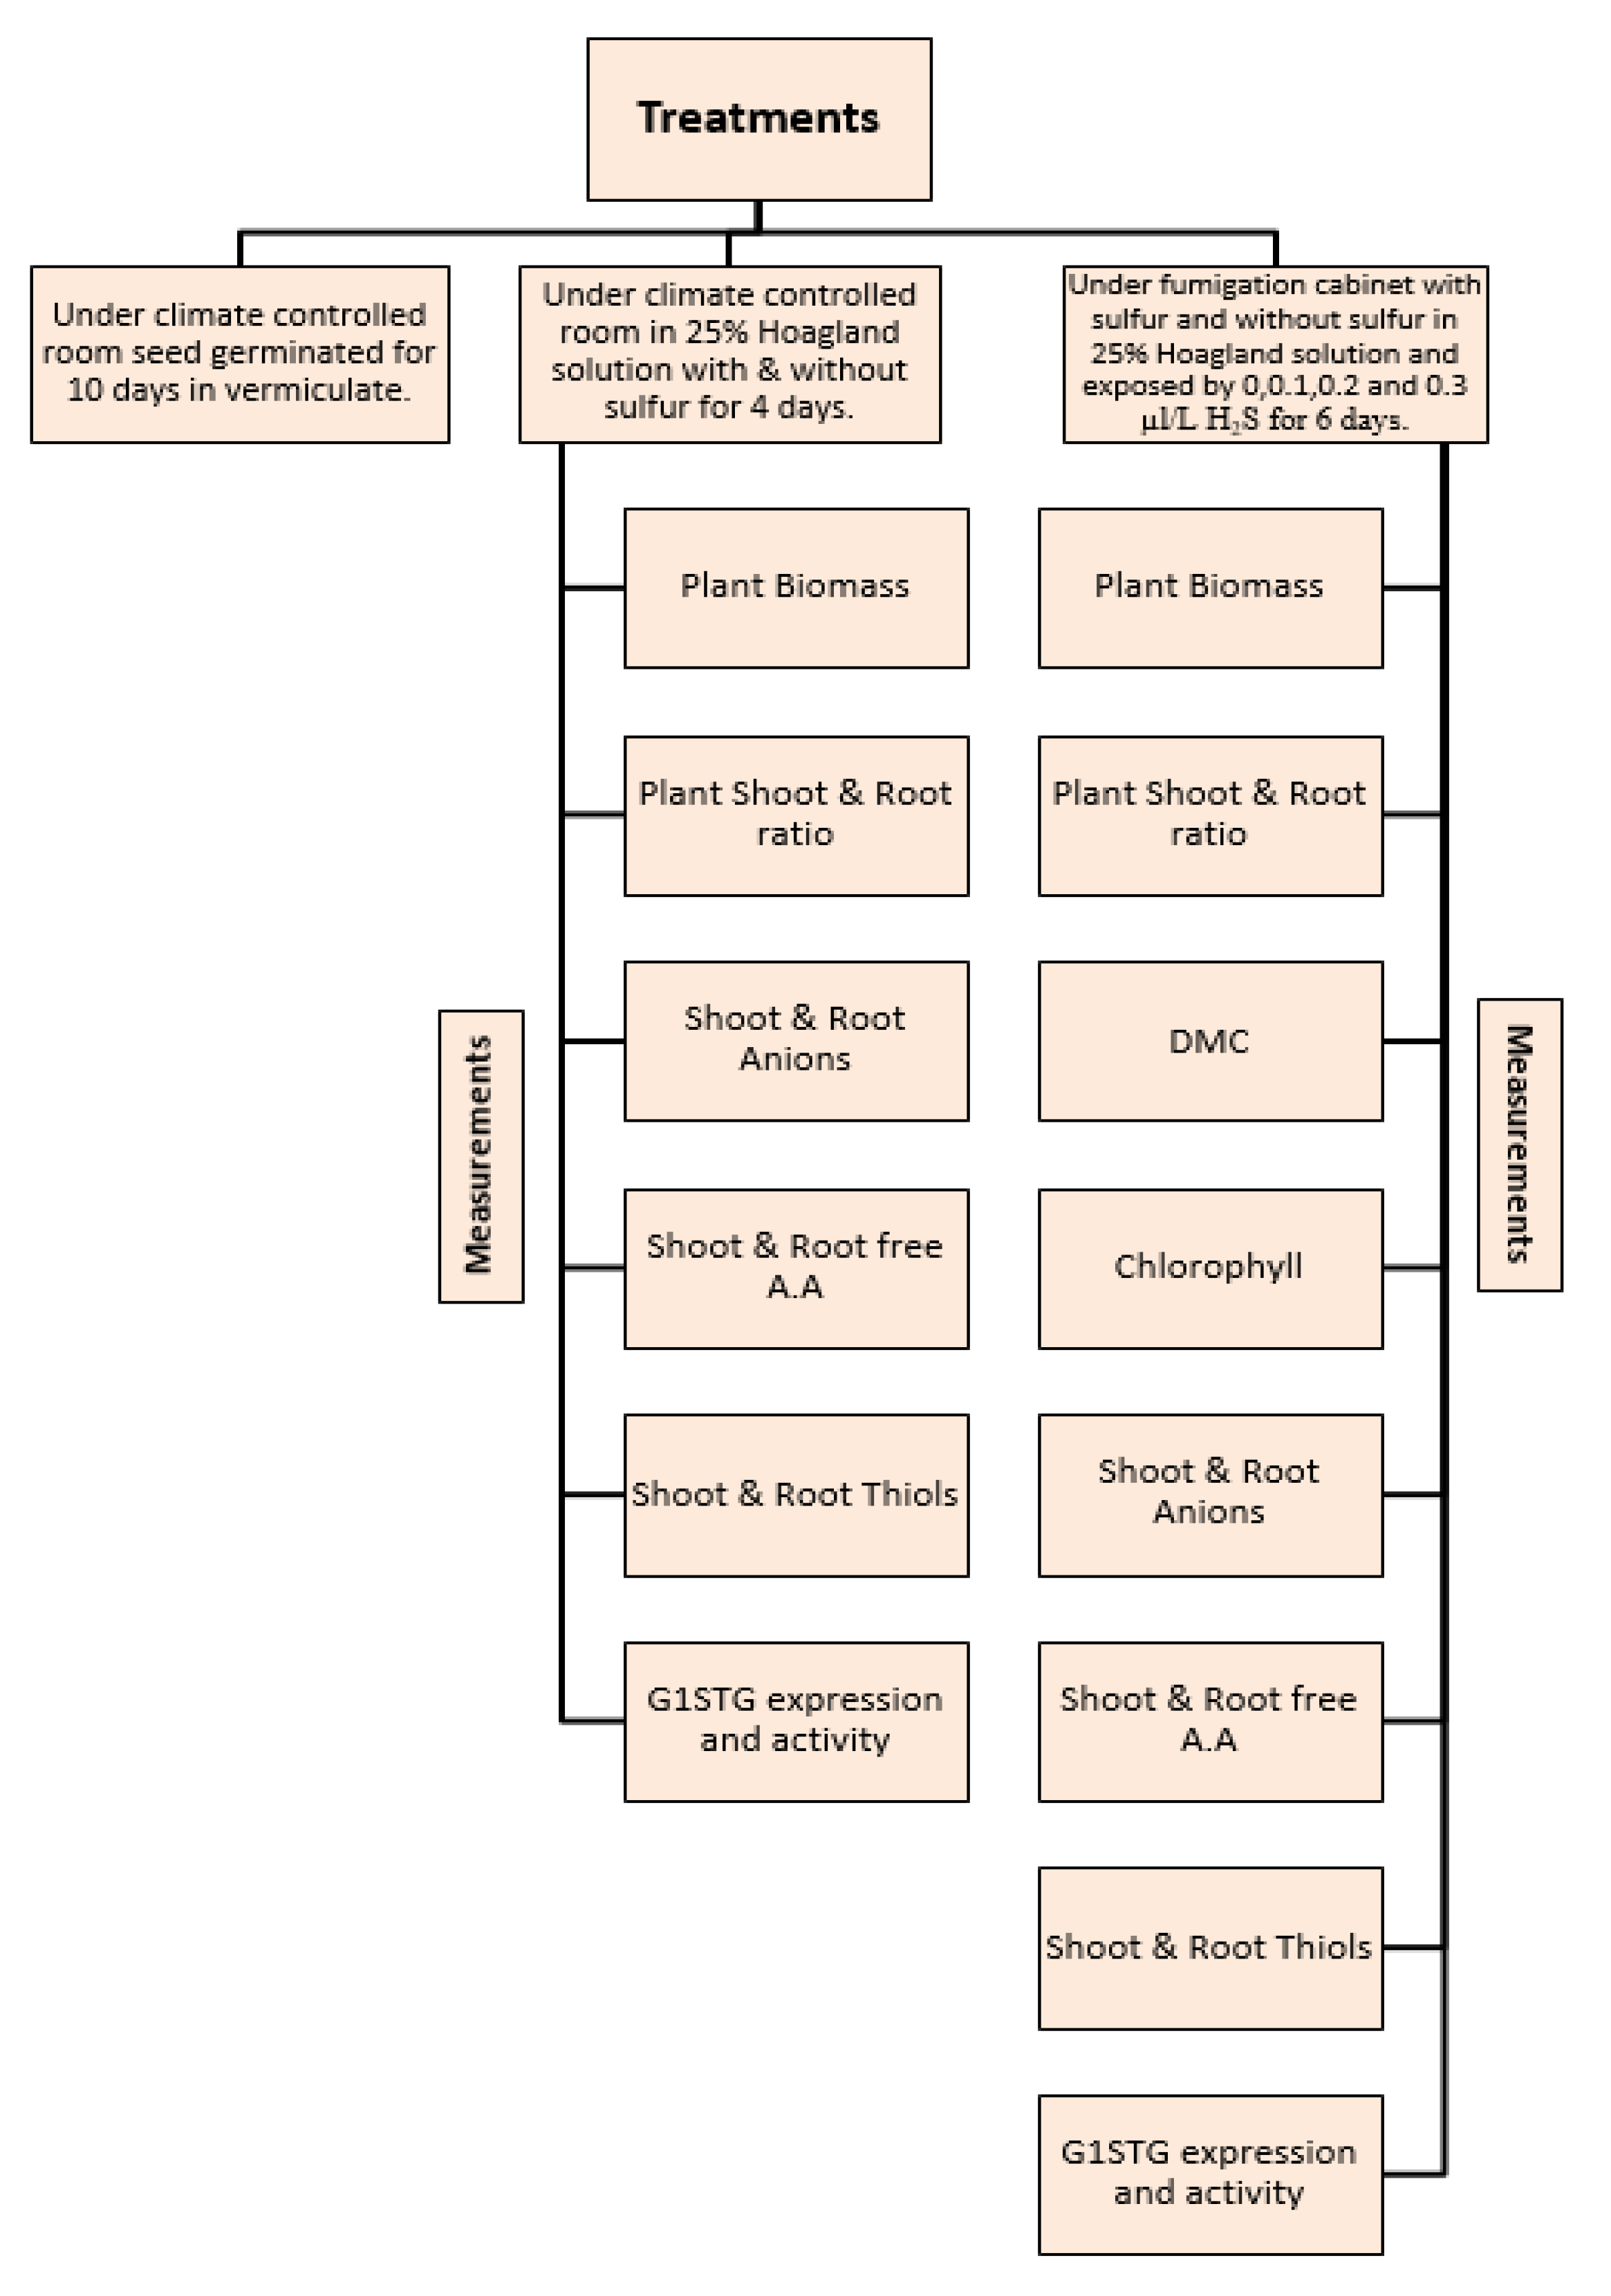
Figure 1. The image represents the flowchart of all treatments and measurements of the study.
Horticulturae 09 00821 g001
Figure 2. The sulfate-uptake capacity and expression of the sulfate transporters Sultr1;1 and Sultr1;2 in the root of sulfate-sufficient (purple bars) or sulfate-deprived (grey bars) Brassica pekinensis seedlings. Data represent the mean of 3 measurements with 6 plants in each group (±SD). Different letters indicate significant differences between treatments (p ≤ 0.01, one-way ANOVA Tukey test).
Horticulturae 09 00821 g002
Figure 3. The sulfate-uptake capacity and expression of the sulfate transporters Sultr1;1 and Sultr1;2 in the root of sulfate-sufficient (purple bars) or sulfate-deprived (grey bars) H2S-fumigated Brassica pekinensis seedlings. Data represent the mean of 3 measurements with 3 plants in each (±SD). Different letters indicate significant differences between treatments (p ≤ 0.01, one-way ANOVA Tukey test).
Horticulturae 09 00821 g003
Figure 4. Principal component analysis (A) of sulfate treated (+S) and non-treated plants (−S) on the basis of changes in physico-chemical parameters and the transcription level of genes (Sultr1;1 and Sultr1;2). The heatmap (B) represents the grouping of sulfate-treated and non-treated plants in the PCA on the basis of changes in their physico-chemical parameters and transcription level of genes in response to incubation time (days).
Horticulturae 09 00821 g004
Figure 5. Principal component analysis (A) of sulfate-treated (+S) and non-treated plants (−S) on the basis of changes in physico-chemical parameters and transcription level of genes (Sultr1;1 and Sultr1;2). Heatmap (B) represents the grouping of sulfate-treated and non-treated plants in the PCA on the basis of changes in physico-chemical parameters and transcription level of genes in response to H2S treatment for 6 days.
Horticulturae 09 00821 g005
Table 1. Primers used in the quantitative PCR (qPCR) analyses.
Primer Sequence (5′-3′)
GeneForwardReverse
Sultr1;1TGGCCATAGTGGTAGCTCAGACCAAGGACGGCTGAT
Sultr1;2GCAACAGACGGTGGAGATGCCCCCAATCGAAAACC
ActinAGCAGCATGAAGATCAAGGT GCTGAGGGATGC
Table 2. The impact of sulfate deprivation on the biomass and the content of sulfate, nitrate, water-soluble non-protein thiols, and free amino acids of Brassica pekinensis seedlings. Ten-day-old seedlings were transferred to a 25% Hoagland solution with 0.5 mM sulfate (+S) or 0 mM sulfate (−S) in a climate-controlled room for up to 4 days. Data on biomass (g FW) and shoot/root ratio represent the mean (±SD) of 3 independent experiments with 12 plants with 4 measurements each. Data on sulfate, nitrate and free amino acid content (µmol g−1 FW) represent the mean (±SD) of 3 measurements with 6 plants each. Data on water-soluble non-protein thiols (µmol g−1 FW) represent the mean (±SD) of 3 measurements with 12 plants each. Different letters indicate significant differences between treatments (p ≤ 0.01, one-way ANOVA Tukey test).
Initial1 Day2 Days3 Days4 Days
+S−S+S−S+S−S+S−S
Plant
Biomass0.08 ± 0.00 a0.08 ± 0.00 a0.09 ± 0.01 b0.11 ± 0.00 ac0.11 ± 0.01 bc0.19 ± 0.03 d0.18 ± 0.01 d0.23 ± 0.02 e0.22 ± 0.03 de
Shoot/root ratio3.7 ± 0.9 acd3.3 ± 0.3 ad3.1 ± 0.4 a3.8 ± 0.6 cd3.6 ± 0.5 ad4.2 ± 0.4 ce4.1± 0.2 c5.1 ± 0.8 b4.5 ± 0.3 be
Shoot
Sulfate12.9 ± 1.7 c13.2 ± 0.8 c11.1 ± 0.7 c13.3 ± 0.8 c6.3 ± 1.1 c14.0 ± 1.3 b3.6 ± 0.7 c14.3 ± 1.7 b1.1 ± 0.4 a
Nitrate0.3 ± 0.1 a8.3 ± 0.5 b8.5 ± 0.3 bc15.7 ± 3.7 cd26.4 ± 5.1 de41.0 ± 3.2 ef49.9 ± 2.9 f49.5 ± 9.3 efg65.8 ± 4.0 g
Thiols0.28 ± 0.02 b0.46 ± 0.01 c0.43 ± 0.03 c0.46 ± 0.04 c0.40 ± 0.03 cd0.61 ± 0.08 c0.31 ± 0.02 bd0.48 ± 0.04 c0.11 ± 0.03 a
Free amino acids3.9 ± 0.8 a20.9 ± 1.0 b23.6 ± 0.9 b19.9 ± 5.4 b24.1 ± 6.5 b21.8 ± 2.2 b25.0 ± 2.9 b27.0 ± 3.9 b27.8 ± 7.6 b
Root
Sulfate9.0 ± 0.5 f9.5 ± 0.0 f7.5 ± 0.2 e10.1 ± 0.5 cf5.6 ± 0.3 d11.5 ± 0.4 g3.9 ± 0.2 b12.5 ± 0.8 g2.7 ± 0.4 a
Nitrate3.1 ± 1.1 a18.1 ± 1.2 b19.6 ± 0.4 b23.7 ± 0.9 c27.2 ± 1.8 cd24.4 ± 2.5 bcd27.5 ± 1.1 d24.6 ± 3.7 bc30.4 ± 2.3 d
Thiols0.30 ± 0.03 b0.32 ± 0.07 ab0.30 ± 0.04 ab0.31 ± 0.01 b0.33 ± 0.03 b0.33 ± 0.02 b0.38 ± 0.03 b0.44 ± 0.08 b0.19 ± 0.02 a
Free amino acids9.7 ± 1.8 a17.1 ± 2.6 abc14.0 ± 1.8 abc16.0 ± 2.4 abc15.5 ± 2.3 abc15.2 ± 0.6 b17.0 ± 1.5 bc18.8 ± 1.2 c19.3 ± 2.7 bc
Table 3. The impact of sulfate deprivation and H2S fumigation on B. pekinensis. Ten-day-old seedlings were transferred to a 25% Hoagland solution containing 0.5 mM sulfate. After 4 days, seedlings were transferred to fresh 25% Hoagland solutions containing either 0.5 mM sulfate (+S) or 0 mM (−S) sulfate. Plants were simultaneously exposed to 0, 0.1, 0.2, or 0.3 µL l−1 H2S. After 6 days, parameters were analyzed. Data on biomass production (g FW) and shoot/root ratio represent the mean (±SD) of 4 independent experiments, with 9 measurements of 3 plants in each. The initial shoot and root fresh weights were 0.222 ± 0.055 g and 0.046 ± 0.011 g FW, respectively. Data on dry matter content (DMC; %) represent the mean (±SD) of 2 independent experiments, with 3 measurements of 3 plants in each. Data on pigments (mg g−1 FW), sulfate, nitrate, thiols, and free amino acids (µmol g−1 FW) represent the mean of 3 measurements of 3 plants in each (±SD). Different letters indicate statistically significant differences between the treatments (p ≤ 0.01, one-way ANOVA Tukey test).
0 µL l−1 H2S0.1 µL l−1 H2S0.2 µL l−1 H2S0.3 µL l−1 H2S
+S−S+S−S+S−S+S−S
Plant
Biomass production 1.86± 0.58 bc1.21 ± 0.23 a1.96 ± 0.32 c1.27 ± 0.26 a1.94± 0.34 c1.63 ± 0.39 b2.03 ± 0.37 c1.91 ± 0.33 c
Shoot/root ratio5.5 ± 0.8 c2.9 ± 0.7 a5.0 ± 0.8 c3.2 ± 0.6 ab5.4 ± 1.2 c3.8 ± 1.2 b5.3 ± 0.9 c3.8 ± 0.6 b
Shoot
DMC8.2± 0.3 a10.1 ± 0.4 b8.3 ± 0.3 a9.9 ± 0.5 b8.4± 0.3 a9.7 ± 0.5 b8.4 ± 0.3 a8.6 ± 0.2 a
Chlorophyll 0.68 ± 0.07 b0.44 ± 0.03 a0.72 ± 0.03 b0.59 ± 0.04 b0.59 ± 0.06 b0.59 ± 0.04 b0.60 ± 0.03 b0.65 ± 0.06 b
Sulfate 14.3 ± 1.3 b2.0 ± 0.2 a14.0 ± 0.5 b2.3 ± 0.6 a13.6 ± 0.3 b2.9 ± 0.7 a12.7 ± 0.8 b3.0 ± 0.3 a
Nitrate 56.4 ± 4.0 a106.0 ± 4.3 b55.1 ± 3.3 a84.3 ± 14.0 b62.6 ± 2.7 ab71.1 ± 2.9 a59.2 ± 7.8 a69.0 ± 15.5 a
Thiols0.36 ± 0.06 b0.13 ± 0.06 a0.44 ± 0.05 abc0.14 ± 0.03 a0.49 ± 0.01 c0.20 ± 0.04 a0.43 ± 0.01 bc0.24 ± 0.02 a
Free amino acids 18.6 ± 0.7 a68.8 ± 3.3 e20.7 ± 1.8 a49.8 ± 6.56 d18.5 ± 0.2 a31.7 ± 3.4 bc23.5 ± 4.5 ab24.9 ± 2.5 ab
Root
DMC 6.9 ± 0.9 b5.7± 0.1 a6.3 ± 0.6 ab6.3 ± 0.3 ab6.2± 0.3 ab5.9 ± 0.4 a6.3 ± 0.5 ab5.9 ± 0.5 a
Sulfate 16.8 ± 3.5 c1.1 ± 0.2 a14.1 ± 1.1 bc1.2 ± 0.4 a12.4 ± 1.3 b1.2 ± 0.1 a10.0 ± 1.4 b1.1 ± 0.4 a
Nitrate 65.1 ± 7.2 a57.9 ± 8.8 abc57.5 ± 3.2 ab63.4 ± 7.5 ad49.3 ± 3.4 bc58.3 ± 2.8 ac44.5 ± 5.1 bc61.6 ± 2.7 ad
Thiols0.37 ± 0.05 b0.18 ± 0.05 a0.34 ± 0.04 b0.20 ± 0.02 a0.32 ± 0.01 b0.19 ± 0.00 a0.32 ± 0.00 b0.21 ± 0.02 a
Free amino acids 21.2 ± 1.8 ab19.6 ± 2.0 ab17.8 ± 0.4 a25.4 ± 1.9 b16.7 ± 1.2 a19.5 ± 1.8 ab16.8 ± 1.3 a18.6 ± 4.3 a
Disclaimer/Publisher’s Note: The statements, opinions and data contained in all publications are solely those of the individual author(s) and contributor(s) and not of MDPI and/or the editor(s). MDPI and/or the editor(s) disclaim responsibility for any injury to people or property resulting from any ideas, methods, instructions or products referred to in the content.