Article

Indirect Quantitative Analysis of Biochemical Parameters in Banana Using Spectral Reflectance Indices Combined with Machine Learning Modeling

1
Evaluation of Natural Resources Department, Environmental Studies and Research Institute, University of Sadat City, Menofia Governorate, Sadat City 32897, Egypt
2
Agricultural Engineering, Surveying of Natural Resources in Environmental Systems Department, Environmental Studies and Research Institute, University of Sadat City, Menofia Governorate, Sadat City 32897, Egypt
*
Author to whom correspondence should be addressed.
Horticulturae 2022, 8(5), 438; https://doi.org/10.3390/horticulturae8050438
Submission received: 21 April 2022 / Revised: 8 May 2022 / Accepted: 9 May 2022 / Published: 14 May 2022

Abstract

:
The primary issues in collecting biochemical information in a large area using chemical laboratory procedures are low throughput, hard work, time-consuming, and requiring several samples. Thus, real-time and precise estimation of biochemical variables of various fruits using a proximal remote sensing based on spectral reflectance is critical for harvest time, artificial ripening, and food processing, which might be beneficial economically and ecologically. The main goal of this study was to assess the biochemical parameters of banana fruits such as chlorophyll a (Chl a), chlorophyll b (Chl b), respiration rate, total soluble solids (TSS), and firmness using published and newly developed spectral reflectance indices (SRIs), integrated with machine learning modeling (Artificial Neural Networks; ANN and support vector machine regression; SVMR) at different ripening degrees. The results demonstrated that there were evident and significant differences in values of SRIs at different ripening degrees, which may be attributed to the large variations in values of biochemical parameters. The newly developed two-band SRIs are more effective at measuring different biochemical parameters. The SRIs that were extracted from the visible (VIS), near-infrared (NIR), and their combination showed better R2 with biochemical parameters. SRIs combined with ANN and SVMR would be an effective method for estimating five biochemical parameters in the calibration (Cal.) and validation (Val.) datasets with acceptable accuracy. The ANN-TSS-SRI-13 model was built to determine TSS with greater performance expectations (R2 = 1.00 and 0.97 for Cal. and Val., respectively). Furthermore, the model ANN-Firmness-SRI-15 was developed for determining firmness, and it performed better (R2 = 1.00 and 0.98 for Cal. and Val., respectively). In conclusion, this study revealed that SRIs and a combination approach of ANN and SVMR models would be a useful and excellent tool for estimating the biochemical characteristics of banana fruits.

1. Introduction

Bananas (avendis subgroup Williams cultivar) are the most consumed fruit in the world in terms of planted area, productivity, and exports. Global exports were over 21 million tons in 2019 [1]. In Egypt, banana is the fourth most common farmed fruit after citrus, grapes, and mangoes [2]. Fruit ripening is a genetically planned and highly coordinated process of organ transition from an unripe to a ripe state. As banana is a climactic fruit, during ripening, it undergoes a series of biochemical and physical changes that transform it into an edible fruit [3,4]. Several metabolic mechanisms are involved in these alterations, including starch to sugar conversion, color changes in the peel and pulp, cell wall degradation, and changes in volatile and acid concentrations [5,6]. Being a perishable crop, around 30% of the banana yield is lost after harvest. For that, the optimum determination of harvest time and out-turn of fruits from the ripening chambers based on biochemical parameters are critical control points for fruit production. Currently, destructive assessments of biochemical parameters are usually based on field sampling of fruits followed by chemical estimation in the laboratory [7]. The primary issues in collecting biochemical information in a large area using chemical laboratory procedures are low-throughput, hard work, time-consuming, and requiring several samples [8,9]. Furthermore, laboratory approaches cannot account for quick changes in fruit quality parameters due to changing use microclimatic conditions.
Fruit consumption has risen dramatically in recent decades, owing to the fast expansion of the economy and the improvement of use livelihood. Consumers, on the other hand, have higher expectations for fruit attributes, including ripeness and total soluble solids (TSS) [10,11]. However, many fruit quality attributes that affect consumer acceptance and price are still tested using traditional methods that are either subjective or time-consuming, so it should come as no surprise that nondestructive and rapid measurement of fruit attributes has become a research hotspot [12,13]. Proximal remote sensing technology offers more benefits than previous approaches, such as high flexibility, short operating time, and minimal investment, and it provides a novel way for quick, nondestructive, and high-throughput collection of biochemical field data. The current global trend is to create non-invasive procedures for determining the quality criteria of various fruits. As non-invasive procedures are quick to implement, few samples are required and are simple to implement process control [14,15,16].
In the electromagnetic spectrum of passive or active reflectance sensors, visible and near-infrared (Vis/NIR) radiation encompasses the wavelength range of 300–2500 nm. Because the Vis/NIR spectrum can identify the signals of practically all important structures and functional groups of organic substances with a rather stable spectrogram, and spectra in this region are commonly utilized for investigation [17,18]. It allows for the spectral data collection on fruits, with the added benefit of high spectral resolution [19,20]. Fruit spectral reflectance is associated with the physiological state. The idea behind these approaches is that the multiple sensors in these devices may detect changes in the optical characteristics of the fruit surface at different bands. The changes in color and texture, as well as the respiration activity of the fruits, are indirectly related to the fruit surface’s optical properties. Consequently, the spectra radiated by the fruit’s surface could be utilized to determine Chl a, Chl b, respiration rate, TSS, and firmness, either directly or indirectly. Fruit spectral reflectance in the Vis and NIR can be affected by changes in fruit color and texture, as well as respiration activity [9,14,21].
This approach has the potential to significantly improve the relationship between spectral variables and biochemical parameters by reducing background noise interference, supplementing information between different bands, and significantly strengthening the association between spectral variables and various biochemical contents. It was feasible to select the best bands for estimating measured parameters, compensating for the drawbacks of using the complete band set. On the other hand, an accurate estimation can only be accomplished by constructing appropriate indices [9,11,14]. For that, the benefit of the current work was the optimization of two band SRIs by integrating two bands produced by distinct 2-D contour maps.
Several studies have evaluated the biochemical characteristics of various fruit species using non-destructive proximal reflectance sensors and spectroscopic techniques [9,15,21,22,23,24,25,26]. For example, Elsayed et al. [25] found that spectral reflectance indices (SRIs) revealed close and extremely significant relationships with Chl and soluble solids content (SCC) of orange, guava, and mandarin fruits under different ripening degrees, with determination coefficients reaching 0.87. Merzlyak et al. [26] found that the spectral index extracted from the NIR at bands of 800 and 700 nm and red at 640 nm was strongly related to the Chl content of apple fruit. Despite the fact that SRIs are a simple approach to evaluating biochemical parameters that can be used to build a proximal lightweight instrument for assessing and regulating biochemical parameters on a large scale in a timely and cost-effective manner, each SRI only has two or three-band combinations. This makes it challenging to construct efficient SRIs for evaluating fruit quality parameters under a number of potentially perplexing circumstances, such as significant fluctuations in fruit component proportions and their impact on the saturation level of the fruit quality measures under investigation. Data-driven models can overcome these problems [27,28]. Both ANN and SVMR were tested to predict the biochemical parameters. Two approaches can combine spectral reflectance data from SRIs as an input variable to predict fruit quality as an output variable. Recently, when used to recognize patterns and function determination, ANN has exhibited good performance as a regression approach [29,30]. ANN can successfully handle intricate computations due to their massively parallel processing design and are thus one of the most popular approaches for high-speed processing of massive datasets [31]. As well as SVMR has been proposed as a method for successfully analyzing fruit quality parameters and resolving significant multi-collinear and noisy variables in the spectrum area [32].
The efficiency of ANN and SVMR models paired with SRIs for predicting Chl a, Chl b, respiration rate, TSS, and firmness has received very little attention. Therefore, the overarching purpose of this study was to create useful tools for making informed decisions on fruit quality parameters. The idea of this study was that machine learning modeling from various SRIs may be valuable tools for monitoring these parameters. The scientific hypothesis investigated in this work is whether changes in biochemical variables may be reflected by variations in SRIs based on a shift in banana fruit skin color from dark green to yellow.
Consequently, the particular objectives of this work were to (i) estimate the changes in the values of the Chl a, Chl b, respiration rate, TSS, and firmness of banana fruits at different ripening degrees; (ii) extract the optimized SRIs for Chl a, Chl b, respiration rate, TSS, and firmness of banana fruits using the 2-D dimensional slice map; (iii) assess the accuracy of published and newly developed SRIs in quantifying the five biochemical parameters of banana fruits, and (iv) estimate the accuracy of ANN and SVMR models in quantifying the five biochemical parameters of banana fruits.

2. Materials and Methods

2.1. Plant Material

Nine Bunches of Williams cultivar in various states of ripening from mature green to fully ripening (dark green to yellow) were chosen from the main market. The second, third, and fourth hands were chosen from each bunch to take samples. Fruit samples were taken immediately to the Environmental Studies and Research Institute’s Pomology Lab. The following biochemical parameters were estimated using sixty fruits that were free of diseases, insects, and mechanical damage.

2.2. Physical Parameters

2.2.1. Respiration Rate

The concentration of CO2 was determined for each fruit sample at room temperature (22 ± 2 °C). The respiration rate was calculated as mL CO2/kg * hour. as follows:
Respiration   rate   ( mL   CO 2 / kg   hour . ) = ( Δ % 10 )   ( free   space   volume   of   container   in   liters ) ( product   fresh   weight   in   kg )   ( time   container   enclosed   in   hours )

2.2.2. Firmness

The firmness of each fruit was measured on two sides using a digital fruit hartester (IC-FR5120, China) with a 6 mm probe, and the result was recorded in newtons.

2.3. Chemical Parameters

2.3.1. Determination of Chlorophyll a & b

To quantify Chla and Chlb of banana fruit, the selected samples were prepared using 0.5 gm of fresh samples and 80% acetone as extraction solvent Marković et al. [33]. UV spectrophotometers were used at 662 and 644 nm, and the results were computed by the following equations and then converted to mg/gm fresh weight:
Chlorophyll a (mg/mL) = 9.784 A662 − 0.990 A644
Chlorophyll b (mg/mL) = 21.426 A644 − 4.650 A662

2.3.2. Total Soluble Solids (TSS)

The TSS of banana fruits was measured using a digital refractometer after each fruit was squeezed individually (Milwaukee, model MA871, Milano, Italy).

2.4. Spectral Reflectance Measurements

After the collection of different banana samples under different ripening degrees, spectral data of each sample was extracted using a passive reflectance sensor (tec5, Oberursel, Germany) with a spectral range from 302 to 1148 nm. The spectral bandwidth is 2 nm and the angle of view is 12°. Each sample was scanned five times along with the banana fruit. To prevent variations in light exposure, spectral measurements of banana samples were obtained over a short period of time during a sunny period. Different banana samples’ spectral reflectance was adjusted using a calibration factor derived from a reference white standard. A black sheet was placed beneath each banana fruit to prevent spectral reflection from the backdrop and ensure total reflectance by the banana fruit.

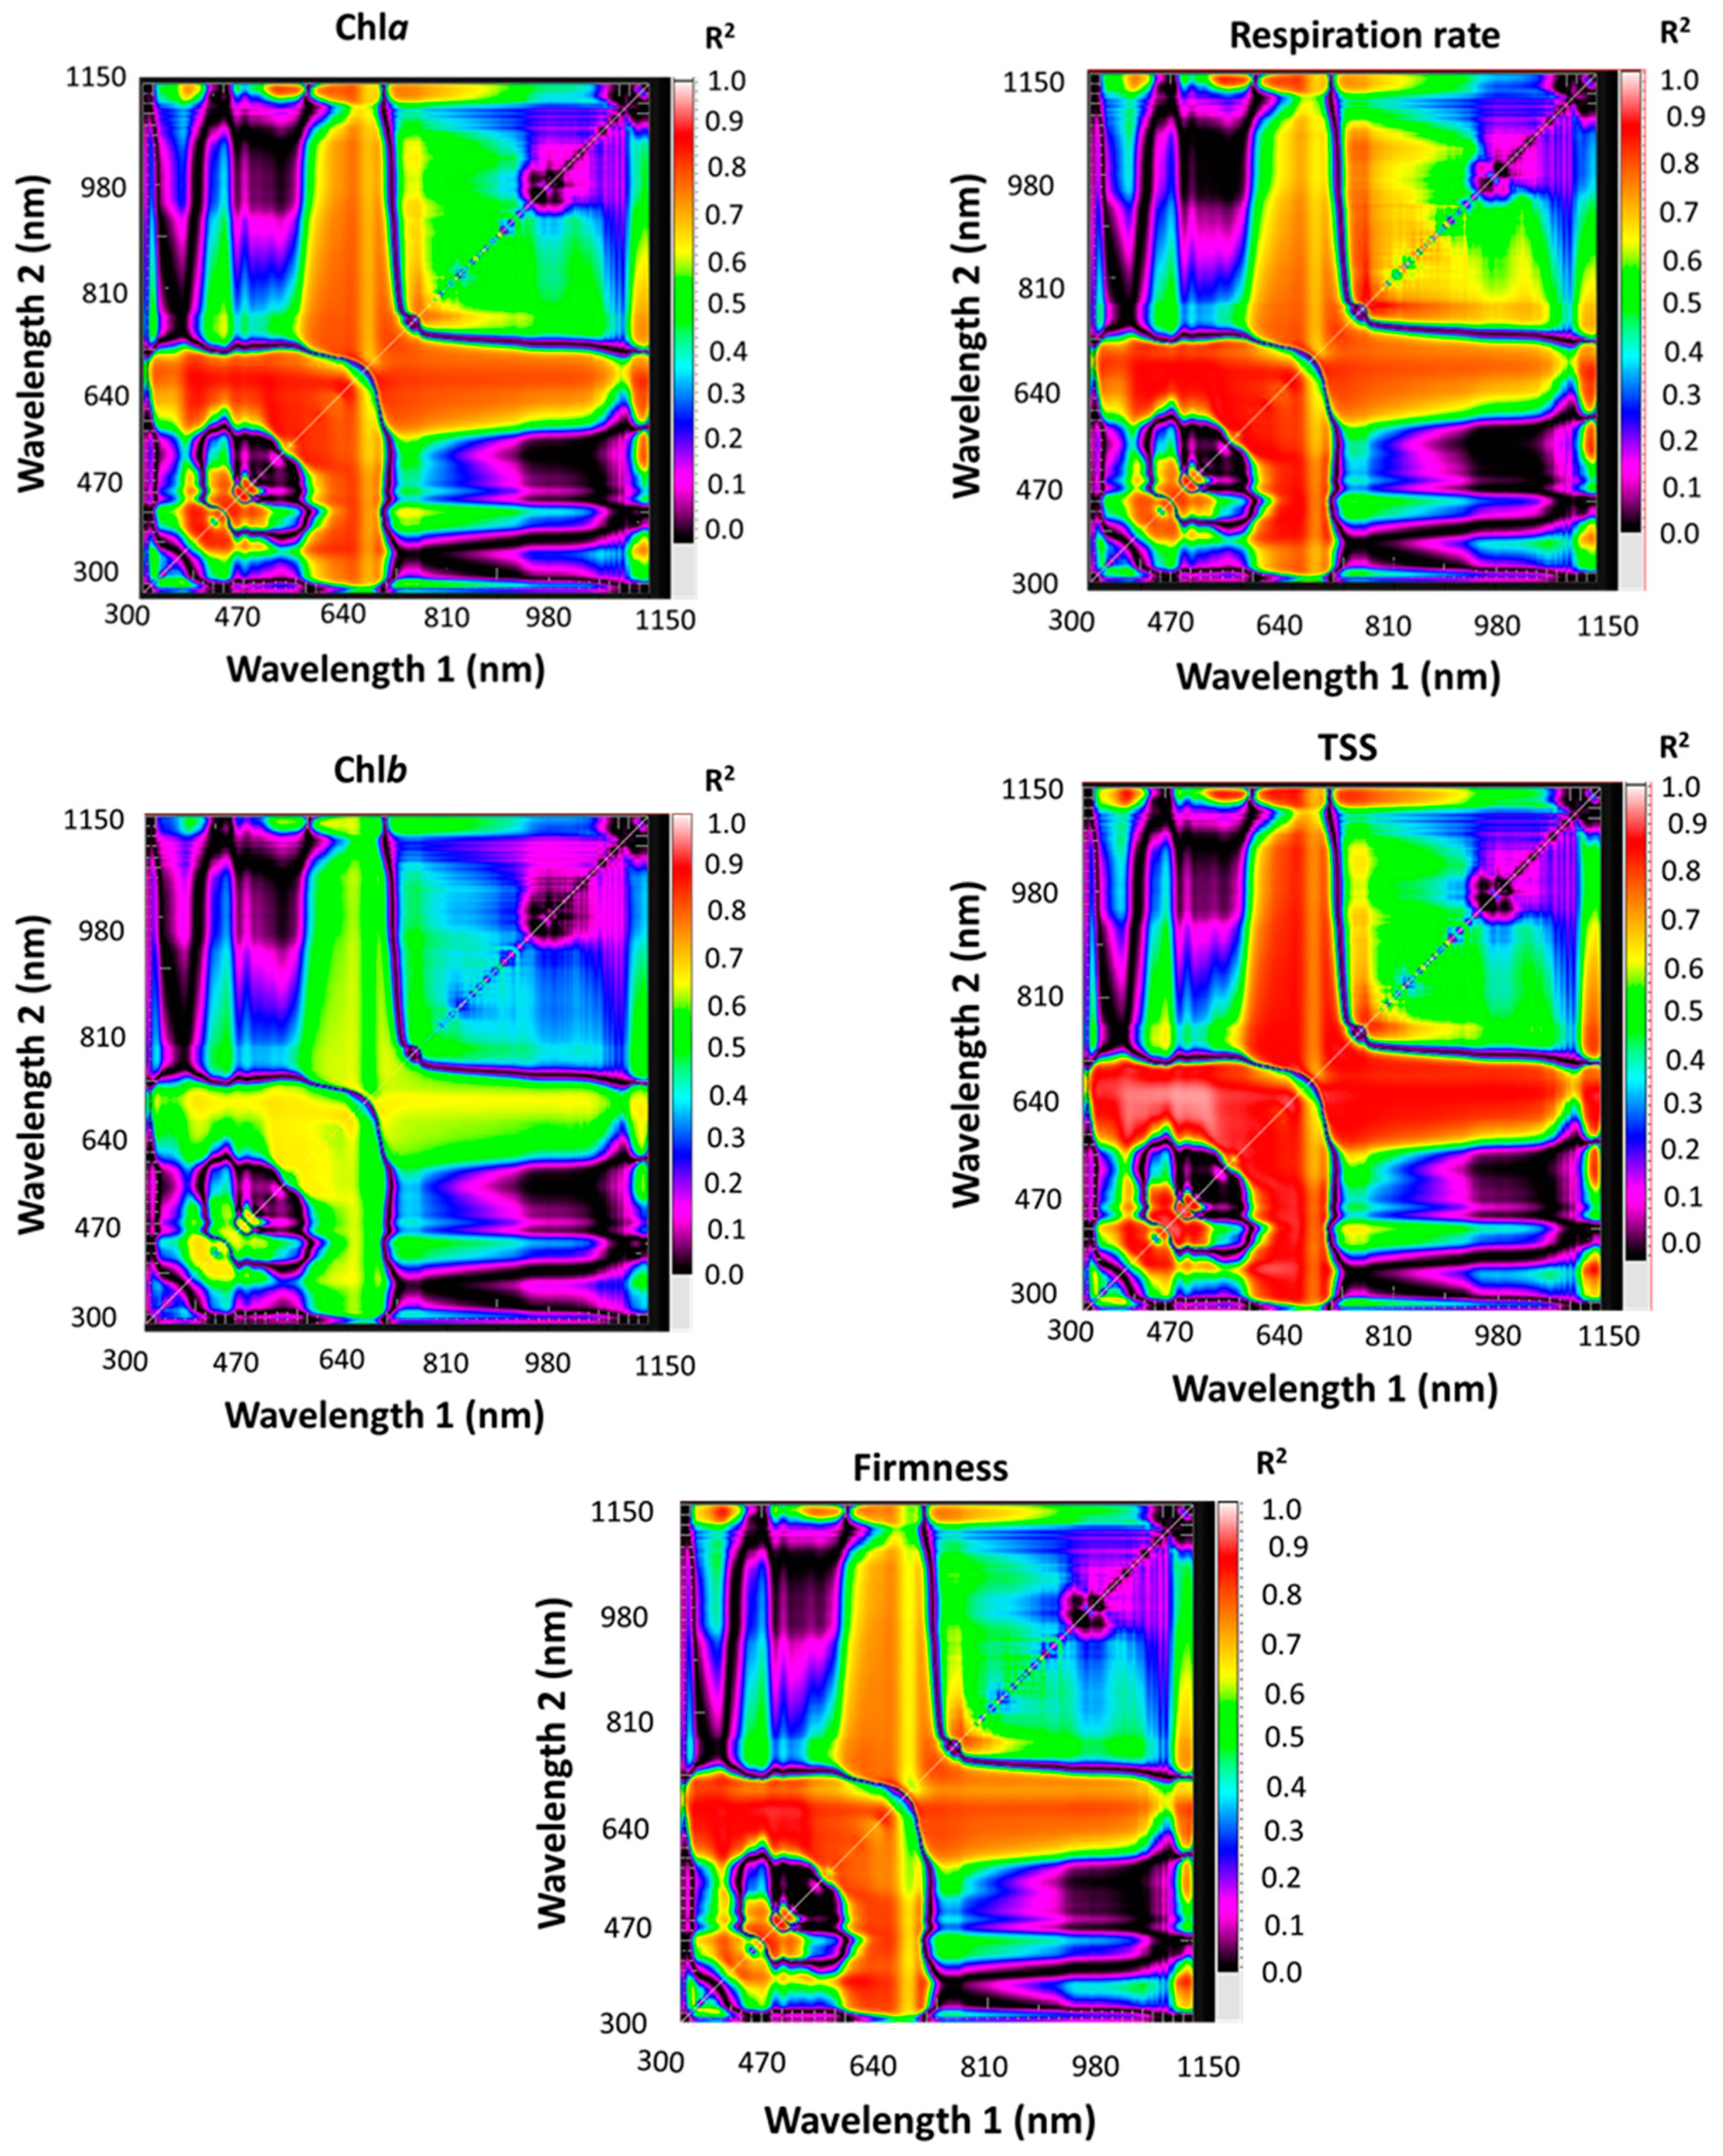
2.5. Selection of SRIs of Banana Fruits

Twenty-seven SRIs, including eleven published indices and sixteen newly developed indices, were examined (Table 1). Contour maps showed statistical metrics as determination coefficients (R2) between the Chl a, Chl b, respiration rate, TSS, and firmness of banana fruits with ratio spectral indices (RSI). The RSI was determined by combining two separate wavelengths in the 302–1148 nm (Figure 1). According to Elsayed et al. [34], the contour maps of spectral reflectance of spectrum region were created. The established maps are useful for determining the ideal spectral region with effective (optimized) wavelengths and recognizing the relevance of SRIs. SRIs were calculated using thirty seven wavelengths (450, 460, 462, 468, 470, 476, 480, 490, 500, 530, 550, 554, 558, 570, 584, 610, 624, 638, 640, 650, 652, 654, 670, 677, 678, 710, 720, 740, 750, 760, 764, 766, 780, 826, and 970).

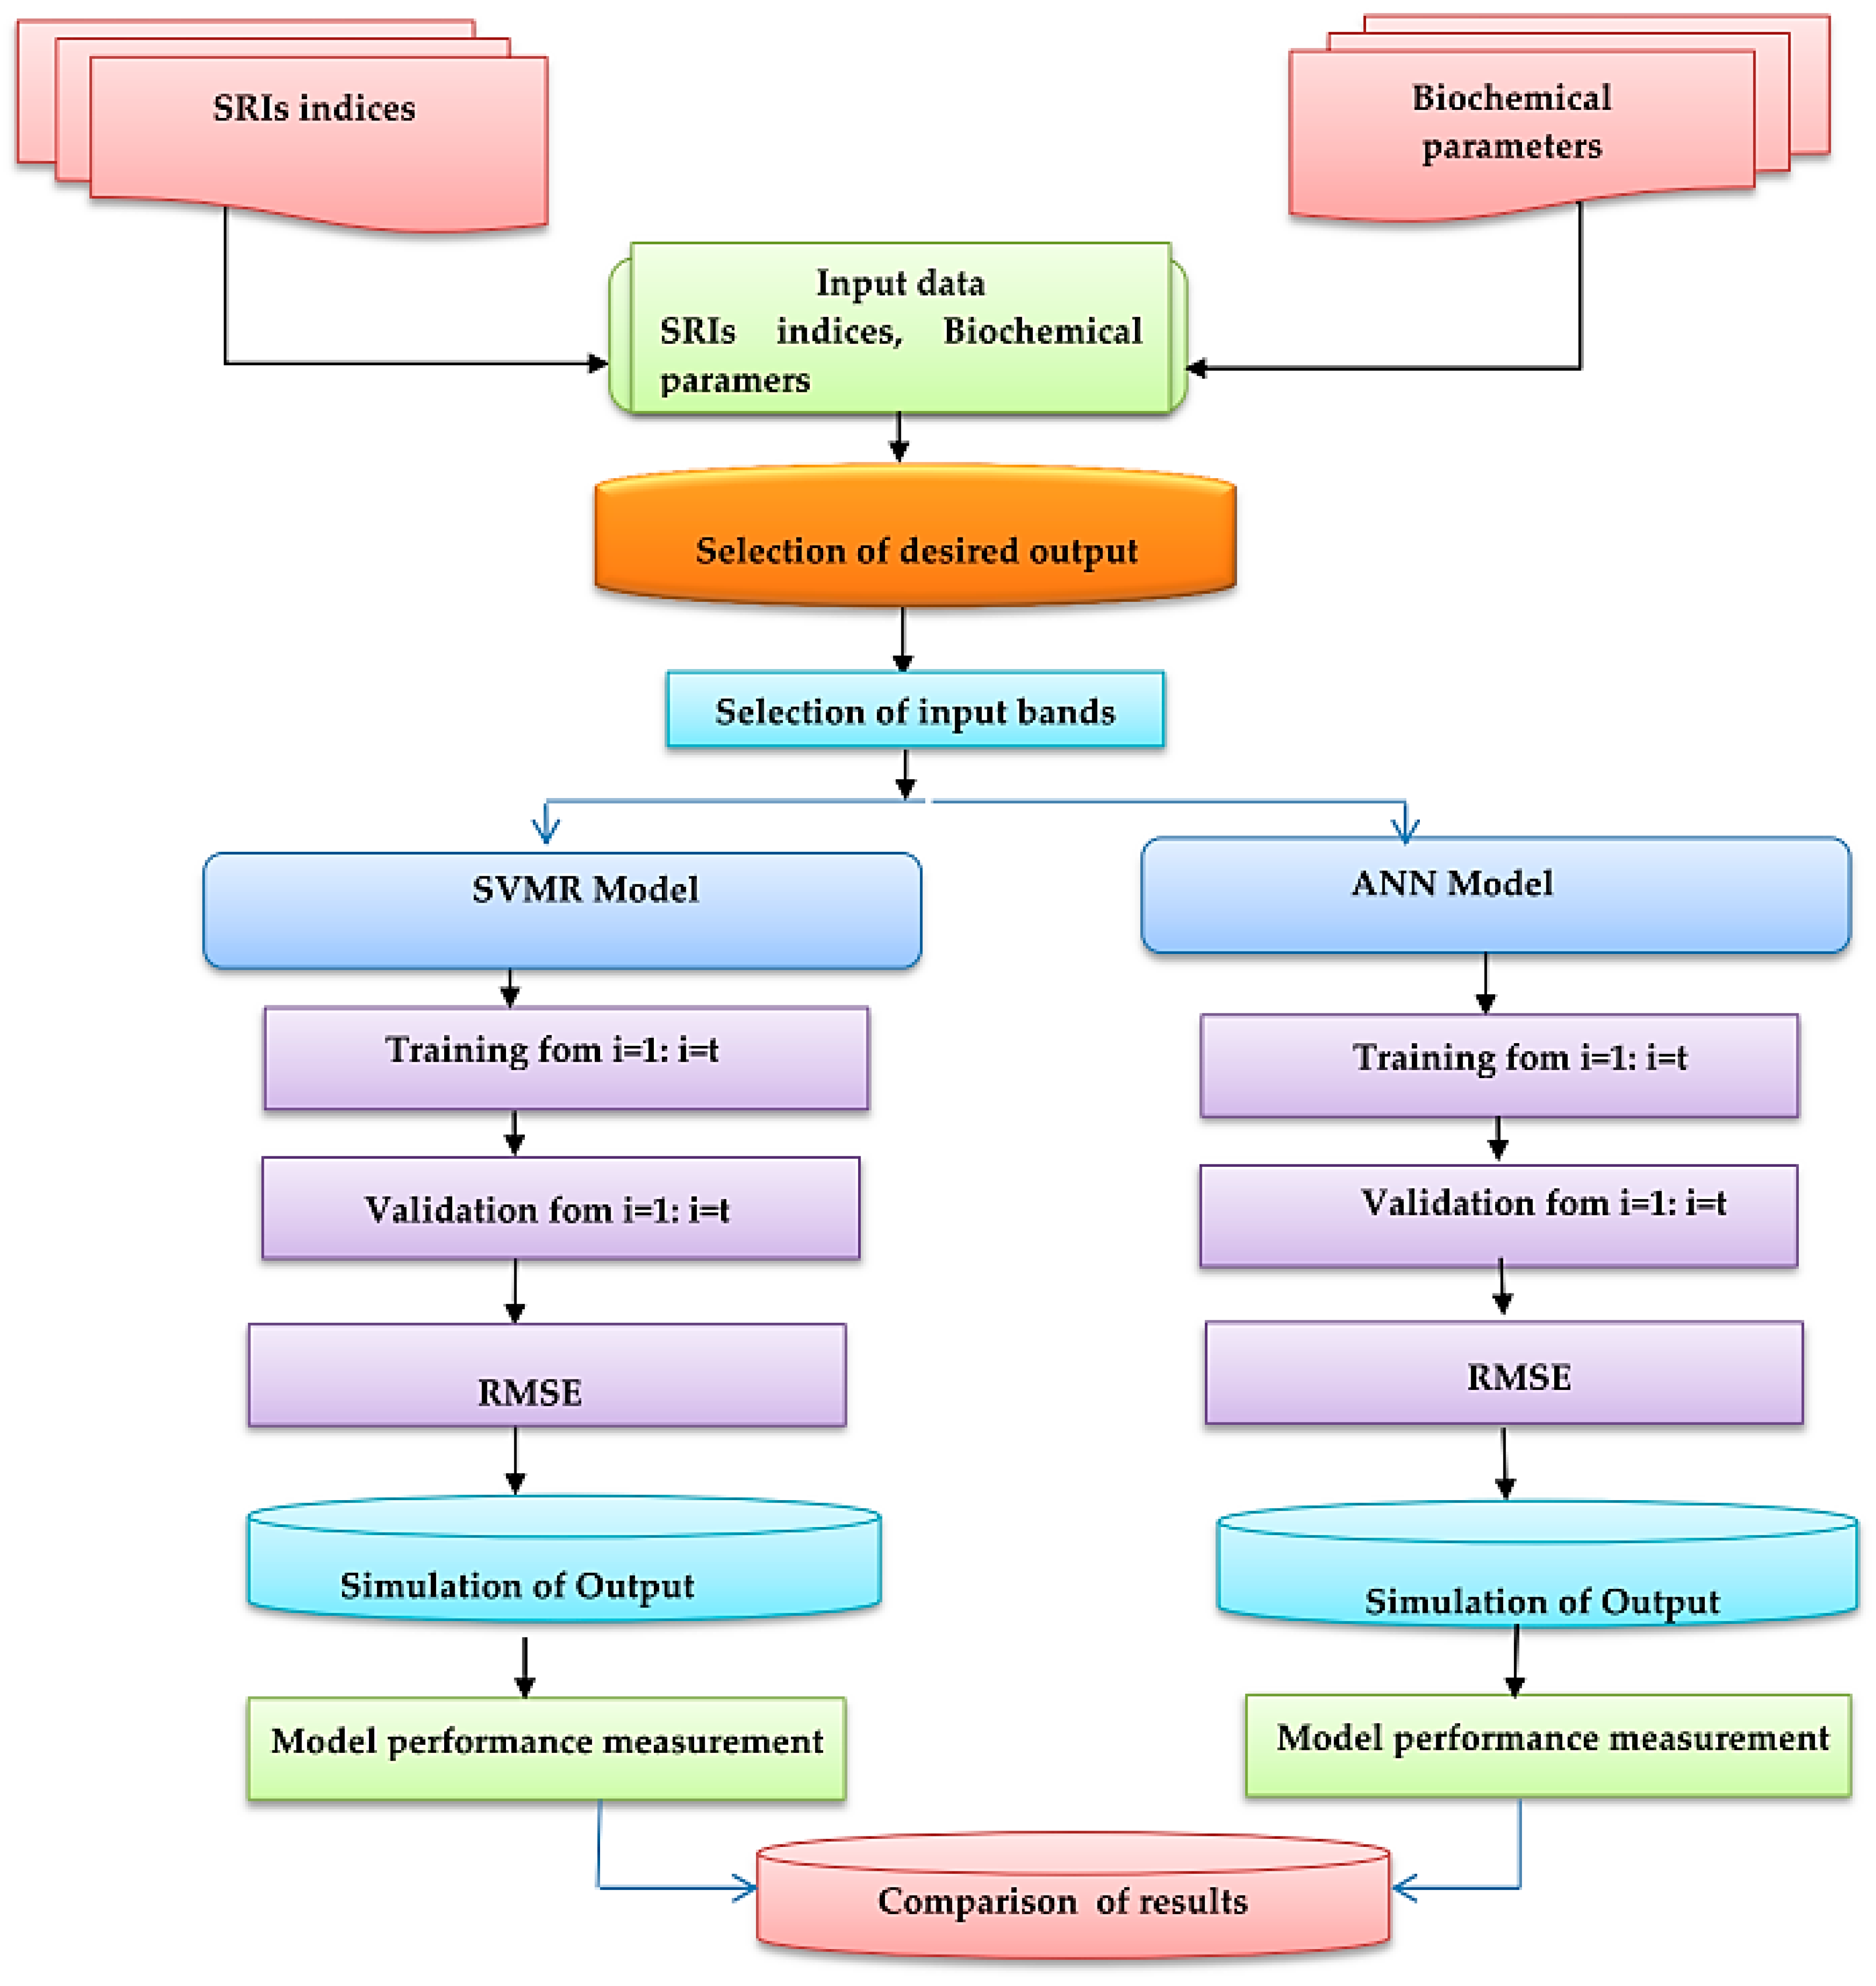
2.6. Back-Propagation Neural Network (BPNN)

The backpropagation neural network (BPNN) model is a kind of artificial neural network that is extensively applied. The BPNN is composed of three layers, as indicated by Schalkoff [39]. The ANN algorithm is a subclass of machine learning techniques that use numerous layers to progressively extract high-level characteristics from the raw input of SRIs (Figure 2). The network is composed of two hidden layers, the number of which is regulated by the accuracy of the regression. The concealed layers correspond to the “activation” nodes and are often denoted by the term “weight”. The output layer displays the parameter’s expected value. At least 2000 iterations were used to train the network. To determine the number of neurons in the hidden layer, the training dataset was validated using the LOOV method. To ensure the algorithm’s efficiency, the Broyden–Fletcher–Goldfarb–Shanno (lbfgs) weight optimizer was utilized [40]. To enhance the regression model’s prediction capability and minimize the dimensionality of hyperspectral images, the following formula was employed to find the most useful feature [41].
M = j = 1 n H [ ( | I |   P j / k = 1 n p   | I |   P j , k   ) | O | j ] i = 1 n p ( j = 1 n H [ ( | I |   P i , j / k = 1 n p   | I |   P i , j , k   ) | O | j ] )
where M denotes the significant measure for the input variable, the number of input variables is denoted by n p , n H is the number of hidden layer nodes, | I |   P j is the weight of the concealed layer’s equivalent corresponding to the pth input variable, and the jth hidden layer and | O | j is the weight of the output layer in absolute terms corresponding to the jth hidden layer.

2.7. SVMR Model

The SVMR method is a machine learning theory for pattern classification and recognition that is ubiquitous. With outstanding results, the SVMR model can handle either regression or classification problems, as well as map both low-dimensional nonlinear inputs and high-dimensional linear outputs. The SVMR model was utilized in this work to generate calibration equations using SRIs as input data and several biochemical parameters as output data. Cross-validation was employed to reduce over-fitting (Figure 2).

2.8. Model Evaluation

The following statistical indicators have been used to evaluate the effectiveness of a regression model: RMSE and R2 [42,43]. Each parameter is described in detail as follows: Fact denotes the actual value determined using laboratory procedures. Fp is the forecast or simulated value, Fave is the mean value, and N is the amount of data points in total.
RMSE = 1 N i = 1 N ( F a c t F p ) 2  
R 2   = ( F a c t F p ) 2 ( F a c t F a v e ) 2

2.9. Statistical Analysis

Analysis of variance was used to assess data for Chl a, Chl b, respiration rate, TSS, and firmness of banana fruits. Duncan’s test was performed to assess the differences between the mean values of the levels of the measured parameters at a 95% confidence level using SPSS 22 (SPSS Inc., Chicago, IL, USA). The same letters imply that there is no significant difference between the ripening degrees (p ≤ 0.05). The relationship between the five measured parameters was determined using Pearson’s correlation coefficient matrix. Simple regressions were used to calculate the association between the SRIs and the measured parameters (Sigma Plot 11.0, Palo Alto, CA, USA), R2 values and significance levels were determined at 0.001.

3. Results and Discussion

3.1. Variation of Biochemical Parameters under Different Ripening Degrees and Correlation Analysis for Banana Fruits

Ripening degrees have a significant impact on the biochemical characteristics of banana fruits. The Chl a, Chl b, and firmness values of banana fruits decreased during the ripening stages. While the respiration rate and TSS of banana fruits increased with increasing the fruit’s ripening. Significant difference between the mean values of each biochemical parameter at different ripening degrees was found (Table 2). The findings reveal a broad range of values for all measured parameters at various stages of ripening (Table 2). The Chl a values ranged from 1.397 to 18.5 (mg g−1), the Chl b from 2.774 to 7.421 (mg g−1), respiration rate from 6.705 to 77.084 (mL CO2/kg*hour), TSS from 2.6 to 23.3 (%) and the firmness from 2.838 to 31.7 (N).
The reduction in Chla values of fruits may be used as a key factor for determining fruit quality [11,15]. Subagio et al. [44] and Ringer and Blanke [45] reported that the peel color of banana fruit changes from green to yellow during the ripening stage and Chl a is the essential chemical responsible for the shift in peel color. In the ripening stage of fruit, the amount of chlorophyll declines and eventually disappear [46,47,48,49]. The findings reveal a broad range of mean values for Chl a and Chl b at various stages of ripening. The TSS was low at the mature stage with a mean value of 4.05 (%) and it was high at the ripening stage with a mean value of 23.3 (%). The reason is that starch is transformed into simple sugars throughout the ripening phase by enzymatic hydrolysis of starch [5,50]. Furthermore, these findings are consistent with Maduwanthi and Marapana [50], who reported that the fresh pulp of the green fruit contains only approximately 1 to 2% sugar, which climbs to 15 to 20% when the fruit at ripeness. The respiration rate also increased from 6.7 to 77.084 (mL CO2/kg*hour) with increasing the ripening stage, and these findings are consistent with Moreno et al. [4], who found that respiration rate continuously increased during storage for different banana varieties. Where at the start of storage, fruits were in a pre-climacteric stage, with a low baseline metabolism and respiration rate. Then, the rate of respiration and ethylene synthesis rose when the climacteric period began. The firmness was high at the green mature stage with a mean value of 31.7 (N) and it was low at the ripening stage with a mean value of 3.80 (N). One of the key reasons for the peel firmness loss during banana ripening is the degradation of cell wall polysaccharides and enzymatic hydrolysis of starch [50] and water displacement from the peel to the pulp. The softening of the banana, which makes it edible, was linked to a decrease in firmness from green to the overripe stage [46,51].
Table 3 shows the correlation coefficients (r) for the biochemical parameter of banana fruits. Correlation analysis showed that all selected biochemical parameters of banana fruit were significantly correlated. Significant positive correlations were found between Chl a, Chl b, and firmness, as well as significant negative correlations, were found between these indicators and respiration rate and TSS. All biochemical characteristics of banana fruit had strong correlations ranging from 0.67 to 0.97. Elsayed et al. [11] discovered substantial positive correlations between Chl a and Chl b, as well as significant negative correlations between Chl and SSC parameters in three distinct fruit types. In addition, Costa et al. [52] discovered that Chl content is related to SSC and firmness and so may be used as a ripening indicator.

3.2. Variation of SRIs at Different Ripening Degrees for Banana Fruits

The properties of light reflected from the surface of the fruit at multiple wavebands in the magnetic spectrum can be employed as markers for changes in biochemical parameters of fruit contents [17,18,20,23]. Remarkably, these changes induce significant alteration in the values of SRIs reflected from the fruit surface under different ripening degrees at specific bands across the entire spectrum region. As presented in Table 4, all the tested spectral indices were extracted as indicators of biochemical parameters. At different stages of ripening, the values of various SRIs showed dramatic and significant changes. As seen in the abovementioned Table 2, there were clear considerable variances in SRIs values at different ripening degrees, which might have been due to large variations in biochemical parameter values, as shown in Table 3. For example, quantitative analyses revealed that the Chl a, Chl b, respiration rate, TSS, and firmness mean values in Table 3 significantly changed from 2.282 to 12.160, from 3.651 to 5.654, from 13.046 to 52.230, from 4.057 to 20.563, and from 3.80 to 27.630, respectively, followed by changes in the mean values of newly constructed indices such as RSI450,640, RSI500,624, RSI638,1138, and RSI780,650 from 0.263 to 0.472, from 0.380 to 0.638, from 0.704 to 1.080, and from 1.686 to 4.437 (Table 4). SRI values that gradually increase or decrease are related to the variation in the values of biochemical parameters of banana fruits at different ripening degrees. There was no significant difference in the values of five published indices (GI, NCI, NDVI780,670, NDVI826,670, and NDVI970,670) at mature and semi-ripening stages. Generally, the spectral characteristics of banana fruit skin at different ripening degrees demonstrate significant changes in the SRIs values. This may be due to changes in physiological status, cell structure, fruit pigments, physical and chemical, and organic substances [9,11,14,24,25].

3.3. Evaluation of Spectral Reflectance Indices (SRIs) to Assess the Biochemical Parameters

Previously published and newly developed two-band SRIs were examined in this study to determine their efficacy in detecting Chl a, Chl b, respiration rate, TSS, and firmness of banana fruits. According to the data shown in Table 5, it is clear that the newly developed two-band SRIs are more effective at measuring different biochemical parameters. The published SRIs also significantly determined the selected biochemical parameters. The published SRIs presented R2 values varied from 0.66 to 80, from 0.47 to 0.64, from 0.61 to 81, from 0.74 to 0.87, and from 0.66 to 0.78 for Chl a, Chl a, respiration rate, TSS, and firmness, respectively. The newly developed two-band SRIs recorded R2 values varied from 0.75 to 0.87, from 0.53 to 0.63, from 0.76 to 89, from 0.79 to 0.95, and from 0.75 to 0.90 for Chl a, Chl b, respiration rate, TSS, and firmness, respectively. The SRIs that were extracted from VIS/VIS, VIS/NIR, and NIR/NIR showed the best R2 with biochemical parameters. For example, RSI462,468 was extracted from the blue region in the visible spectrum and showed the highest R2 = 0.87 and 0.65 for Chl a and Chl b, respectively. RSI450,640 was extracted from the blue and red regions in the visible spectrum and showed the highest R2 = 0.95 and 0.90 for total soluble solids (TSS) and firmness, respectively. As well as both RSI766,764 and RSI780,764 were extracted from the NIR region and showed the highest R2 = 0.89 for the respiration rate of banana fruits. In agreement with these results, Ruiz-Altisent et al. [53] discovered that reflectance at 450 nm and 680 nm were both related to peach firmness, but the linear correlation factor was modest (R2 < 0.6) when only considering reflectance measurements from two wavelengths. In addition, for “Golden Delicious” apples, Rutkowski et al. [20] discovered that the anthocyanin index was substantially associated with fruit firmness and titratable acidity. Nagy et al. [14] discovered that the 678 nm wavelength is sensitive to Chl content, and the reflectance at 700 nm fluctuated more when the Chl content was high.

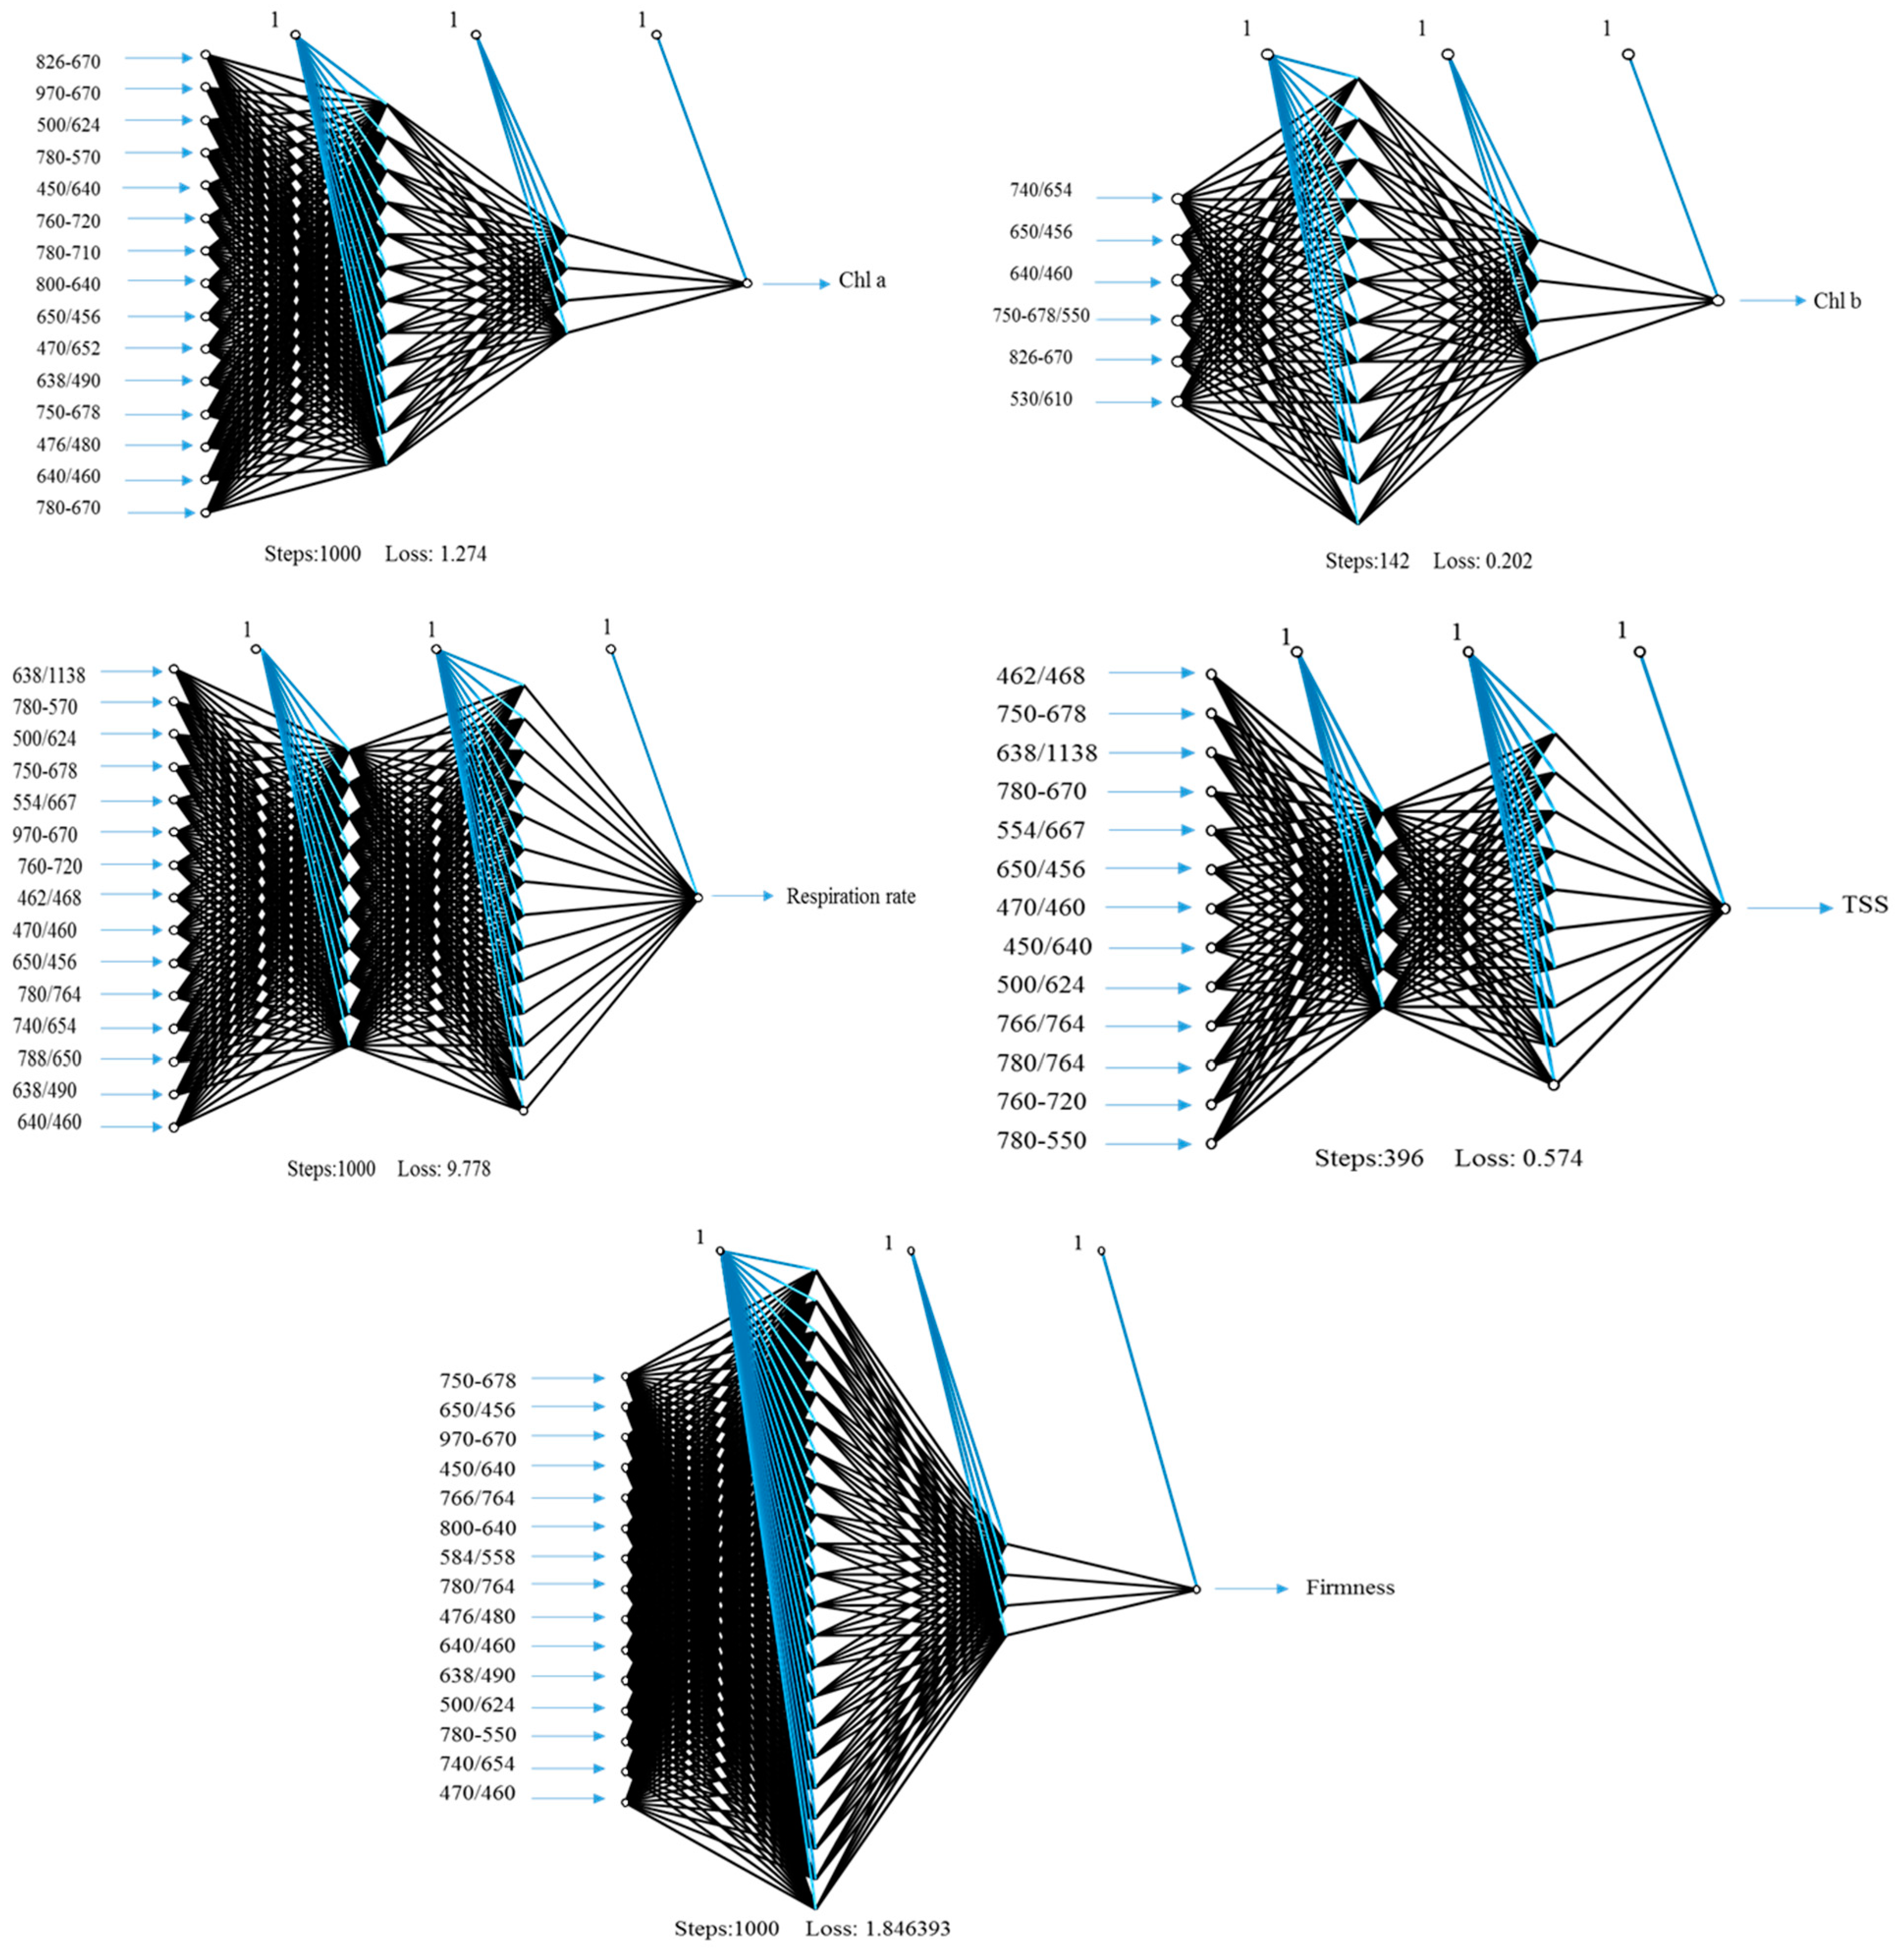
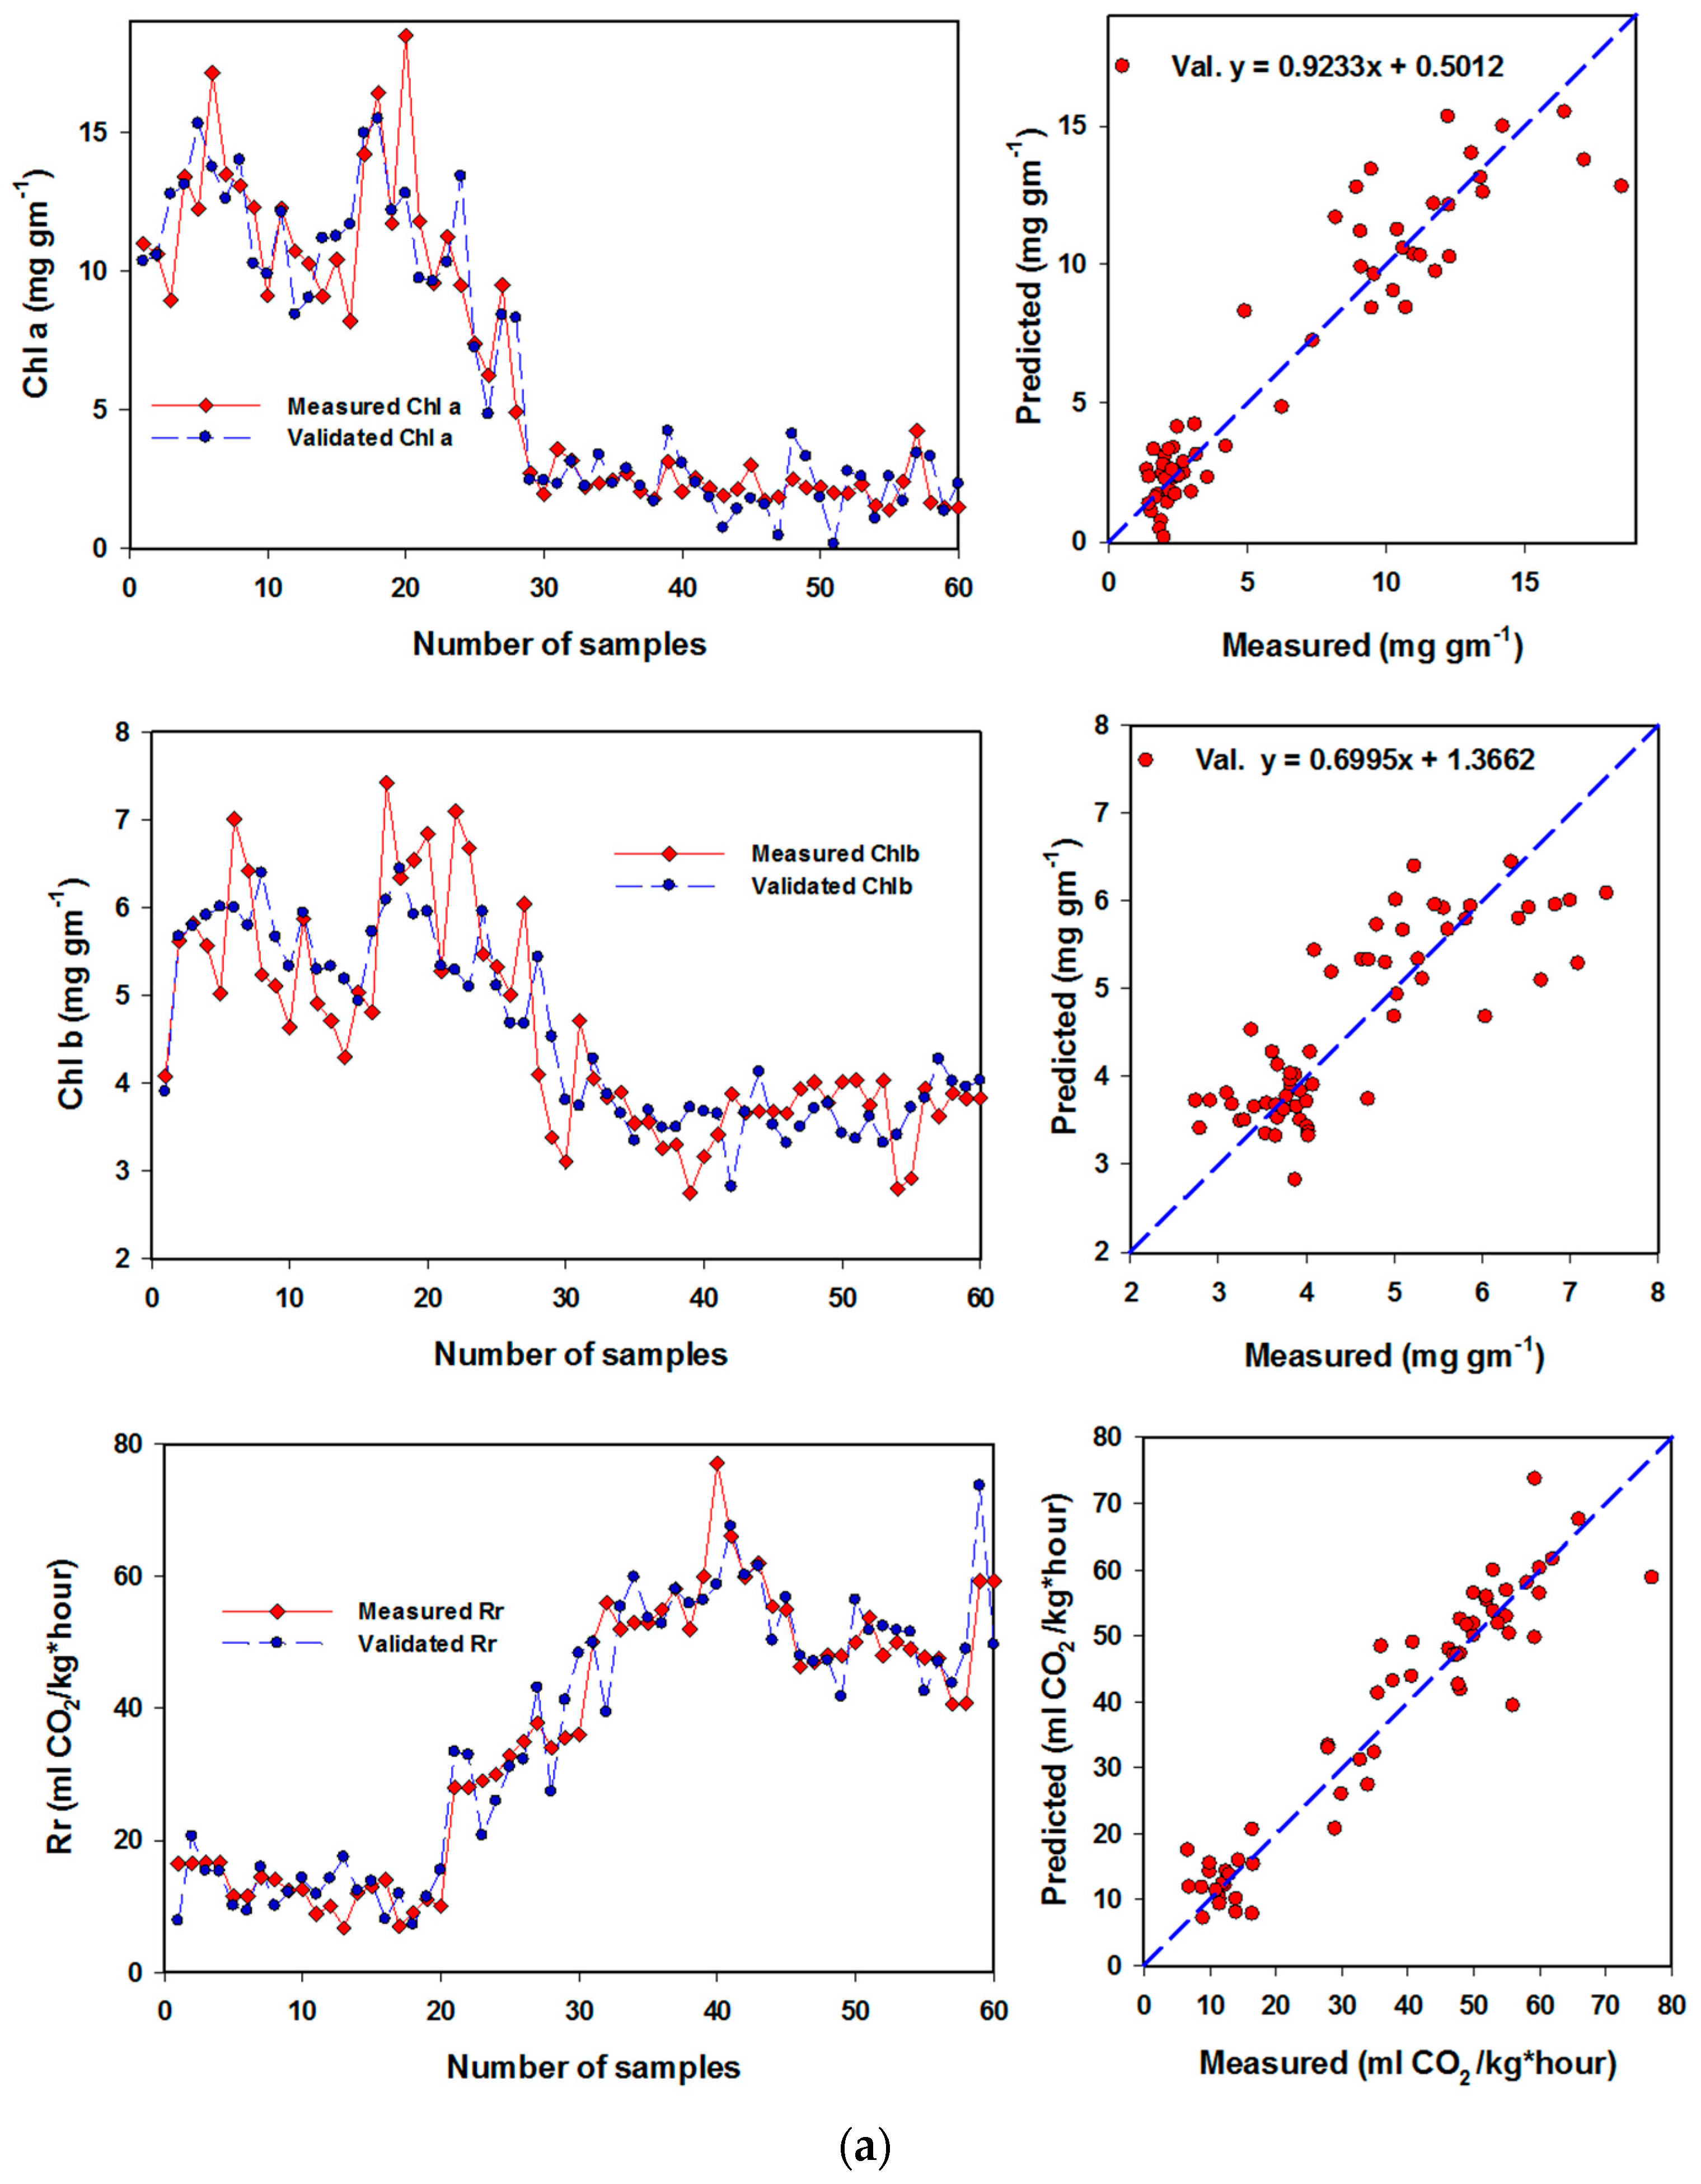
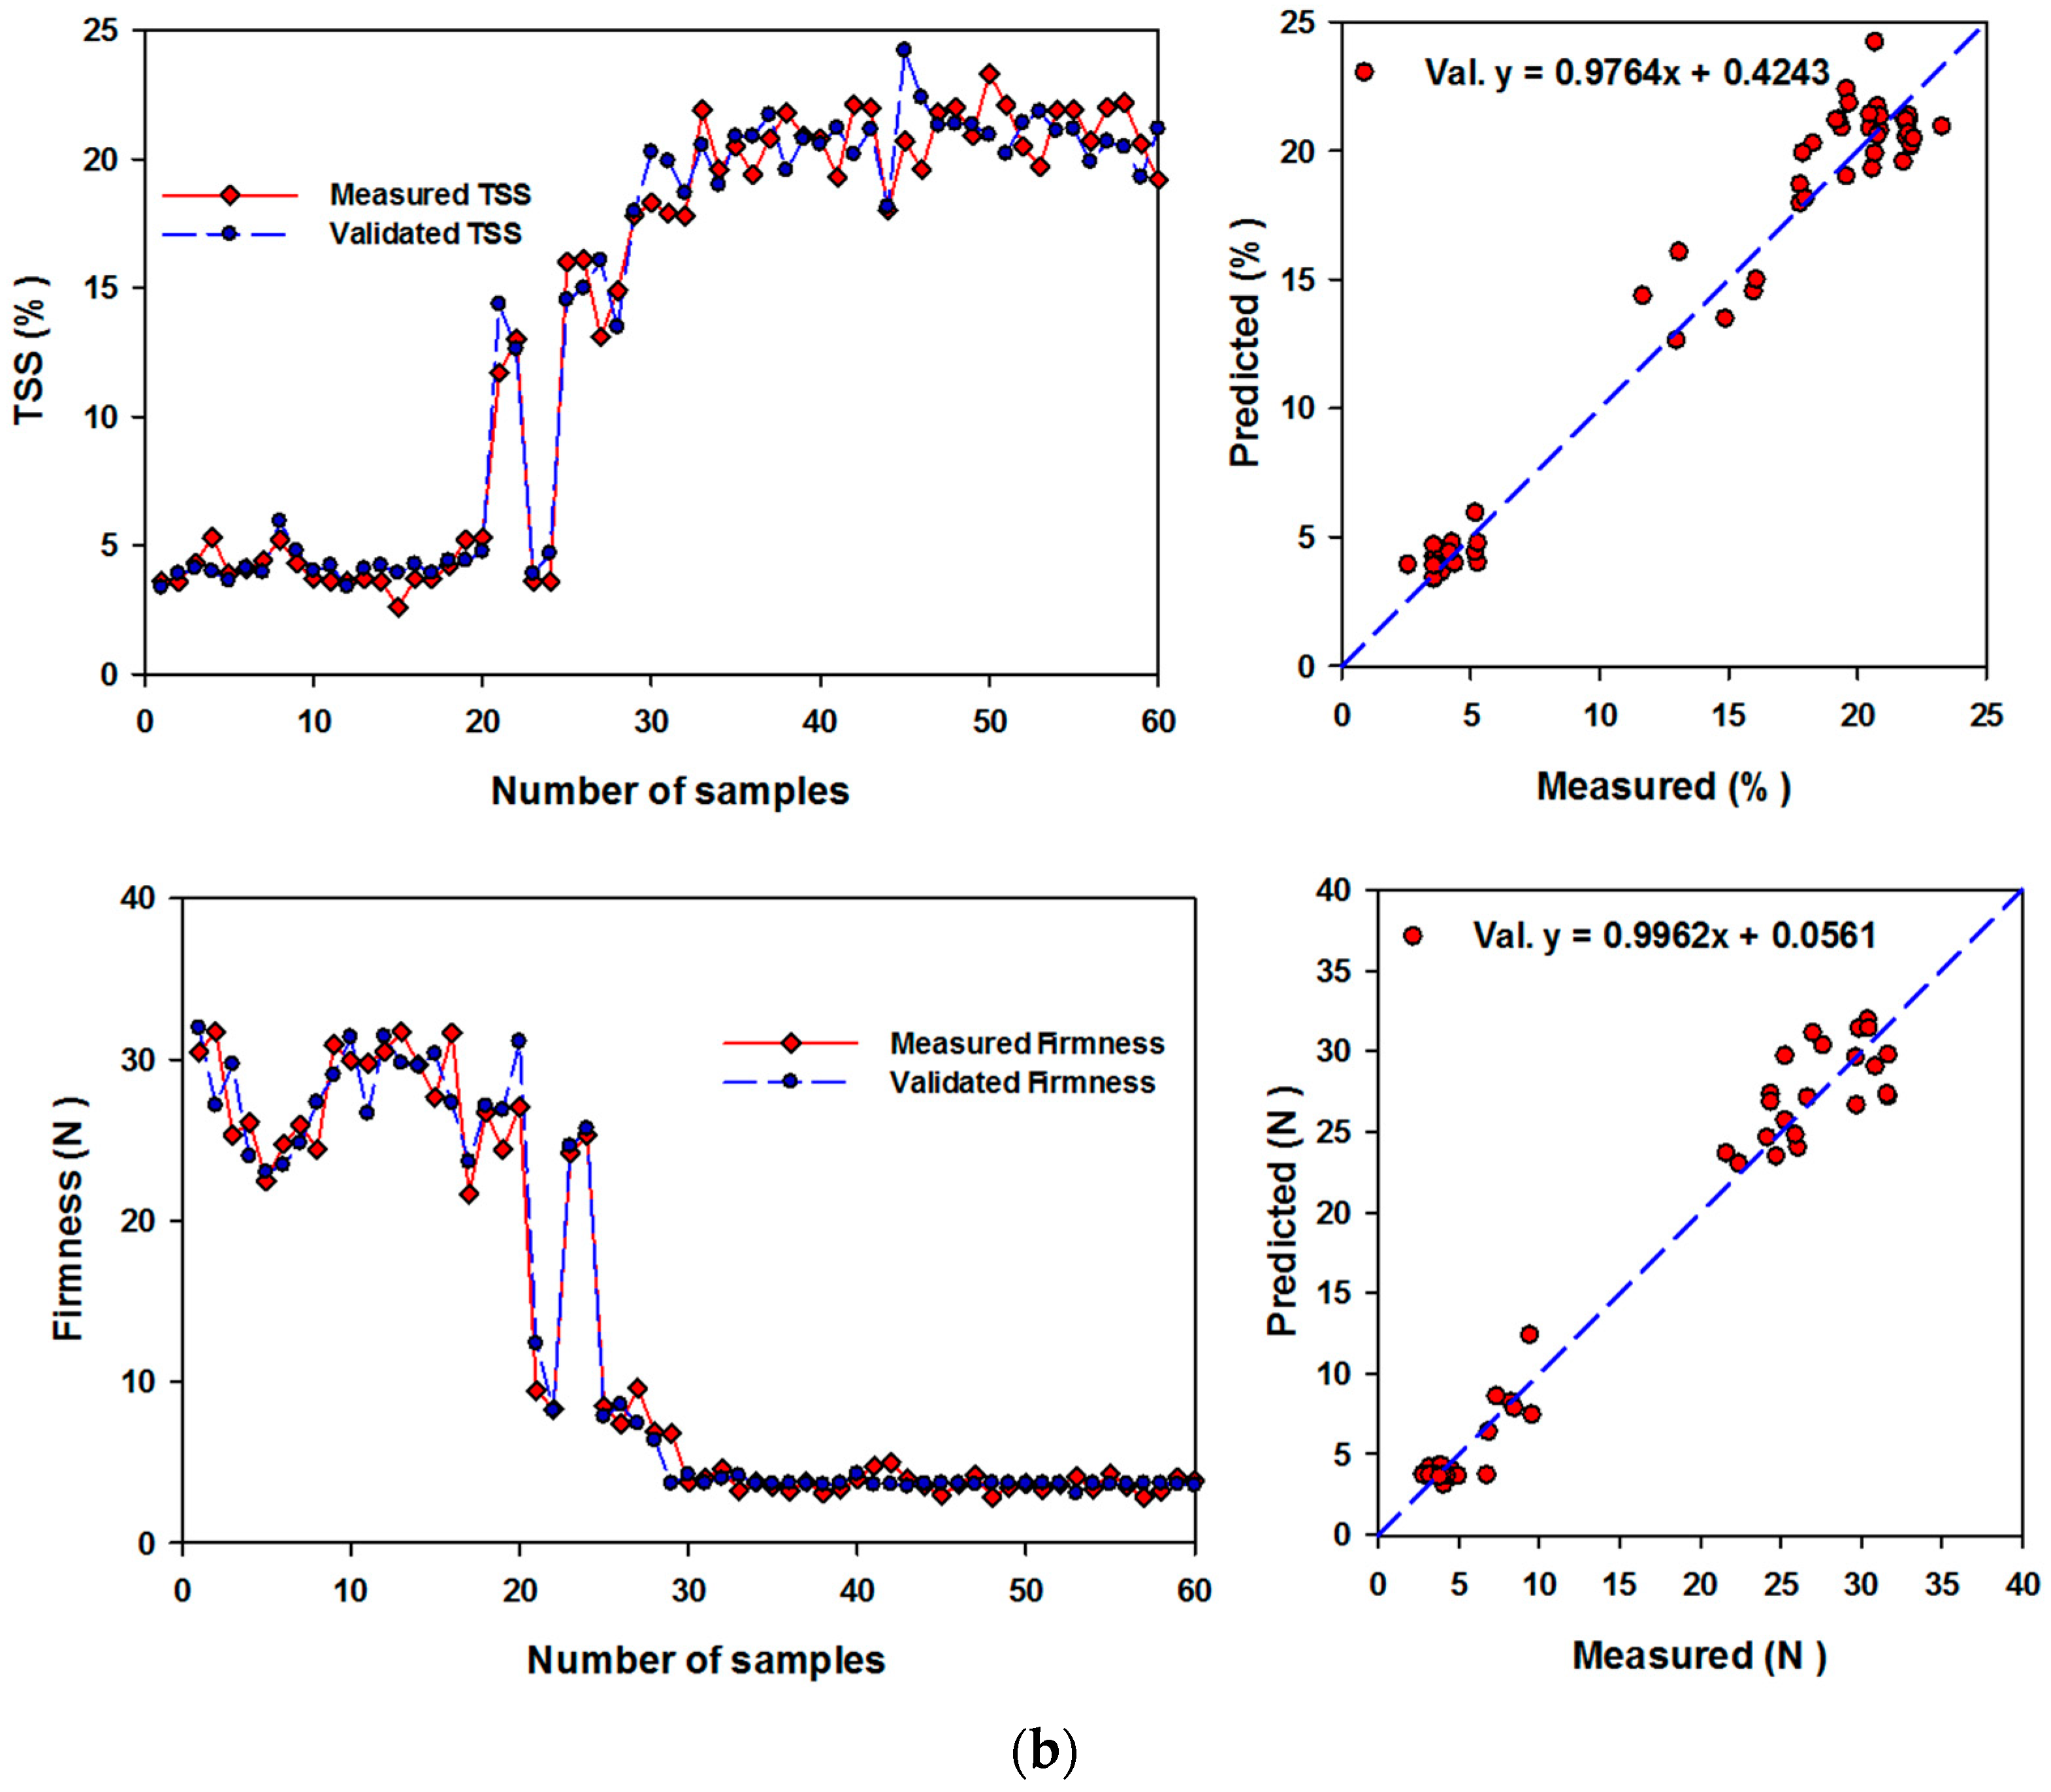
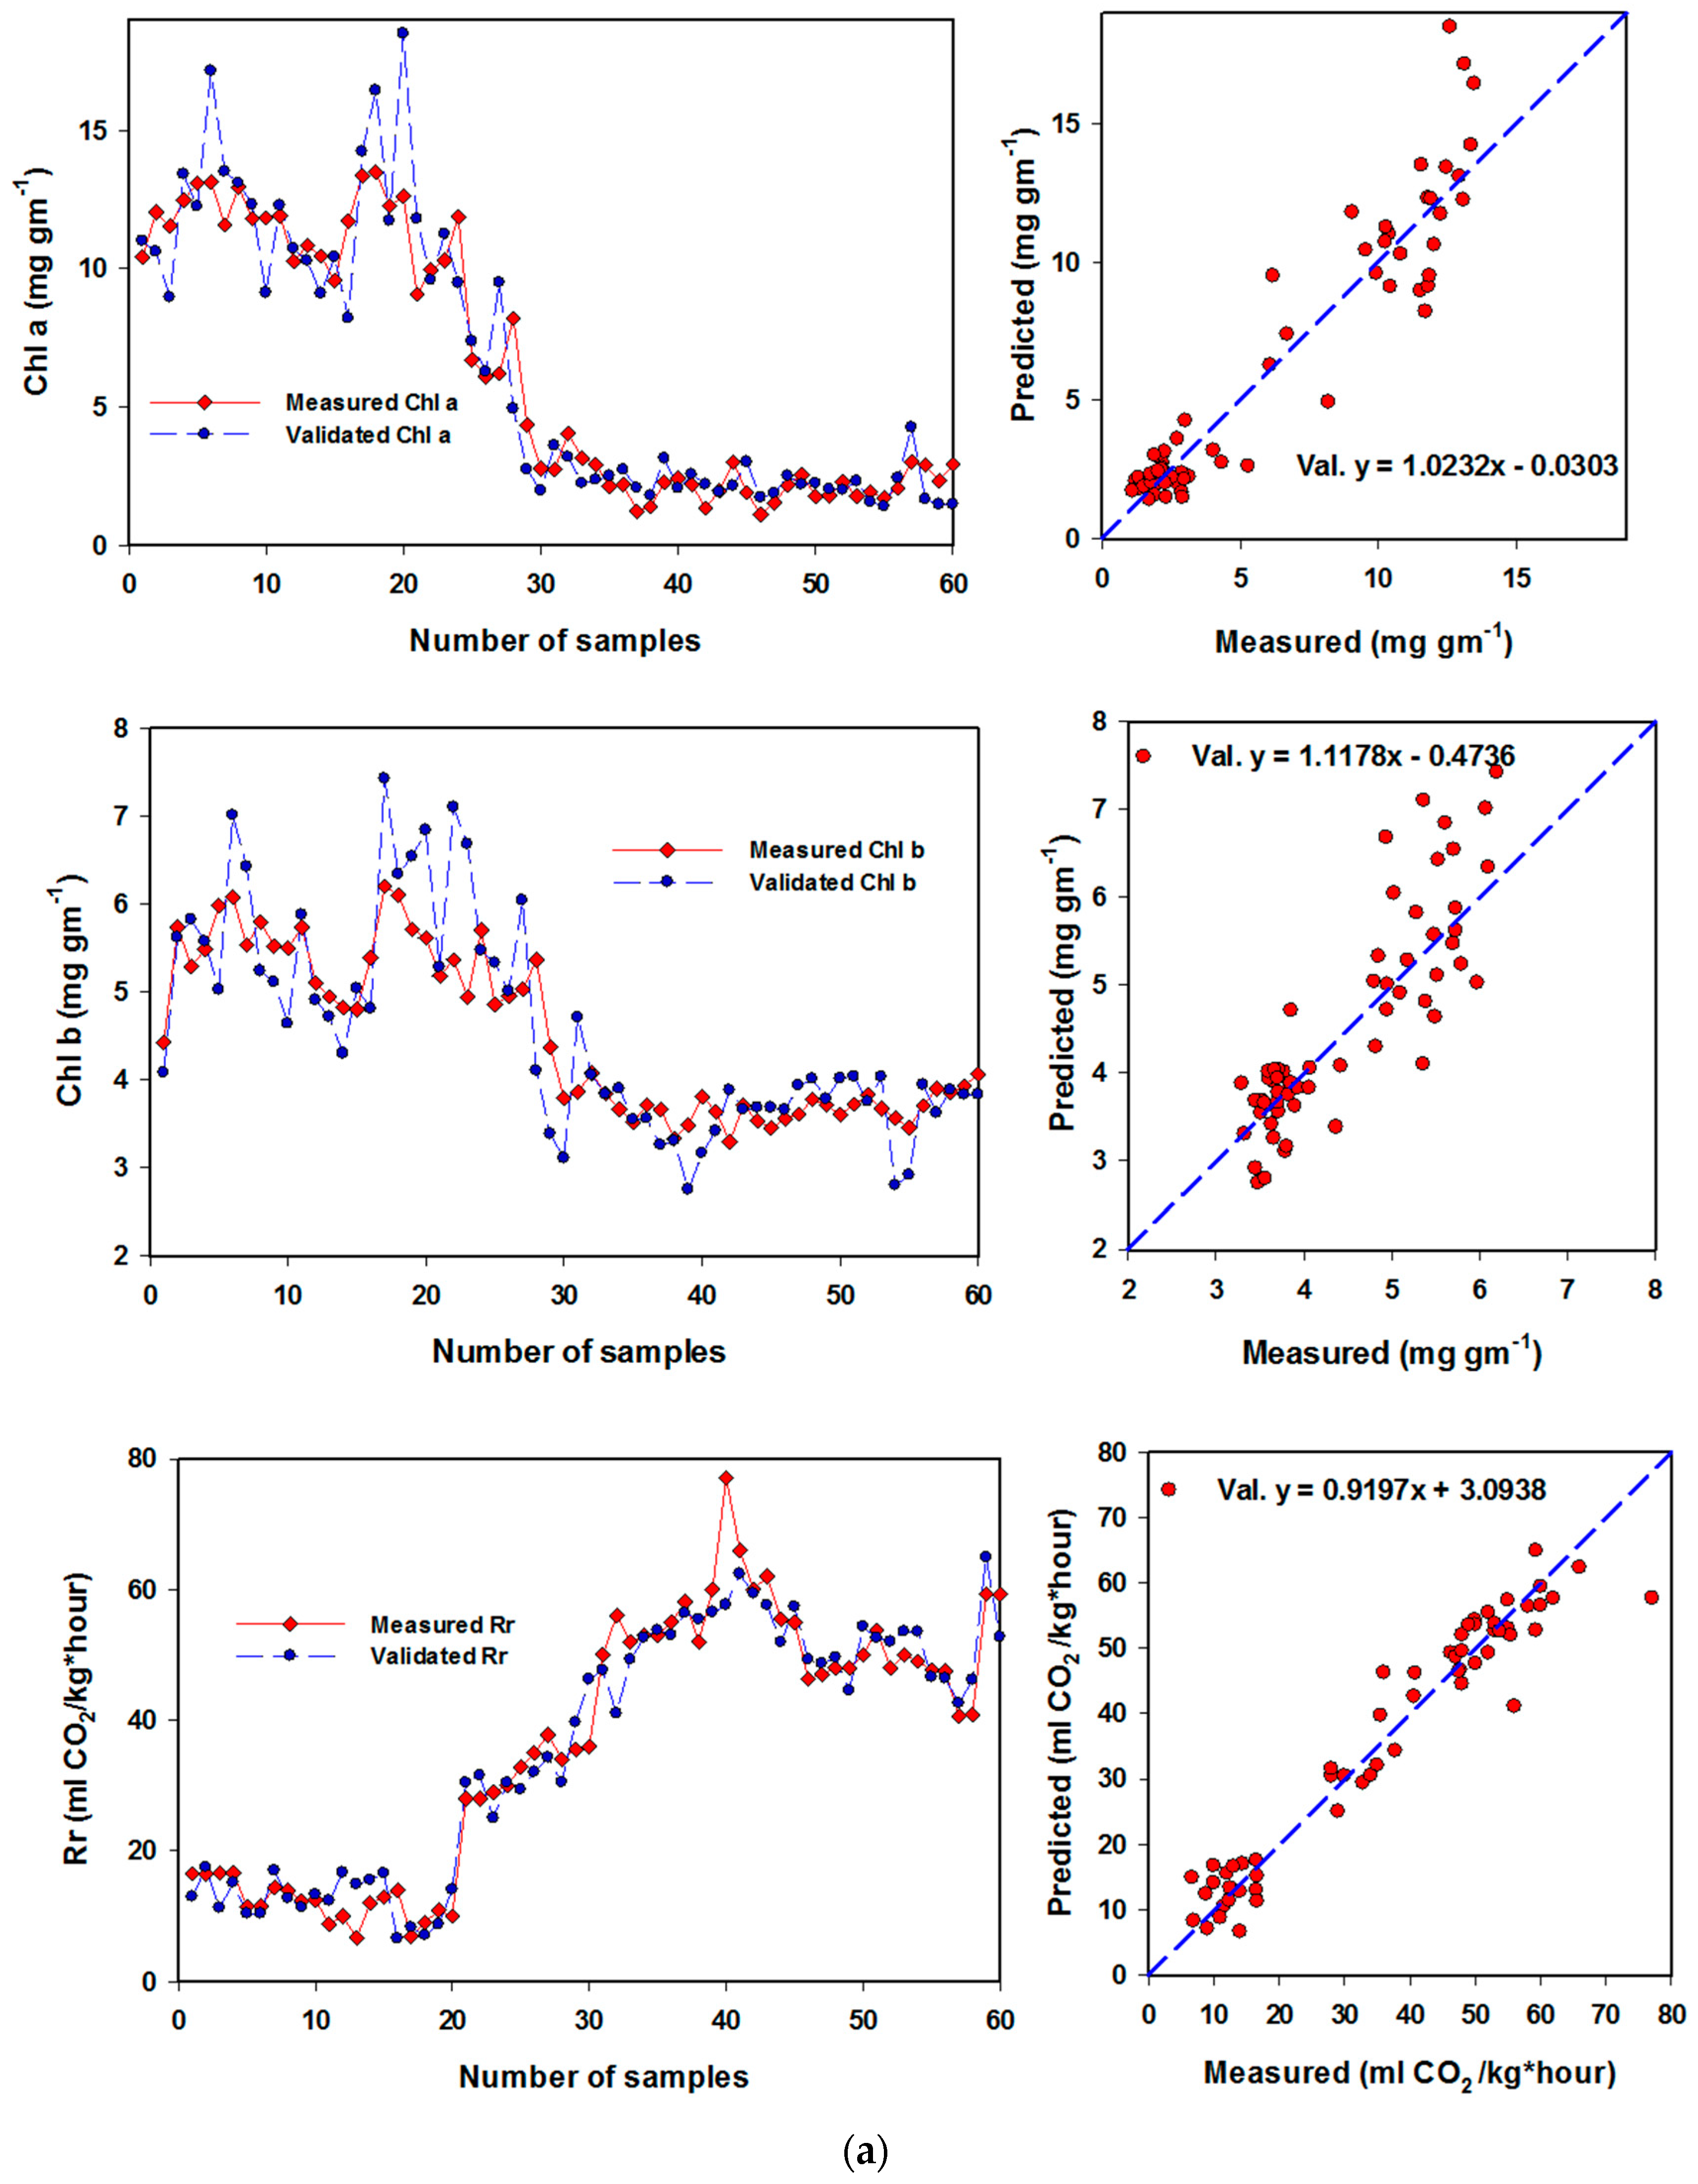
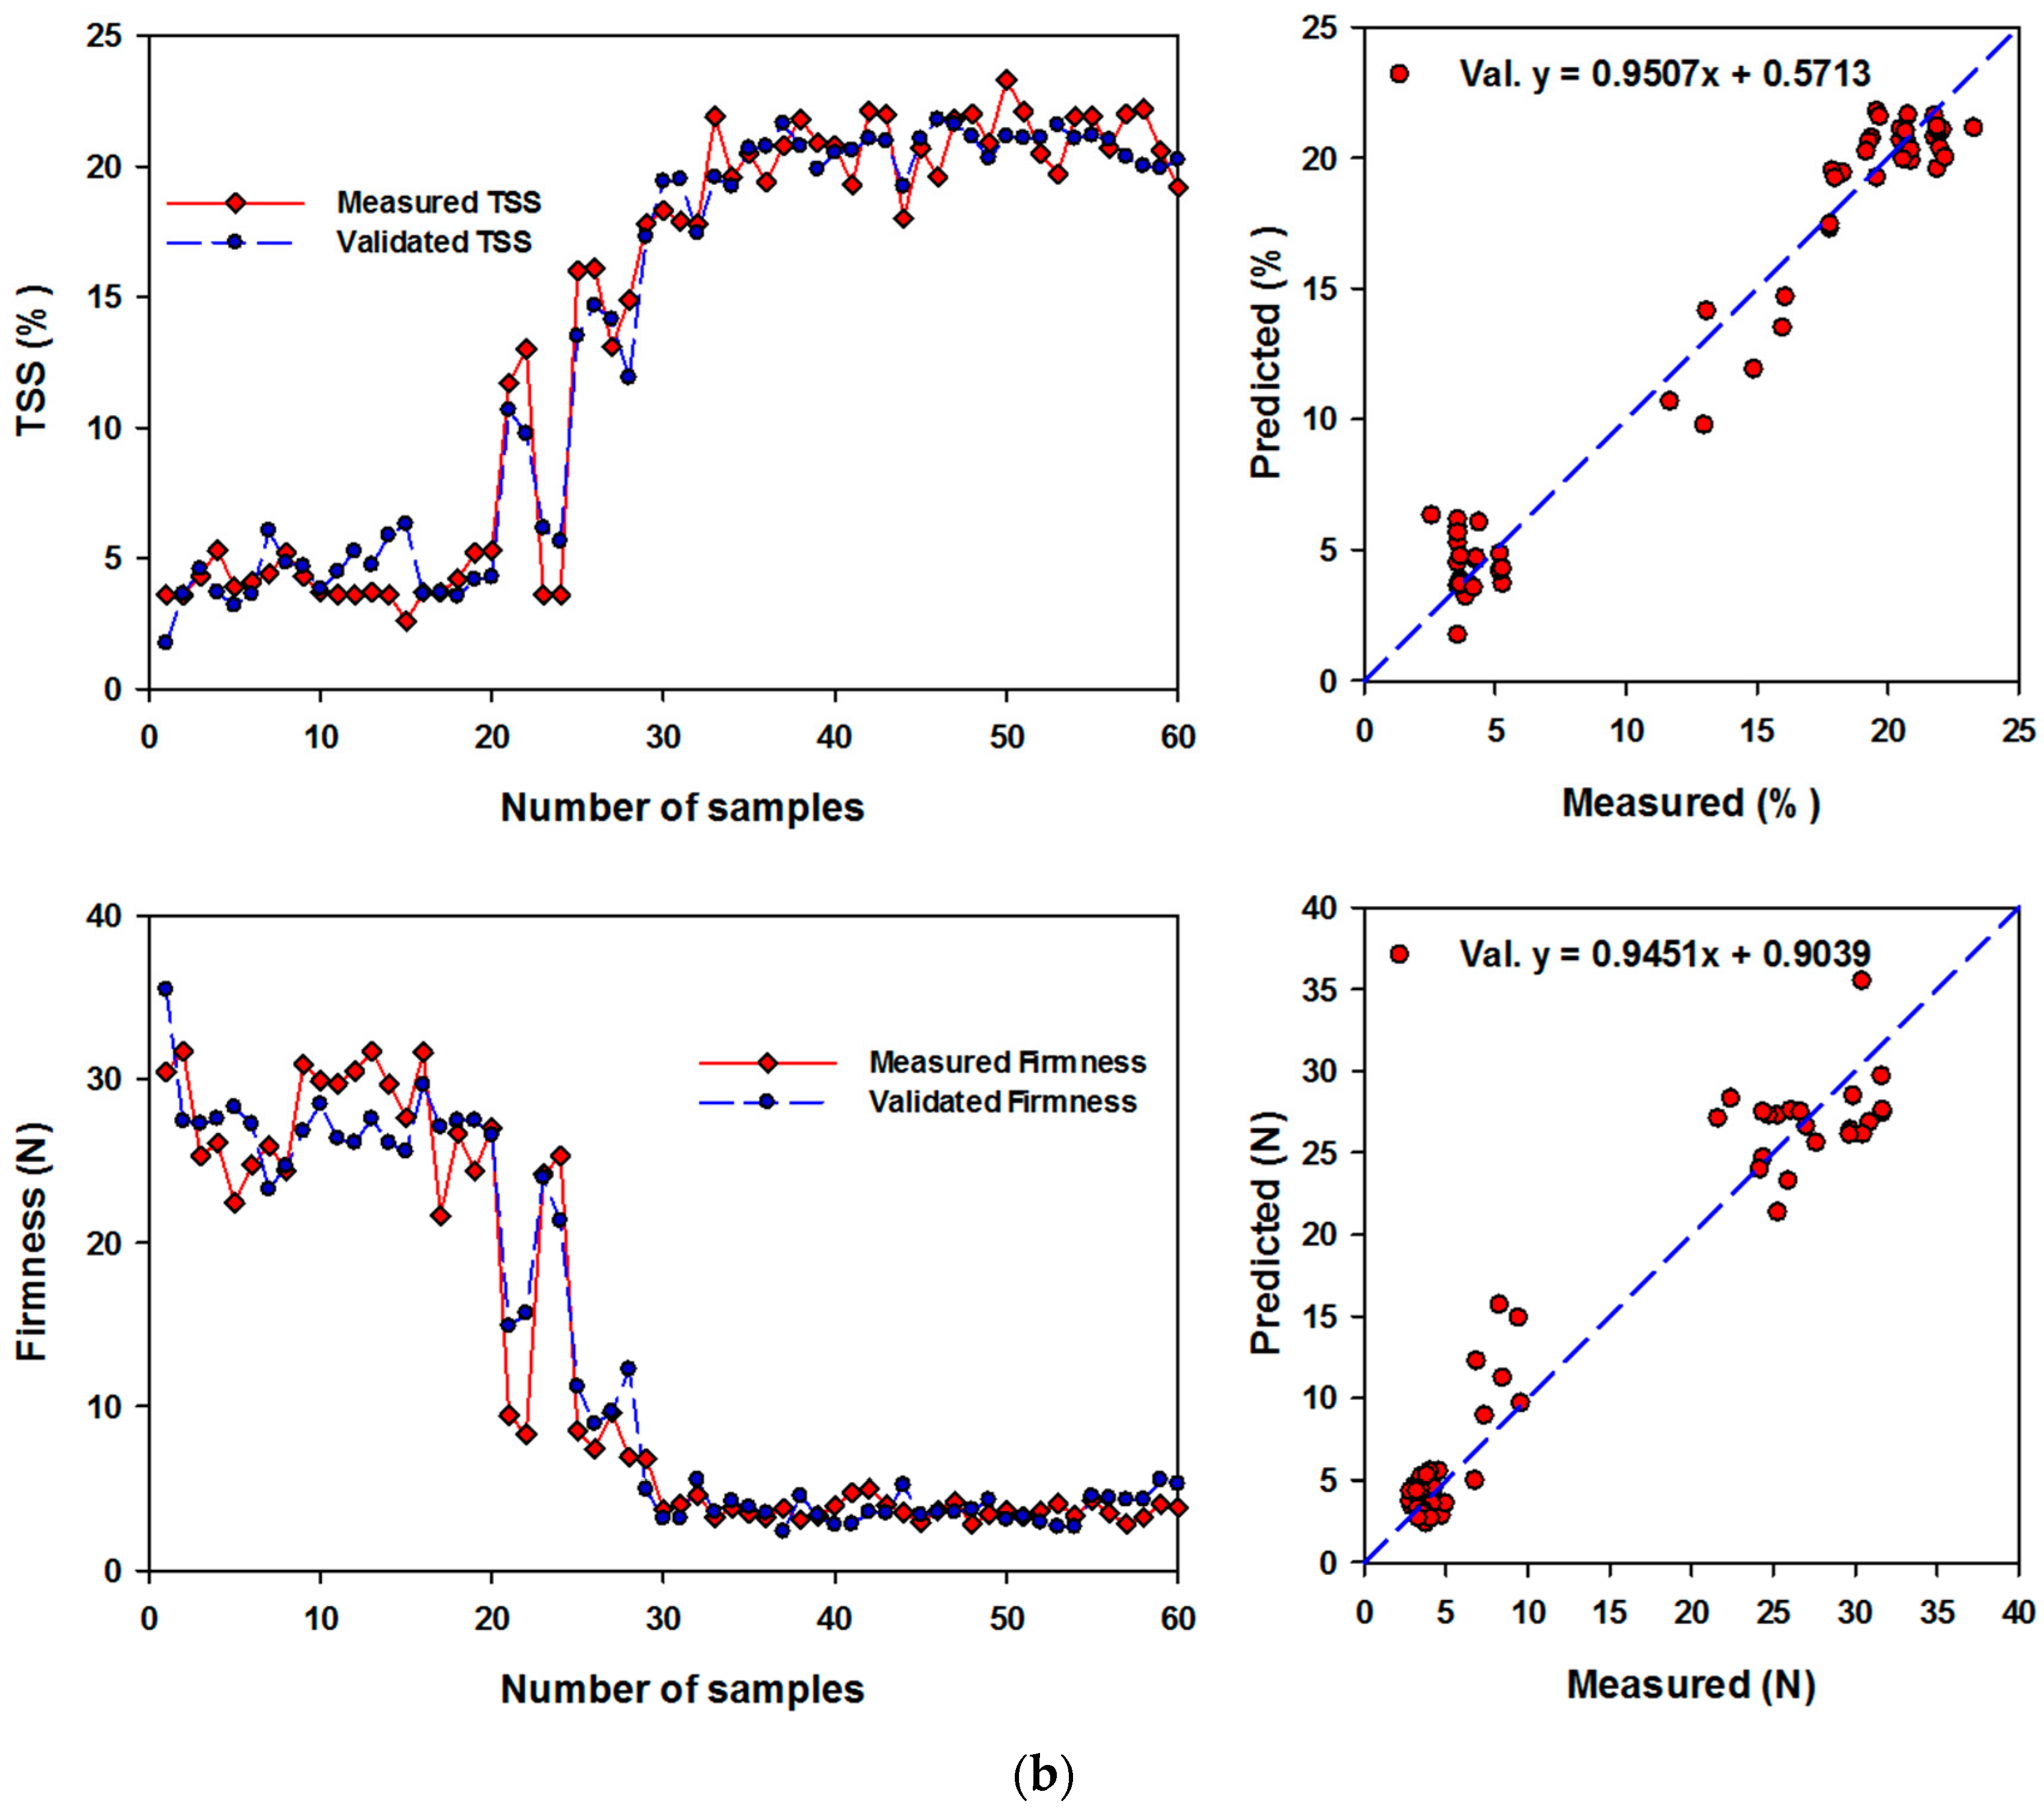
3.4. Performance of Artificial Neural Networks and Support Vector Machine Regression Based on SRIs to Assess Biochemical Parameters of Banana Fruits

Figure 3 shows the neural network designs gathered from senior SRIs. With the SRIs selected, this figure depicted the optimum neural network structure. The synaptic weights trained, a variety of hidden neuron layers, convergence steps, and total errors are all included in each network design. A number of hidden neuron layers are used to build the network architecture, which is made up of a specific combination of input variables. For example, hidden neuron layers were necessary for the ANN-Chl a-SRI-15 model (12.4), ANN-Chl b-SRI-6 was required (12.4), and ANN-Rr-SRI-15 was required 10.14), ANN-TSS-SRI-13 was required (6.10), and ANN-Firmness-SRI-15 was required (22.4). Figure 3 shows a diagram of sophisticated models for calculating Chl a, Chl b, respiration rate, TSS, and firmness. According to Thawornwong and Enke [29], the projected performance was improved by using a back-propagation algorithm with early pausing to avoid over-fitting the network. According to the findings, SRIs were the best integration for filtering the highest variables. These indices received great marks for measuring the biochemical parameters. Using super indices features, the neural network was trained to predict the investigated parameters. The predicted values were compared to the reserved values for the neural network that had not been implemented. Multivariate approaches were tested in this study, and the findings were clearly contrasted, indicating that using multivariate methods considerably improves predictability. Because validation data are not included in the model construction process, independent validation is the most reliable method of determining the correctness of the regression model. Based on R2 (Table 6) and slope (Figure 4a,b) values, the SVMR model gave a more accurate evaluation of Chl a, Chl b, respiration rate, TSS, and firmness in both models of the Cal. and Val. Datasets. According to the results, the ANN-Chl a-SRI-15 was the best predictive model, with a better link between outstanding features and Chl a. The fifteen SRIs included in this model are quite important for predicting Chl a. Its R2 outputs were 0.93 for Cal. and 0.89 for Val. The ANN-Chl b-SRI-6 model ranked first in performance for measuring Chl b. In the Cal. and Val., respectively, the R2 values were 0.71 and 0.63. The most accurate model for estimating Rr was the ANN-Rr-SRI-15 (R2 = 0.95 and 0.91 for Cal. and Val., respectively). The ANN-TSS-SRI-13 model was built to determine TSS with greater performance expectations (R2 = 1.00 and 0.97 for Cal. and Val., respectively). Furthermore, the model ANN-Firmness-SRI-15 was developed for determining firmness, and it performed better (R2 = 1.00 and 0.98 for Cal. and Val., respectively). According to Elsherbiny et al. [27], various steps were necessary during training, such as filtering high-level features and tweaking model hyperparameters, to upgrade the regression algorithms for robust prediction.
Table 7 shows the values of R2 and RMSE of SVMR models’ Cal. and Val. datasets to predict Chl a, Chl b, respiration rate, TSS, and firmness based on SRIs. The Cal. models of the SVMR’s effectiveness in predicting five biochemical parameters based on SRIs (n = 60). Based on R2 (Table 7) and slope (Figure 5a,b) values, the SVMR model gave a more accurate evaluation of Chl a, Chl b, respiration rate, TSS, and firmness in both models of the Cal. and Val. datasets. The SVMR model produced well estimates for Chl a, Chl b respiration rate, TSS, and firmness in Val datasets, with R2 of 0.86, 0.6, 91, 95, and 0.91 and RMSE of 1.87, 0.75, 5.66, 1.83, and 3.37, respectively. On the other hand, the SVMR model has a modest estimate performance for Chl b. in the Val. datasets, with an R2 of 60 and an RMSE of 0.75. According to the findings, biochemical parameters could be predicted using an ANN and SVMR based on multiple SRIs. The ANN and SVMR models generated well estimates for Chl a, Chl b, respiration rate, TSS, and firmness.

4. Conclusions

The SRIs, ANN, and SWMR were used as low-cost approaches for estimating the biochemical parameters of banana fruits such as Chl a, Chl b, respiration rate, TSS, and firmness. The findings reveal a broad range of values for all measured parameters at various stages of ripening. The Chl a values ranged from 1.397 to 18.5 (mg g−1), the Chl b from 2.774 to 7.421 (mg g−1), respiration rate from 6.705 to 77.084 (mL CO2/kg*hour), TSS from 2.6 to 23.3 (%) and the firmness from 31.7 to 2.838 (N). The newly developed two-band SRIs are more effective at measuring different biochemical parameters. The published SRIs also significantly determined the selected biochemical parameters. The newly developed two-band SRIs recorded R2 values varied from 0.75 to 0.87, from 0.53 to 0.63, from 0.76 to 89, from 0.79 to 0.95, and from 0.75 to 0.90 for Chl a, Chl b, respiration rate, TSS, and firmness, respectively. The published SRIs presented R2 values varied from 0.66 to 80, from 0.47 to 0.64, from 0.61 to 81, from 0.74 to 0.87, and from 0.66 to 0.78 for Chl a, Chl a, respiration rate, TSS, and firmness, respectively. The SRIs that were extracted from VIS/VIS, VIS/NIR, and NIR/NIR showed the best R2 with biochemical parameters. SRIs combined with ANNs and SVMR would be an effective method for estimating five biochemical parameters in the calibration (Cal.) and validation (Val.) datasets with acceptable accuracy. The SVMR model produced well estimates for Chl a, Chl b; respiration rate, TSS, and firmness in Val datasets, with R2 of 0.86, 60, 91, 95, and 0.91 and RMSE of 1.87, 0.75, 5.66, 1.83, and 3.37, respectively. The findings of this research study would be adequate to provide a potential reference for estimating five biochemical parameters. This research also offers technological assistance for monitoring and assessing the fruit quality of bananas during artificial ripening and storage.

Author Contributions

Conceptualization, S.E.; Methodology, S.E., H.G., M.F. and A.A.; Software, S.E., H.G. and M.F. Formal Analysis, S.E. and H.G.; Resources, S.E., Data Curation, S.E., H.G., M.F. and A.A.; Writing—Original Draft Preparation, S.E. and H.G.; Writing—Review & Editing, S.E., H.G., M.F. and A.A.; Supervision, S.E.; Project Administration, S.E.; Funding Acquisition, S.E., H.G., M.F. and A.A. All authors have read and agreed to the published version of the manuscript.

Funding

The paper is based upon work supported by University of Sadat City (USC) under grant No (19).

Data Availability Statement

Data are presented in the article.

Acknowledgments

The authors extend their appreciation to the University of Sadat City in Egypt for funding this research work through project number 19.

Conflicts of Interest

The authors declare no conflict of interest.

References

  1. FAO Food and Agricultural Organization of the United Nations. Available online: http://faostat.fao.org (accessed on 30 March 2002).
  2. Egyptian Ministry of Agriculture and Land Reclamation. Bulletin of the Agricultural Statistics Part (2); Summer & Nile Crops: Cairo, Egypt, 2019.
  3. Zhu, X.; Luo, J.; Li, Q.; Li, J.; Liu, T.; Wang, R.; Chen, W.; Li, X. Low temperature storage reduces aroma-related volatiles production during shelf-life of banana fruit mainly by regulating key genes involved in volatile biosynthetic pathways. Postharvest Biol. Technol. 2018, 146, 68–78. [Google Scholar]
  4. Moreno, J.L.; Tran, T.; Cantero-Tubilla, B.; López-López, K.; Lavalle, L.A.B.L.; Dufour, D. Physicochemical and physiological changes during the ripening of Banana ( Musaceae) fruit grown in Colombia. Int. J. Food Sci. Technol. 2021, 56, 1171–1183. [Google Scholar] [CrossRef] [PubMed]
  5. Maduwanthi, S.D.T.; Marapana, R. Biochemical changes during ripening of banana: A review. Int. J. Food Sci. Nutr. 2017, 2, 166–169. [Google Scholar]
  6. Ahmed, Z.F.R.; Taha, E.M.A.; Abdelkareem, N.A.A.; Mohamed, W.M. Postharvest properties of unripe bananas and the potential of producing economic nutritious. Int. J. Fruit Sci. Prod. 2020, 20, 995–1014. [Google Scholar] [CrossRef]
  7. Pissard, A.; Baeten, V.; Dardenne, P.; Dupont, P.; Lateur, M. Use of NIR spectroscopy on fresh apples to determine the phenolic compounds and dry matter content in peel and flesh. Biotechnol. Agron. Soc. Environ. 2018, 22, 3–12. [Google Scholar] [CrossRef]
  8. Elsayed, S.; Galal, H.; Allam, A.P.; Schmidhalter, U. Passive reflectance sensing and digital image analysis for assessing quality parameters of mango fruits. Sci. Hortic. 2016, 212, 136–147. [Google Scholar] [CrossRef]
  9. Tamburini, E.; Costa, S.; Rugiero, I.; Pedrini, P.; Marchetti, M.G. Quantification of lycopene, β-carotene, and total soluble solids in intact red-flesh watermelon (Citrullus lanatus) using on-line near-infrared spectroscopy. Sensors 2017, 17, 746. [Google Scholar] [CrossRef] [Green Version]
  10. Wang, H.; Peng, J.; Xie, C.; Bao, Y.; He, Y. Fruit quality evaluation using spectroscopy technology: A Review. Sensors 2015, 15, 11889–11927. [Google Scholar] [CrossRef] [Green Version]
  11. Elsayed, S.; El-Gozayer, K.; Allam, A.; Schmidhalter, U. Passive reflectance sensing using regression and multivariate analysis to estimate biochemical parameters of different fruits kinds. Sci. Hortic. 2019, 243, 21–33. [Google Scholar] [CrossRef]
  12. Pourdarbani, R.; Sabzi, S.; Hernández-Hernández, M.; Hernández-Hernández, J.L.; Gallardo-Bernal, I.; Herrera-Miranda, I. Non-destructive estimation of total chlorophyll content of apple fruit based on color feature, spectral data and the most effective wavelengths using hybrid artificial neural network-imperialist competitive algorithm. Plants 2020, 9, 1547. [Google Scholar] [CrossRef]
  13. Liu, Y.; Gao, R.; Hao, Y.; Sun, X.; Ouyang, A. Improvement of near-infrared spectral calibration models for brix prediction in ‘gannan’ navel oranges by a portable near-infrared device. Food Bioprocess. Technol. 2012, 5, 1106–1112. [Google Scholar] [CrossRef]
  14. Nagy, A.; Riczu, P.; Tamás, J. Spectral evaluation of apple fruit ripening and pigment content alteration. Sci. Hortic. 2016, 201, 256–264. [Google Scholar] [CrossRef] [Green Version]
  15. Li, M.; Lv, W.; Zhao, R.; Guo, H.; Liu, J.; Han, D. Non-destructive assessment of quality parameters in ‘Foriar’ plums during low temperature storage using visible/near infrared spectroscopy. Food Control. 2017, 73, 1334–1341. [Google Scholar] [CrossRef]
  16. Jha, S.N.; Jaiswal, P.; Narsaiah, K.; Gupta, M.; Bhardwaj, R.; Singh, A.K. Non-destructive prediction of sweetness of intact mango using near infrared spectroscopy. Sci. Hortic. 2012, 138, 171–175. [Google Scholar] [CrossRef]
  17. Sirisomboon, P. NIR Spectroscopy for Quality Evaluation of Fruits and Vegetable. Mater. Today Proc. 2018, 5, 22481–22486. [Google Scholar] [CrossRef]
  18. McClure, W.F. Near-infrared spectroscopy—the giant is running strong. Anal. Chem. 1994, 66, 43–53. [Google Scholar] [CrossRef]
  19. Acharya, U.K.; Subedi, P.P.; Walsh, K.B.; McGlasson, W.B. Estimation of fruit maturation and ripening using spectral indices. Acta Hortic. 2016, 1119, 265–272. [Google Scholar] [CrossRef]
  20. Rutkowski, K.P.; Michalczuk, B.; Konopacki, P. Nondestructive determination of ‘golden delicious’ apple quality and harvest maturity. J. Fruit Ornam. Plant. Res. 2008, 16, 39–52. [Google Scholar]
  21. Zude, M.; Herold, B.; Roger, J.M.; Bellon-Maurel, V.; Landahl, S. Non-destructive tests on the prediction of apple fruit flesh firmness and soluble solids content on tree and in shelf life. J. Food Eng. 2006, 77, 254–260. [Google Scholar] [CrossRef]
  22. Slaughter, D.C.; Crisosto, C.H.; Tiwari, G. Nondestructive determination of flesh color in clingstone peaches. J. Food Eng. 2013, 116, 920–925. [Google Scholar] [CrossRef]
  23. Huang, Y.; Lu, R.; Chen, K. Assessment of tomato soluble solids content and pH by spatially-resolved and conventional Vis/NIR spectroscopy. J. Food Eng. 2018, 236, 19–28. [Google Scholar] [CrossRef]
  24. Abbaspour-Gilandeh, Y.; Sabzi, S.; Hernández-Hernández, M.; Hernández-Hernández, J.L.; Azadshahraki, F. Nondestructive estimation of the chlorophyll b of apple fruit by color and spectral features using different methods of hybrid artificial neural network. Agronomy 2019, 9, 735. [Google Scholar] [CrossRef] [Green Version]
  25. Elsayed, S.; El-Hendawy, S.; Khadr, M.; Elsherbiny, O.; Al-Suhaibani, N.; Alotaibi, M.; Tahir, M.U.; Darwish, W. Combining thermal and RGB imaging indices with multivariate and data-driven modeling to estimate the growth, water status, and yield of potato under different drip irrigation regimes. Remote Sens. 2021, 13, 1679. [Google Scholar] [CrossRef]
  26. Merzlyak, M.N.; Solovchenko, A.E.; Gitelson, A.A. Reflectance spectral features and non-destructive estimation of chlorophyll, carotenoid and anthocyanin content in apple fruit. Postharvest Biol. Technol. 2003, 27, 197–211. [Google Scholar] [CrossRef]
  27. Elsherbiny, O.; Zhou, L.; Feng, L.; Qiu, Z. Integration of visible and thermal imagery with an artificial neural network approach for robust forecasting of canopy water content in rice. Remote Sens. 2021, 13, 1785. [Google Scholar] [CrossRef]
  28. Elmetwalli, A.H.; Mazrou, Y.S.A.; Tyler, A.N.; Hunter, P.D.; Elsherbiny, O.; Yaseen, Z.M.; Elsayed, S. Assessing the efficiency of remote sensing and machine learning algorithms to quantify wheat characteristics in the Nile Delta region of Egypt. Agric. 2022, 12, 332. [Google Scholar] [CrossRef]
  29. Thawornwong, S.; Enke, D. The adaptive selection of financial and economic variables for use with artificial neural networks. Neurocomputing 2004, 56, 205–232. [Google Scholar] [CrossRef]
  30. Liu, Y.; Chen, X.; Ouyang, A. Non-destructive measurement of soluble solid content in gannan navel oranges by visible/near-infrared spectroscopy. Acta Opt. Sin. 2008, 28, 478–481. [Google Scholar]
  31. Zhang, S.; Wang, F.; Zhang, H.; Zhao, C.; Yang, G. Detection of the fresh jujube varieties and ssc by nir spectroscopy. Trans. CSAM 2009, 40, 139–142. [Google Scholar]
  32. Zheng, H.; Lu, H. A least-squares support vector machine (LS-SVM) based on fractal analysis and CIELab parameters for the detection of browning degree on mango (Mangifera indica L.). Comput. Electron. Agric. 2012, 83, 47–51. [Google Scholar] [CrossRef]
  33. Marković, M.S.; Pavlović, D.V.; Tošić, S.M.; Stankov-Jovanović, V.P.; Krstić, N.S.; Stamenković, S.M.; Mitrović, T.L.J.; Matković, V.L.J. Chloroplast pigments in post-fire grown cryptophytes on Vidlič Mountain (Southeastern Serbia). Arch. Biol. Sci. 2012, 64, 531–538. [Google Scholar] [CrossRef]
  34. Elsayed, S.; El-Hendawy, S.; Dewir, Y.H.; Schmidhalter, U.; Ibrahim, H.H.; Ibrahim, M.M.; Elsherbiny, O.; Farouk, M. Estimating the leaf water status and grain yield of wheat under different irrigation regimes using optimized two- and three-band hyperspectral indices and multivariate regression models. Water 2021, 13, 2666. [Google Scholar] [CrossRef]
  35. Rouse, J.W.; Haas, R.H.; Schell, J.A.; Deering, D.W.; Harlan, J.C. Monitoring the Vernal Advancement of Retro Gradation of Natural Vegetation; Type III. Final Report; NASA Goddard Space Flight Center: Greenbelt, MD, USA, 1974.
  36. Gutierrez, M.; Reynolds, M.P.; Raun, W.R.; Stone, M.L.; Klatt, A.R. Spectral water indices for assessing yield in elite bread wheat genotypes in well irrigated, water stressed, and high temperature conditions. Crop. Sci. 2010, 50, 197–214. [Google Scholar] [CrossRef]
  37. Raun, W.R.; Solie, J.B.; Johnson, G.V.; Stone, M.L.; Lukina, E.V.; Thomason, W.E.; Schepers, J.S. In-season prediction of potential grain yield in winter wheat using canopy reflectance. Agron. J. 2001, 93, 131–138. [Google Scholar] [CrossRef] [Green Version]
  38. Jiang, Y.; Carrow, R.N. Broadband spectral reflectance models of turfgrass species and cultivars to drought stress. Crop. Sci. 2007, 47, 1611–1618. [Google Scholar] [CrossRef]
  39. Schalkoff, J. Artificial Neural Networks; McGraw-Hill Companies Inc.: New York, NY, USA, 1997. [Google Scholar]
  40. Haykin, S. Neural Networks: A Comprehensive Foundation, 2nd ed.; Prentice Hall: Upper Saddle River, NJ, USA, 1999. [Google Scholar]
  41. Glorfeld, L.W. A methodology for simplification and interpretation of backpropagation-based neural network models. Expert Syst. Appl. 1996, 10, 37–54. [Google Scholar] [CrossRef]
  42. Malone, B.P.; Styc, Q.; Minasny, B.; McBratney, A.B. Digital soil mapping of soil carbon at the farm scale: A spatial downscaling approach in consideration of measured and uncertain data. Geoderma 2017, 290, 91–99. [Google Scholar] [CrossRef]
  43. Saggi, M.K.; Jain, S. Reference evapotranspiration estimation and modeling of the Punjab Northern India using deep learning. Comput. Electron. Agr. 2019, 156, 387–398. [Google Scholar] [CrossRef]
  44. Subagio, A.; Morita, N.; Sawada, S. Carotenoids and their fatty-acid esters in banana peel. J. Nutr. Sci. Vitaminol. 1996, 42, 553–566. [Google Scholar] [CrossRef] [Green Version]
  45. Ringer, T.; Blanke, M. Non-invasive, real time in-situ techniques to determine the ripening stage of banana. J. Food Meas. Charact. 2021, 15, 4426–4437. [Google Scholar] [CrossRef]
  46. Marriott, J.; Palmer, J.K. Bananas-physiology and biochemistry of storage and ripening for optimum quality. Crit. Rev. Food Sci. Nutr. 1980, 13, 41–88. [Google Scholar] [CrossRef] [PubMed]
  47. Seymour, G.B.; Thompson, A.K.; John, P. Inhibition of degreening in the peel of bananas ripened at tropical temperatures. Ann. Appl. Biol. 1987, 110, 145–151. [Google Scholar] [CrossRef]
  48. Reddy, C.K.; Haripriya, S.; Vidya, P.V. Morphology, physicochemical and functional characteristics of starches from different banana cultivars. J. Food Sci. Technol. 2015, 52, 7289–7296. [Google Scholar] [CrossRef]
  49. Yang, S.F.; Hoffman, N.E. Ethylene biosynthesis and its regulation in higher plants. Annu. Rev. Plant. Physiol. 1984, 35, 155–189. [Google Scholar] [CrossRef]
  50. Maduwanthi, S.D.T.; Marapana, R.A.U.J. Induced ripening agents and their effect on fruit quality of banana. Int. J. Food Sci. 2019, 2019, 2520179. [Google Scholar] [CrossRef]
  51. Williams, M.H.; Vesk, M.; Mullins, M.G. A scanning electron microscope study of the formation and surface characteristics of the peel of the banana fruit during its development. Bot. Gaz. 1989, 150, 30–40. [Google Scholar] [CrossRef]
  52. Costa, G.; Fiori, G.; Noferini, M.; Ziosi, V. Internal fruit quality: How to influence it, how to de fine it. Acta Hortic. 2006, 2, 339–346. [Google Scholar] [CrossRef]
  53. Ruiz-Altisent, M.; Lleó, L.; Riquelme, F. Instrumental quality assessment of peaches: Fusion of optical and mechanical parameters. J. Food Eng. 2006, 74, 490–499. [Google Scholar] [CrossRef]
Figure 1. Correlation matrices displaying (R2) values for possible dull wavelength together ranging from 302 to 1148 nm with Chl a, Chl b, respiration rate, TSS, and firmness of banana fruits.
Horticulturae 08 00438 g001
Figure 2. Schematic flowchart of the process of ANN and SVMR used to assess Chl a, Chl b, respiration rate, TSS, and firmness of banana fruits in this study.
Horticulturae 08 00438 g002
Figure 3. Neural network diagrams were established for detecting Chl a, Chl b, respiration rate, TSS, and firmness of banana fruits.
Horticulturae 08 00438 g003
Figure 4. (a) Comparison between measuring datasets and validating datasets for Chl a, Chl b, and respiration rate (Rr) using the ANN models. Statistical analysis was shown in Table 6. (b) Comparison between measuring datasets and validating datasets for TSS and firmness using the ANN models. Statistical analysis is shown in Table 6.
Horticulturae 08 00438 g004aHorticulturae 08 00438 g004b
Figure 5. (a) Comparison between measuring datasets and validating datasets for Chl a, Chl b, and respiration rate (Rr) using the SVMR models. Statistical analysis was shown in Table 7. (b) Comparison between measuring datasets, validating datasets for TSS, and firmness using the SVMR models. Statistical analysis is shown in Table 7.
Horticulturae 08 00438 g005aHorticulturae 08 00438 g005b
Table 1. Description of the published in the literature and newly developed (SRIs) examined in this study.
SRIsFormulaReferences
Greenness index (GI)R554/R677[20]
Pigment sensitive Ripening Monitoring Index (PRMI)(R750 − R678)/R550[15]
Normalized chlorophyll index (NCI)(R750 − R678)/(R750 + R678)[15]
Anthocyanin index (NAI)(R760 − R720)/(R760 + R720)[35]
Normalized difference index (NDI)
NDI780,550(R780 − R550)/(R780 + R550)[36]
NDI780,570(R780 − R570)/(R780 + R570)[21]
NDI780,670(R780 − R670)/(R780 + R670)[37]
NDI780,710(R780 − R710)/(R780 + R710)[38]
NDI800,640(R800 − R640)/(R800 + R640)[12]
NDI826,670(R826 − R670)/(R826 + R670)[12]
NDI970,670(R970 − R670)/(R970 + R670)[12]
Ratio spectral index
RSI450,640R450/R640Present study
RSI462,468R462/R468
RSI470,460R470/R460
RSI470,652R470/R652
RSI476,480R476/R480
RSI500,624R500/R624
RSI530,610R530/R610
RSI584,558R584/R558
RSI638,490R638/R490
RSI638,1138R638/R1138
RSI640,460R640/R460
RSI650,456R650/R456
RSI740,654R740/R654
RSI766,764R766/R764
RSI780,764R780/R764
RSI780,650R780/R650
Table 2. Variation in the values of fruit quality parameters under different ripening degrees.
MatureSemi-RipeningRipening
MinMaxMeanMinMaxMeanMinMaxMean
Chl a (mg g−1)8.19918.50012.160 a4.92711.7948.667 b1.3974.2472.282 c
Chl b (mg g−1)4.0797.4215.654 a4.0997.0995.559 a2.7474.7103.651 b
Respiration rate (mL CO2/kg*hour)6.70530.0013.046 c27.99837.77932.089 b35.50577.08452.230 a
TSS (%)2.6005.3004.057 c3.60016.10012.629 b17.80023.30020.563 a
Firmness (N)21.65031.70027.630 a6.90024.20010.62 b2.8386.8003.800 c
The mean value for each parameter with the same letter is not statistically different under different ripening degrees according to Duncan’s multiple range test at a 0.05 significance level.
Table 3. Correlations between Chl a, Chl b, respiration rate, TSS, and firmness of banana fruits.
Chl aChl bRespiration RateTSSFirmness
Chl a1.00 **
Chl b0.87 **1.00 **
Respiration rate−0.89 **−0.75 **1.00 **
TSS−0.91 **−0.76 **0.92 **1.00 **
Firmness0.86 **0.67 **−0.90 **−0.97 **1.00 **
** Correlation is significant at the 0.01 level.
Table 4. Variation in the values of SRIs at different ripening degrees.
MatureSemi-RipeningRipening
MinMaxMeanMinMaxMeanMinMaxMean
GI2.1772.8062.481 a2.1542.5402.372 a0.5351.9280.919 b
PRMI1.6632.2681.984 a1.6011.8771.773 b0.4001.4970.742 c
NCI0.6430.7520.713 a0.6490.6930.676 a0.1180.5880.242 b
NAI0.0850.1350.113 a0.0860.1060.099 b0.0380.0690.051 c
NDI780,5500.0110.0210.015 c0.0190.0280.022 b0.0220.0460.031 a
NDI780,5700.3850.4930.444 a0.3690.4250.404 b0.2680.4310.318 c
NDI780,6700.6530.7740.725 a0.6490.7000.681 a0.1620.5880.278 b
NDI780,7100.1550.2410.201 a0.1600.1880.177 b0.0680.1280.088 c
NDI800,6400.5020.6500.584 a0.4730.5290.512 b0.1990.4110.264 c
NDI826,6700.6620.7810.732 a0.6580.7120.692 a0.1890.6010.307 b
NDI970,6700.5450.6860.630 a0.5430.6070.579 a0.0230.4780.173 b
RSI450,6400.4410.5510.472 a0.3480.4610.386 b0.2190.3020.263 c
RSI462,4680.9860.9950.992 a0.9770.9870.982 b0.9580.9720.966 c
RSI470,4601.0131.0281.0174 c1.0261.0401.034 b1.0471.0711.057 a
RSI470,6520.6010.7190.632 a0.4510.6070.504 b0.2370.3710.288 c
RSI476,4800.9850.9910.987 c0.9890.9950.992 b0.9951.0061.003 a
RSI500,6240.6040.6850.638 a0.4990.6370.547 b0.3280.4470.380 c
RSI530,6101.0851.2601.174 a0.9981.0951.047 b0.6390.9130.766 c
RSI584,5580.8160.8960.853 c0.8830.9250.903 b0.9621.1401.062 a
RSI638,4901.5771.8831.779 c1.7872.3622.154 b2.7293.8613.266 a
RSI638,11380.6390.8220.704 c0.7490.8130.779 b0.8521.2321.080 a
RSI640,4601.6692.0461.933 c1.9652.6322.389 b3.0764.3933.671 a
RSI650,4561.4841.7861.698 c1.7832.4392.190 b2.9544.5763.786 a
RSI740,6543.3385.4114.408 a3.0123.4993.333 b1.3002.4541.535 c
RSI766,7640.9930.9990.995 c0.9970.9990.998 b0.9991.0061.002 a
RSI780,7640.9911.0150.996 c1.0081.0151.011 b1.0121.0461.027 a
RSI780,6503.3525.4814.437 a3.0683.5763.424 b1.4342.5291.686 c
The mean value for each parameter with the same letter is not statistically different under different ripening degrees according to Duncan’s multiple range test at a 0.05 significance level.
Table 5. The adjusted coefficients of determination measure the proportion of variance in Chl a, Chl b, respiration rate, TSS, and firmness that can be explained by twenty-seven SRIs of banana fruits.
SRIsChl aChl bRespiration RateTSSFirmness
GI0.79 ***0.64 ***0.78 ***0.83 ***0.71 ***
PRMI0.75 ***0.57 ***0.74 ***0.81 ***0.71 ***
NCI0.74 ***0.58 ***0.74 ***0.80 ***0.68 ***
NAI0.76 ***0.59 ***0.73 ***0.84 ***0.75 ***
NDI780,5500.69 ***0.47 ***0.81 ***0.77 ***0.73 ***
NDI780,5700.66 ***0.50 ***0.61 ***0.74 ***0.66 ***
NDI780,6700.76 ***0.59 ***0.75 ***0.81 ***0.70 ***
NDI780,7100.76 ***0.59 ***0.74 ***0.84 ***0.75 ***
NDI800,6400.80 ***0.62 ***0.79 ***0.87 ***0.78 ***
NDI826,6700.75 ***0.59 ***0.74 ***0.81 ***0.69 ***
NDI970,6700.75 ***0.59 ***0.72 ***0.81 ***0.70 ***
RSI450,6400.83 ***0.58 ***0.87 ***0.95 ***0.90 ***
RSI462,4680.87 ***0.66 ***0.84 ***0.93 ***0.86 ***
RSI470,4600.86 ***0.65 ***0.84 ***0.92 ***0.85 ***
RSI470,6520.85 ***0.61 ***0.88 ***0.95 ***0.89 ***
RSI476,4800.85 ***0.65 ***0.76 ***0.89 ***0.79 ***
RSI500,6240.84 ***0.60 ***0.87 ***0.95 ***0.88 ***
RSI530,6100.85 ***0.64 ***0.86 ***0.91 ***0.82 ***
RSI584,5580.83 ***0.50 ***0.85 ***0.88 ***0.79 ***
RSI638,4900.80 ***0.60 ***0.85 ***0.89 ***0.81 ***
RSI638,11380.79 ***0.61 ***0.81 ***0.85 ***0.75 ***
RSI640,4600.81 ***0.60 ***0.86 ***0.90 ***0.82 ***
RSI650,4560.82 ***0.61 ***0.86 ***0.90 ***0.81 ***
RSI740,6540.82 ***0.62 ***0.82 ***0.89 ***0.81 ***
RSI766,7640.75 ***0.54 ***0.89 ***0.79 ***0.75 ***
RSI780,7640.76 ***0.53 ***0.89 ***0.82 ***0.79 ***
RSI780,6500.81 ***0.61 ***0.80 ***0.88 ***0.80 ***
*** Statistically significant at p ≤ 0.001.
Table 6. Results of ANN calibration and validation models for the relationship between SRIs and Chl a, Chl b, respiration rate, TSS, and firmness of banana fruits.
VariableParametersBest IndicesCalibrationValidation
R2RMSER2RMSE
Chl a(12,4) & identityNDI826,670; NDI970-670; RSI500,624; NDI780-570; RSI450,640; NDI760-720; NDI780-710; NDI800,640; RSI650,456; RSI470,652; RSI638,490; NDI750,678; RSI476,480; RSI640,460; NDI780,6700.93 ***1.2870.89 ***1.162
Chl b(12,4) & identityRSI740,654; RSI650,456; RSI640,460; PRMI, RSI826,670; RSI530,6100.71 ***0.6350.63 ***0.525
Respiration rate(10,14) & identityRSI638,1138; NDI780-570; RSI500,624; NDI750,678; RSI554,667; NDI970-670; NDI760-720; RSI462,468; RSI470,460; RSI650,456; RSI780,764; RSI740,654; RSI788,650; RSI638,490; RSI38,4600.95 ***4.2530.91 ***4.212
TSS(6,10) & reluRSI462,468; NDI750-678; RSI638,1138; NDI780,670; RSI554,667; RSI650,456; RSI470,460; RSI450,640; RSI500,624; RSI766,764; RSI780,764; NDI760-720; NDI780-5701.00 ***0.5390.97 ***1.034
Firmness(22,4) & logisticNDI750-678; RSI650,456; NDI970-670; RSI450,640; RSI766,764; NDI800,640; RSI584,558; RSI780,764; RSI476,480; RSI640,490; RSI638,490; RSI500,624; NDI780-550; RSI740,654; RSI470,4601.00 ***0.4170.98 ***1.161
*** Statistically significant at p ≤ 0.001.
Table 7. Results of SVMR calibration and validation models for the relationship between SRIs and Chl a, Chl b, respiration rate, TSS, and firmness of banana fruits.
ParametersCalibration Validation
R2RMSER2RMSE
Chl a0.90 ***1.600.86 ***1.87
Chl b0.74 ***0.620.60 ***0.75
Respiration rate0.94 ***4.820.91 ***5.66
TSS0.97 ***1.430.95 ***1.83
Firmness0.95 ***2.570.91 ***3.37
*** Statistically significant at p ≤ 0.001.
Publisher’s Note: MDPI stays neutral with regard to jurisdictional claims in published maps and institutional affiliations.

