Article

Relationships between Soil Tillage Systems, Nematode Communities and Weed Seed Predation

1
Department of Plant and Environmental Protection Sciences, University of Hawaii at Manoa, Honolulu, HI 96822, USA
2
Agriculture and Natural Resources Division, University of California, Indio, CA 92201, USA
3
Department of Entomology, University of Maryland, College Park, MD 20742, USA
4
Mycology and Nematology Genetic Diversity and Biology Laboratory, Henry A. Wallace Beltsville Agricultural Research Center, USDA, Beltsville, MD 20705, USA
*
Author to whom correspondence should be addressed.
Horticulturae 2022, 8(5), 425; https://doi.org/10.3390/horticulturae8050425
Submission received: 29 March 2022 / Revised: 5 May 2022 / Accepted: 6 May 2022 / Published: 10 May 2022

Abstract

:
Soil tillage is generally recognized as having a negative effect on soil health and weed seed predators. Recent advancements in conservation tillage practices allow for further comparison of how different levels of soil disturbances could influence soil food web communities. Field trials were conducted in 2017 and 2018 at two different sites to measure the effects of four cover crop termination treatments: conventional till (CT), no-till (NT), strip-till following roller-crimping (ST-RC), and strip-till with a living mulch between crop rows (ST-LM) on soil health using nematode community indices as soil health bioindicators. Following cover crop termination, the soil was monitored in the subsequent bell pepper (Capsicum annuum) crop over three sampling dates (June, August, and October). In the ST-RC treatment plots, soil nutrients were enriched (increased Enrichment Index, EI) and the soil food web structure was improved (higher Structure Index, SI) by the mid-season of the 2017 trial. In the 2018 trial, the ST-RC treatment enhanced fungal decomposition pathways (fungivore/fungivore + bacterivore ratio) throughout the bell pepper crop cycle and enhanced bacterial decomposition (abundance of bacterivorous nematodes) by the end of the cropping cycle compared to the no-till treatment, suggesting that the ST-RC treatment can further improve soil health conditions achieved by the NT treatment. Scatter plots of sampling points revealed that the treatments CT and NT had very distinct nematode-weed community assemblages in both trials, with the ST-RC and ST-LM treatments distributed closely with the NT treatment. Multivariate analysis among soil health bioindicators, weed pressure and weed seed predation explained 76.4 and 55.7% of the variance in the 2017 and 2018 trials, respectively. Weed pressure was consistently negatively related to (1) the SI, indicating soil disturbance would lead to more weed pressure; (2) the EI, indicating soil with higher weed pressure was linked to poor soil nutrient cycling, (3) cover crop residues left in the field from conservation tillage, or (4) how well the living mulch of red clover covered the ground. This study did not show that weed seed predation would lead to lower weed pressure but weed seed predation increased as weed biomass increased.

Graphical Abstract

1. Introduction

Incorporating cover crops into conservation tillage systems offers several potential agronomic benefits. These may include improved soil food web structure [1] and soil quality [2,3], increased soil organic matter [4] and soil water retention [5,6], as well as reduced soil erosion [7], plant-parasitic nematode infestation [1,8], arthropod pests [9], plant diseases [10,11] and weeds [12]. In no-till cover cropping systems, herbicides are commonly used to terminate the cover crop prior to cash crop planting. However, organic farmers generally use mechanical tools to terminate their cover crops. Mechanical termination can be achieved by using a flail or rotary mower, roller crimper, or tillage. However, tillage results in soil disturbances which can be detrimental to beneficial organisms on or below ground. Mowing is one approach employed to terminate some cover crops with imperceptible soil disturbance. However, this method has potential pitfalls such as cover-crop regrowth following mowing and uneven spatial distribution of cover-crop residues [13]. Osterholz et al. [14] suggested that more research is needed to investigate the interactions between cover crops and tillage for weed control and soil health.
Recent advances in roller-crimper design offer a reliable method to physically terminate cover crops without biomass entangling associated with rotary mower usage. The roller crimper typically consists of a water-filled drum with chevron-patterned blades that is propelled by a tractor. As the tractor is driven over the cover crop, the roller crimper flattens plants while crimping their stems every 4–10 cm depending on the roller design. Further, the crimped cover crop residue remains on the soil surface for a longer period compared to residue following rotary mowing, which can lead to a longer period of weed suppression. However, using a roller crimper to terminate a cover crop may not provide similar weed suppression relative to an herbicide terminated cover crop. For example, total weed biomass suppression within a soybean crop following roller crimping of hairy vetch (Vicia villosa) and rye (Secale cereale) achieved 26 and 56%, respectively, compared to that of herbicide termination of these cover crops [12].
The efficacy of weed suppression in conservation tillage systems has been shown to be strongly related to its effect on weed fecundity [15], which can be impacted by weed seed predation [16]. Weed seed predators may include ground beetles (Coleoptera: Carabidae) [17], fire ants, Solenopsis geminata (Fabricius) (Hymenoptera: Formicidae), rodents [18] and crickets (Orthoptera: Grylloidea) [19]. Carabids are also important generalist predators in annual row-crop systems [20]. However, they can be distressed easily by soil disturbances. In a study by Menalled et al. [16], the density, diversity and activity of carabid species were higher in no-till compared to conventionally tilled systems. However, few studies have explored relationships between tillage type and soil disturbance, and their subsequent effects on weed seed predation in organic farming systems.
In light of soil degradation problems caused by continuous tillage [2] and its negative impact on soil health [21,22], soil and nematode ecologists have demonstrated that free-living nematodes are good soil health indicators because they play important roles in soil nutrient cycling [23]. Several studies using nematode community indices as soil health indicators have shown that no-till farming and organic mulches can enhance nematode diversity, soil food web structure and crop yields [23,24,25,26].
This study was part of a larger project conducted to investigate the impact of conservation tillage on above- and below-ground organisms in organic vegetable plantings. The specific objectives of this study included: (1) assessing different cover crop conservation tillage practices on soil health using nematodes as soil health bioindicators, and (2) examining the relationships between soil health, weed suppression, weed seed predation, and bell pepper (Capsicum annuum L.) yield. We hypothesized that different cover crop conservation tillage practices would influence the soil nutrient cycling pathways or the soil food web structure in the subsequent cash crop differently, and that there would be an affiliation between soil health improvement and weed suppression.

2. Materials and Methods

2.1. Field Trials

Two trials were conducted in separate fields >50 m apart in 2017 and 2018 at the University of Maryland Central Maryland Research and Education Center in Upper Marlboro, MD, USA (38°51′35.46″ N, 76°46′40.86″ W, 34 m a.s.l.). This site is in the Atlantic Coastal Plain ecoregion of Maryland and had an annual rainfall of approximately 972 mm in 2017 and 1674 mm in 2018. Soils at the Upper Marlboro Center are Annapolis series fine-loamy, glauconitic, mesic Typic Hapludults [27]. In the 2017 trial, the field was undergoing transition to organic production (<3 years of organic farming), and the 2018 trial was conducted on a field that had been managed organically for six years. In both field trials, the entire experimental site was 57.3 m wide and 68.6 m long, with 16 individual plots of 9.8 m × 9.1 m.
Each field trial consisted of four pre-plant cover crop termination treatments: (1) conventional till (CT), (2) no-till (NT), (3) strip till after roller-crimping (ST-RC), and (4) strip till with living mulch between crop rows (ST-LM). Three treatments (CT, NT, and ST-RC) were planted with an annual cover crop mixture of rye (Secale cereal L.) and crimson clover (Trifolium incarnatum L.) at 75.3 and 8.8 kg/ha, respectively, whereas the ST-LM treatment was planted with a perennial red clover (Trifolium pratense L.) at 13.4 kg/ha. All treatments were arranged in a randomized complete block design with each treatment replicated four times.
All cover crops were planted in the fall using a no-till grain drill with 17.8 cm spacing between drills. In the CT treatment, the cover crop was terminated using a flail mower followed by chisel plowing and rototilling to incorporate the cover crop residue into the soil as a green manure. In the NT treatment, the cover crop was terminated using a flail mower and its residue remained as an organic mulch. In the ST-RC treatment, the cover crop was terminated using a roller crimper, and the crop rows were strip tilled using a two-row strip tiller (Bigham Brothers Inc., Lubbock, TX, USA) which created 27.9 cm wide, 15 cm deep tilled strips with 1.2 m spacing between strips. In the ST-LM treatment, the red clover was strip-tilled and mowed with a rotary mower in 2017 and flail-mowed in 2018. The rye/crimson clover cover crop mix in the NT and ST-RC treatments were terminated when the rye reached anthesis and the red clover in the interrow areas of the ST-LM plots remained as an interplanted living mulch.
Prior to termination, cover crop biomass was estimated by randomly placing a 0.25 m2 quadrat in two sampling spots within each plot and clipping all vegetation within each quadrat at the soil line. Cover crop biomass was separated into rye, crimson clover, or weeds, and dried in an oven at 60 °C and weighed. Samples of red clover in the ST-LM treatment were not collected as it continued to grow over the duration of the cropping cycle.
Approximately 2.5-month-old greenhouse grown ‘Red Knight’ green bell peppers (Capsicum annuum L.) were transplanted into each plot on 15 June 2017 or 19 June 2018. Pepper intra- and inter-row spacing was 0.6 m and 1.2 m, respectively. Each plot contained eight rows with 20 plants per row in 2017 and 19 plants per row in 2018. Pepper plants were fertilized using pelletized poultry litter (MicroStart 3-2-3 poultry litter Perdue AgriRecycle, Seaford, DE, USA) at a rate of 2615 kg/ha soon after planting (20 June 2017 and 22 June 2018) and an additional 1121 kg/ha later in the season (20 July 2017, 6 July 2018). All plots were drip irrigated as needed.

2.2. Nematode Community Analysis

Soil samples were collected at pepper planting (17 June 2017, 21 June 2018), at the initiation of harvest (2 August 2017, 14 August 2018), and soon after final harvest (23 October 2017, 4 October 2018). Six soil cores were collected with a 2.54 cm diameter soil probe, inserted 20 cm deep into the soil close to the pepper root zone, composited into a bucket, homogenized by hand, put in ziploc bags, and transferred to the laboratory for analysis. Nematodes were extracted from a subsample of 250 cm3 of soil per sample by sieving and centrifugal flotation method [28]. Nematodes were identified to the genus level wherever possible and counted under an inverted microscope. Each nematode was assigned to one of the trophic groups: algivores, bacterivores, fungivores, herbivores, omnivores, or predators according to Yeates et al. [29]. Nematode richness was calculated based on the total number of taxa recorded. The Simpson’s index of dominance was calculated as λ = ∑ (pi)2, where pi is the proportion of each of the ith taxon present [30], whereas diversity was calculated as 1/λ. The fungivore to fungivore + bacterivore (F/F + B) ratio was calculated to characterize the dominant decomposition pathways [31]. Taxonomic families were assigned a colonizer-persister (c-p) rating according to the 1–5 c-p scale of Bongers and Bongers [32]. The free-living nematode maturity index (MI) was calculated as ∑ (pici), where p is the proportion, and c is the c-p value of taxon i [33]. Similarly, the plant-parasitic nematode maturity index (PPI) was calculated for taxa that were categorized as plant-parasitic nematodes. In addition, the enrichment index (EI) was calculated as 100 × [e/(e + b)] to assess soil food web responses to available nutrient resources, the structure index (SI) was calculated as 100 × [s/(s + b)] to reflect the complexity of trophic connection in soil food webs, and the channel index (CI) was calculated as CI = 100 × [0.8 F2/e] to determine if a soil food web was dominated by fungal or bacteria decomposition where e, s, and b are enrichment, structure, and basal food web components, and F2 is abundance of fungivores with c-p value of 2 [34].

2.3. Weed Data Collection

The percent surface coverage by weeds, organic residue, and bare soil following cash crop planting were estimated monthly by placing permanent 2.0 m2 quadrats encompassing three pepper plants in two locations per plot. Weeds from each quadrat were clipped at the soil line, dried at 60 °C and weighed. In addition, another 0.1 m2 quadrat was randomly placed within each plot to record weed abundance by species and percent of weed coverage weekly. Number of weed species (richness) was recorded per quadrat.

2.4. Weed Seed Predation

In 2017, rates of weed seed consumption by predatory insects (seed predation) were measured by placing 10 weed seeds in field baits for 3–4 days (depending on weather) and counting the number of seeds remaining after exposure in the field. Each weed seed bait was constructed of 10 × 10 cm square Petri dishes that were buried flush with the ground surface within each plot. Holes ~2 cm in diameter were cut in the bottoms of the Petri dishes and covered with filter paper to allow rainwater drainage and for equilibration of soil moisture with immediate soil environment. Soil samples were collected from random locations within the experimental plots, dried, homogenized, and passed through a 500 µm sieve to remove any additional weed seeds. Weed seeds were collected from mature weeds from the field margins and were chosen to represent two size classes of seeds; redroot pigweed (Amaranthus retroflexus L.) and lambsquarter (Chenopodium album L.) as small seeded (~1.0 mm), and giant foxtail (Setaria faberi Herrm.) as large seeded species (~2.5 mm diameter). These weeds served as indicator species for weed seed predation. Separate weed seed baits were placed in each plot repeatedly throughout the growing season to assess weed seed consumption by seed predators. The weed seed predation baits were installed initially in 2018, but due to record rainfall during the summer of 2018, they were either flooded or workers were not able to collect the baits in time for the data to be meaningful. Thus, no weed seed predation data was reported for 2018.

2.5. Pepper Yield

The pepper yield data collection was initiated upon maturity or when fruits reached marketable sized of >6.35 cm in length and diameter that matched either the US Fancy, US No. 1 and US No. 2 grades [35]. Fruits were harvested on a weekly basis, counted, and weighed until the first hard frost (19 October 2017) or until crop senescence (3 October 2018). Total fruits harvested throughout a crop season were used for the data analysis.

2.6. Statistical Analysis

The nematode data from each field trial were checked for normality using Proc Univariate in Statistical Analytical Software (SAS) version 9.4 (SAS Institute Inc., Cary, NC, USA). Wherever necessary, data were normalized using log10 (x + 1) or square root transformation prior to analysis of variance (ANOVA) using Proc GLM in SAS with sampling date nested within treatment. If significant interaction between treatment and sampling date was detected (p ≤ 0.05), data were re-analyzed by date. Otherwise, means from repeated measure over time were presented. The means were separated using the Waller-Duncan k-ratio (k = 100) t-test wherever appropriate, and only true means were presented.
For all parameters other than nematodes, data were only used to perform canonical correspondence analysis (CCA). In each trial, CCA was performed using CANOCO™ 4.5 for Windows software (Microcomputer Power, Ithaca, New York, NY, USA) to visualize the relationships between nematode assemblage with weed data including weed count, total weed coverage (%), weed dry weight, weed species richness, weed seed predation (of amaranth, foxtail, and lambsquarter in 2017 only), coverage by bare ground and cover crop residues (%), and pepper yield (fruit number, fruit weight). Average data across dates per trial were used. The nematode assemblage parameters used in this study included nematode richness (rich), abundance of five nematode trophic groups including algivores, bacterivores, fungivores, herbivores, omnivores, predators, and EI, SI, CI, PPI, and MI.

3. Results

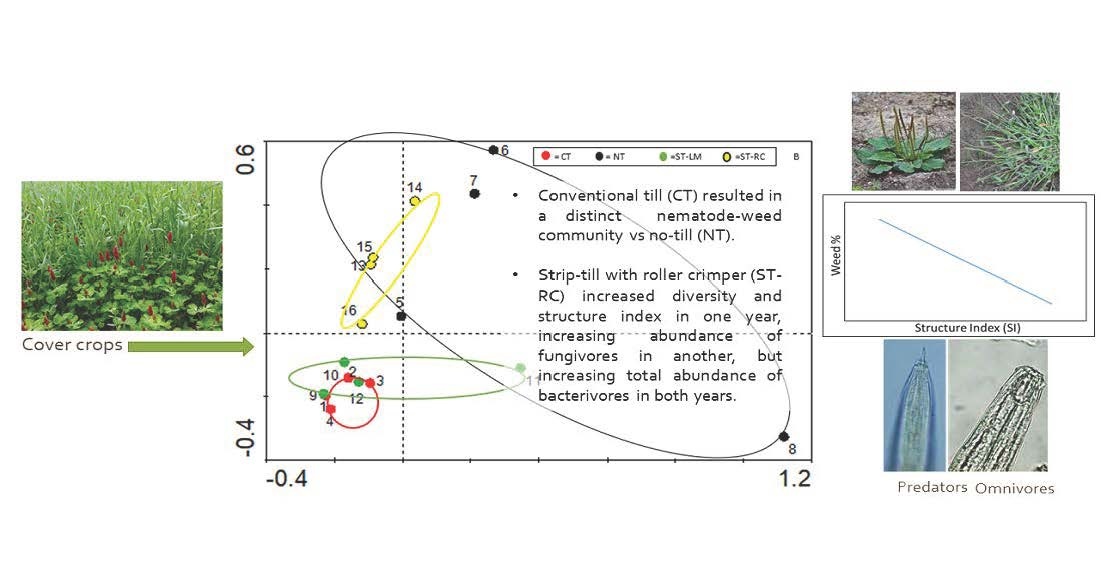
3.1. Nematode Community Analysis as Soil Health Indicators

At cover crop termination, the dry biomass of rye and crimson clover were 4643 and 3239 kg/ha, respectively in 2017, and 3579 and 999 kg/ha, respectively, in 2018. During both field trials, 65 genera or taxa of nematodes were detected, including two algivores, 21 bacterivores, 12 fungivores, 8 herbivores, 12 omnivores and 10 predators. The nematode genera present in both field trials and their guilds are listed in Table 1.
In the 2017 Trial, most nematode parameters showed significant interaction between the sampling date and the cover crop treatment (p ≤ 0.05). As such, results are presented for each sampling date separately (Table 2). However, no interaction was observed between sampling date and treatment for nematode richness and plant-parasitic nematode index (PPI). Thus, the average data of richness and the PPI values from the three sampling dates are presented in Table 3. While the nematode richness (number of genera) was not influenced by tillage treatment during the pepper cropping cycle, the PPI shifted towards a higher value in the ST-LM and ST-RC treatments compared to the CT treatment (p ≤ 0.05). Considering the NT treatment as the undisturbed soil control, the abundances of all nematode trophic groups did not differ between the disturbed soil treatments (CT, ST-RC, and ST-LM) and the NT treatment on the initial (right after cover crop termination and pepper planting) and final (after final pepper harvest date) sampling dates. However, there was an effect of tillage observed on nematode abundance of all trophic groups at 6 weeks after pepper planting (midterm). During this period, the abundance of bacterivorous nematodes was the greatest in the NT treatment. Further, their abundances were significantly lower in the CT and ST-RC treatments than the ST-LM treatment (p ≤ 0.05). Similarly, the ST-LM treatment was the only disturbed soil treatment that did not contain a reduced number of other free-living nematodes compared to the NT treatment. The CT and ST-RC treatments contained a reduced abundance of herbivores, fungivores, omnivores, and predators compared to the NT treatment (p ≤ 0.05).
With respect to nematode community indices, the ST-LM treatment contained a lower F/F + B ratio than the NT treatment at the initial sampling date indicating a soil condition dominated by bacterial decomposition pathway. This also resulted in the ST-LM treatment containing the lowest MI among all treatments (Table 2). At mid-term, all conservation tillage treatments (NT, ST-LM, ST-RC) had lower F/(F + B) values than the CT treatment indicating that the latter promoted more fungal decomposition pathways. However, the CT treatment had the highest nematode diversity followed by the ST-RC treatment and both were higher than the NT treatment (p ≤ 0.05). At the mid-term sampling, the EI was similar in the ST-LM and NT treatments but was significantly higher in the ST-RC treatment (p ≤ 0.05), indicating a greater enhancement in soil nutrient enrichment. The SI was also higher in the ST-RC treatment compared to the NT and CT treatments (p ≤ 0.05) and similar to the ST-LM and NT treatments. Furthermore, during mid-term, the CI was similar between the NT, CT, and ST-RC treatments but lower in the ST-RC treatment than the ST-LM treatment indicating greater bacterial decomposition than the ST-LM system. However, by the final harvest, the different soil health indices were similar among treatments. Only diversity was higher in the ST-LM treatment than the NT and ST-RC treatments (p ≤ 0.05; Table 2).
In 2018 Trial, the effects of tillage treatment on soil health differed compared to the 2017 trial. No interaction was observed between treatment and sampling date for each nematode parameter tested except for the abundance of bacterivores. Thus, treatment means over the three sampling dates were combined for each index except for bacterivore abundance (Table 4 and Table 5). Overall, the ST-RC treatment contained the greatest abundance of fungivores, and the ST-LM and CT treatments had a greater number of algivores and omnivores compared to the NT treatment (p ≤ 0.05, Table 4). All disturbed soil treatments (CT, ST-LM and ST-RC) contained similar abundance of herbivores and predatory nematodes, and most of the nematode community indices were similar compared to the NT treatment. Contrary to this, the F/(F + B) value was greater in the ST-RC treatment than in all other treatments (Table 4, p ≤ 0.05). The ST-RC treatment was the only one that had a higher abundance of bacterivores compared to the NT treatment on the final sampling date (Table 5, p ≤ 0.05).

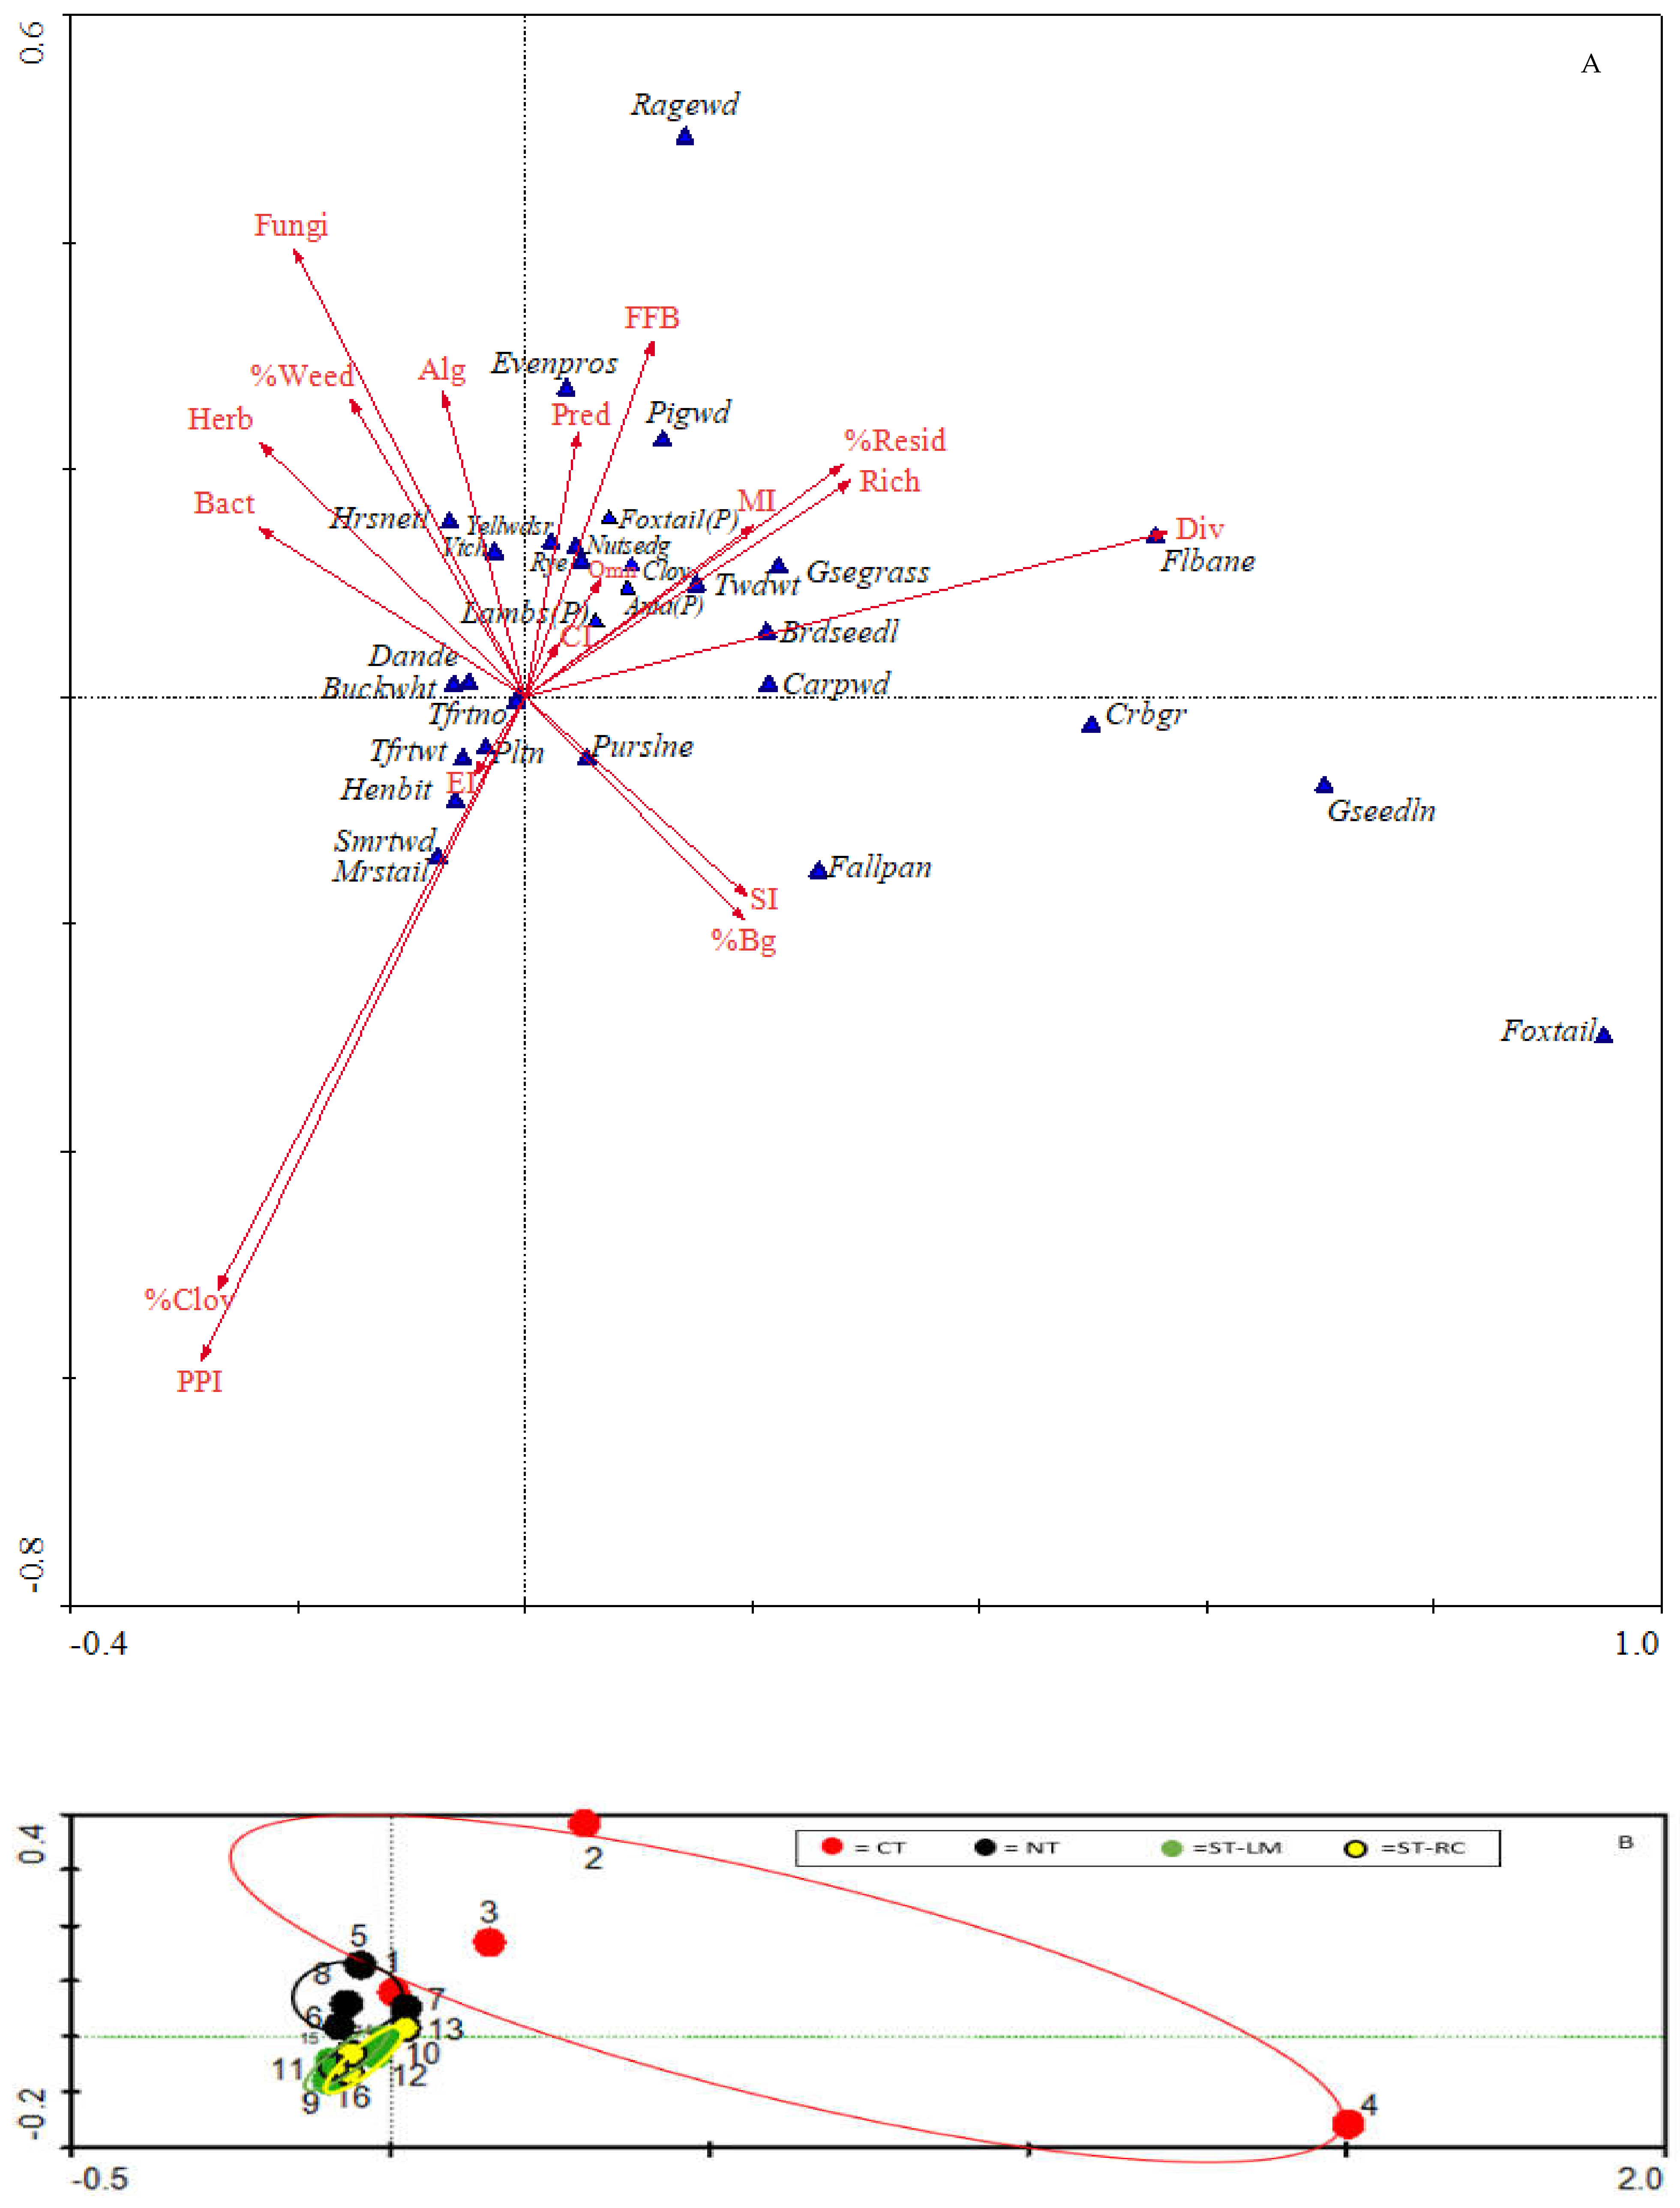
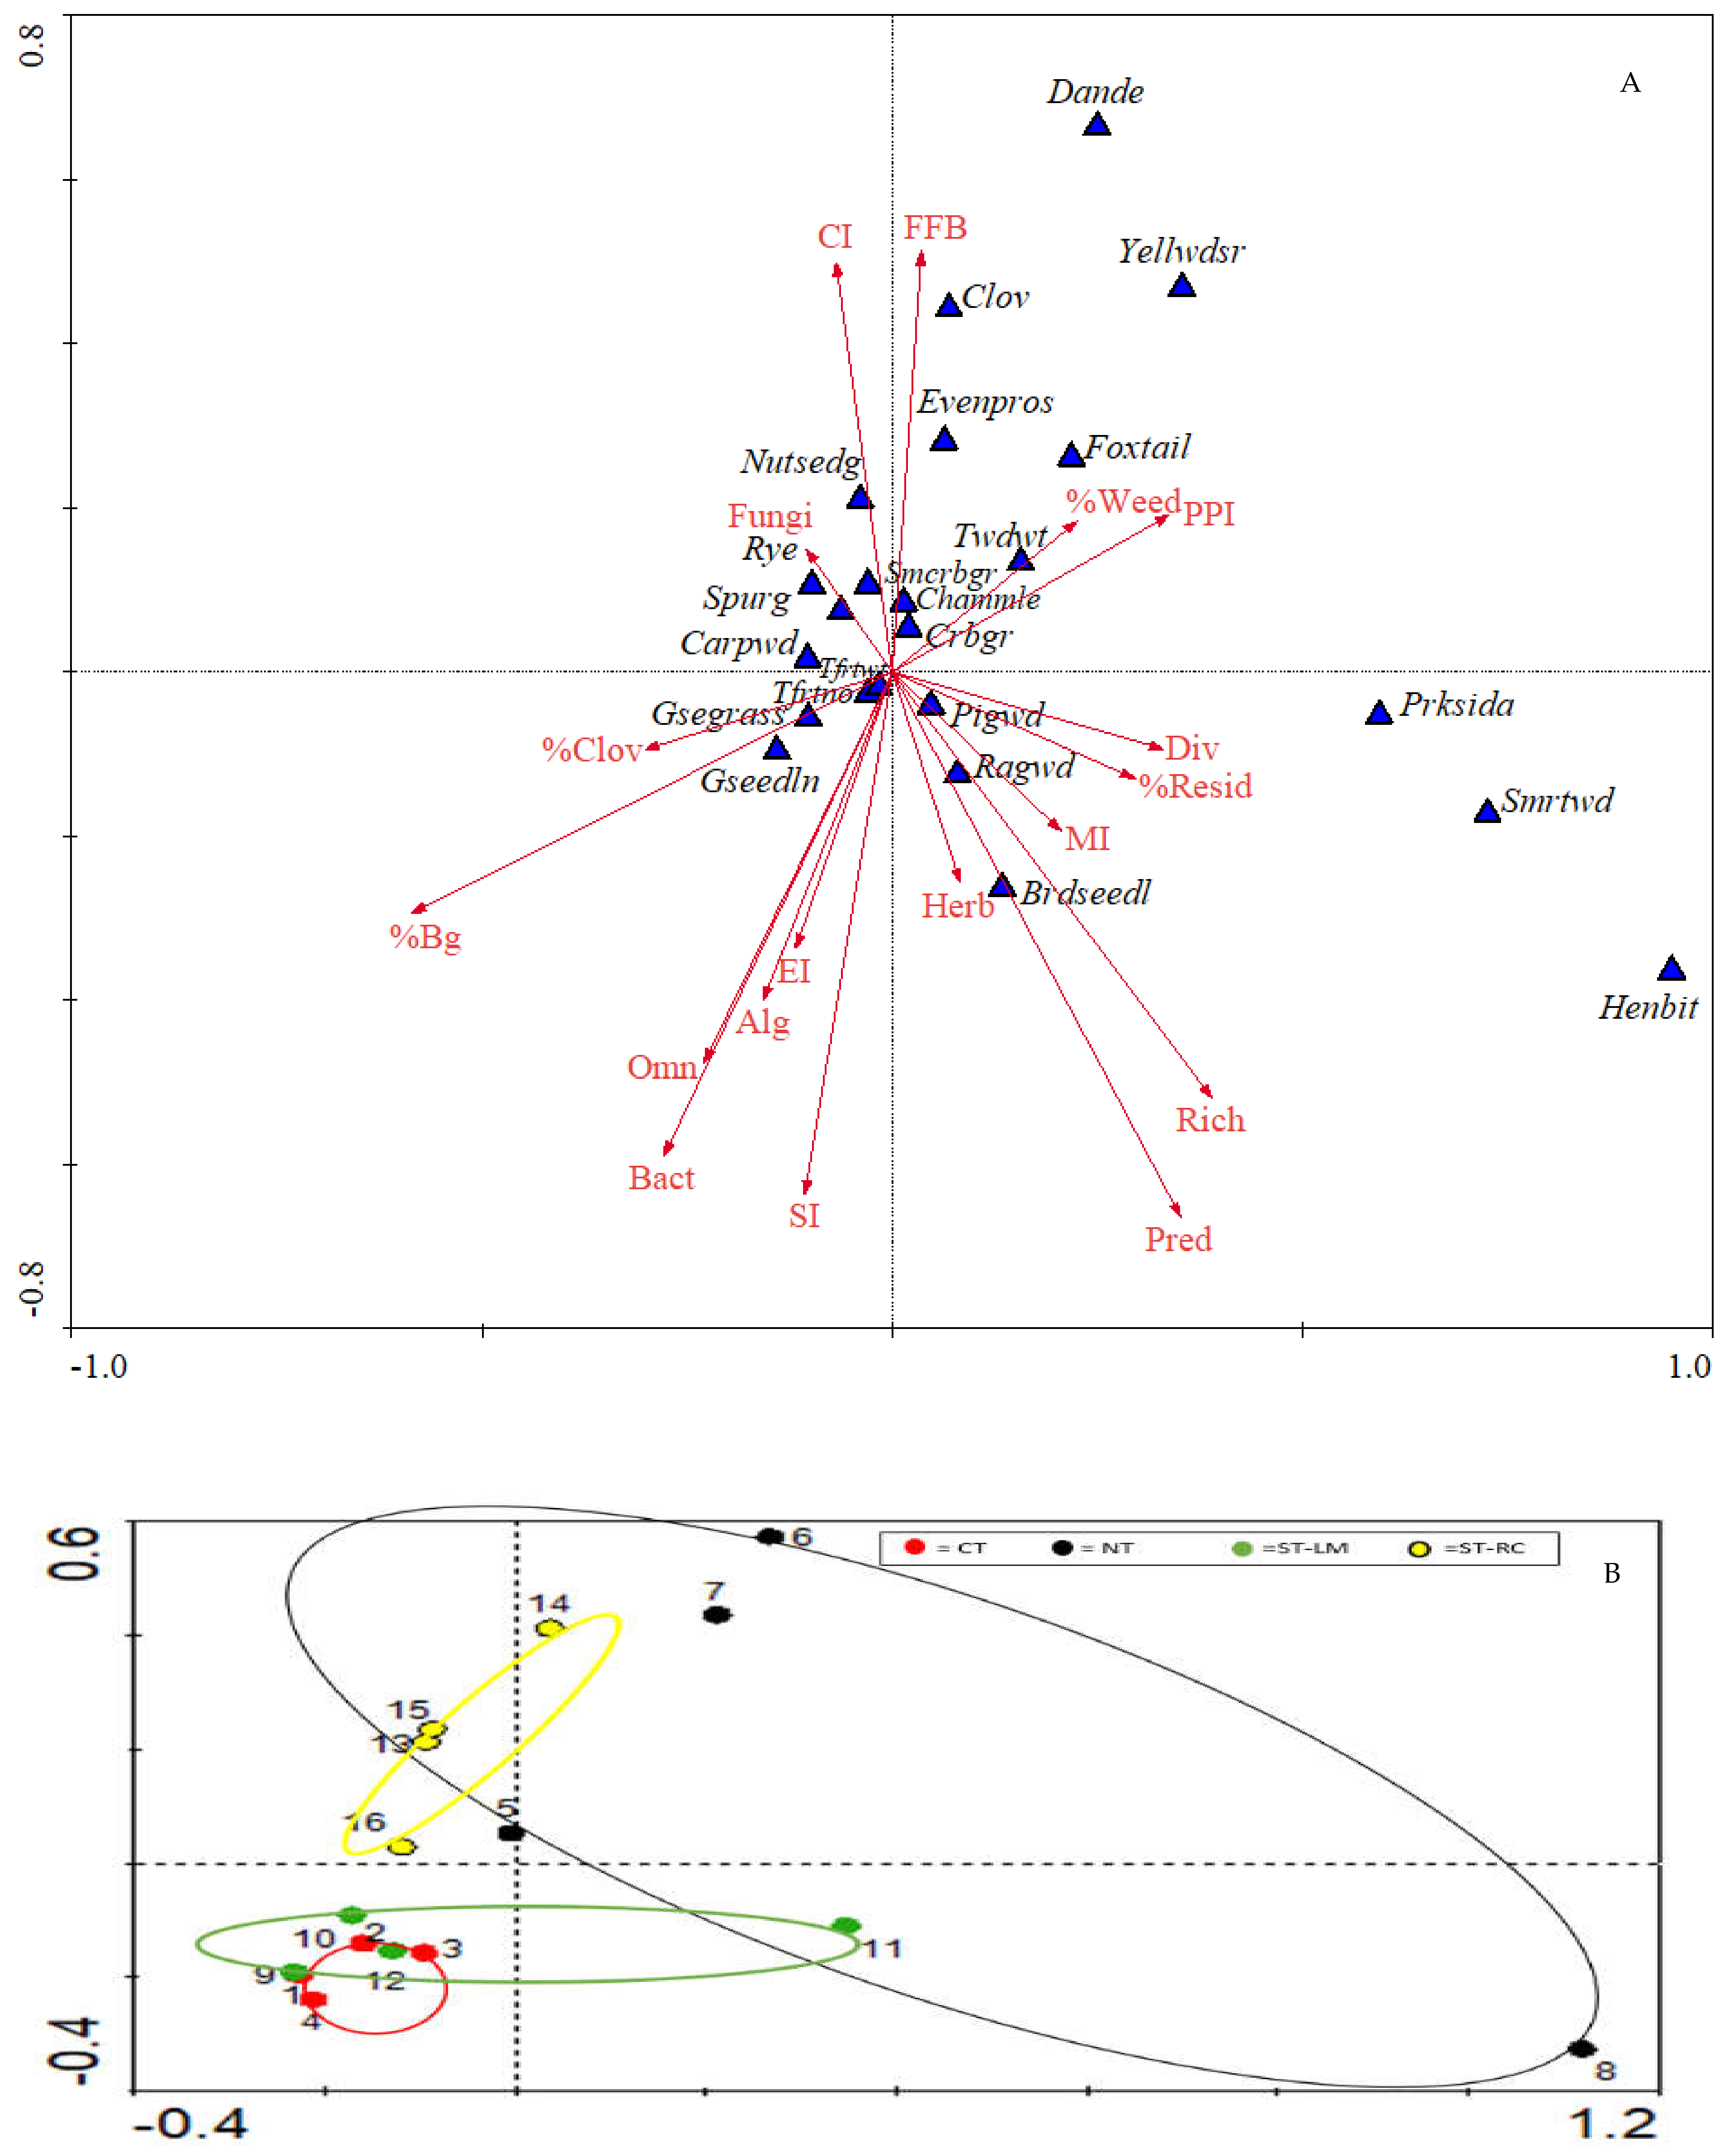
3.2. Relationships of Soil Health with Weed Suppression and Pepper Yield

In the 2017 Trial, the weed species recorded here included annual ryegrass (Lolium perenne L.), carpetweed (Mollugo verticillata L.), common henbit (Lamium amplexicaule L.), common vetch (Vicia sativa L.), dandelion (Taraxacum officinale Weber), evening-primrose (Oenothera biennis L.), fall panicum (Panicum dichotomiflorum Michaux), fleabane (Erigeron philadelphicus L.), giant foxtail, goosegrass (Eleusine indica (L.) Gärtner, horse nettle (Solanum carolinense L.), large crabgrass (Digitaria sanguinalis (L.) Scopoli), redroot pigweed, purple nutsedge (Cyperus rotundus L.), plantain (Plantago major L.), purslane (Portulaca oleracea L.), marestail (Erigeron canadensis L.), ragweed (Ambrosia artemisiifolia L.), smartweed (Persicaria pensylvanica (L.) Gómez, and yellow wood sorrel (Oxalis corniculata L.). Seedlings of miscellaneous broadleaf weeds and grasses were also recorded.
The relationships between nematode assemblages, weed abundance and biomass, and pepper yield data for each trial were depicted in ordination diagrams. For the 2017 trial, the first two canonical axes in the ordination diagram explained 76.4% of the variance between the environmental variables (nematode data, % residues, and % clover coverage) and weed assemblage (% weed coverage, weed dry weight, and abundance of each weed species) (Figure 1A). The percent of weed coverage (% Weed) was negatively related to the percent of bare ground (% Bg) and the structure index (SI), but positively related to the abundance of bacterivores, fungivores, herbivores and algivores. The percent coverage by cover crop or weed residues (% Resid) was not related to the % Weed value but was positively related to the nematode richness and diversity, as well as the fungivores to fungivore + bacterivore ratio (FFB), the channel index (CI), the maturity index (MI) and the abundance of predatory and omnivorous nematodes. The percent coverage by clover (% Clov) was negatively related to the % Resid but positively related to the Plant parasitic index (PPI) and the Enrichment index (EI) and the pepper yield including total fruit number (Tfrtno) and total fruit weight (Tfrtwt). Abundances of most weed species were positively related to % residues and higher nematode richness and diversity values but were negatively related to % Clov. Weed seed predation on lambsquarter, foxtail and amaranth [%lamb(P), %foxtail(P) and %Ama(P)] were also mostly positively related to the % Resid, Twdwt (Total weed dry weight), abundance of predatory and omnivorous nematodes, and the MI and CI values. Although all three weed seed predations were also positively related to abundance of many weed species present, especially one of the dominant weeds, ragweed, they were not related to the abundance of another dominant weed species, foxtail. None-the-less, these weed seed predations were negatively related to % Clov, EI, PPI, and pepper yield (Tfrtno, Tfrtwt).
Scatter plots of sampling points revealed differences in tillage treatments in CCA where the CT treatment distributed distantly from the NT, ST-RC, and ST-LM treatments. Though the NT treatment overlapped very slightly with the CT treatment, it was also segregated from the ST-RC and ST-LM treatments. On the other hand, the two strip-till practices were clustered together (Figure 1B), indicating similar community structure between these two strip-till systems but they are distinct from the CT and NT treatments.
In the 2018 Trial, weed species recorded here included carpetweed, common henbit, dandelion, evening-primrose, garden spurge (Euphorbia hirta L.), giant foxtail, goosegrass, large crabgrass, prickly sida (Sida spinosa L.), purple nutsedge, ragweed, redroot pigweed, smartweed, smooth crabgrass (Digitaria ischaemum (Schreber) Muhlenberg), wild chamomile (Anthemis cotula L.) and yellow wood sorrel. Seedlings of miscellaneous grasses were also recorded.
The first two canonical axes in the ordination diagram only explained 55.7% of the variance between the environmental variables (nematode data, % Residues, % bare ground and % Clover coverage) and weed assemblage measured (% Weed coverage, weed dry weight and abundance of each weed species) (Figure 2).
Though some of the relationships between the nematode community indices and the weed assemblage in 2018 were different from that in 2017, the % Weed was consistently negatively related to the SI and % Bg. The % Weed was also negatively related to the % Clov, EI, and abundance of algivores, bacterivores, omnivores as well as to pepper yield (Tfrtno, Tfrtwt) in 2018. However, the % Weed was positively related to the PPI. The % Resid (cover crop + weed residues) was again positively related to the Div, Rich, MI and predator abundance values of nematodes as in 2017 but also with the abundance of herbivores (Figure 2A). Unlike in 2017, the % Clov was negatively related to the % weed coverage and the PPI but positively related to the % Bg, pepper yield, EI, SI and the abundance of algivores, omnivores, and bacterivores. The majority of the abundances of different weed species were positively related to the % Weed, Twdwt, and the PPI but negatively related to the EI, pepper yield (Tfrtno, Tfrtwt), % Clov and % Bg.
When sampling points were plotted against the canonical axes, the NT treatment was distinctly separated from the CT treatment, but partially overlapping with the ST-RC and ST-LM treatments. While the ST-RC treatment was distinct from the CT treatment, the ST-LM treatment was slightly overlapping with the CT treatment (Figure 2B).

4. Discussion

4.1. Effects of Tillage Treatment on Nematode Community Assemblage

Results from both field trials supported our hypothesis that different cover crop conservation tillage practices would influence soil nutrient cycling pathways or soil food web structure in the subsequent pepper crop differently. This was captured in ANOVA and scatter plots of sampling points. However, slightly different results were observed between the 2017 and 2018 trials. This was likely due to differences in cover crop biomass generated and a difference in field history. In 2017, the field site used was in its third year of organic transition, whereas the site in 2018 had been farmed organically for six years. Thus, we anticipated that the field site used during the 2018 trial would respond to soil health modification faster. This was reflected in the shorter-term effects of cover crop conservation tillage (CT, ST-LM and ST-RC treatments) on nematode communities that ended by the mid-season in 2017 compared to the longer-term effects on nematode assemblage that lasted the whole season in 2018. In 2018, cover crop conservation tillage effect on nematode assemblage lasted until final pepper harvest. In addition, the cover crop residue in 2017 had C:N ratio of 33:1, whereas that in 2018 was 42:1. Higher C:N ratio of cover crop residues in 2018 tentatively contributed to a slower break-down of cover crop residues, and subsequently provided a longer-term effect on soil health.
The results from both field trials consistently demonstrated that nematode community-weed assemblages behaved distinctly differently between the NT and CT treatments based on the scatter plots of samples in both sites (Figure 1B and Figure 2B) regardless of whether the field was previously farmed organically three or six years with annual cover crop rotations. This is consistent with other research showing improved nematode assemblage in fields with at least two years of no-till practices [26,37,38].
Further, the current study showed that the two strip-till treatments (ST-LM and ST-RC) generated more distinct nematode assemblage than the CT and NT treatments in both trials. In 2017, both the ST-LM and ST-RC treatments shifted the PPI towards a higher value compared to the CT treatment. Higher PPI values in the strip-till systems than the CT treatment indicated that the plant-parasitic nematodes were shifting towards the slower reproductive genus Paratrichodorus than the fast reproductive genera such as Meloidogyne and Hoplolaimus. The strip-till practices often improved soil food web structure better than the NT treatment. For example, in 2017, the ST-LM treatment decreased F/(F + B) compared to the NT treatment at bell pepper planting, indicating an initial stimulation of bacterial decomposition in the ST-LM treatment plots. As only a legume (red clover) was used in the ST-LM treatment, whereas other treatments consisted of a grass and legume mixture, the bacterial decomposition pathways were stimulated more quickly in the ST-LM treatment plots because of the low C:N [26]. Red clover was chosen as the living mulch because it is a perennial clover that would last the duration of the crop cycle and thus could suppress weeds in the inter-row area the entire growing season. The increase in bacterial decomposition detected in the ST-LM treatment plots at the initial bell pepper planting was expected. The ST-LM treatment did not continue to enhance the bacterial decomposition throughout the pepper crop cycle. Notwithstanding, it still maintained a higher abundance of bacterivores compared to the CT treatment at the mid-term of the bell pepper crop. In addition, at the end of the bell pepper harvest period, the ST-LM treatment with a perennial red clover contained higher nematode diversity than the NT treatment. In 2018, throughout the cropping cycle, the ST-LM treatment increased algivore and omnivore abundance compared to the NT treatment, indicating a soil food web that is more efficient in nutrient cycling than the NT treatment.
On the other hand, performing strip-till practice using the ST-RC method provided a different level of nematode assemblage improvement. In the 2017 trial, there was an increase in structure and enrichment indices (SI and EI) in the ST-RC treatment compared to the NT treatment at the mid-term sampling period. These findings showcased the advantage of using a mixed planting of gramineous and leguminous cover crops in a conservation tillage system. Compared to a sole leguminous cover crop in the ST-LM treatment, the cover crop mix in the ST-RC treatment slowed down the organic matter decomposition rates, which enhanced the soil food web structure and nematode diversity at least until the mid-season of the cash crop cycle in 2017. In 2018, stimulation of different types of decomposition (bacterial and fungal) was greatest in the ST-RC treatment and the effect lasted the entire bell pepper cropping cycle. It was anticipated that the EI and SI would be higher in the strip-till cover cropping systems than the CT or NT treatments as previously reported [1,39]. We did observe better soil health indices in the ST-RC plots in both years. However, the effect was transient and there was a lack of a profound or longer lasting impact of strip tillage in this study. This could have occurred because each trial was conducted in a single season at each field site. Wang et al. [1] reported an increased EI in a ST-RC treatment leguminous cover crop [sunn hemp (Crotalaria juncea)] in the first crop cycle. However, an increase in the SI was only detected following a consecutive strip-till practice in the same field. Similarly, Dupont et al. [26] only observed a positive effect of cover cropping on nematode communities following a repeat of cover cropping practice within the same field.

4.2. Relationships of Weed Suppression to Cover Crop Residues, Soil Health, and Pepper Yield

One of the main mechanisms whereby conservation cover cropping could suppress weeds is through mulching effect [40,41]. Both field trials demonstrated that weed coverage and weed biomass were consistently negatively related to the living mulch of red clover covering the ground (% Clov). When using red clover as a living mulch in the ST-LM treatment, a higher % of living mulch coverage was negatively related to abundance of most weed species in both years and was negatively related to the % Weed in 2017. The weed suppression effect of red clover could have occurred via competition and through the release of phytotoxins [42]. We could not demonstrate that high cover crop residues contributed to better weed suppression as the % Residue recorded here encompassed cover crop residues as well as weed residues from natural weed senescence. In fact, the close positive relationship between the % Residues and weed biomass production confirmed that majority of the % Residues here was accumulated from weed residues.
The next objective of this study was to examine if there would be an affiliation between soil health indices and weed suppression. The negative relationships between the SI and the % Weed coverage were consistent in the 2017 and 2018 trials, and total weed biomass (Twdwt) was consistently negatively related to the EI in both years. Both findings indicated that weed pressure was higher when the soil was disturbed (lower SI) or low in nutrient cycling (low EI). Many weed scientists have advocated for less soil disturbance because soil disruptions lead to greater weed seed densities and requires more intense weed management in the subsequent crops [43]. Kremer and Li [44] provided further evidence on how soil health management could lead to better weed suppression. They suggested that weed suppressive bacteria with fluorescein diacetate hydrolase, dehydrogenase, and phosphatase enzyme activities were associated with improvement in soil quality measured by higher water-stable aggregates and soil organic matter.
Because soils with high EI and SI are generally considered healthy [34], the current study supported the supposition that healthy soil lead to lower weed biomass (Twdwt). However, weed biomass was not always positively related to the % weed coverage as observed in the 2017 trial. Additionally, the Twdwt was consistently negatively related to the bell pepper yield (Tfrtno, Tfrtwt) in both trials. Two other key nematode soil health indicators are richness and diversity, both of which were positively related to the % Resid indicating that greater cover crop or weed residues in the NT or strip-till treatment systems would enhance soil microbial diversity. Furthermore, better % Clov coverage was positively related to the EI and pepper yields in both years, and the SI as well as abundance of free-living nematodes including algivores, bacterivores and omnivores in the 2018 trial. One question raised is why conservation cover cropping enhanced soil health while suppressing weeds? Liebman and Davis [3] provided a series of explanations, including that the smaller seed size of many weeds appear to be more susceptible to phytotoxic effects of cover crop than crop species. Not to mention that bell pepper plants were transplanted in both trials. In addition, Liebman and Davis [3] also suggested that in a conservation cover cropping systems, cover crop residues delayed N availability and this may favor large-seeded crops or transplants with established root system over small-seeded weeds.

4.3. Relationships between Weed Seed Predation with Soil Health Indicators

Though the weed seed predation study was only available in the 2017 trial, it showed that weed seed predation activities were positively related to weed biomass (Twdwt), cover crop and weed residues (% Resid) as well as abundance of omnivorous and predatory nematodes. This result was expected as omnivorous and predatory nematodes are nematode trophic groups that are most sensitive to soil disturbances [32]. This finding supports the supposition that reduced soil disturbance results in more active weed seed predation. Menalled et al. [16] also reported that no-till treatment alone resulted in a three-fold increase in seed predation by carabid species than the conventional tillage systems. This result is also consistent with previous findings that weed seed predation can be reduced by soil tillage [20]. In addition, Thorbek and Bilde [45] reported that the indirect effects of soil tillage (e.g., weed seed burial into deeper soil, and changes in soil microclimate) caused greater losses in weed seed predators (mostly carabid beetles) than direct mortality imposed by tillage. Our data in 2017 also supported the hypothesis that organic residues can provide a niche, thus enhancing weed seed predation. Shearin et al. [17] reported that cover cropping with pea/oat–rye/vetch enhanced the abundance of the weed seed predator, Harpalus rufipes Degeer (Coleoptera: Carabidae), during the cover crop cycle as well as in the subsequent corn crop planted into the cover crop residues despite the soil being tilled.
However, how much weed seed predation contributed to weed suppression was not conclusive in our trial, as weeds were manually removed periodically during the pepper crop cycle as weed biomass would have been too great if left unmanaged. The 2017 data also showed that weed seed predation activities were positively related to weed biomass as suggested by Mirsky et al. [41]. None-the-less, as suggested by Gallandt et al. [46], although weed seed predation may contribute to a small portion of weed mortality, when combined with other weed suppressive mechanisms from cover cropping (allelopathic effect, mulching effect from cover crop residues, delayed in N availability), the synergistic impact may contribute significantly to an integrated weed management program.

5. Conclusions

Although the effects of tillage on nematode communities varied slightly by year or field history, the ST-RC treatment with rye and crimson clover cover crop mix enriched soil nutrients (increased in enrichment index) and improved the soil food web structure (higher structure index) by mid-season in 2017. Further, in 2018, there was increased fungal decomposition throughout the season and enhanced bacterial decomposition after final harvest in the ST-RC treatment. These results suggest that a ST-RC system can be used to further improve soil health conditions achieved by the NT treatment. Further, it is encouraging that higher structure and enrichment indices were consistently linked to lower weed coverage and weed biomass, respectively. To the best of our knowledge, this is the first study in which the relationships between nematode community indices as a soil health indicator and weed seed predation have been investigated. While cover crop residues generated from conservation cover cropping practices play a significant role in supporting weed seed predation activities, weed seed predation did not influence weed biomass production or coverage in the current study.

Author Contributions

Conceptualization, C.R.R.H., A.W.L. and K.-H.W.; methodology, C.R.R.H., A.W.L., S.L.F.M., K.-H.W., P.W.; formal analysis, P.W., K.-H.W. and R.P.; writing—original draft preparation, K.-H.W., P.W., R.P., A.W.L.; writing—review and editing, C.R.R.H., A.W.L., S.L.F.M.; visualization, K.-H.W., P.W.; supervision, C.R.R.H., K.-H.W.; project administration, C.R.R.H.; funding acquisition, C.R.R.H. All authors have read and agreed to the published version of the manuscript.

Funding

This project was in part supported by College of Tropical Agriculture Hatch, Multistate NE1640 and Plan of Work (HAW9048-H, 9034-R and POW 16-964), and in part by NIFA CARE project award number 2016-68008-25079. Funding was also provided by ARS in-house funds. Mention of trade names or commercial products in this publication is solely for the purpose of providing specific information and does not imply recommendation or endorsement by the U.S. Department of Agriculture. The USDA is an equal opportunity provider and employer.

Institutional Review Board Statement

Not applicable.

Data Availability Statement

The datasets presented in this study are available from the corresponding author on request.

Acknowledgments

Thanks are extended to Margaret MacDonald for assistance in the ARS laboratory to process soil samples.

Conflicts of Interest

The authors declare no conflict of interest. The funders had no role in the design of the study; in the collection, analyses, or interpretation of data; in the writing of the manuscript, or in the decision to publish the results.

References

  1. Wang, K.H.; Hooks, C.R.R.; Marahatta, S.P. Can using a strip-tilled cover cropping system followed by surface mulch practice enhance organisms higher up in the soil food web hierarchy? Appl. Soil Ecol. 2011, 49, 107–117. [Google Scholar] [CrossRef]
  2. Reeves, D.W. The role of soil organic matter in maintaining soil quality in continuous cropping systems. Soil Tillage Res. 1997, 43, 131–167. [Google Scholar] [CrossRef]
  3. Liebman, M.; Davis, A.S. Integration of soil, crop and weed management in low-external-input farming systems. Weed Res. 2000, 40, 27–47. [Google Scholar] [CrossRef] [Green Version]
  4. Dabney, S.M.; Delgado, J.A.; Reeves, D.W. Using winter cover crops to improve soil and water quality. Commun. Soil Sci. Plant Anal. 2001, 32, 1221–1250. [Google Scholar] [CrossRef]
  5. McIntyre, D.S. Permeability measurements of soil crusts formed by raindrop impact. Soil Sci. 1958, 85, 185–189. [Google Scholar] [CrossRef]
  6. Dabney, S.M. Cover crop impacts on watershed hydrology. J. Soil Water Conserv. 1998, 53, 207–213. [Google Scholar]
  7. Sexton, A.M.; Shirmohammadi, A.; Montas, H.; Gish, T.J. Pesticide loss in surface runoff under various tillage and pesticide formulation conditions. In Proceedings of the 2000 ASAE Annual International Meeting, Milwaukee, WI, USA, 9–12 July 2000. [Google Scholar]
  8. Neher, D.A.; Nishanthan, T.; Grabau, Z.J.; Chen, S.Y. Crop rotation and tillage affect nematode communities more than biocides in monoculture soybean. Appl. Soil Ecol. 2019, 140, 89–97. [Google Scholar] [CrossRef]
  9. Altieri, M.A. The ecological role of biodiversity in agroecosystems. Agric. Ecosyst. Environ. 1999, 74, 19–31. [Google Scholar] [CrossRef] [Green Version]
  10. Creamer, N.G.; Bennett, M.A.; Stinner, B.R.; Cardina, J.; Regnier, E.E. Mechanisms of weed suppression in cover crop-based production systems. HortScience 1996, 31, 410–413. [Google Scholar] [CrossRef]
  11. Gonzalez-Martin, C.; Teigell-Perez, N.; Valladares, B.; Griffin, D.W. The global dispersion of pathogenic microorganisms by dust storms and its relevance to agriculture. Adv. Agron. 2014, 127, 1–41. [Google Scholar] [CrossRef]
  12. Davis, A.S. Cover-Crop Roller-crimper contributes to weed management in no-till soybean. Weed Sci. 2010, 58, 300–309. [Google Scholar] [CrossRef]
  13. Creamer, N.G.; Dabney, S.M. Killing cover crops mechanically: Review of recent literature and assessment of new research results. Am. J. Altern. Agric. 2002, 17, 32–40. [Google Scholar] [CrossRef]
  14. Osterholz, W.R.; Culman, S.W.; Herms, C.; de Oliveira, F.J.; Robinson, A.; Doohan, D. Knowledge gaps in organic research: Understanding interactions of cover crops and tillage for weed control and soil health. Org. Agric. 2021, 11, 13–25. [Google Scholar] [CrossRef]
  15. Bensch, C.N.; Horak, M.J.; Peterson, D. Interference of redroot pigweed (Amaranthus retroflexus), Palmer amaranth (A. palmeri), and common waterhemp (A. rudis) in soybean. Weed Sci. 2003, 51, 37–43. [Google Scholar] [CrossRef]
  16. Menalled, F.D.; Smith, R.G.; Dauer, J.T.; Fox, T.B. Impact of agricultural management on carabid communities and weed seed predation. Agric. Ecosyst. Environ. 2007, 118, 49–54. [Google Scholar] [CrossRef]
  17. Shearin, A.F.; Chris Reberg-Horton, S.; Gallandt, E.R. Cover Crop Effects on the Activity-Density of the Weed Seed Predator Harpalus rufipes (Coleoptera: Carabidae). Weed Sci. 2008, 56, 442–450. [Google Scholar] [CrossRef]
  18. Chauhan, B.S.; Migo, T.; Westerman, P.R.; Johnson, D.E. Post-dispersal predation of weed seeds in rice fields. Weed Res. 2010, 50, 553–560. [Google Scholar] [CrossRef]
  19. Brust, G.E.; House, G.J. Weed seed destruction by arthropods and rodents in low-input soybean agroecosystems. Am. J. Altern. Agric. 1988, 3, 19–25. [Google Scholar] [CrossRef]
  20. Harrison, S.K.; Regnier, E.E.; Schmoll, J.T. Postdispersal predation of giant ragweed (Ambrosia trifida) seed in no-tillage corn. Weed Sci. 2003, 51, 955–964. [Google Scholar] [CrossRef]
  21. Magdoff, F. Concept, components, and strategies of soil health in agroecosystems. J. Nematol. 2001, 33, 169–172. [Google Scholar]
  22. Roger-Estrade, J.; Anger, C.; Bertrand, M.; Richard, G. Tillage and soil ecology: Partners for sustainable agriculture. Soil Tillage Res. 2010, 111, 33–40. [Google Scholar] [CrossRef]
  23. Ferris, H.; Griffiths, B.S.; Porazinska, D.L.; Powers, T.O.; Wang, K.H.; Tenuta, M. Reflections on plant and soil nematode ecology: Past, present and future. J. Nematol. 2012, 44, 115–126. [Google Scholar]
  24. Bongers, T. The Maturity Index: An ecological measure of environmental disturbance based on nematode species composition. Oecologia 1990, 83, 14–19. [Google Scholar] [CrossRef] [PubMed]
  25. Hoyt, G.D. Tillage and cover residue effects on Vegetable Yields. Horttechnology 1999, 9, 351–358. [Google Scholar] [CrossRef]
  26. DuPont, S.T.; Ferris, H.; Van Horn, M. Effects of cover crop quality and quantity on nematode-based soil food webs and nutrient cycling. Appl. Soil Ecol. 2009, 41, 157–167. [Google Scholar] [CrossRef]
  27. NCSS. Anapolis Series; National Cooperative Soil Survey: National Academic Soil Survey, Lincoln, NE, USA. 2015. Available online: https://soilseries.sc.egov.usda.gov/OSD_Docs/A/ANNAPOLIS.html (accessed on 28 March 2022).
  28. Jenkins, W.R. A rapid centrifugal-flotation technique for separating nematodes from soil. Plant Dis. Rep. 1964, 48, 692. [Google Scholar]
  29. Yeates, G.W.; Bongers, T.; De Goede, R.G.M.; Freckman, D.W.; Georgieva, S.S. Feeding habits in soil nematode families and genera-an outline for soil ecologists. J. Nematol. 1993, 25, 315–331. [Google Scholar]
  30. Simpson, E.H. Measurement of diversity. Nature 1949, 163, 688. [Google Scholar] [CrossRef]
  31. Freckman, D.W.; Ettema, C.H. Assessing nematode communities in agroecosystems of varying human intervention. Agric. Ecosyst. Environ. 1993, 45, 239–261. [Google Scholar] [CrossRef]
  32. Bongers, T.; Bongers, M. Functional diversity of nematodes. Appl. Soil Ecol. 1998, 10, 239–251. [Google Scholar] [CrossRef]
  33. Yeates, G.W. Modification and qualification of the nematode maturity index. Pedobiologia 1994, 38, 97–101. [Google Scholar]
  34. Ferris, H.; Bongers, T.; De Goede, R.G.M. A framework for soil food web diagnostics: Extension of the nematode faunal analysis concept. Appl. Soil Ecol. 2001, 18, 13–29. [Google Scholar] [CrossRef]
  35. U.S. Department of Agriculture, NASS. United States Standards for Grades of Sweet Peppers; USDA AMS. 2005. Available online: https://www.ams.usda.gov/about-ams/contact-us (accessed on 28 March 2022).
  36. Ferris, H. NEMAPLEX: The Nematode-Plant Expert Information System. 2001. Available online: http://nemaplex.ucdavis.edu/ (accessed on 28 March 2022).
  37. Mendoza, R.B.; Franti, T.G.; Doran, J.W.; Powers, T.O.; Zanner, C.W. Tillage Effects on Soil Quality Indicators and Nematode Abundance in Loessial Soil under Long-Term No-till Production. Commun. Soil Sci. Plant Anal. 2008, 39, 2169–2190. [Google Scholar] [CrossRef] [Green Version]
  38. Sánchez-Moreno, S.; Ferris, H. Suppressive Service of the Soil Food Web: Effects of Environmental Management. Agric. Ecosyst. Environ. 2007, 119, 75–87. [Google Scholar] [CrossRef]
  39. Quintanilla-Tornel, M.A.; Wang, K.H.; Tavares, J.; Hooks, C.R.R. Effects of mulching on above and below ground pests and beneficials in a green onion agroecosystem. Agric. Ecosyst. Environ. 2016, 224, 75–85. [Google Scholar] [CrossRef] [Green Version]
  40. Anderson, W.P. Weed Science: Principles and Applications; West Publishing Co.: St. Paul, MN, USA, 1996. [Google Scholar]
  41. Mirsky, S.B.; Ryan, M.R.; Teasdale, J.R.; Curran, W.S.; Reberg-Horton, C.S.; Spargo, J.T.; Wells, M.S.; Keene, C.L.; Moyer, J.W. Overcoming Weed Management Challenges in Cover Crop–Based Organic Rotational No-Till Soybean Production in the Eastern United States. Weed Technol. 2013, 27, 193–203. [Google Scholar] [CrossRef]
  42. Liebman, M.; Sundberg, D.N. Seed mass affects the susceptibility of weed and crop species to phytotoxins extracted from red clover shoots. Weed Sci. 2006, 54, 340–345. [Google Scholar] [CrossRef]
  43. Davis, A.S.; Cardina, J.; Forcella, F.; Johnson, G.A.; Kegode, G.; Lindquist, J.L.; Luschei, E.C.; Renner, K.A.; Sprague, C.L.; Williams, M.M. Environmental factors affecting seed persistence of annual weeds across the U.S. corn belt. Weed Sci. 2005, 53, 860–868. [Google Scholar] [CrossRef] [Green Version]
  44. Kremer, R.J.; Li, J. Developing weed-suppressive soils through improved soil quality management. Soil Tillage Res. 2003, 72, 193–202. [Google Scholar] [CrossRef]
  45. Thorbek, P.; Bilde, T.; Bilde, T. Reduced numbers of generalist arthropod predators after crop management. J. Appl. Ecol. 2004, 41, 526–538. [Google Scholar] [CrossRef]
  46. Gallandt, E.R.; Weiner, J. Crop–Weed Competition. In Els; John Wiley & Sons, Ltd.: Chichester, UK, 2015; pp. 1–9. ISBN 9780470015902. [Google Scholar]
Figure 1. (A) Canonical correspondence analysis biplot of environmental variables (red arrows) with weed assemblage and yield variables (blue triangles) in 2017 bell pepper cropping system following four tillage regimes. Red triangles include: Alg = algivores, Bact = bacterivores, Fungi = fungivores, Herb = herbivores, Omn = omnivores, Pred = predators, Rich = richness, Div = diversity, FFB = fungivore to fungivore + bacterivore ratio, MI = maturity index, PPI = plant-parasitic nematode index, EI = enrichment index, CI = channel index, SI = structure index, % Clov = red clover living mulch coverage, % Resid = cover crop + weed residues coverage, and % Weed = weed coverage. Blue triangles include: weed seed predations of Amaranth [Ama (P)], foxtail [Fxtail (P)], and lambsquarter [Lamb (P)]; Twdwt = total weed dry weight, abundance of weeds of Hrsnetl = horse nettle, Yellwdsr = yellow wood sorrel, Vtch = common vetch, Rye = ryegrass, Evenpros = evening-primrose, Ragwd = ragweed, Pigwd = pigweed, clov = clover, Fallpan = Fall panicum, Flbane = fleabane, Mrstail = marestail, Pltn = Plantago, Purslne = purslane, Dande = dandelion, buckwht = buckwheat, Brdseedl = miscellaneous broadleaf seedlings, Nutsedg = nutsedge, Carpwd = carpetweed, Gsegrass = goosegrass, Crbgr = crabgrass, Gseedln = miscellaneous grass seedlings, Smrtwd = smartweed; Tfrtno = total fruit number, Tfrtwt = total fruit weight. (B) Scattered plots of sampling points in CT = conventional till, NT = no till, ST-LM = strip-till with living mulch, and ST-RC = strip-till and roller crimper treatments.
Horticulturae 08 00425 g001
Figure 2. (A) Canonical correspondence analysis biplot of environmental variables (red arrows) with weed assemblage and yield variables (triangles) in 2018 bell pepper cropping system following four tillage regimes. All abbreviations are as described in Figure 1. Additional variables in triangles include abundance of chammle = chamomile, Prksida = Prickly sida, Spurg = Spotted spurge, Smcrbgr = smooth crabgrass. (B) Scattered plots of sampling points in CT = conventional till, NT = no till, ST-LM = strip-till with living mulch, and ST-RC = strip-till and roller crimper treatments.
Horticulturae 08 00425 g002
Table 1. Nematode genera and their allotted guild reported in the 2017 and 2018 Trials.
NematodeGuildNematodeGuildNematodeGuild
AchromadoraA-3AphelenchusF-2EcumenicusO-4
ParacyatholaimusA-3AphelenchoidesF-2EnchodelusO-4
AlirhabditisB-1EcphyadophoraF-2EpidorylaimusO-4
AnguilluloidesB-1NeotylenchusF-2EudorylaimusO-4
DiploscapterB-1FilenchusF-2LabronemaO-4
PanagrellusB-1PsilenchusF-2MesodorylaimusO-4
PanagrolaimusB-1NothotylenchusF-2MiodorylaimusO-4
RhabditidaeB-1DiptherophoraF-3PungentusO-4
AcrobelesB-2DorylaimoidesF-4TimmusO-4
AcrobeloidesB-2LeptonchusF-4AporcelaimellusO-5
CephalobusB-2TylencholaimusF-4AporcelaimusO-5
CervidillusB-2TylencholaimellusF-4LaimydorusO-5
DrilocephalobusB-2
EucephalobusB-2TylenchusH-2TripylaP-3
HeterocephalobusB-2HoplolaimusH-3TrobilusP-3
MonhysteraB-2HelicotylenchusH-3ClarkusP-4
PlectusB-2DitylenchusH-3IronusP-4
WilsonemaB-2PratylenchusH-3MononchusP-4
ZeldiaB-2TylenchorhynchusH-3MylonchulusP-4
ChronogasterB-3MeloidogyneH-3AetholaimusP-5
PrismatolaimusB-3ParatrichodorusH-4DiscolaimiumP-5
TeratocephalusB-3 NygolaimusP-5
AlaimusB-4 ParavulvusP-5
A = algivore, B = bacterivore, F = fungivore, H = herbivore, O = omnivore, p = predator. Number following the feeding group indicates c-p value assigned by [32,34] and Nemaplex database [36].
Table 2. Effect of tillage on nematode community in the 2017 Trial.
Nematode zCT yNTST-LMST-RC
17 June 2017
Abundance-------------------------------nematodes/250 cm3 soil -----------------------
Algivores3 ± 2 a0 ± 0 a1 ± 1 a0 ± 0 a
Bacterivores356 ± 74 ab258 ± 47 ab667 ± 229 a150 ± 36 b
Fungivores338 ± 86 a339 ± 39 a372 ± 65 a384 ± 66 a
Herbivores36 ± 10 a166 ± 75 a53 ± 14 a66 ± 21 a
Omnivores28 ± 7 a36 ± 7 a30 ± 6 a32 ± 19 a
Predators10 ± 7 a24 ± 10 a24 ± 6 a21 ± 6 a
Indices
F/(F + B) x0.52 ± 0.03 bc0.62 ± 0.03 ab0.40 ± 0.10 c0.73 ± 0.03 a
Diversity 6.36 ± 0.61 a5.52 ± 0.61 ab4.49 ± 0.86 ab3.98 ± 0.42 b
Maturity index (1–5)1.81 ± 0.05 ab2.11 ± 0.08 a1.74 ± 0.15 b2.16 ± 0.07 a
Enrichment index (%)74.61 ± 1.48 a62.87 ± 5.88 ab77.36 ± 6.93 a56.43 ± 1.96 b
Structure index (%)29.38 ± 5.45 a43.49 ± 4.47 a36.26 ± 2.18 a35.96 ± 5.30 a
Channel index (%)27.21 ± 2.11 b47.76 ± 9.72 ab23.64 ± 10.60 b64.13 ± 5.46 a
2 August 2017
Abundance---------------------------nematodes/250 cm3 soil --------------------------
Algivores22 ± 4 a53 ± 28 a2 ± 2 b5 ± 2 ab
Bacterivores494 ± 121 c7555 ± 1901 a3019 ± 728 b841 ± 158 c
Fungivores282 ± 57 b1315 ± 426 a969 ± 266 a203 ± 31 b
Herbivores49 ± 15 b375 ± 87 a207 ± 79 a39 ± 12 b
Omnivores32 ± 8 b193 ± 44 a144 ± 47 ab29 ± 7 b
Predators18 ± 3 b115 ± 44 a54 ± 16 ab22 ± 6 b
Indices
F/(F + B)0.37 ± 0.03 a0.17 ± 0.05 b0.25 ± 0.02 b0.20 ± 0.02 b
Diversity8.67 ± 0.54 a3.54 ± 0.65 c4.58 ± 0.52 bc5.68 ± 0.71 b
Maturity index (1–5)1.85 ± 0.03 a1.89 ± 0.07 a1.90 ± 0.12 a1.56 ± 0.10 a
Enrichment index (%)74.87 ± 1.83 ab56.49 ± 7.18 b56.60 ± 10.13 b89.08 ± 1.87 a
Structure index (%)38.89 ± 3.49 b22.86 ± 3.87 c27.59 ± 1.13 c48.31 ± 5.00 a
Channel index (%)19.57 ± 1.16 ab15.52 ± 5.43 ab26.16 ± 5.44 a7.32 ± 1.36 b
23 October 2017
Abundance-------------------------nematodes/250 cm3 soil ----------------------------
Algivores160 ± 91 a60 ± 28 a78 ± 6 a88 ± 13 a
Bacterivores2298 ± 594 a1495 ± 256 a2079 ± 161 a2498 ± 442 a
Fungivores1853 ± 364 a1553 ± 287 a1555 ± 152 a1653 ± 299 a
Herbivores358 ± 117 a303 ± 36 a383 ± 68 a395 ± 144 a
Omnivores420 ± 24 a258 ± 36 a410 ± 32 a285 ± 63 a
Predators170 ± 34 a85 ± 15 a160 ± 17 a135 ± 25 a
Indices
F/(F + B)0.46 ± 0.04 a0.50 ± 0.06 a0.43 ± 0.04 a0.40 ± 0.06 a
Diversity7.87 ± 0.45 ab7.21 ± 0.65 b10.04 ± 0.68 a7.45 ± 1.36 b
Maturity index (1–5)2.25 ± 0.08 a2.15 ± 0.03 a2.36 ± 0.05 a2.10 ± 0.12 a
Enrichment index (%)64.37 ± 5.08 a69.80 ± 3.35 a59.01 ± 4.40 a72.43 ± 6.46 a
Structure index (%)60.40 ± 1.53 a58.14 ± 2.23 a63.46 ± 2.81 a61.80 ± 4.93 a
Channel index (%)33.39 ± 6.44 a30.86 ± 6.18 a33.97 ± 3.88 a24.58 ± 7.48 a
z Values are means from four replicates (n = 4) and those followed by the same letter(s) in a row are not different according to Waller-Duncan k-ratio (k = 100) t-test. Treatments: y CT = conventional tillage; NT = no-till; ST-LM = strip-till with living mulch; ST-RC = strip-till following roller-crimping. x F/(F + B) = ratio of fungivores/(fungivores + bacterivores).
Table 3. Effect of tillage on nematode richness and plant-parasitic nematode index in 2017.
Nematode zCT yNTST-LMST-RC
Richness30 ± 2 a28 ± 1 a28 ± 2 a28 ± 2 a
Plant-parasitic index (3–5)2.60 ± 0.08 b2.73 ± 0.08 ab2.84 ± 0.06 a2.84 ± 0.06 a
z Values are means from four replicates and three repeated measures (n = 12) and those followed by the same letter(s) in a row are not different according to Waller-Duncan k-ratio (k = 100) t-test. Treatments: y CT = conventional tillage; NT = no-till; ST-LM = strip-till with living mulch; ST-RC = strip-till following roller-crimping.
Table 4. Effect of tillage on nematode community in the 2018 Trial.
Nematode zCT yNTST-LMST-RC
----------------------------------nematodes/250 cm3 soil ---------------------------------
Abundance
Algivores18 ± 4 ab2 ± 1 c34 ± 14 a5 ± 2 bc
Fungivores173 ± 28 ab142 ± 25 b160 ± 35 ab211 ± 31 a
Herbivores100 ± 65 b123 ± 42 ab297 ± 88 a166 ± 77 b
Omnivores32 ± 6 a13 ± 3 b28 ± 5 a23 ± 5 ab
Predators23 ± 6 a16 ± 5 a18 ± 4 a13 ± 3 a
Indices
Richness22 ± 1 a21 ± 1 a22 ± 1 a20 ± 1 a
F/(F + B) x0.44 ± 0.06 b0.45 ± 0.05 b0.39 ± 0.06 b0.54 ± 0.06 a
Diversity6.88 ± 0.81 a7.69 ± 1.05 a6.83 ± 1.43 a5.32 ± 0.78 a
Maturity index (1–5)2.15 ± 0.05 a2.05 ± 0.08 a2.14 ± 0.09 a2.07 ± 0.05 a
Plant-parasitic index (3–5)2.78 ± 0.10 a2.94 ± 0.04 a2.94 ± 0.03 a2.84 ± 0.05 a
Enrichment index (%)71.46 ± 3.07 a70.54 ± 3.31 a68.64 ± 4.81 a66.39 ± 3.41 a
Structure index (%)59.84 ± 4.72 a51.63 ± 4.39 ab61.45 ± 5.50 a46.44 ± 5.02 b
Channel index (%)30.78 ± 6.61 a30.07 ± 6.09 a30.49 ± 6.90 a42.70 ± 7.90 a
z Values are means from four replicates and three repeated measures (n = 12) and those followed by the same letter(s) in a row are not different according to Waller-Duncan k-ratio (k = 100) t-test. Treatments: y CT = conventional tillage; NT = no-till; ST-LM = strip-till with living mulch; ST-RC = strip-till following roller-crimping. x F/(F + B) = ratio of fungivores/(fungivores + bacterivores).
Table 5. Effect of tillage on abundance of bacterivorous nematodes in the 2018 Trial.
Bacterivores zCT yNTST-LMST-RC
---------------------------nematodes/250 cm3 soil ------------------------------
21 June 2018112 ± 27 a121 ± 16 a211 ± 80 a76 ± 20 a
14 August 2018345 ± 40 a285 ± 72 a347 ± 82 a214 ± 24 a
4 October 2018190 ± 33 ab 117 ± 9 b136 ± 29 b245 ± 52 a
z Values are means from four replicates and three repeated measures (n = 12) and those followed by the same letter(s) in a row are not different according to Waller-Duncan k-ratio (k = 100) t-test. Treatments: y CT = conventional tillage; NT = no-till; ST-LM = strip-till with living mulch; ST-RC = strip-till following roller-crimping.
Publisher’s Note: MDPI stays neutral with regard to jurisdictional claims in published maps and institutional affiliations.

