Article

Impact of Beauveria bassiana and Metarhizium anisopliae on the Metabolic Interactions between Cucumber (Cucumis sativus L.) and Cucumber Mosaic Virus (CMV)

1
Department of Plant Protection, Faculty of Agronomy, University of Forestry, 1700 Sofia, Bulgaria
2
Department of Plant Protection, Faculty of Agriculture and Veterinary Medicine, Lebanese University, Beirut 999095, Lebanon
3
Faculty of Agricultural and Food Sciences (FAFS), American University of Beirut, P.O. Box 11-0236, Beirut 1107, Lebanon
*
Author to whom correspondence should be addressed.
Horticulturae 2022, 8(12), 1182; https://doi.org/10.3390/horticulturae8121182
Submission received: 8 September 2022 / Revised: 11 October 2022 / Accepted: 13 October 2022 / Published: 10 December 2022
(This article belongs to the Section Plant Pathology and Disease Management (PPDM))

Abstract

:
In natural systems, plant–endophyte interactions are important for reducing abiotic and biotic stresses in plants by producing a variety of metabolites that protect plants from pathogens and herbivores. Biocontrol strategies are increasingly being used as a viable alternative to chemical pesticides. Entomopathogenic fungi (EPF) are one of them, and they have been touted as a successful method for biological pest control in plants. Because EPF strains are sensitive to environmental conditions when sprayed, the recently discovered endophytic behavior of several EPF strains has improved their management. Cucumber mosaic virus (CMV) is one of the most common and serious plant viruses worldwide, infecting over 1200 plant species and being spread by more than 80 aphid species. CMV control is directed towards the use of chemical insecticides to eradicate its insect vectors. Endophytic EPF is currently being studied to control plant virus infection, and antagonistic effects have been reported. Metabolomics is an emerging research field for plant metabolite profiling and is employed to study plant–endophyte interactions. In the present research, metabolomics approaches were conducted to gain information into mechanisms involved in defense against CMV in endophytes Beauveria bassiana and Metarhizium anisopliae (EPF)-treated diseased cucumber plants. In addition, CMV-induced metabolic changes in cucumber plants were investigated. Our analysis indicated large differences in cucumber metabolites due to endophytes application. In total, six hundred and thirty-one metabolites were differentially expressed in endophyte-treated CMV diseased cucumber plants. Regulation of different kinds of amino acids, organic acids, and phenylpropanoids metabolites could provide insight about plant defense mechanism against CMV pathogen. Important metabolites were found to be regulated in diseased cucumber plants due to fungal endophytes treatment that could possibly confer tolerance to CMV disease.

1. Introduction

Endophytic fungi are microorganisms that colonize healthy plant tissues intracellularly and intercellularly without creating disease symptoms [1]. In contrast to parasitic fungi, symbiotic fungi can benefit their hosts by increasing plant growth [2,3,4], inducing metabolite production [5,6,7,8], and mediating stress alleviate [9]. As a result, plant–endophyte interactions play an important role in crop fitness, as well as triggering defensive systems against plant diseases and insect assaults. Endophytes have been revealed to produce plant growth regulators, secondary metabolites, and defense compounds that have been identified as a result of the evolution in genomics, transcriptomics, proteomics, and metabolomics technologies [10]. Metabolomics, on the other hand, is a relatively new scientific subject that uses technology advances in analytical chemistry to detect and quantify tiny chemicals naturally created by an organism. It has only recently been utilized to identify changes in metabolites at the plant–endophyte interface, allowing for the discovery of new metabolites with potential endophyte uses [11,12].
Currently, research is focused on the adoption of biological control measures against numerous plant illnesses and pests [13]. One of these strategies is the use of entomopathogenic fungi (EPF), which have been demonstrated to not only control insect populations but also boost plant development [14]. Unfavorable climatic conditions, such as UV, temperatures, and low humidity, can reduce EPF efficiency in the field [15,16], however endophytic behavior of certain EPF can significantly improve their action [17,18,19,20,21,22,23]. It has also been observed that fungal endophytes have antagonistic effects against plant viruses. Endophytically infected meadow rye grass (Festuca pratensis Huds.) had the lowest frequency of barley yellow dwarf virus (BYDV) (Luteoviridae: Luteovirus), according to [24]. Squash plants, Cucurbita pepo L., endophytically colonized with Beauveria bassiana (Balsamo Criv.) Vuillemin (1912) (Ascomycota: Hypocreales) isolates, were shown to have lower virus titer levels of zucchini yellow mosaic virus (ZYMV) (Potyviridae: Potyvirus) than endophyte-free plants [25]. Moreover, endophytic colonization of onion plants, Allium cepa, has also induced their resistance against onion thrips and thrips-transmitted iris yellow spot virus (IYSV) (Bunyaviridae: Tospovirus) [26]. Kiarie et al. [27] reported the endophytic Trichoderma harzianum and Metarhizium anisopliae (Ascomycota: Hypocreales) as potential candidates for inducing resistance against sugarcane mosaic virus (SCMV) (Potyviridae: Potyvirus) and suggested their use for the integrated management of Maize Lethal Necrosis (MLN). To date, the fungal endophytes Trichoderma asperellum SKT-1 and Trichoderma harzianum T-22 have been shown to induce systemic resistance against CMV infection in Arabidopsis and tomato plants, Solanum lycopersicum, respectively [28,29]. In addition, González-Mas et al. [30] reported that endophytic B. bassiana colonization of melon plants, Cucumis melo, confers protection against persistent (Cucurbit aphid borne yellows virus, Polerovirus) and non-persistent (Cucumber mosaic virus, Cucumovirus) plant viruses’ transmission by Aphis gossypii (Homoptera: Aphididae). However, endophytic M. anisopiae has not been studied for the control of CMV.
According to our recent studies, these two entomopathogens can colonize cucumber plants, promote their growth, and increase their resistance to Aphis gossypii, a key vector of CMV [4,31]. It is unknown how plant endophytes can elicit plant systemic resistance to viruses at the metabolic level. Thus, the present study investigates the change in metabolite profile of CMV-infected cucumber plants under the effect of entomopathogenic endophytes treatment using metabolomics technique. The entomopathogenic fungi B. bassiana and M. anisopliae were used in this study to investigate their viability as chemical pesticide alternatives. In addition, the effect of CMV infection on the metabolomics of cucumber plants has been investigated.

2. Materials and Methods

2.1. Plant Growth and Treatments

Cucumber variety “TAMARAH” was planted in Polyvinyl Chloride protected greenhouse located at the American University of Beirut (AUB), under controlled conditions: 25 °C temperature (D:N), a photoperiod of 16:8 h (L:D), and 60–80% RH. The treatments include: (NC) negative control, (C) positive control, (Bb) seed treatment with B. bassiana, and (Ma) seed treatment with M. anisopliae. All treatments except NC were inoculated with CMV virus. Positive control plants were inoculated with CMV only with no fungal seed treatment, whereas negative control plants were not inoculated with either CMV or fungi.
Two strains, B. bassiana BbL1 (MT533246) and M. anisopliae MaL1 (MT533250), isolated from fallow soil were used in this study [4,32]. Fungal strains were grown on autoclaved rice [33], and conidial suspensions of each strain were prepared by suspending inoculated rice in 0.03% Tween 20 and shaken on a rotary shaker for 1 h. Resultant suspensions were filtered through several layers of sterile cheesecloth under sterile conditions in order to remove rice fragments. Conidial concentrations were determined using a light microscope and hemocytometer (Fuchs-Rosenthal), and later adjusted to 1 × 10⁸ conidia/mL with sterile 0.03% Tween 20 solution. The viability of conidia was assessed before preparation of suspensions by germinating tests on potato dextrose agar (PDA) medium. In all experiments, germination rates were above 95% after 24 h at 25 °C. Surface-sterilized cucumber seeds were soaked in conidial suspensions of B. bassiana and M. anisopliae for 3 h. For negative and positive control plants, seeds were soaked in sterile 0.03% Tween 20 only. Soaked seeds were then sown on separate trays lined with sterile tissues and watered regularly with sterile distilled water for 7 days. The grown cucumber seedlings were then transplanted each to same-sized pots (15 cm diameter and depth) using a mixture of equal parts of soil (SULIFLOR PREMIUM; NPK + Trace elements), peat moss (GREENTERRA), and coco peat substrate in the greenhouse. Fifteen cucumber plants were used for each treatment (B. bassiana, M. anisopliae, positive and negative control).

2.2. Confirmation of Endophytic Colonization of Plants

A re-isolation method was used to confirm the endophytic colonization of plants by fungal stains. Five randomly selected 2-week-old seedlings from each treatment were harvested from the greenhouse, cleaned, and surface-sterilized. The seedlings were immersed in 2% sodium hypochlorite for 2 min, and then in 70% ethanol for 2 min, followed by three rinses in sterile dH2O. Disinfected seedlings were air-dried in a laminar flow hood for 15 min, the root, stem, and leaf parts of each seedling were cut using a sterile scalpel. The obtained plant materials were placed on PDA selective media amended with antibiotics (20 mg/L Amoxicilline), incubated at 25 °C for 4 weeks and inspected regularly to observe fungal outgrowth. The success of the disinfection process was assessed by plating 0.5 mL of residual rinse water on PDA and by making imprints of surface sterilized plant tissue [4]. Based on differential fungal growth on selective media, colony morphology, and microscopic examination of conidia, outgrowth from the plated plant samples were identified as B. bassiana or M. anisopliae [34]. Percent colonization of different seedling parts by the respective inoculated fungus was calculated following the Petrini and Fisher [35] formula: % colonization = number of sampled plant tissue showing fungal outgrowth divided by the total number of plated plant tissue samples × 100.

2.3. CMV Infection and Plant Sampling

Symptomatic cucumber leaf samples were collected from different locations in Lebanon and tested for CMV presence using PCR CMV set (BIOREBA-Qualiplante) [36]. Positive tested samples (inoculum source) were preserved at 4 °C [37] in tightly closed containers containing calcium chloride (CaCl2). Inoculum was prepared by homogenizing 1 g of infected leaf tissue taken from 5-week-old plants in 10 mL of 50 mM phosphate buffer (PH: 7.4) using a sterile, pre-chilled, and maintained on ice mortar and pestle. Prior to plant inoculation, carborundum fine powder (Fisher Scientific, Waltham, MA, USA) as an abrasive was lightly dusted on two marked leaves. The inoculum was then mechanically applied by rubbing the leaves several times from leaf base to tip using a cheesecloth [38]. In negative control (non-infected), cucumber plants were mock-inoculated with phosphate buffer only. The success of viral infection was assessed by observation of symptom development on leaves, double-antibody sandwich enzyme-linked immunosorbent assay (DAS-ELISA–BIOREBA, Switzerland), and PCR test. The RNA was isolated from cucumber leaves using CTAB method explained by Chang et al. [39] with a slight modification, and the complementary DNAs (cDNAs) were synthesized using the iScript gDNA Clear cDNA Synthesis Kit (BIO-RAD, CA) by using the user’s manual. A NanoDrop spectrophotometer (Thermo Scientific, Waltham, MA, USA) was used to quantify the amount of RNA, and agarose gel electrophoresis was used to access the quality of RNA. The following PCR conditions were adopted: initial denaturation step of 2 min at 95 °C followed by 35 cycles, each consisting of a 45 sec denaturation step at 95 °C, a 45 sec annealing step at 58 °C, a 1 min elongation step at 72 °C, and a final elongation step at 72 °C for 7 min. All plants were grown under the above-mentioned controlled conditions in a protected greenhouse. For each treatment group, plants were covered with a separate net. Leaf samples were collected in ten replicates from each treatment (Fungal-treated plants, positive and negative control plants) at 3, 6, and 10 days post-virus inoculation and immediately frozen in liquid nitrogen. Samples were stored at −80 °C for further analysis.

2.4. Sample Preparation and Metabolome Profiling

Freeze-dried samples were prepared for metabolomics analysis. Samples were homogenized into a fine powder using liquid nitrogen. Nine hundred µL of 80% methanol was added to 100 mg of each sample, vortexed for 90 sec, and then sonicated for 30 min at room temperature. All samples were kept at −40 °C for 1 h. After freezing, they were vortexed again for 30 s, incubated at room temperature for 30 min, and then centrifuged at 12,000 rpm for 15 min. The supernatants for each sample were placed into glass vials and freeze-dried (Labconco-TBA) into pellets (3 replicate pellets for each Dpi and treatment).
Metabolite profiling of the plant samples was done using 2-Channel Analysis method. Data were collected using Dansyl- and DmPA-labeling Kit for each channel. Analyses were performed using IsoMS Pro 1.2.15 (NovaMT Inc., Edmonton, AB, Canada) and NovaMT Metabolite Database v2.0. Metabolomics study was performed in The Metabolomics Innovation Centre (TMIC, Vancouver, BC, Canada).

2.5. Data Processing

A total of 66 LC-MS data from 2-channel analysis (33 LC-MS data, including 3 QC in each channel) were first exported to .csv file with Bruker DataAnalysis 4.4. The exported data were uploaded to IsoMS Pro 1.2.15. After a data quality check, data processing was performed. Parameters used for data processing are minimum–maximum m/z: (220–1000), saturation intensity (2,000,000), retention time tolerance (9 s), and 10 ppm mass tolerance.

2.6. Data Cleansing

Ten groups were assigned to 33 LC-MS data in each channel: 3 data files labeled as “Day3_Control” group, 3 data files labeled as “Day3_B_Treatment” group, 3 data files labeled as “Day3_M_Treatment” group, 3 data files labeled as “Day6_Control” group, 3 data files labeled as “Day6_B_Treatment” group, 3 data files labeled as “Day6_M_Treatment” group, 3 data files labeled as “Day10_Control” group, 3 data files labeled as “Day10_B_Treatment” group, 3 data files labeled as “Day10_M_Treatment” group, 3 data files labeled as “Negative Control” group, and 3 data files labeled as ‘QC’ group. Peak pairs without data present in at least 80.0% of samples in any group were filtered out. Data were normalized by ratio of total useful signal.

2.7. Statistical Analysis

The experiments were arranged in a completely randomized design. Data sets for percentage values of fungal colonization with M. anisopliae and B. bassiana of different cucumber plant parts and ELISA absorbance measurements were subjected to one-way ANOVA with the fungal strain as a main factor. Data sets were analyzed with the statistical program IBM SPSS Statistics for Windows, Version 23.0 (2015) using one-way ANOVA after checking the assumptions for normality and the homogeneity of variance (Levene’s test). When a significant F test was obtained at p = 0.05, separation of treatment means was performed using Duncan test. The heat maps were done using function heat map 2 under R program, Version 3.4. Moreover, Venn diagrams were performed using GHENT University Bioinformatics program.

3. Results

3.1. Assessment of Colonization of Beauveria bassiana and Metarhizium anisopliae in Cucumber Plants

Cucumber seeds artificially inoculated by direct submerging in conidial suspensions resulted in successful colonization of plant parts with tested B. bassiana and M. anisopliae isolates. Fungi were recovered from roots, stems, and leaf fragments on PDA selective medium, confirming their presence in the internal tissues. Results in Table 1 and Figure 1 show that both B. bassiana and M. anisopliae isolates colonized cucumber seedlings two weeks post-inoculation. The most successful endophyte re-isolation frequency for B. bassiana was observed from leaf tissues (100%). In addition, 40% and 60% endophyte percentage recoveries were observed in stem and root tissues, respectively, colonized by B. bassiana. M. anisopliae showed 80% percentage recovery from all seedling parts (leaves, stem, and roots). None of the control plants showed signs of M. anisopliae or B. bassiana outgrowth.

3.2. Assessment of CMV Infection

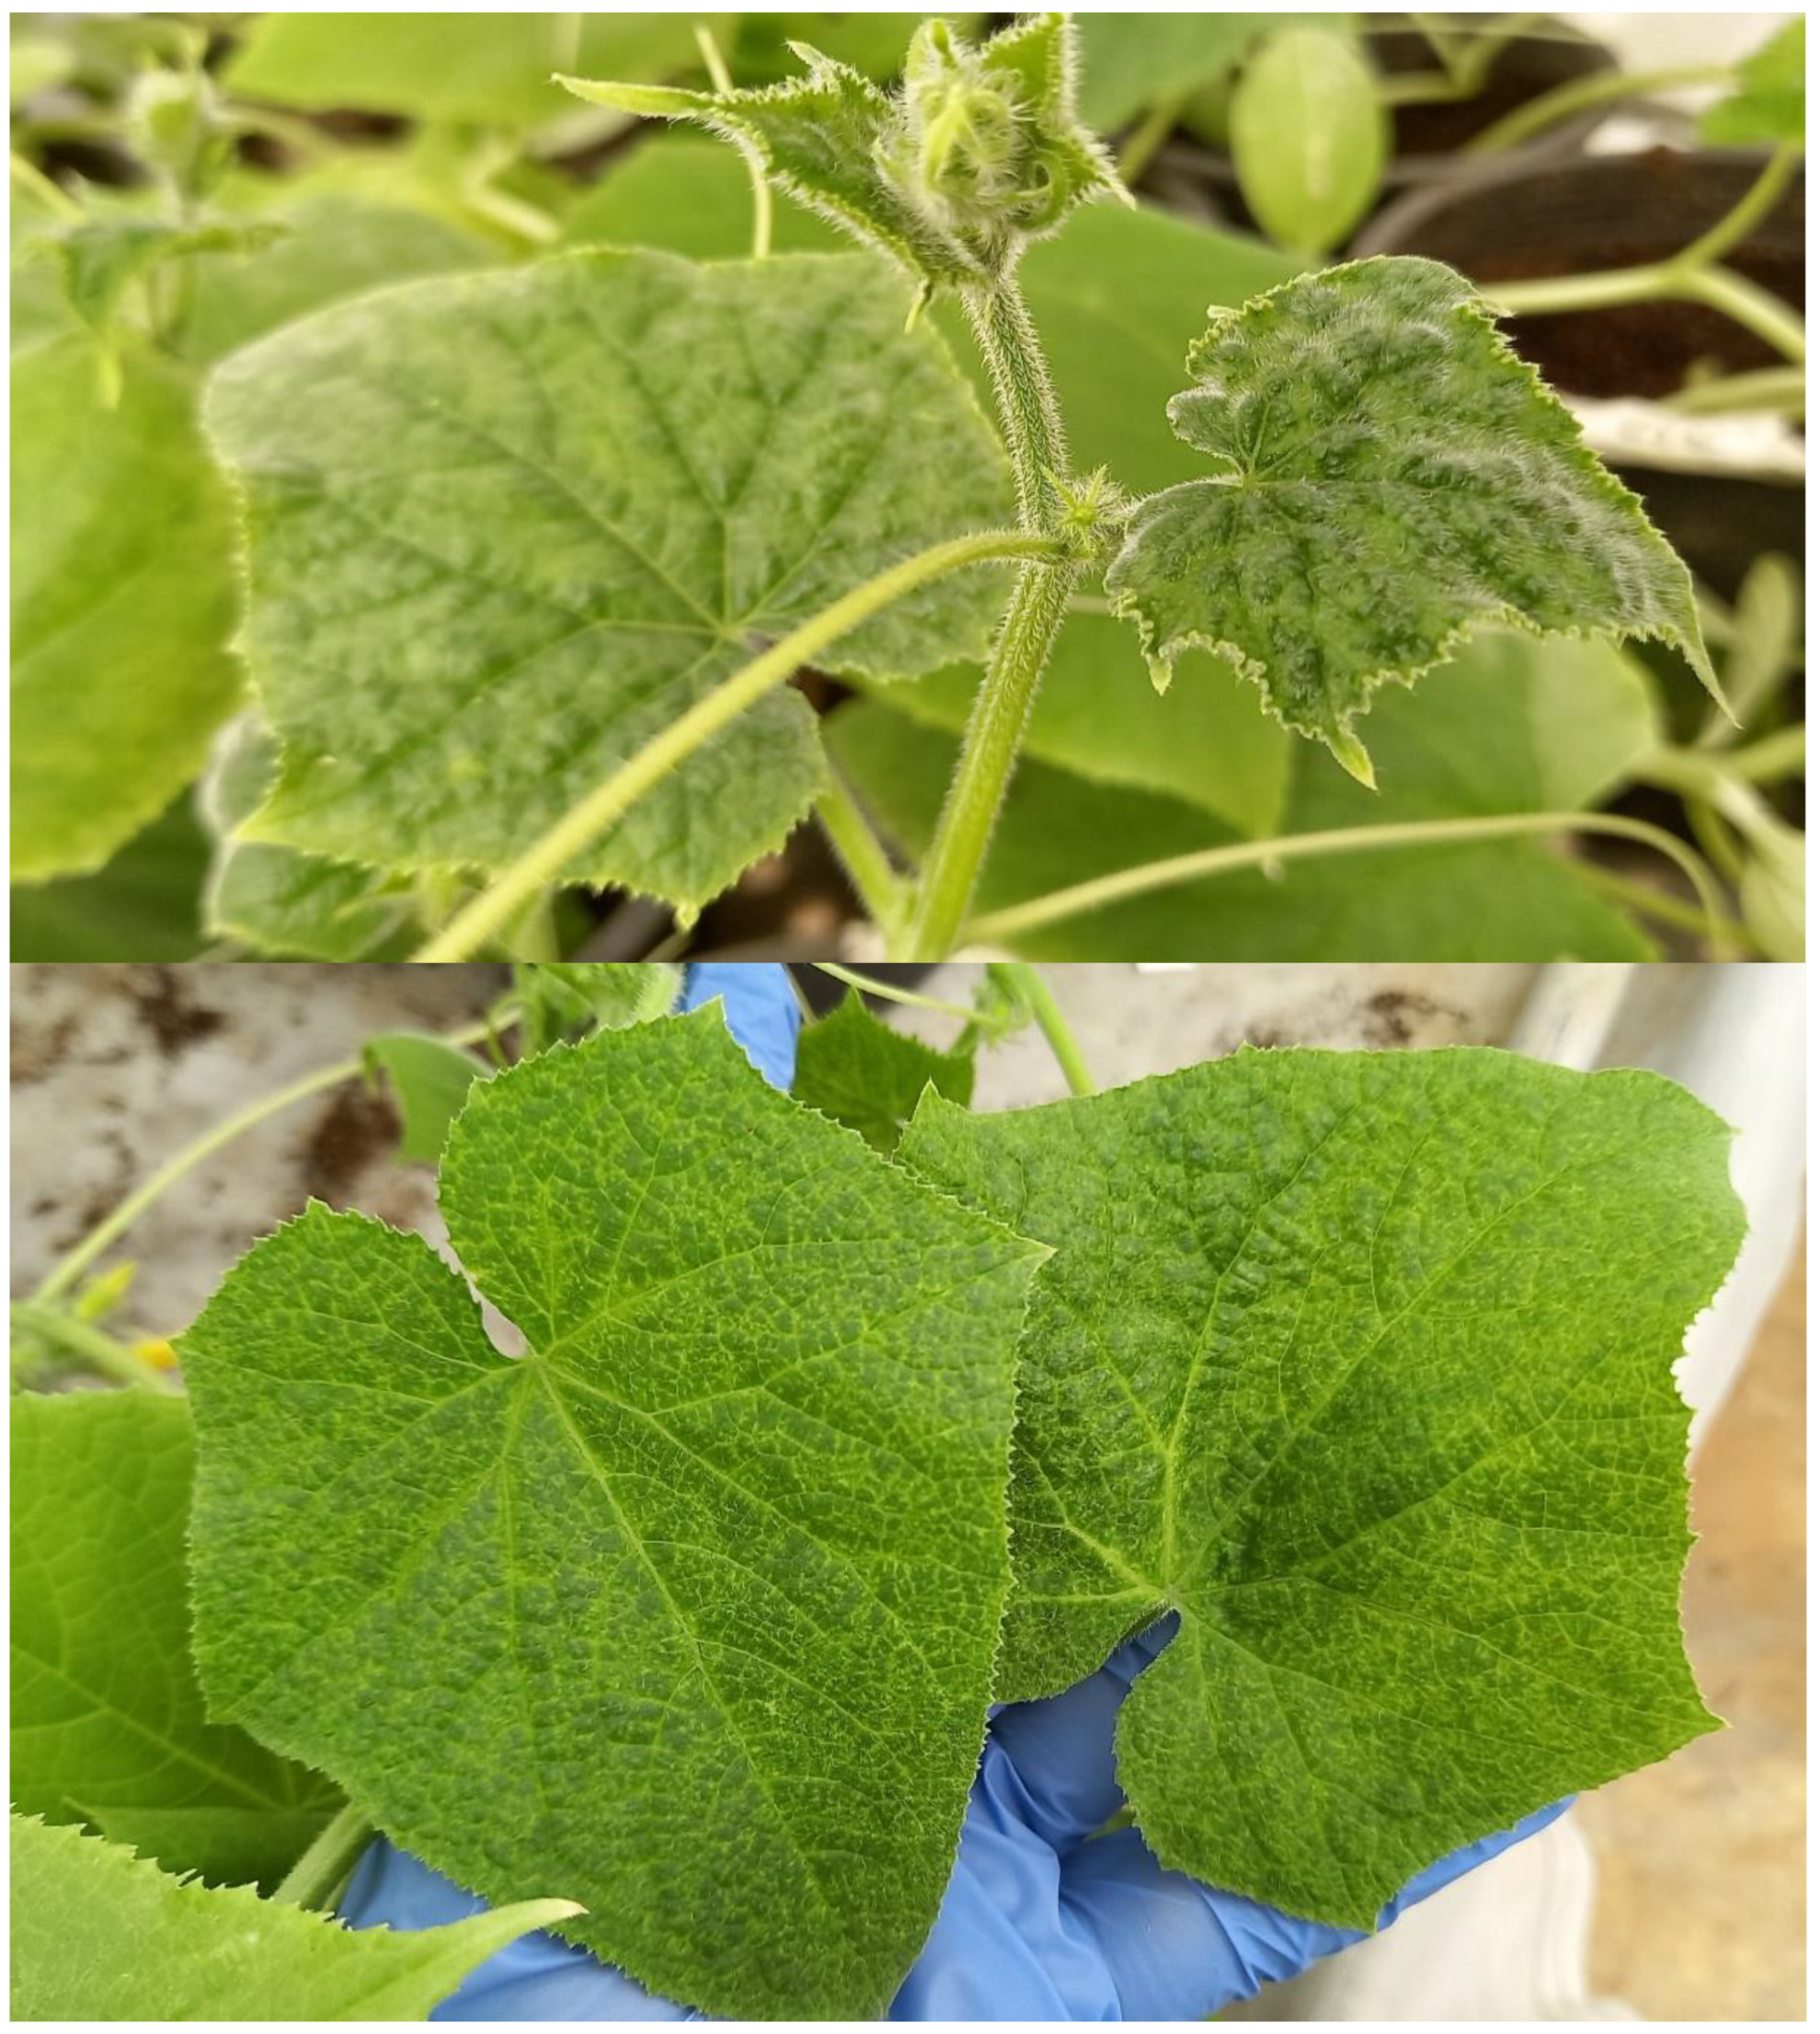
All CMV-inoculated cucumber plants (fungal-treated and non-fungal-treated) showed clear mosaic and blistering symptoms on leaves two weeks post-inoculation (Figure 2). However, the negative control plants which were not inoculated with CMV or fungal endophytes showed no virus symptoms. DAS-ELISA absorbance measurements at wavelength 405 nm for all CMV-inoculated plants ((positive control plants (non-fungal-treated), B. bassiana and M. anisopliae-treated plants)) showed that most plants tested CMV-positive at 3, 6, and 10 days post-inoculation (Dpi) of the virus. The positive control of ELISA set showed the highest absorbance measurement, while negative control plants (non-CMV inoculated) showed the lowest absorbance measurements. There was no significant difference in the absorbance measurements between non-fungal-, B. bassiana- and M. anisopliae-treated diseased plants at different Dpi 3, 6, and 10. Furthermore, there was no significant difference in the absorbance measurements between different Dpi of the same treatment (Table 2). In addition, CMV primers set from Bioreba, (powered by Qualiplant, France) were successfully used to identify CMV positive plants by amplifying the expected fragment size of 870 bp. PCR results of negative control plants showed no amplification. CMV-positive tested samples for each treatment were used for metabolome analysis.

3.3. Metabolomic Adjustments Triggered by B. bassiana and M. anisopliae in CMV-Infected Cucumber Plants

3.3.1. In Comparison with Non-Fungal-Treated Diseased Plants at Different Dpi

To acquire a full understanding of B. bassiana and M. anisopliae inoculated cucumber plants under CMV infection, a comprehensive untargeted metabolomic analysis was performed for all fungal-treated plants in comparison with positive control plants (non-fungal-treated) at 3, 6, and 10 days post-CMV inoculation (Dpi) by LC-MS method.
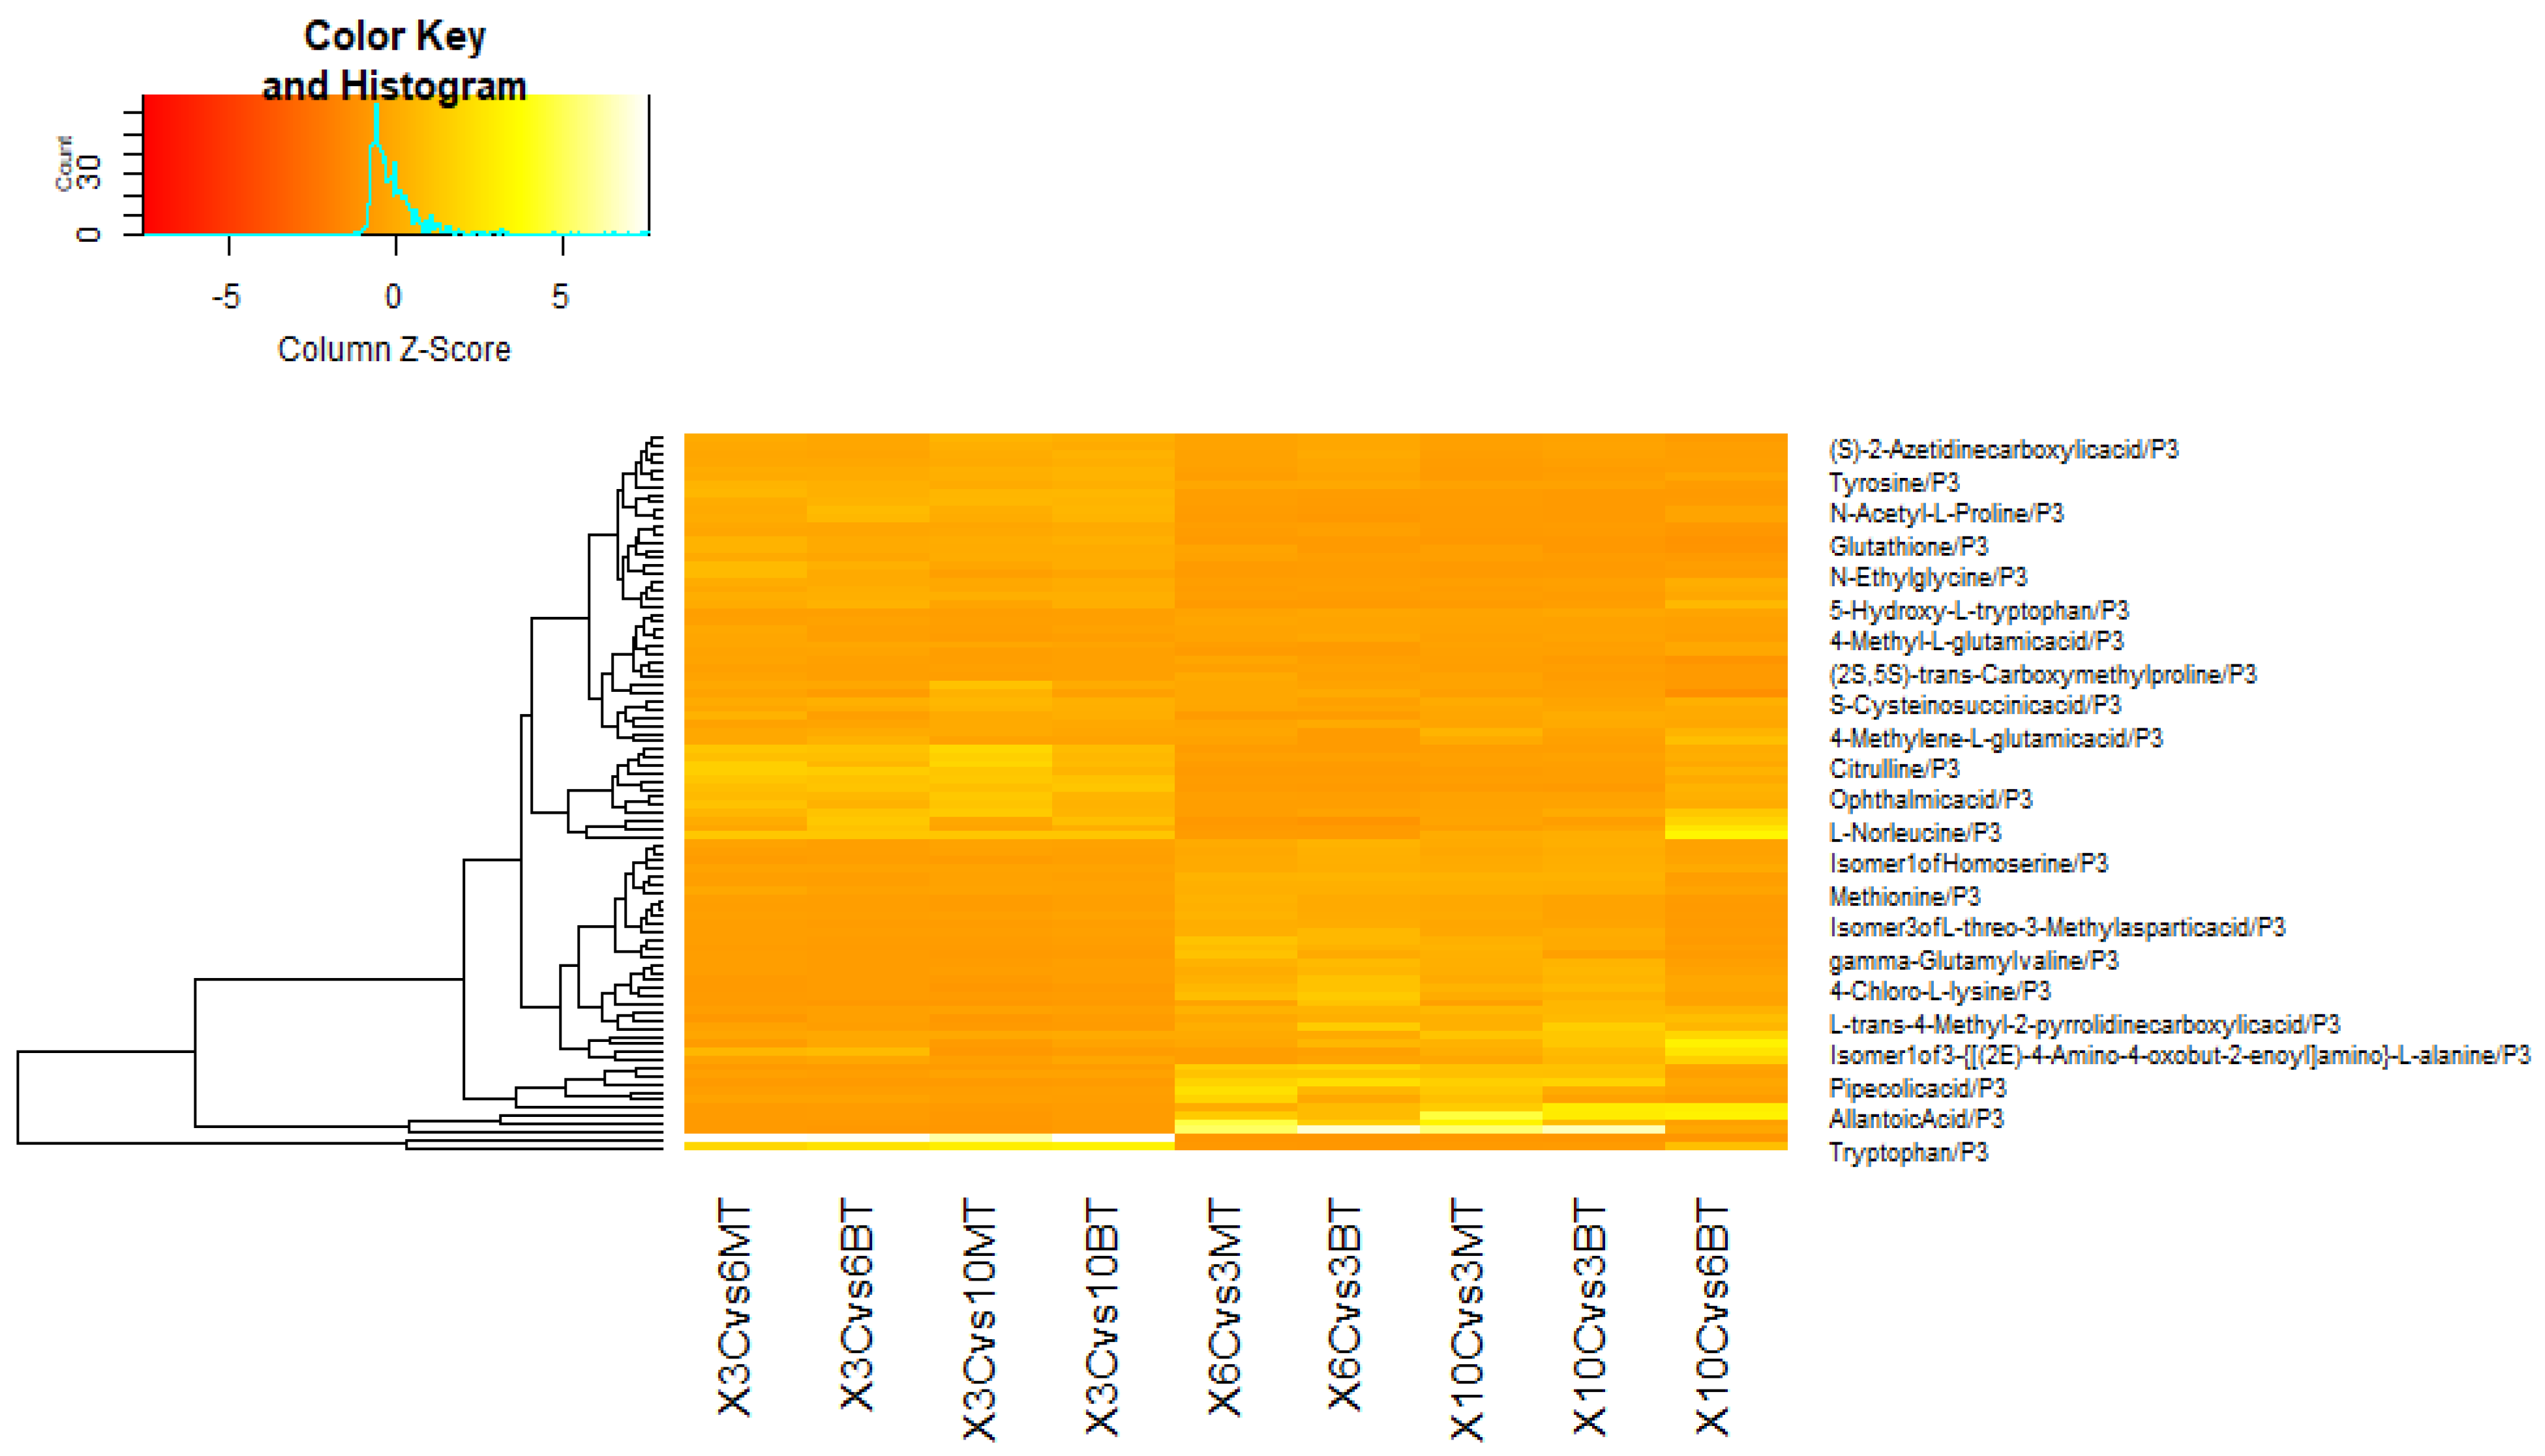
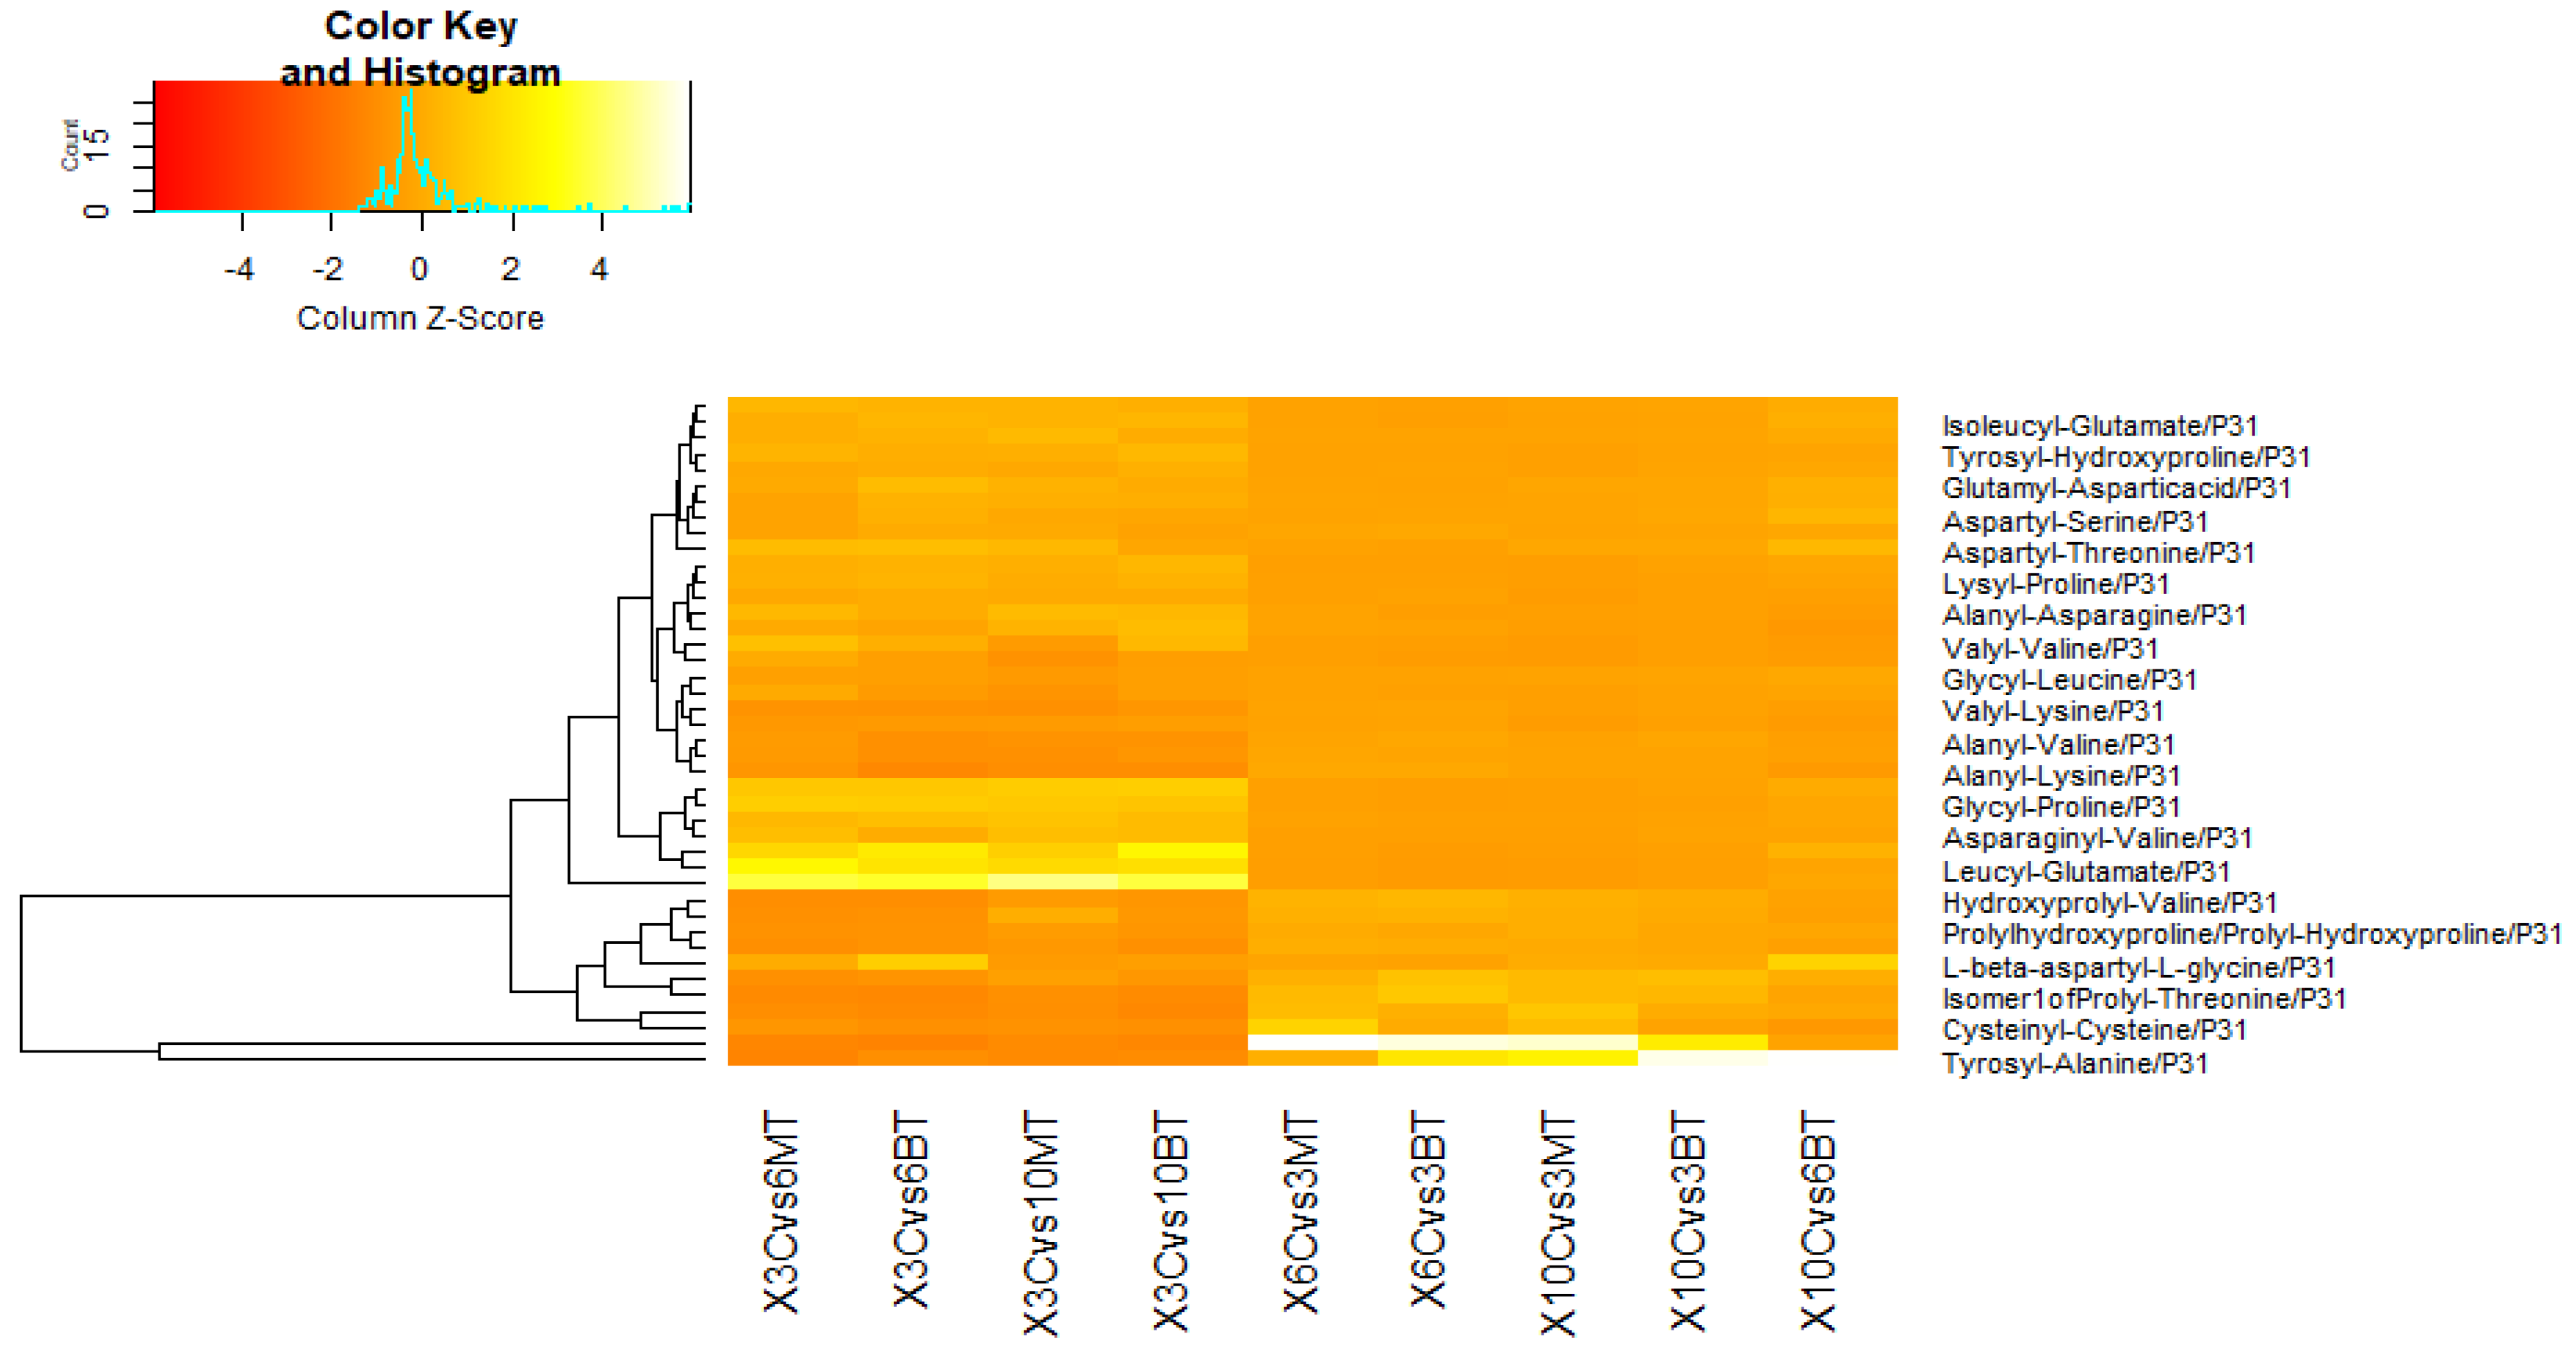
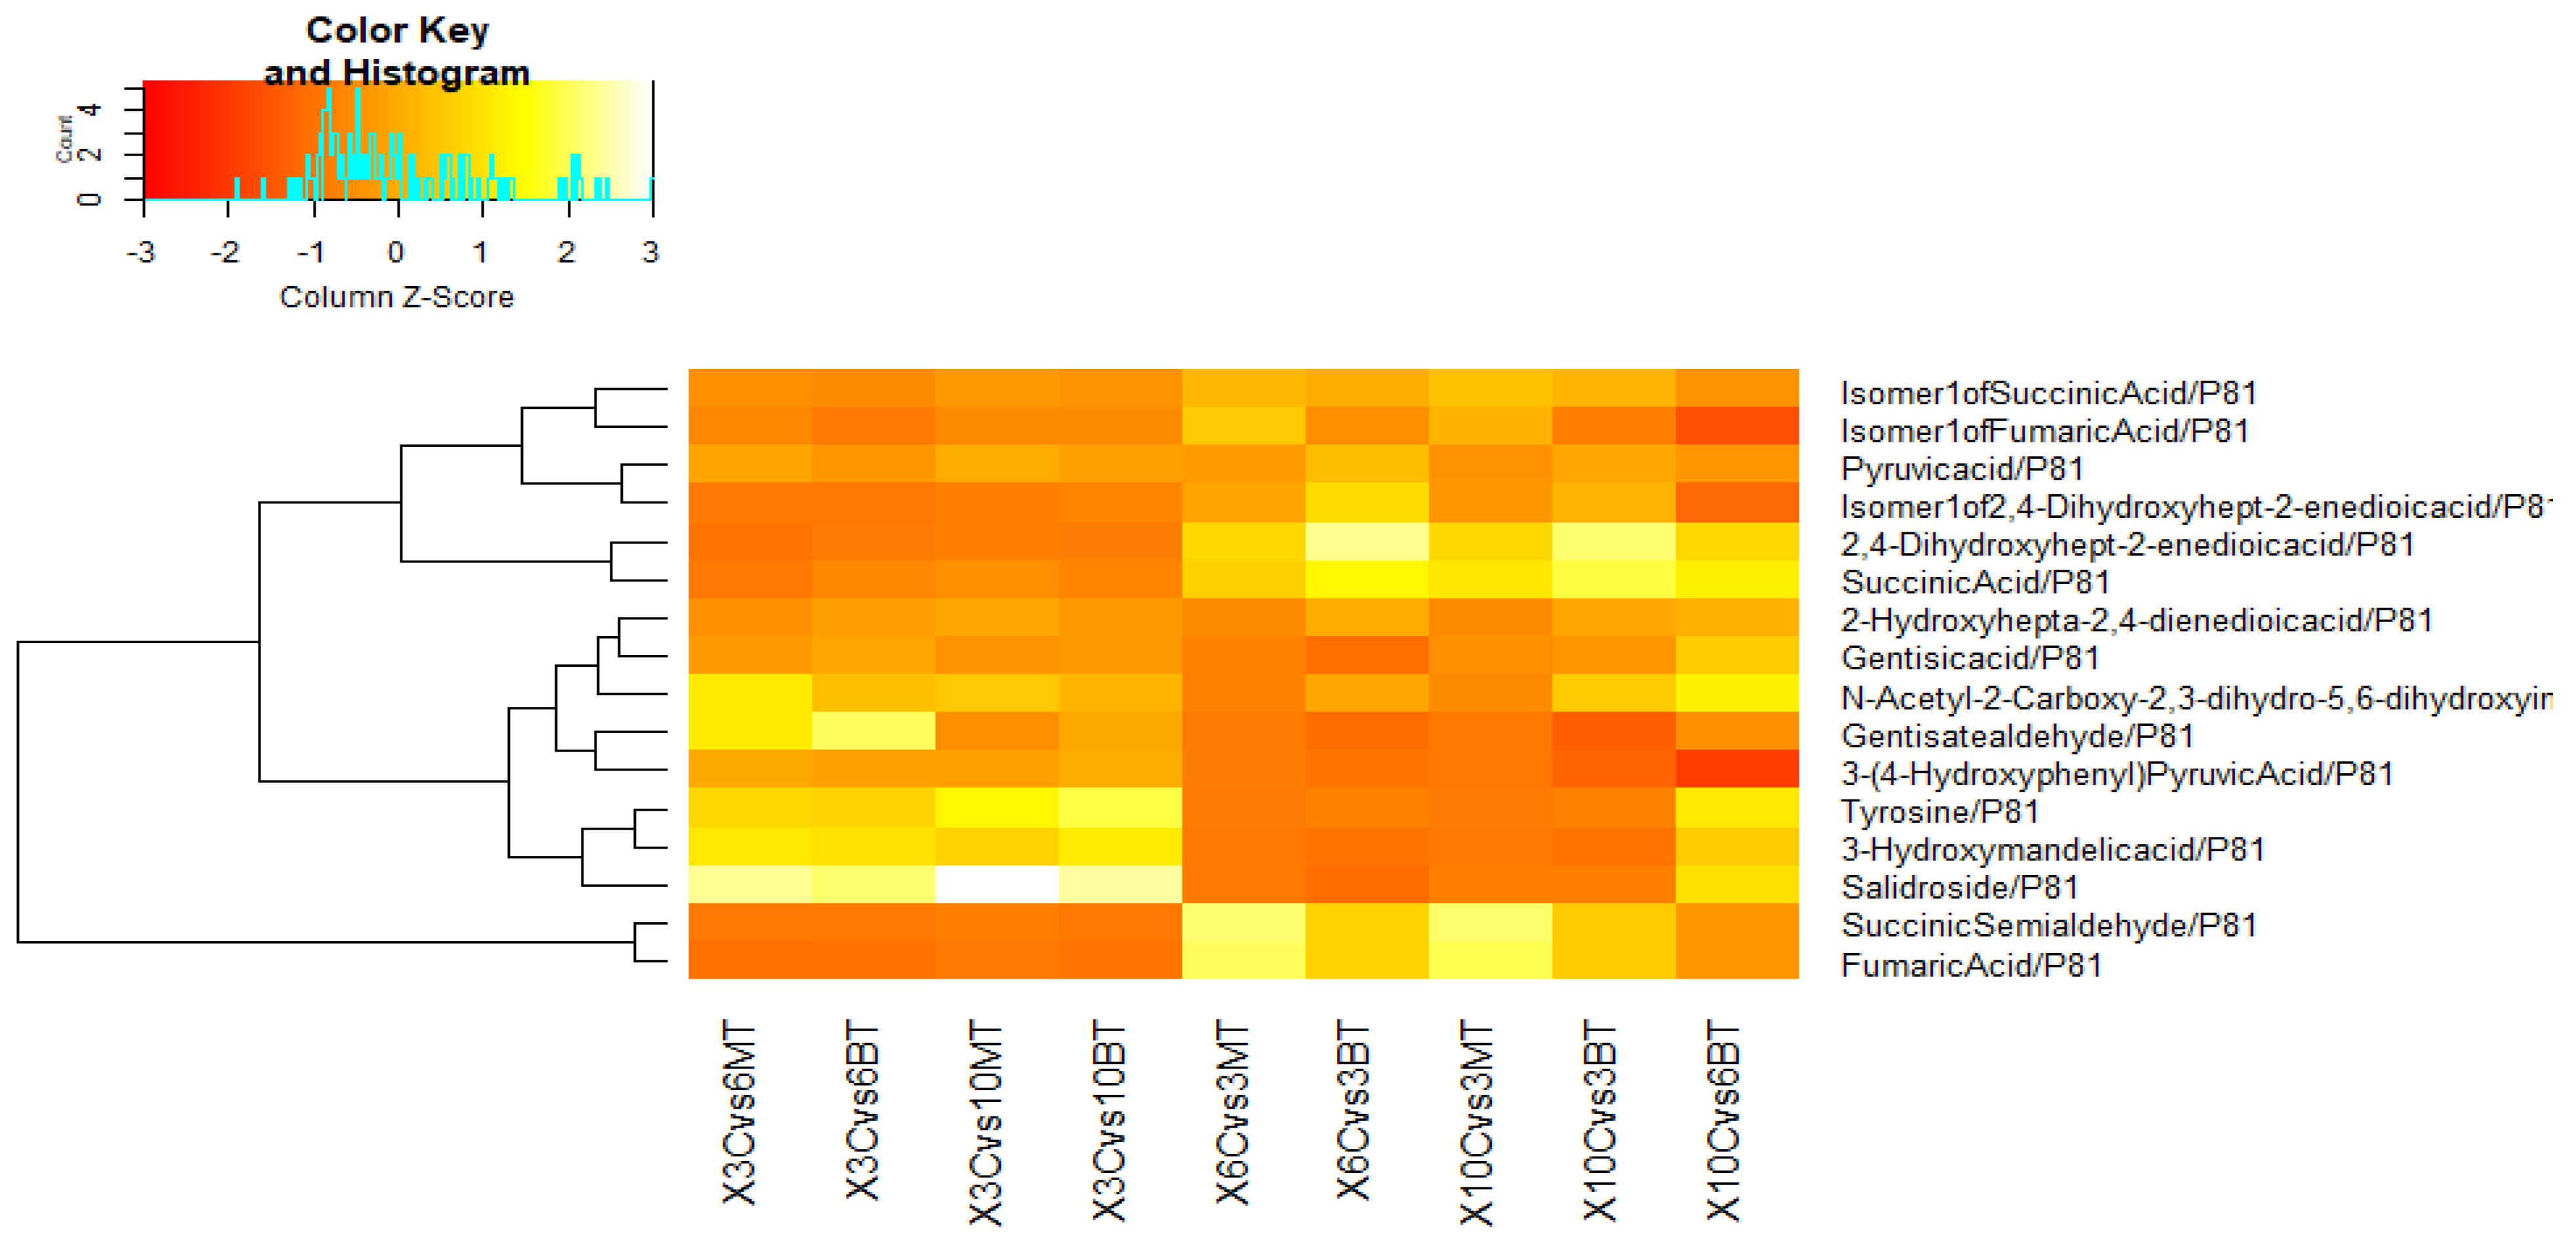
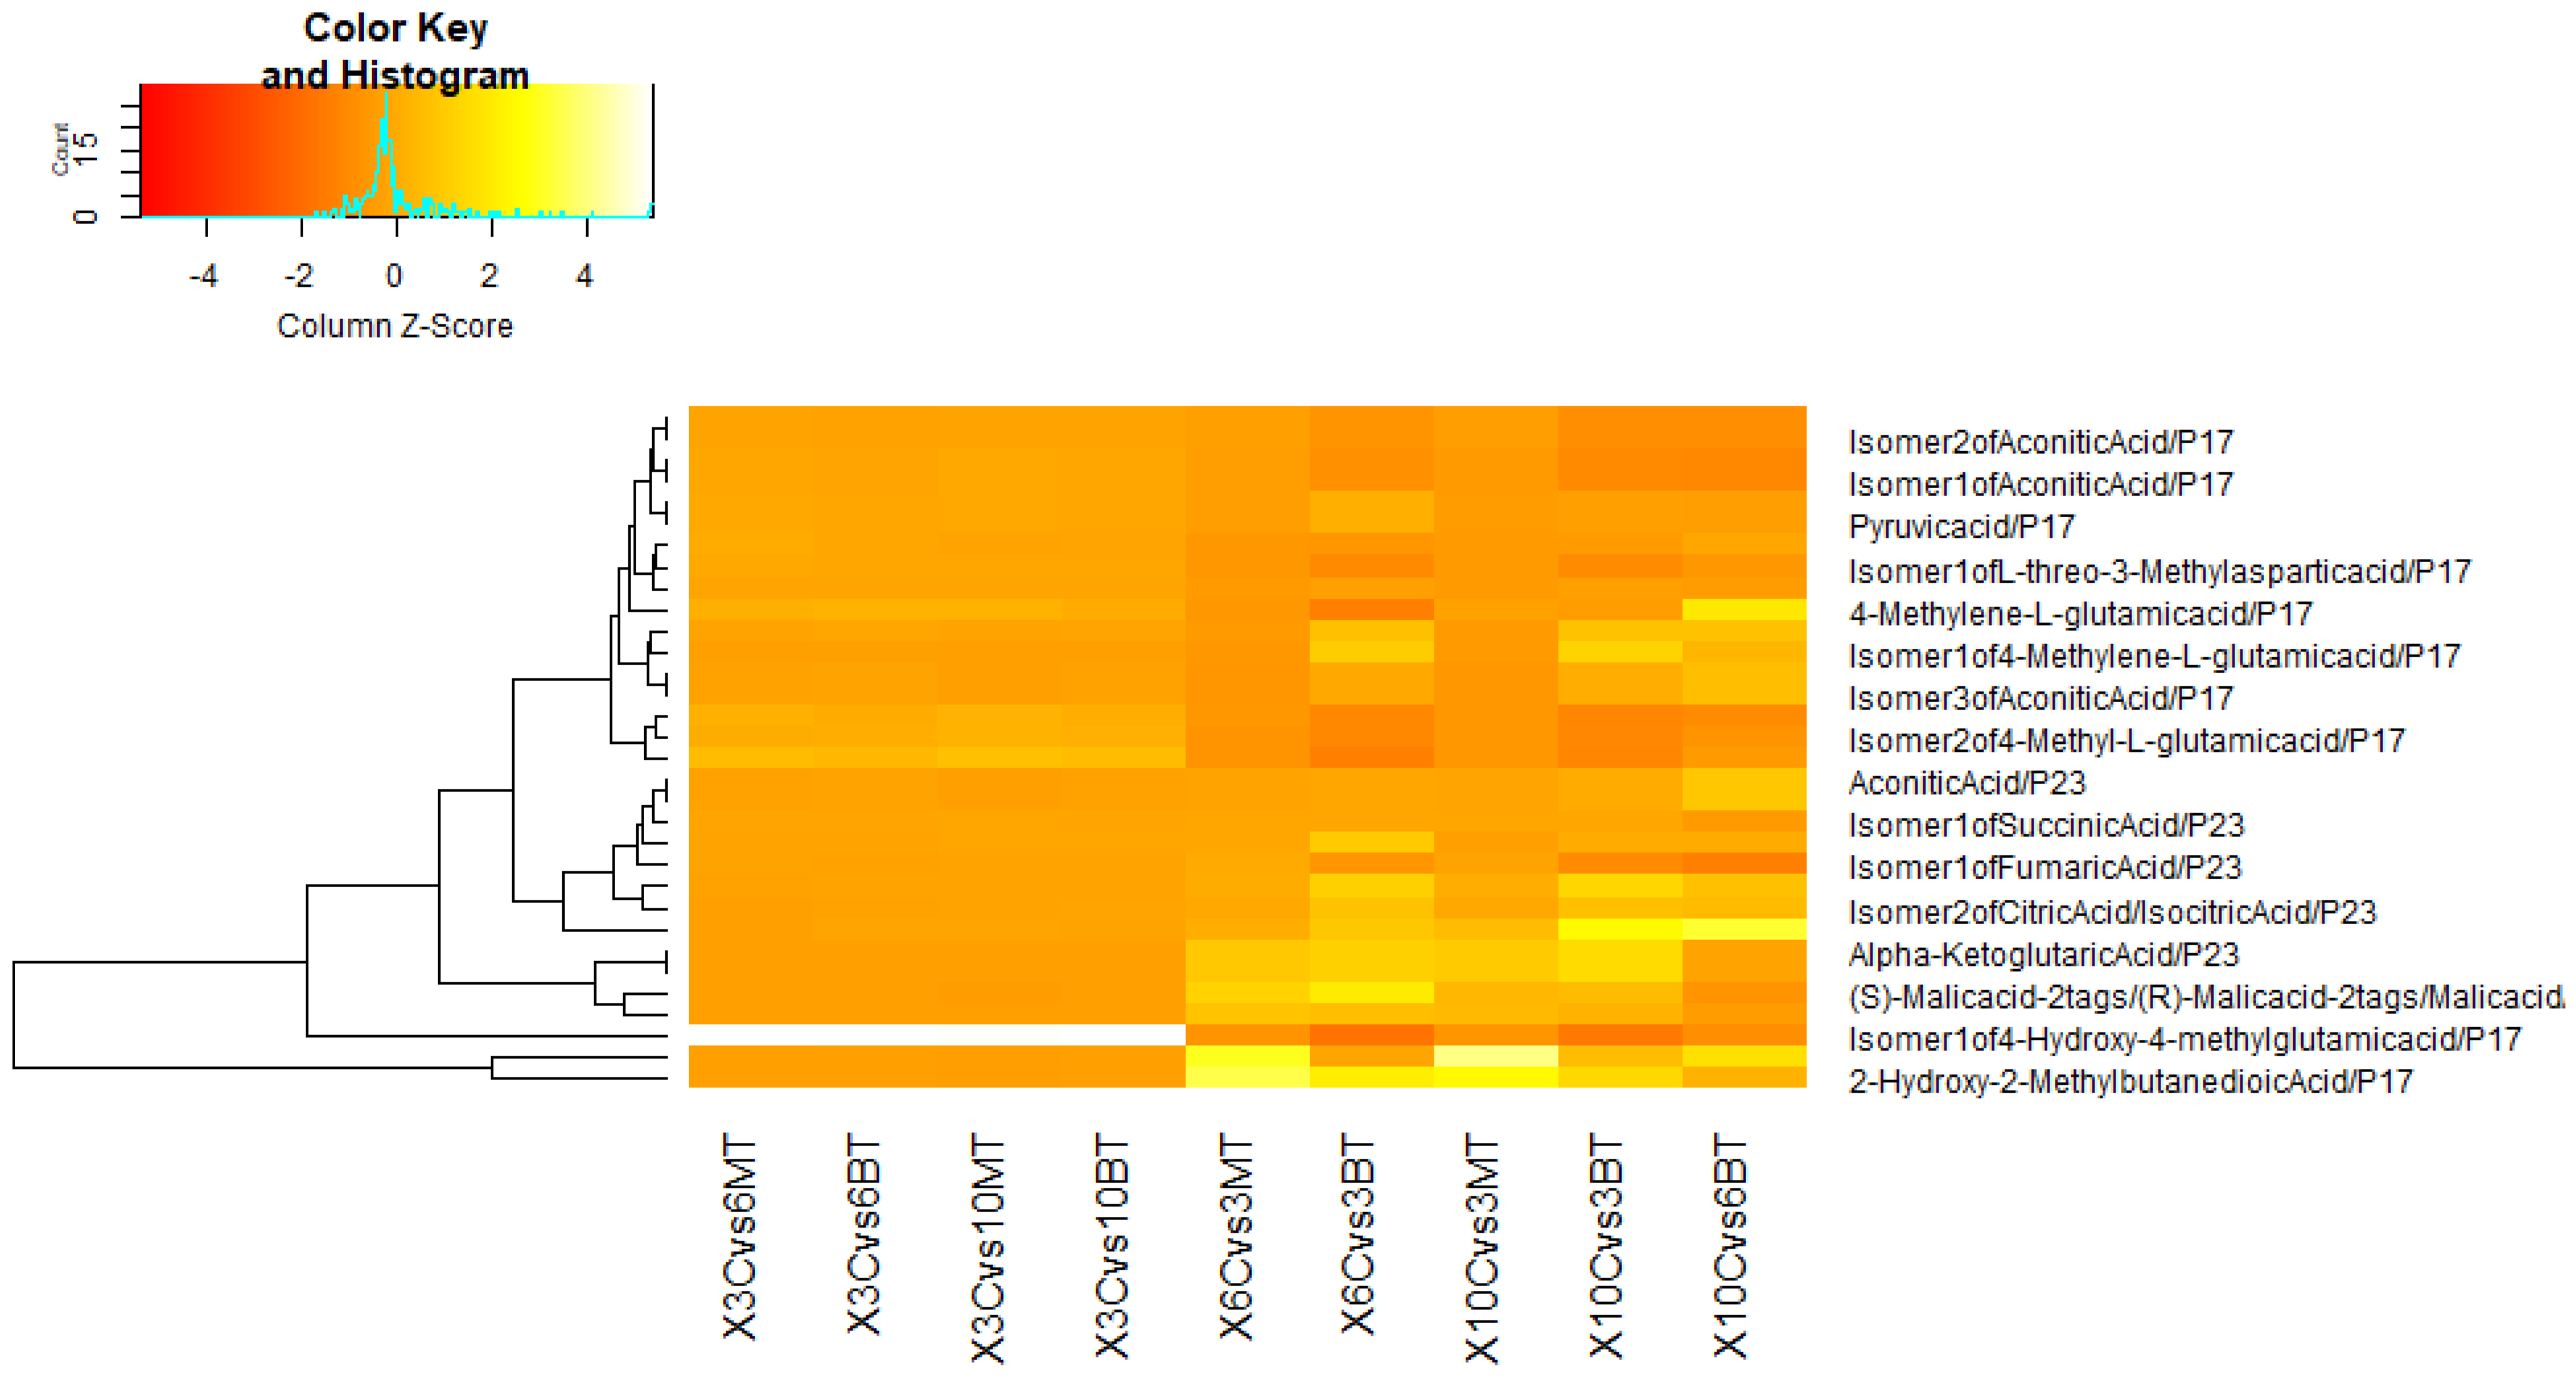
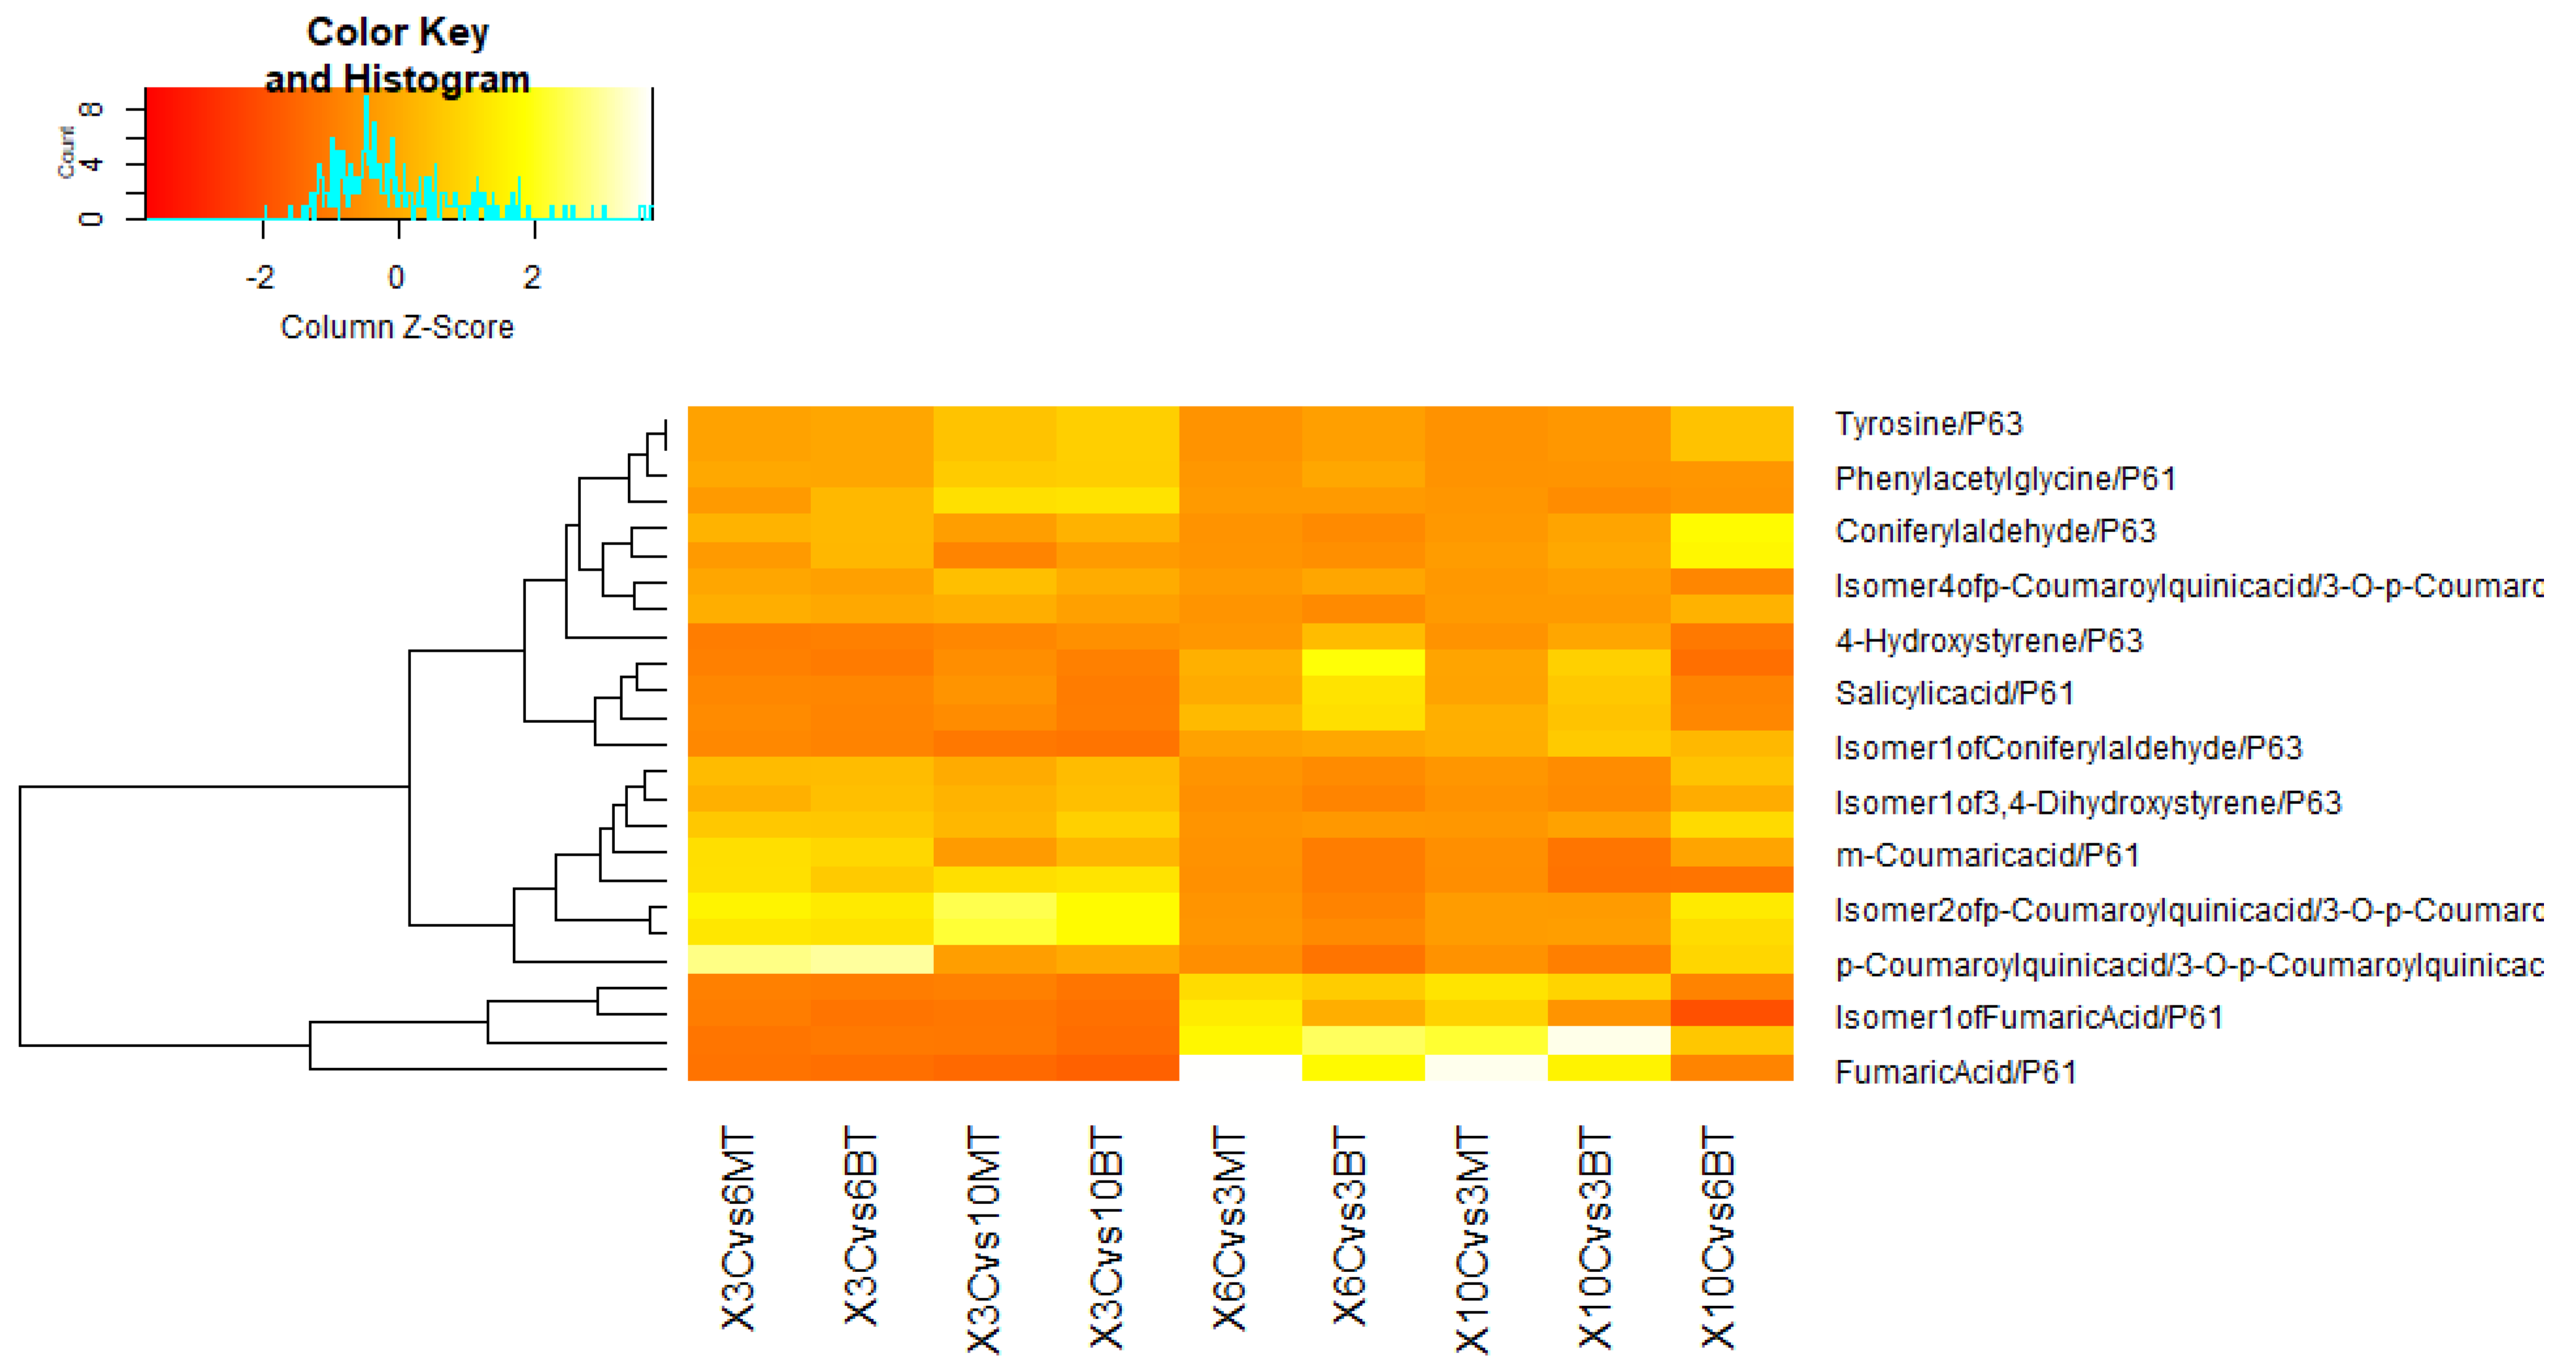
Metabolome analysis comparisons between non-fungal-treated and fungal-treated plants (all CMV inoculated) showed 631 metabolites that were differentially expressed. These metabolites were filtered under different pathways or functional categories such as amino acids and derivatives pathway, which has the highest number of differentially expressed metabolites between positive control and fungal-treated plants comparisons. In contrast, Betalain biosynthesis, Biotin metabolism, Caffeine metabolism, Chloroalkane and chloroalkene degradation, Cutin, suberine and wax biosynthesis, D-Alanine metabolism, D-Glutamine and D-glutamate metabolism, Fatty acid biosynthesis, Flavone and flavonol biosynthesis, Folate biosynthesis, Glycerophospholipid metabolism, Glycerolipid metabolism, Glycolysis/Gluconeogenesis, Indole alkaloid biosynthesis, Isoquinoline alkaloid biosynthesis, Limonene and pinene degradation, Neomycin, kanamycin and gentamicin biosynthesis, Nitrotoluene degradation, Pentose and glucuronate interconversions, Primary bile acid biosynthesis, Retinol metabolism, Short and Medium-Chain Fatty Acids, Taurine and hypotaurine metabolism, Terpenoid backbone biosynthesis, Vitamins and Derivatives, Xylene degradation, and Zeatin biosynthesis pathways have the lowest number of differentially expressed metabolites (one or two metabolites). Among the differentially expressed pathways are: Amino acids and derivatives (90 metabolites) (Figure 3), Dipeptides and tripeptides (42 metabolites) (Figure 4), Glycine, serine and threonine metabolism (21 metabolites) (Figure 5), Cysteine and methionine metabolism (17 metabolites) (Figure 5), Glyoxylate and dicarboxylate metabolism (21 metabolites) (Figure 6), Lysine degradation (13 metabolites) (Figure 6), Arginine and proline metabolism (18 metabolites) (Figure 7), Alanine, aspartate and glutamate metabolism (16 metabolites) (Figure 7), Tyrosine metabolism (16 metabolites) (Figure 8), C5-branched dibasic acid metabolism (18 metabolites) (Figure 9), Citrate cycle (14 metabolites) (Figure 9), Phenylpropanoid biosynthesis (13 metabolites) (Figure 10), and Phenylalanine metabolism (12 metabolites) (Figure 10). Some of these metabolites were significantly increased and others were significantly decreased, in which their expression differs between comparisons and treatments. Other differentially expressed pathways have a lesser number of detected metabolites, and they include: alpha-Linolenic acid metabolism, Aminobenzoate degradation, Arginine biosynthesis, Ascorbate and aldarate metabolism, Benzoate degradation, beta-Alanine metabolism, Biosynthesis of secondary metabolites, Biosynthesis of siderophore group nonribosomal peptides, Butanoate metabolism, Carbapenem biosynthesis, Carbon fixation in photosynthetic organisms, Chlorocyclohexane and chlorobenzene degradation, Cyanoamino acid metabolism, D-Arginine and D-ornithine metabolism, Dioxin degradation, Flavonoid biosynthesis, Glucosinolate biosynthesis, Glutathione metabolism, Histidine metabolism, Linoleic acid metabolism, Long-Chain Fatty Acids, Lysine biosynthesis, Lysine degradation, Methane metabolism, Monobactam biosynthesis, Naphthalene degradation, Nicotinate and nicotinamide metabolism, Novobiocin biosynthesis, Pantothenate and CoA biosynthesis, Pentose phosphate pathway, Phenylalanine, tyrosine, and tryptophan biosynthesis, Phosphonate and phosphinate metabolism, Porphyrin and chlorophyll metabolism, Propanoate metabolism, Purine metabolism, Pyrimidine metabolism, Pyruvate metabolism, Stilbenoid, diarylheptanoid, and gingerol biosynthesis, Sulfur metabolism, Thiamine metabolism, Toluene degradation, Tropane, piperidine, and pyridine alkaloid biosynthesis, Tryptophan metabolism, Ubiquinone and other terpenoid-quinone biosynthesis, Valine, leucine, and isoleucine degradation, Valine, leucine, and isoleucine biosynthesis, and Vitamin B6 metabolism.
The columns in the heatmaps (Figure 3, Figure 4, Figure 5, Figure 6, Figure 7, Figure 8, Figure 9 and Figure 10) indicate the comparisons between non-fungal-treated diseased cucumber plants (positive control (C)) versus fungal-treated diseased plants (MT: Metarhizium anisopliae treatment or BT: Beauveria bassiana treatment) at different days post-CMV inoculation Dpi: 3, 6, and 10 days and rows represent the expression of different metabolites of specific pathways. The colors of heatmap indicate scaled expression of metabolites in different comparisons. The color values ranging from red to yellow, while red color indicates down-regulation and yellow indicates up-regulation of metabolites. All metabolites presented in the heatmaps are summarized in Supplementary Materials Table S1.
The comparisons showing significant differences in metabolites expression are: Dpi 3_Control vs. Dpi 6_Metarhizium or Beauveria treatment, Dpi 3_Control vs. Dpi 10_ Metarhizium or Beauveria treatment, Dpi 6_Control vs. Dpi 3_ Metarhizium or Beauveria treatment, Dpi 10_Control vs. Dpi 3_ Metarhizium or Beauveria treatment, and Dpi 10_Control vs. Dpi 6_ Beauveria treatment. The significantly expressed metabolites (increase or decrease) are related to the positive control plants in comparison with the fungal-treated plants. Consequently, the down-regulated metabolites in positive control plants are the up-regulated metabolites in fungal-treated CMV-infected plants due to the effect of the entomopathogenic fungi and the opposite is true. However, the other comparisons (Dpi 6_Control vs. Dpi 10_ Metarhizium or Beauveria treatment, Dpi 10_Control vs. Dpi 6_Metarhizium treatment) showed no significant difference in metabolites expression; the number of metabolites that have not been significantly expressed in all these comparisons are 1272 (under all the above-mentioned pathways) with 157 metabolites are of unknown pathways.
Some of the significantly up-regulated metabolites in the cucumber plants inoculated with Metarhizium anisopliae and infected with CMV include; Isomer 1 of 4-Hydroxy-4-methyl glutamic acid, pipecolic acid, allantoic acid, iminoglycine, L-Hypoglycin, 2,4-Diaminobutyric acid, Gamma Glutamyl Valine, Tryptophan, isomer 1 of 4-Methylene-L-glutamic acid and N6-beta-Aspartyllysine (Amino acids and Derivatives—Figure 3); Hydroxy prolyl-Valine, Isomer 1 of prolyl-Alanine, Isomer 1 of prolyl-Threonine, Tyrosyl-Alanine, Methionyl-Alanine, Lysyl-Leucine and Tyrosyl-proline (Dipeptides and Tripeptides—Figure 4); N-acetyl glycine and Choline (glycine, serine, and threonine metabolism—Figure 5); S-Adenosyl homocysteine, 5′-methyl thioadenosine, Aspartatic acid and Isomer 1 of Homoserine (cysteine and methionine metabolism—Figure 5); Oxalic acid and succinic acid (glyoxylate and dicarboxylate metabolism—Figure 6); (S)-5-Amino-3-oxohexanoic acid and carnitine (Lysine degradation—Figure 6); Succinic semialdehyde, N-acetyl L-aspartic acid, Fumaric acid, Alpha-ketoglutaric acid, and Gamma-aminobutyric acid (alanine, aspartate, and glutamate metabolism—Figure 7); Proline, L-1-pyrroline 3-Hydroxy-5-carboxylic acid (Arginine and proline metabolism—Figure 7); 2,4-Dihydroxyhept-2-enedioic acid, Gentisic acid, and 3-Hydroxy mandelic acid (Tyrosine metabolism—Figure 8); Isomer 1 of 4-Methylene L-glutamic acid, 2-Hydroxy glutaric acid and 2-Hydroxy-2-Methylbutenedioic acid (C5- branched dibasic acid metabolism—Figure 9); Malic acid (Citrate Cycle—Figure 9); Phenyl pyruvic acid and m-coumaric acid (phenylalanine metabolism—Figure 10); p-coumaroyl quinic acid and Coniferyl aldehyde (phenylpropanoid biosynthesis—Figure 10).
On the other hand, the significantly up-regulated metabolites in the cucumber plants inoculated with Beauveria bassiana and infected with CMV feature all the above mentioned metabolites in addition to 4-carboxyphenyl glycine, Gamma-glutamyl valine, isomer 3 of L-threo-3-methyl aspartic acid, L-beta-Ethynylserine, L-Homocystine, Ornithine, Arginine, Betalamic acid, Citrulline, Glutathione, L-Dihydroanticapsin, L-Homophenylalanine, L-Norleucine, N-Acetyl-L-Arginine, N-Acetyl-L-Proline, Tabtoxin biosynthesis intermediate 4 (Amino acids and Derivatives—Figure 3); Prolyl-Hydroxy proline, Alanyl-Lysine, Cysteinyl-Cysteine, Prolyl-Lysine, Valyl-Lysine, Alanyl-Glutamic acid, Glycyl-proline, Valyl-Glutamate, Glutamyl methionine (Dipeptides and tripeptides—Figure 4); Glyceric acid (glycine, serine, and threonine metabolism—Figure 5); Isomer 1 of Glycolic acid (glyoxylate and dicarboxylate metabolism—Figure 6); 5-Amino pentanamide (Lysine degradation—Figure 6); isomer 2 of citric acid/Isocitric acid (alanine, aspartate and glutamate metabolism—Figure 7); 4-Aminobutyraldehyde and 4-Guanidinobutanal (Arginine and proline metabolism—Figure 7); Salidroside and Gentisate aldehyde (Tyrosine metabolism—Figure 8); Aconitic acid and isomer 1 of parapyruvic acid (C5-branched dibasic acid metabolism—Figure 9); Phenyl glyoxylic acid (phenylalanine metabolism—Figure 10); 4-Hydroxystyrene and trans-ferulic acid (phenylpropanoid biosynthesis—Figure 10).
The Venn diagram (Figure 11) represents the numbers of overlapping differentially expressed metabolites among comparisons (Dpi3-Control vs. Dpi6-Metarhizium, Dpi3-Control vs. Dpi6-Beauveria, Dpi3-Control vs. Dpi10-Metarhizium, Dpi3-Control vs. Dpi10-Beauveria). Additionally, it shows the numbers of differentially expressed metabolites which are specific for each of these comparisons. For example, the numbers of differentially expressed metabolites which are not overlapped with other studied comparisons and specific for comparisons 3C vs. 6M and 3C vs. 6B are 11 and 32 metabolites, respectively. The specific metabolites for 3C vs. 6M comparison include 2-Oxoglutaramic acid, Valyl-Hydroxyproline, Phenylpyruvic acid, and many others. However, some of the 32 metabolites specific for 3C vs. 6B comparison are Glyceric acid, 3-O-p-Coumaroylquinic acid, Pyroglutamic acid, Homoserine, Methionine Sulfoxide, Vitexin, and D-Lysopine. The other overlapped and non-overlapped metabolites among comparisons in the Venn diagram are present in Supplementary Materials Table S2.

3.3.2. In Comparison with Same Fungal-Treated Diseased Plants at Different Dpi

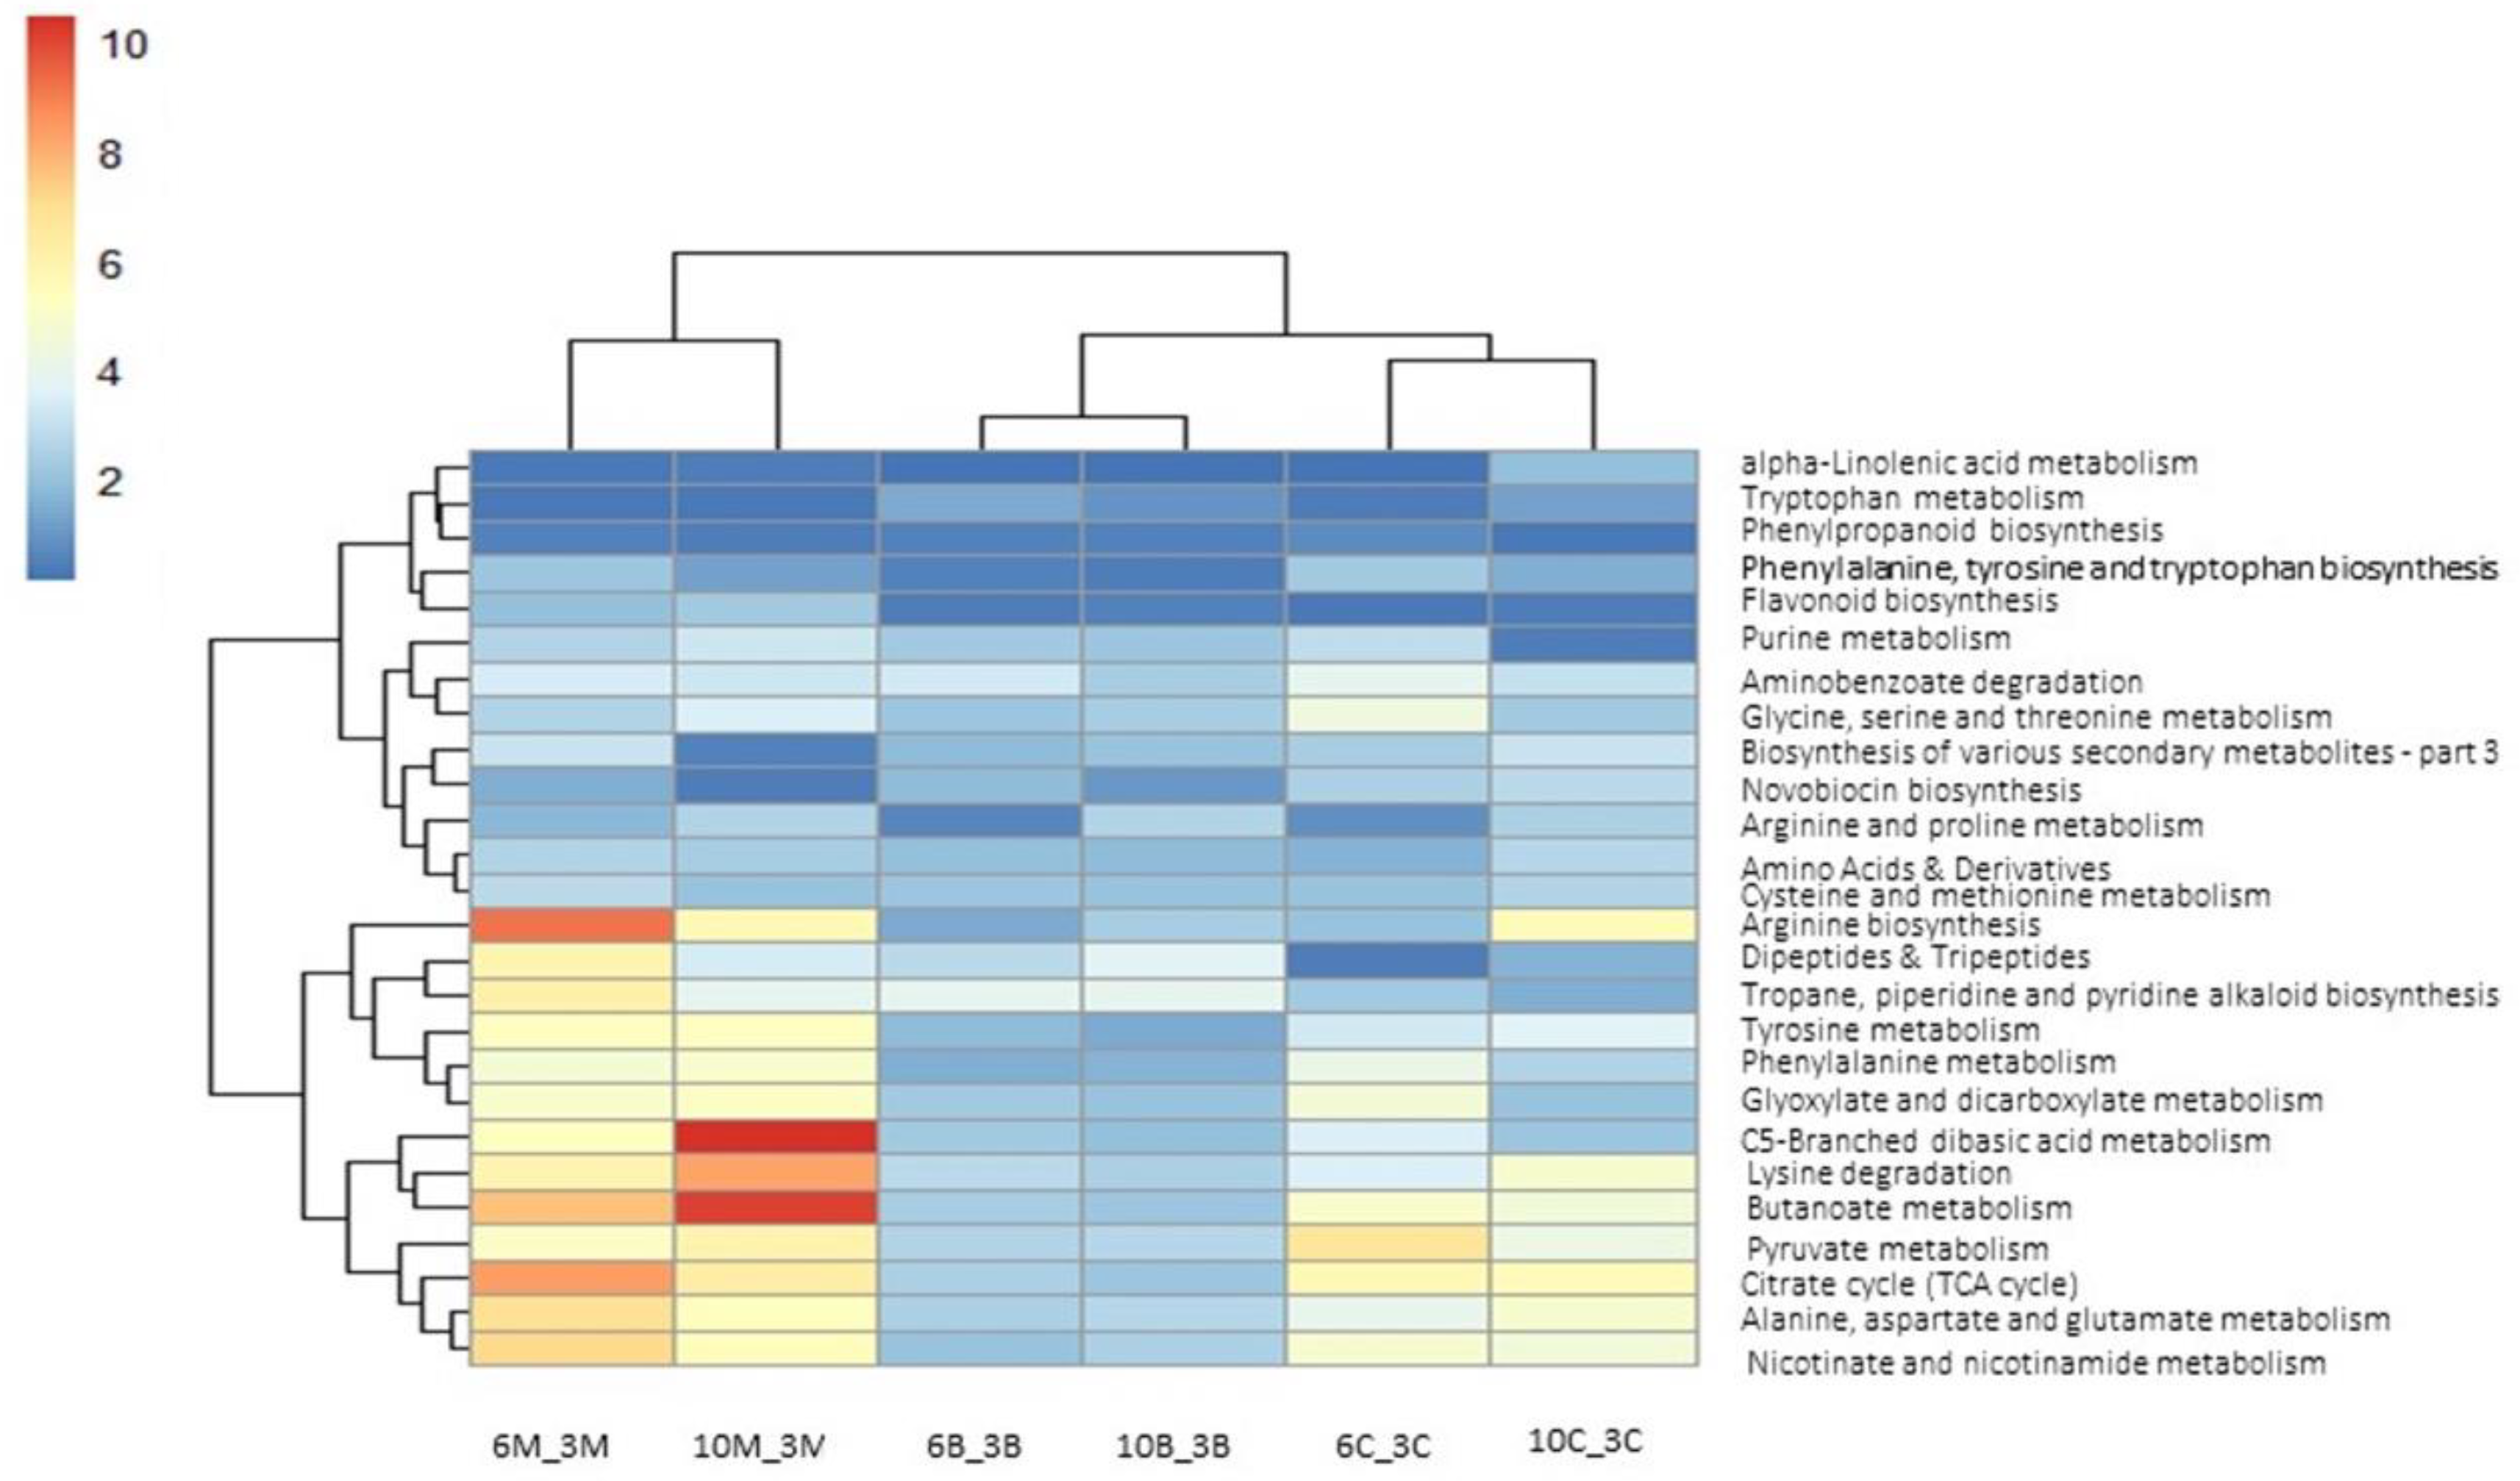
Metabolomic analysis comparison was also performed between same fungal-treated diseased cucumber plants, but at different Dpi, in order to study the change in metabolite profile with the increase of time post-inoculation of CMV virus under the effect of fungal endophytes treatment. In addition, metabolomic analysis comparison was done between non-fungal-treated diseased cucumber plants (positive control plants) at different Dpi. The heatmap in Figure 12 illustrates the significantly expressed plant metabolic pathways (y-axis) among the mentioned comparisons (x-axis) (Dpi10 Metrahizium vs. Dpi3 Metrahizium, Dpi6 Metrahizium vs. Dpi3 Metrahizium, Dpi6 Beauveria vs. Dpi3 Beauveria, Dpi10 Beauveria vs. Dpi3 Beauveria, Dpi10 Control vs. Dpi3 Control, Dpi6 Control vs. Dpi3 Control). The difference in thecolors between columns in the heatmap reveals the difference in the expression of metabolic pathways between the comparisons. The color scale ranges from dark blue to dark red with the increase in fold change value. So, the darker the red color means more of an increase in metabolic pathway expression. Whereas, the darker the blue color means more of a decrease in metabolic pathway expression.

3.4. Metabolomic Adjustments Triggered by CMV in Cucumber Plants

Metabolomics analysis was achieved for positive control plants (CMV-infected) in comparison with negative control plants (non-CMV-infected) to study the effect of CMV infection on the metabolite profile of cucumber plants. The number of non-significantly expressed metabolites in CMV-infected plants is 1021, while 251 metabolites were significantly expressed, including 67 metabolites of significant increase (22 metabolites of them are of unknown pathways) and 184 metabolites of significant decrease (14 metabolites of them are of unknown pathways). The significantly decreased metabolites in positive control plants due to CMV infection include Alpha-ketoglutaric acid, Aspartatic acid, fumaric acid, isomer 3 of Citric acid/isocitric acid, N-acetyl-L-aspartic acid, succinic acid, succinic semialdehyde (alanine, aspartate, and glutamate metabolism); 4-carboxyphenyl glycine, 4-methyl-L-glutamic acid, Allantoic acid, Gamma-glutamylleucine, gamma-glutamylvaline, Iminoglycine, Isomer1 of Homoserine, isomer1 of L-threo-3-methyl-aspartic acid, L-beta-Ethynylserine, L-Histidine, L-Hypoglycin A, N-Acetyl-glycine, Ornithine, pipecolic acid, proline, pyroglutamic acid, S-Adenosyl homocysteine (Amino acids and Derivatives); Pyrrole-2-carboxylic acid, isomer1 of sarcosine and 4-Aminobutyraldehyde (Arginine and proline metabolism); 2-Hydroxy-2-Methylbutenedioic acid, 4-Methyl-L-glutamic acid and isomer 1 of Mesaconic acid (C5- branched dibasic acid metabolism); Malic acid (Citrate Cycle); 3-Mercaptolactic acid and 5′-Methyl thioadenosine (cysteine and methionine metabolism); Alanyl-Lysine, alanyl-Valine, isomer2 of Alanyl-Leucine, Prolyl-Lysine (dipeptides and tripeptides); Choline (glycine, serine and threonine metabolism); Oxalic acid (glyoxylate and dicarboxylate metabolism); 2,4-Dihydroxyhept-2-enedioic acid (Tyrosine metabolism) (Supplementary Materials Table S3). On the other hand, the significantly increased metabolites in positive control plants due to CMV infection involve; 5-Methoxytryptophan, Citrulline, Epsilon-(gamma-Glutamyl)-lysine, gamma-Glutamylhistidine and Tabtoxin biosynthesis intermediate 4 (Amino acids and Derivatives); Isomer 1 of 4-Hydroxy-4-methylglutamic acid (C5- branched dibasic acid metabolism); Alanyl-Glutamic acid, Glycyl-Proline and Isoleucyl-Glutamate (Dipeptides and tripeptides); Isomer 1 of Glycolic Acid (glyoxylate and dicarboxylate metabolism); m-Coumaric acid (phenylalanine metabolism); p-Coumaroyl quinic acid/3-O-p-Coumaroylquinic acid and cis-beta-D-Glucosyl-2-hydroxycinnamic acid/trans-beta-D-Glucosyl-2-hydroxycinnamic acid (phenylpropanoid biosynthesis) (Supplementary Materials Table S3).

4. Discussion

CMV is one of the most destructive cucumber diseases, causing significant crop losses. CMV has no specific target pesticide, and its control depends on the eradication of its vectors using synthetic chemical insecticides. However, nowadays, biological control strategies are of high interest to scientists because of their health and environmental benefits when compared to chemical products. The entomopathogenic endophytes are now mostly studied as biological control agents and their mechanism of disease control needs in-depth exploration. The endophytes compete with the phytopathogen for nutrients and niches, and they also produce substances that may disrupt the pathogen’s quorum-sensing signaling [40,41]. Further, systemic resistance in host against pathogen is induced through the change of metabolite profile triggered by endophytes [42]. Metabolomics is different from transcriptomics and genomics, and it tells what is happening within organisms. It links genome to phenome and aids in a broad understanding of the chemical changes in the host plant [43]. In the current study, it was employed to gain insight into mechanisms involved in defense against CMV in endophytic B. bassiana- and M. anisopliae-treated diseased cucumber plants. A scheme illustrating this interaction between the host, fungi, and virus is shown in Figure 13.
Using LC-MS, we compared the metabolic profile of diseased cucumber plants fungal and non-fungal-treated with endophytes. Before metabolomics analysis, the used entomopathogenic fungi were assessed for their endophytic presence in cucumber tissues. The results of endophyte re-isolation tests are consistent with our previous data [31], where these entomopathogenic fungi were isolated from all plant parts of cucumber seedlings grown in sterile substrate.
Endophytes can influence the production of specific metabolites [10], as evidenced by the fluctuating concentrations found in this study; this could be related to endophytic fungi’s influencing mechanisms. The primary metabolism plays a major role in plant priming events by providing initiation energy and production of various vital compounds. Among others, amino acids are chief primary metabolites directly involved in plant immune responses [44,45]. Our data indicated an increased level of various amino acids, as these are building blocks of several essential secondary metabolites such as polyamines, tyramine, alkaloids, and phenylpropanoids. Amino acids presence in endophyte-treated diseased cucumber plants after infection with CMV could reveal more insights about the role of amino acids in cucumber defense response against the virus. Similarly, the treatment of citrus with the endophyte Bacillus subtilis L1–21 has triggered the up-regulation of amino acids levels in endophyte-treated citrus after infection with the bacteria Candidatus Liberibacter asiaticus (Clas) [42].
Accumulation of organic compounds plays an important role in biotic and abiotic stresses plant defense [46]. Both entomopathogenic fungi in this study triggers the production of organic acids, particularly Fumaric acid, Alpha-ketoglutaric acid, Gamma-aminobutyric acid, allantoic acid, 2,4-Diaminobutyric acid, L-1-pyrroline 3-Hydroxy-5-carboxylic acid, 2-Hydroxy glutaric acid, Malic acid, Aspartatic acid, Oxalic acid, succinic acid, Gentisic acid, and others. On the other hand, Beauveria bassiana, in addition to the above-mentioned organic acids, shows a higher abundance of citric acid, Isocitric acid, Betalamic acid, Aconitic acid, isomer 1 of parapyruvic acid, Glyceric acid, and Glycolic acid. A similar study [14] showed that B. bassiana inoculated maize plants under the attack of Asian corn borer (Ostrinia furnacalis), caused adjustments in organic acids metabolites such as succinic acid in comparison with no inoculation plants. Organic acids within cucumber plants were also higher in quantity and concentration in endophytic bacteria-applied plants [47].
The present metabolomics analysis revealed up-regulation of metabolites within the phenylpropanoid pathway such as p-coumaroyl quinic acid, Coniferyl aldehyde, 4-Hydroxystyrene and trans-ferulic acid, triggered by endophytic presence in infected cucumber plants. Bajaj et al. [48] reported similar results, in which the root endophytic fungus Piriformospora indica induces altered phenylpropanoid and secondary metabolism in colonized soybean roots. The accumulation of metabolites belonging to organic compounds and phenylpropanoids can be a common mechanism in plant adaptation to different stresses [14]. In addition, after treatment with the pathogen Verticillium dahliae, the defense response of cotton plants pre-inoculated with the biocontrol fungus Chaetomium globosum CEF-082 was strengthened through the differentially expressed genes (DEGs) of phenylpropanoid biosynthesis pathway [49].
Tryptophan, indole acetic acid (IAA) precursor, concentration was higher in fungal-treated plants, and this may correspond to the axenic IAA production by the isolates. This supports previous data of the ability of the entomopathogenic fungi to enhance cucumber plant growth [4]. Glutathione concentration was higher in B. bassiana-treated plants, which indicates the effect of B. bassiana in activating plant defense and the development of resistance [50]. The metabolite 5′-Methylthioadenosine (MTA) is produced as a by-product in ethylene, nicotianamine, and polyamine biosynthesis [51]. Its concentration was increased in fungal-treated plants. This may indicate that both entomopathogenic fungi can trigger ethylene hormone production, which is involved in many physiological processes, including plant growth, development, and senescence, and plays a pivotal role in plant response or adaptation under biotic and abiotic stress conditions. Moreover, it was noticed that the abundance of pipecolic acid was increased in endophyte-treated plants, in which pipecolic acid is one of the critical signaling molecules in regulating plant resistance under stress conditions [52]. Oxalic acid was elevated in plants inoculated with fungal endophytes. This metabolite is thought to play major roles in calcium regulation, ionic balance, heavy metal detoxification, and in plant defense against herbivores [53,54,55].
The Venn diagram gives a clear image about the number of overlapping and non-overlapping differentially expressed metabolites among the comparisons between CMV diseased non-fungal-treated Control plants and CMV diseased fungal-treated plants (B. bassiana or M. anisopliae treatment) at different Dpi. Thirty-three metabolites are overlapped among all comparisons mentioned (Dpi3-Control vs. Dpi6-Metarhizium, Dpi3-Control vs. Dpi6-Beauveria, Dpi3-Control vs. Dpi10-Metarhizium, Dpi3-Control vs. Dpi10-Beauveria). This shows that this number of metabolites is expressed under the effect of either Beauveria or Metarhizium treatment with no effect of days post-inoculation of the virus (CMV). Additionally, the Venn diagram shows that Beauveria treatment triggers the expression of a greater number of metabolites than Metarhizium treatment in virus-diseased cucumber plants. However, what concerns more is the number of non-overlapped metabolites for each treatment at specific Dpi. The number of metabolites triggered by both entomopathogenic fungi at Dpi 10 was higher than those expressed at Dpi 6. These specific metabolites for each treatment can be used in functional genomics analysis in order to study the role of entomopathogenic fungi in biological control against CMV virus.
The heat map in Figure 12 shows that both entomopathogenic fungi triggers a different change in metabolite profile of cucumber plants with the increase in days post-inoculation of the virus. This difference might be due to the increase of virus infection and proliferation in diseased plants. The expression of metabolic pathways differs between the three treatments, Beauveria and Metarhizium fungal-treated diseased plants, and non-fungal-treated diseased plants. However, the dendrogram present in the heat map shows similarity in the expression of metabolic pathways between the same treatments at different Dpi comparisons. This means that the metabolites’ expression at Dpi 6 or Dpi 10 in comparison with Dpi 3 is somehow similar for any treatment (Beauveria, Metarhizium, Control). These results provided more evidence as to how the fungus invasion influences the metabolic dynamics of cucumber cells at different days post-inoculation of CMV.
Although endophyte-treated plants showed higher abundance of organic acids in diseased cucumber plants, CMV-infected cucumber plants have led to the decrease of organic acids in the plant. This demonstrates the positive effect of the entomopathogenic fungi on the induced defense mechanism against CMV in cucumber plants. Similarly, turnip mosaic virus (TuMV) has caused the down-regulation of most differentially expressed volatile organic compounds in resistant and susceptible Brassica rapa lines [56]. However, CMV infection has triggered the abundance of m-Coumaric acid, p-Coumaroyl quinic acid, and cis-beta-D-Glucosyl-2-hydroxycinnamic acid, which are major plant defense-related phenolic compounds [57,58]. This indicates that cucumber plants produce more phenolic compounds as a defense mechanism against the virus. There were similar data for Egyptian CMV isolates, which significantly increases the total phenol content in cucumber-infected plants compared to healthy ones [59]. In contrast, CMV suppresses the synthesis of most phenolic compounds, specifically chlorogenic acid in squash plants [60]. Pérez-Clemente et al. [61] have reported that citrus tristeza virus (CTV) infection induced accumulation of amino acids and derivatives. In addition, high accumulation of amino acids and their derivatives in cucurbit chlorotic yellows virus (CCYV)-infected plants was found [62]. However, in our study most amino acids and derivatives detected were significantly decreased in CMV-infected plants, as the Egyptian CMV isolates which triggered total protein level decrease in infected cucumber plants [59] Amino acids increase in plants promotes the growth and development of herbivore insects [63,64], which means that CMV infection decrease the fitness of cucumber plants to its vectors. This explains the previous results for the negative effect of CMV on the development of its insect vector aphids [65].
DAS-ELISA results showed no significant difference in the absorbance measurements between fungal-treated and non-fungal-treated diseased cucumber plants. This indicates that further research is required in order to study the effect of entomopathogenic endophytes on the titer level of CMV virus in cucumber plants.
Cucumber plants treated with B. bassiana and M. anisopliae endophytes showed a strong metabolic response to CMV infection. This method of applying endophytes to plants could increase the resistance of cucumber varieties to CMV infection. Multiple metabolites such as amino acids, organic acids, and phenylpropanoids were activated in endophyte-treated diseased plants, which displayed resistance to CMV pathogen. The study highlights the role of primary and secondary metabolites in endophyte-derived plant defense. This metabolomics study of entomopathogenic endophytes-treated virus diseased plants has shown that endophytes can be useful in the management of CMV disease by enhancing cucumber defense metabolites against the virus infection. Changes in diseased cucumber plant metabolic pathways due to fungal endophytes treatment could give future direction for using these endophytes to gain in-depth insights about defense response to CMV pathogen. This data explains previous findings of the ability of endophytic B. bassiana colonization of melon plants to confer protection against CMV transmission by the vector Aphis gossypii [30]. Additionally, this study shows how cucumber plants respond to CMV infection and how CMV modifies host metabolisms to enhance virus infection. This may provide information to seed producers and breeding for plant viral diseases control.

Supplementary Materials

The following are available online at https://www.mdpi.com/article/10.3390/horticulturae8121182/s1, Table S1: Metabolomic adjustments triggered by B. bassianaand, M. anisopliaein CMV-infected cucumber plants in comparison with non-fungal-treated diseased plants (positive control) at different Dpi; Table S2: Common and non-common differentially expressed metabolites of various pathways among comparisons between non-fungal- and fungal-treated CMV-infected cucumber plants at different Dpi; Table S3: Metabolomic adjustments triggered by CMV in cucumber plants.

Author Contributions

Conceptualization, R.S., W.E.K. and L.I.; methodology, R.S.; software, F.A.-s. and R.S.; validation, R.S., W.E.K. and L.I.; investigation, R.S.; resources, R.S.; data curation, R.S.; writing—original draft preparation, R.S.; writing—review and editing, W.E.K. and L.I.; visualization, R.S.; supervision, W.E.K. and Ibrahim L.; project administration, W.E.K.; funding acquisition, W.E.K. All authors have read and agreed to the published version of the manuscript.

Funding

This research received no external funding.

Acknowledgments

We gratefully acknowledge the funding provided by the American University of Beirut Research Board and the K. Shair Central Research Science Laboratory (CRSL) at AUB for providing the facilities to carry out this work. Our thanks also go to Elia Choueiri for his technical advice. The authors would like to thank Ajaj Freiji and Mouhamad Al Kassar for their assistance in collecting symptomatic samples.

Conflicts of Interest

The authors declare no conflict of interest.

References

  1. Wilson, D. Endophyte: The Evolution of a Term and Clarification of Its Use and Definition. Oikos 1995, 73, 274–276. [Google Scholar] [CrossRef]
  2. Johnson, L.J.; Johnson, R.D.; Schardl, C.L.; Panaccione, D.G. Identification of differentially expressed genes in the mutualistic association of tall fescue with Neotyphodium coenophialum. Physiol. Mol. Plant Pathol. 2003, 63, 305–317. [Google Scholar] [CrossRef]
  3. Rodriguez, R.J.; Henson, J.; Van Volkenburgh, E.; Hoy, M.; Wright, L.; Beckwith, F.; Kim, Y.-O.; Redman, R.S. Stress tolerance in plants via habitat-adapted symbiosis. ISME J. 2008, 2, 404–416. [Google Scholar] [CrossRef] [PubMed] [Green Version]
  4. Shaalan, R.; Gerges, E.; Habib, W.; Ibrahim, L. Endophytic colonization by Beauveria bassiana and Metarhizium anisopliae induces growth promotion effect and increases the resistance of cucumber plants against Aphis gossypii. J. Plant Prot. Res. 2021, 61, 358–370. [Google Scholar] [CrossRef]
  5. Strobel, G.; Daisy, B.; Castillo, U.; Harper, J. Natural Products from Endophytic Microorganisms. J. Nat. Prod. 2004, 67, 257–268. [Google Scholar] [CrossRef]
  6. Kaul, S.; Gupta, S.; Ahmed, M.; Dhar, M.K. Endophytic fungi from medicinal plants: A treasure hunt for bioactive metabolites. Phytochem. Rev. 2012, 11, 487–505. [Google Scholar] [CrossRef]
  7. Kusari, S.; Singh, S.; Jayabaskaran, C. Biotechnological potential of plant-associated endophytic fungi: Hope versus hype. Trends Biotechnol. 2014, 32, 297–303. [Google Scholar] [CrossRef]
  8. Wang, X.; Zhang, X.; Liu, L.; Xiang, M.; Wang, W.; Sun, X.; Che, Y.; Guo, L.; Liu, G.; Guo, L.; et al. Genomic and transcriptomic analysis of the endophytic fungus Pestalotiopsis fici reveals its lifestyle and high potential for synthesis of natural products. BMC Genom. 2015, 16, 28. [Google Scholar] [CrossRef] [Green Version]
  9. Yan, L.; Zhu, J.; Zhao, X.; Shi, J.; Jiang, C.; Shao, D. Beneficial effects of endophytic fungi colonization on plants. Appl. Microbiol. Biotechnol. 2019, 103, 3327–3340. [Google Scholar] [CrossRef]
  10. Chen, X.-L.; Sun, M.-C.; Chong, S.-L.; Si, J.-P.; Wu, L.-S. Transcriptomic and Metabolomic Approaches Deepen Our Knowledge of Plant–Endophyte Interactions. Front. Plant Sci. 2022, 12, 700200. [Google Scholar] [CrossRef]
  11. Dayalan, S.; Xia, J.; Spicer, R.A.; Salek, R.; Roessner, U. Metabolome Analysis. In Encyclopedia of Bioinformatics and Computational Biology; Ranganathan, S., Gribskov, M., Nakai, K., Schönbach, C., Eds.; Academic Press: Cambridge, MA, USA, 2018; pp. 396–409. [Google Scholar] [CrossRef]
  12. Manchester, M.; Anand, A. Metabolomics: Strategies to define the role of metabolism in virus infection and pathogenesis. In Advances in Virus Research; Kielian, M., Mettenleiter, T.C., Roossinck, M.J., Eds.; Academic Press: Cambridge, MA, USA, 2017; Volume 98, pp. 57–81. [Google Scholar] [CrossRef]
  13. Skinner, M.; Parker, B.L.; Kim, J.S. Role of entomopathogenic fungi in integrated pest management. In Integrated Pest Management: Current Concepts and Ecological Perspectives; Abrol, D.P., Ed.; Academic Press: San Diego, CA, USA, 2014; pp. 169–191. [Google Scholar] [CrossRef]
  14. Batool, R.; Umer, M.J.; Wang, Y.; He, K.; Shabbir, M.Z.; Zhang, T.; Bai, S.; Chen, J.; Wang, Z. Myco-Synergism Boosts Herbivory-Induced Maize Defense by Triggering Antioxidants and Phytohormone Signaling. Front. Plant Sci. 2022, 13, 790504. [Google Scholar] [CrossRef] [PubMed]
  15. Wraight, S.P.; Inglis, G.D.; Goettel, M.S. Fungi. In Field Manual of Techniques in Invertebrate Pathology: Application and Evaluation of Pathogens for Control of Insects and other Invertebrate Pest, 2nd ed.; Lacey, L.A., Kaya, H.K., Eds.; Springer: Dordrecht, The Netherlands, 2007; pp. 223–248. [Google Scholar] [CrossRef]
  16. Vega, F.E.; Meyling, N.V.; Luangsa-Ard, J.J.; Blackwell, M. Fungal entomopathogens. In Insect Pathology, 2nd ed.; Vega, F.E., Kaya, H.K., Eds.; Academic Press: San Diego, CA, USA, 2012; pp. 171–220. [Google Scholar] [CrossRef]
  17. Gurulingappa, P.; Sword, G.A.; Murdoch, G.; McGee, P.A. Colonization of crop plants by fungal entomopathogens and their effects on two insect pests when in planta. Biol. Control 2010, 55, 34–41. [Google Scholar] [CrossRef]
  18. Castillo Lopez, D.; Zhu-Salzman, K.; Ek-Ramos, M.J.; Sword, G.A. The entomopathogenic fungal endophytes Purpureocillium lilacinum (formerly Paecilomyces lilacinus) and Beauveria bassiana negatively affect cotton aphid reproduction under both greenhouse and field conditions. PLoS ONE 2014, 9, e103891. [Google Scholar] [CrossRef] [Green Version]
  19. Griffin, M.R.; Ownley, B.H.; Klingeman, W.E.; Pereira, R.M. Evidence of induced systemic resistance with Beauveria bassiana against Xanthomonas in cotton. Phytopathology 2006, 96, S42. [Google Scholar]
  20. Ownley, B.H.; Gwinn, K.D.; Vega, F.E. Endophytic fungal entomopathogens with activity against plant pathogens: Ecology and evolution. Biocontrol 2010, 55, 113–128. [Google Scholar] [CrossRef]
  21. Jaber, L.R.; Ownley, B.H. Can we use entomopathogenic fungi as endophytes for dual biological control of insect pests and plant pathogens? Biol. Control 2018, 116, 36–45. [Google Scholar] [CrossRef]
  22. Vega, F. The use of fungal entomopathogens as endophytes in biological control: A review. Mycologia 2018, 110, 4–30. [Google Scholar] [CrossRef]
  23. Vidal, S.; Jaber, L. Entomopathogenic fungi as endophytes: Plant–endophyte–herbivore interactions and prospects for use in biological control. Curr. Sci. 2015, 109, 46–54. [Google Scholar]
  24. Lehtonen, P.T.; Helander, M.; Siddiqui, S.A.; Lehto, K.; Saikkonen, K. Endophytic fungus decreases plant virus infections in meadow ryegrass (Lolium pratense). Biol. Lett. 2006, 2, 620–623. [Google Scholar] [CrossRef] [Green Version]
  25. Jaber, L.R.; Salem, N.M. Endophytic colonisation of squash by the fungal entomopathogen, Beauveria bassiana (Ascomycota: Hypocreales) for managing Zucchini yellow mosaic virus in Cucurbits. Biocontrol. Sci. Technol. 2014, 24, 1096–1109. [Google Scholar] [CrossRef]
  26. Muvea, A.M.; Subramanian, S.; Maniania, N.K.; Poehling, H.M.; Ekesi, S.; Meyhöfer, R. Endophytic colonization of onions induces resistance against viruliferous thrips and virus replication. Front. Plant Sci. 2018, 9, 1785. [Google Scholar] [CrossRef] [PubMed]
  27. Kiarie, S.; Nyasani, J.O.; Gohole, L.S.; Maniania, N.K.; Subramanian, S. Impact of Fungal Endophyte Colonization of Maize (Zea mays L.) on Induced Resistance to Thrips- and Aphid-Transmitted Viruses. Plants 2020, 9, 416. [Google Scholar] [CrossRef] [PubMed] [Green Version]
  28. Elsharkawy, M.M.; Shimizu, M.; Takahashi, H.; Ozaki, K.; Hyakumachi, M. Induction of Systemic Resistance against Cucumber mosaic virus in Arabidopsis thaliana by Trichoderma asperellum SKT-1. Plant Pathol. J. 2013, 29, 193–200. [Google Scholar] [CrossRef] [Green Version]
  29. Vitti, A.; Pellegrini, E.; Nali, C.; Lovelli, S.; Sofo, A.; Valerio, M.; Scopa, A.; Nuzzaci, M. Trichoderma harzianum T-22 Induces Systemic Resistance in Tomato Infected by Cucumber mosaic virus. Front. Plant Sci. 2016, 7, 1520. [Google Scholar] [CrossRef] [PubMed] [Green Version]
  30. González-Mas, N.; Quesada-Moraga, E.; Plaza, M.; Fereres, A.; Moreno, A. Changes in feeding behaviour are not related to the reduction in the transmission rate of plant viruses by Aphis gossypii (Homoptera: Aphididae) to melon plants colonized by Beauveria bassiana (Ascomycota: Hypocreales). Biol. Control 2018, 130, 95–103. [Google Scholar] [CrossRef]
  31. Shaalan, R.; Ibrahim, L. Entomopathogenic fungal endophytes: Can they colonize cucumber plants? In Book of Proceedings of the IX International Scientific Agriculture Symposium AGROSYM; AGROSYM: Jahorina, Bosnia and Herzegovina, 2018; pp. 853–860. [Google Scholar]
  32. Ibrahim, L.; Hamieh, A.; Ghanem, H.; Ibrahim, S. Pathogenicity of entomopathogenic fungi from Lebanese soils against aphids, whitefly and non-target beneficial insects. Int. J. Agric. Sci. 2011, 3, 156–164. [Google Scholar] [CrossRef] [Green Version]
  33. Ibrahim, L.; Laham, L.; Tomma, A.; Ibrahim, S. Mass production, yield, quality, formulation and efficacy of entomopathogenic Metarhizium anisopliae conidia. Br. J. Appl. Sci. Technol. 2015, 9, 427–440. [Google Scholar] [CrossRef]
  34. Humber, R.A. Fungi: Identification. In Manual of Techniques in Insect Pathology; Lacey, L.A., Ed.; Academic Press: London, UK, 1997; pp. 153–185. [Google Scholar] [CrossRef]
  35. Petrini, O.; Fisher, P.J. Fungal endophytes in Salicornia perennis. Trans. Br. Mycol. Soc. 1987, 87, 647–651. [Google Scholar] [CrossRef]
  36. Rizos, H.; Gunn, L.V.; Pares, R.D.; Gillings, M.R. Differentiation of cucumber mosaic virus isolates using the polymerase chain reaction. J. Gen. Virol. 1992, 73, 2099–2103. [Google Scholar] [CrossRef]
  37. Bos, L. Persistence of infectivity of three viruses in plant material dried over CaCl2 and stored under different conditions. Neth. J. Plant Pathol. 1977, 83, 217–220. [Google Scholar] [CrossRef]
  38. Sudhakar, N.; Nagendra-Prasad, D.; Mohan, N.; Murugesan, K. Induction of systemic resistance in Lycopersicon esculentum cv. PKM1 (tomato) against Cucumber mosaic virus by using ozone. J. Virol. Methods 2007, 139, 71–77. [Google Scholar] [CrossRef] [PubMed]
  39. Chang, S.; Puryear, J.; Cairney, J. A Simple and Efficient Method for Isolating RNA from Pine Trees. Plant Mol. Biol. Rep. 1993, 11, 113–116. [Google Scholar] [CrossRef]
  40. Miller, M.B.; Bassler, B.L. Quorum sensing in bacteria. Annu. Rev. Microbiol. 2001, 55, 165–199. [Google Scholar] [CrossRef] [PubMed] [Green Version]
  41. Piewngam, P.; Zheng, Y.; Nguyen, T.H.; Dickey, S.W.; Joo, H.-S.; Villaruz, A.E.; Glose, K.A.; Fisher, E.L.; Hunt, R.L.; Li, B. Pathogen elimination by probiotic Bacillus via signalling interference. Nature 2018, 562, 532–537. [Google Scholar] [CrossRef]
  42. Munir, S.; Li, Y.; He, P.; He, P.; Ahmed, A.; Wu, Y.; He, Y. Unraveling the metabolite signature of citrus showing defense response towards Candidatus Liberibacter asiaticus after application of endophyte Bacillus subtilis L1-21. Microbiol. Res. 2020, 234, 126425. [Google Scholar] [CrossRef]
  43. Wintermantel, W.M. Integration of omics approaches toward understanding whitefly transmission of viruses. Adv. Virus Res. 2018, 102, 199–223. [Google Scholar]
  44. Mhlongo, M.I.; Piater, L.A.; Steenkamp, P.A.; Labuschagne, N.; Dubery, I.A. Concurrent metabolic profling and quantifcation of aromatic amino acids and phytohormones in Solanum lycopersicum plants responding to Phytophthora capsici. Metabolites 2020, 10, 466. [Google Scholar] [CrossRef]
  45. Ting, H.M.; Cheah, B.H.; Chen, Y.C.; Yeh, P.M.; Cheng, C.P.; Yeo, F.K.S.; Vie, A.K.; Rohlof, J.; Winge, P.; Bones, A.M.; et al. The role of a glucosinolate-derived nitrile in plant immune responses. Front. Plant Sci. 2020, 11, 257. [Google Scholar] [CrossRef]
  46. Zhang, Y.; Bouwmeester, H.J.; Kappers, I.F. Combined transcriptome and metabolome analysis identifies defence responses in spider mite-infested pepper (Capsicum annuum). J. Exp. Bot. 2020, 71, 330–343. [Google Scholar] [CrossRef]
  47. Mahmood, A.; Kataoka, R. Metabolite profiling reveals a complex response of plants to application of plant growth-promoting endophytic bacteria. Microbiol. Res. 2020, 234, 126421. [Google Scholar] [CrossRef]
  48. Bajaj, R.; Huang, Y.; Gebrechristos, S.; Mikolajczyk, B.; Brown, H.; Prasad, R.; Varma, A.; Bushley, K.E. Transcriptional responses of soybean roots to colonization with the root endophytic fungus Piriformospora indica reveals altered phenylpropanoid and secondary metabolism. Sci. Rep. 2018, 8, 10227. [Google Scholar] [CrossRef] [PubMed] [Green Version]
  49. Zhang, Y.; Yang, N.; Zhao, L.; Zhu, H.; Tang, C. Transcriptome analysis reveals the defense mechanism of cotton against Verticillium dahliae in the presence of the biocontrol fungus Chaetomium globosum CEF-082. BMC Plant Biol. 2020, 20, 89. [Google Scholar] [CrossRef] [Green Version]
  50. Zechmann, B. Subcellular Roles of Glutathione in Mediating Plant Defense during Biotic Stress. Plants 2020, 9, 1067. [Google Scholar] [CrossRef] [PubMed]
  51. Zierer, W.; Hajirezaei, M.R.; Eggert, K.; Sauer, N.; von Wirén, N.; Pommerrenig, B. Phloem-Specific Methionine Recycling Fuels Polyamine Biosynthesis in a Sulfur-Dependent Manner and Promotes Flower and Seed Development. Plant Physiol. 2016, 170, 790–806. [Google Scholar] [CrossRef] [PubMed]
  52. Koc, F.N.; Seckin Dinler, B. Pipecolic acid in plants: Biosynthesis, signalling, and role under stress. Botanica 2022, 28, 4–14. [Google Scholar] [CrossRef]
  53. Çalişkan, M. The metabolism of oxalic acid. Turk. J. Zool. 2000, 24, 103–106. [Google Scholar]
  54. Nakata, P.A. Advances in our understanding of calcium oxalate crystal formation and function in plants. Plant Sci. 2003, 164, 901–909. [Google Scholar] [CrossRef]
  55. Smith, L. The many roles of oxalate in nature. Trans. Am. Clin. Climatol. Assoc. 2002, 113, 1–20. [Google Scholar]
  56. Lu, X.; Zhang, L.; Huang, W.; Zhang, S.; Zhang, S.; Li, F.; Zhang, H.; Sun, R.; Zhao, J.; Li, G. Integrated Volatile Metabolomics and Transcriptomics Analyses Reveal the Influence of Infection TuMV to Volatile Organic Compounds in Brassica rapa. Horticulturae 2022, 8, 57. [Google Scholar] [CrossRef]
  57. Soujanya, P.L.; Sekhar, J.C.; Ratnavathi, C.V.; Karjagi, C.G.; Shobha, E.; Suby, S.B.; Yathish, K.R.; Sunil, N.; Rakshit, S. Induction of cell wall phenolic monomers as part of direct defense response in maize to pink stem borer (Sesamia inferens Walker) and non-insect interactions. Sci. Rep. 2021, 11, 14770. [Google Scholar] [CrossRef]
  58. Knollenberg, B.J.; Li, G.X.; Lambert, J.D.; Maximova, S.N.; Guiltinan, M.J. Clovamide, a Hydroxycinnamic Acid Amide, Is a Resistance Factor Against Phytophthora spp. in Theobroma cacao. Front. Plant Sci. 2020, 11, 617520. [Google Scholar] [CrossRef] [PubMed]
  59. Farahat, A.S.; El-Morsi, A.A.; Soweha, H.E.; Sofy, A.R.; Refaey, E.E. Metabolic changes of cucumber plants due to two cmv egyptian isolates. Arab. Univ. J. Agric. Sci. 2018, 26, 2019–2028. [Google Scholar] [CrossRef] [Green Version]
  60. Abdelkhalek, A.; Király, L.; Al-Mansori, A.-N.A.; Younes, H.A.; Zeid, A.; Elsharkawy, M.M.; Behiry, S.I. Defense Responses and Metabolic Changes Involving Phenylpropanoid Pathway and PR Genes in Squash (Cucurbita pepo L.) following Cucumber mosaic virus Infection. Plants 2022, 11, 1908. [Google Scholar] [CrossRef] [PubMed]
  61. Pérez-Clemente, R.M.; Montoliu, A.; Vives-Peris, V.; Arbona, V.; Gómez-Cadenas, A. Hormonal and metabolic responses of Mexican lime plants to CTV infection. J. Plant Physiol. 2019, 238, 40–52. [Google Scholar] [CrossRef]
  62. Zhang, Z.; He, H.; Yan, M.; Zhao, C.; Lei, C.; Li, J.; Yan, F. Widely targeted analysis of metabolomic changes of Cucumis sativus induced by cucurbit chlorotic yellows virus. BMC Plant Biol. 2022, 22, 158. [Google Scholar] [CrossRef]
  63. Maluta, N.K.; Garzo, E.; Moreno, A.; Lopes, J.R.; and Fereres, A. Tomato yellow leaf curl virus benefits population growth of the Q Biotype of Bemisia tabaci (Gennadius) (Hemiptera: Aleyrodidae). Neotrop Entomol. 2014, 43, 385–392. [Google Scholar] [CrossRef]
  64. Cui, H.Y.; Sun, Y.C.; Zhao, Z.H.; Zhang, Y.J. The combined effect of elevated O3 levels and TYLCV infection increases the fitness of Bemisia tabaci Mediterranean on tomato plants. Environ. Entomol. 2019, 48, 1425–1433. [Google Scholar] [CrossRef] [Green Version]
  65. Mauck, K.E.; De Moraes, C.M.; Mescher, M.C. Deceptive chemical signals induced by a plant virus attract insect vectors to inferior hosts. Proc. Natl. Acad. Sci. USA 2010, 107, 3600–3605. [Google Scholar] [CrossRef]
Figure 1. Re-isolation of EPFs from cucumber seedlings (1. B. bassiana, 2. M. anisopliae, and 3. Control treatments).
Horticulturae 08 01182 g001
Figure 2. Blistering and mosaic symptoms of CMV on cucumber leaves.
Horticulturae 08 01182 g002
Figure 3. Heat map showing some of the differentially expressed metabolites of amino acids and derivatives pathway (P3) in different comparisons between positive control plants (C) and Metarhizium (MT) or Beauveria (BT) treatments at different Dpi (Ex: 3Cvs6M means comparison between Positive Control plants at Dpi 3 and Metarhizium-treated plants at Dpi 6). Z score is a measure of distance, in standard deviations, from the plate mean. A well with a Z score of 0 has the same raw value as the plate mean. A well with a Z score of 1.0 is exactly one standard deviation above the plate mean, and a Z score of −0.5 is half a standard deviation below the plate mean.
Horticulturae 08 01182 g003
Figure 4. Heat map showing some of the differentially expressed metabolites of dipeptides and tripeptides pathway (P31) in different comparisons between positive control plants (C) and Metarhizium (MT) or Beauveria (BT) treatments at different Dpi. Z score is a measure of distance, in standard deviations, from the plate mean. A well with a Z score of 0 has the same raw value as the plate mean. A well with a Z score of 1.0 is exactly one standard deviation above the plate mean and a Z score of −0.5 is half a standard deviation below the plate mean.
Horticulturae 08 01182 g004
Figure 5. Heat map showing some of the differentially expressed metabolites of Cysteine and Methionine metabolism (P26) and Glycine, Serine, and Threonine metabolism (P40) pathways in different comparisons between positive control plants (C) and Metarhizium (MT) or Beauveria (BT) treatments at different Dpi. Z score is a measure of distance, in standard deviations, from the plate mean. A well with a Z score of 0 has the same raw value as the plate mean. A well with a Z score of 1.0 is exactly one standard deviation above the plate mean and a Z score of −0.5 is half a standard deviation below the plate mean.
Horticulturae 08 01182 g005
Figure 6. Heat map showing some of the differentially expressed metabolites of Glyoxylate and Dicarboxylate metabolism (P42) and Lysine degradation (P50) pathways in different comparisons between positive control plants (C) and Metarhizium (MT) or Beauveria (BT) treatments at different Dpi. Z score is a measure of distance, in standard deviations, from the plate mean. A well with a Z score of 0 has the same raw value as the plate mean. A well with a Z score of 1.0 is exactly one standard deviation above the plate mean and a Z score of −0.5 is half a standard deviation below the plate mean.
Horticulturae 08 01182 g006
Figure 7. Heat map showing some of the differentially expressed metabolites of Alanine, Aspartate, and Glutamate metabolism (P1) and Arginine and Proline metabolism (P5) pathways in different comparisons between positive control plants (C) and Metarhizium (MT) or Beauveria (BT) treatments at different Dpi. Z score is a measure of distance, in standard deviations, from the plate mean. A well with a Z score of 0 has the same raw value as the plate mean. A well with a Z score of 1.0 is exactly one standard deviation above the plate mean and a Z score of −0.5 is half a standard deviation below the plate mean.
Horticulturae 08 01182 g007
Figure 8. Heat map showing the differentially expressed metabolites of Tyrosine metabolism pathway (P81) in different comparisons between positive control plants (C) and Metarhizium (MT) or Beauveria (BT) treatments at different Dpi. Z score is a measure of distance, in standard deviations, from the plate mean. A well with a Z score of 0 has the same raw value as the plate mean. A well with a Z score of 1.0 is exactly one standard deviation above the plate mean and a Z score of −0.5 is half a standard deviation below the plate mean.
Horticulturae 08 01182 g008
Figure 9. Heat map showing some of the differentially expressed metabolites of C5-branched dibasic acid metabolism (P17) and Citrate Cycle (TCA cycle) (P23) pathways in different comparisons between positive control plants (C) and Metarhizium (MT) or Beauveria (BT) treatments at different Dpi. Z score is a measure of distance, in standard deviations, from the plate mean. A well with a Z score of 0 has the same raw value as the plate mean. A well with a Z score of 1.0 is exactly one standard deviation above the plate mean and a Z score of −0.5 is half a standard deviation below the plate mean.
Horticulturae 08 01182 g009
Figure 10. Heat map showing some of the differentially expressed metabolites of Phenylalanine metabolism (P61) and Phenylpropanoid biosynthesis (P63) pathways in different comparisons between positive control plants (C) and Metarhizium (MT) or Beauveria (BT) treatments at different Dpi. Z score is a measure of distance, in standard deviations, from the plate mean. A well with a Z score of 0 has the same raw value as the plate mean. A well with a Z score of 1.0 is exactly one standard deviation above the plate mean and a Z score of −0.5 is half a standard deviation below the plate mean.
Horticulturae 08 01182 g010
Figure 11. Venn diagram depicts the number of common and non-common differentially expressed metabolites among the comparisons (3C vs 6B, 3C vs 6M, 3C vs 10B, and 3C vs 10M).
Horticulturae 08 01182 g011
Figure 12. Heatmap showing the differentially expressed plant metabolic pathways in comparisons between the same treated plants at different Dpi.
Horticulturae 08 01182 g012
Figure 13. Metabolomic interaction between plant–fungal endophyte–virus revealed 631 differentially expressed metabolites of various pathways.
Horticulturae 08 01182 g013
Table 1. Effect of conidial seed treatments on percentage recovery of B. bassiana and M. anisopliae from different parts of cucumber seedlings grown in autoclaved soil pots under controlled conditions in the greenhouse.
TreatmentLeaves (% ± SE)Stem (% ± SE)Roots (% ± SE)
Control0.0 ± 0.00 a *0.0 ± 0.00 a0.0 ± 0.00 a
B. bassiana100 ± 0.00 b40.0 ± 0.24 bc60.0 ± 0.24 b
M. anisopliae80.0 ± 0.20 b80.0 ± 0.20 c80.0 ± 0.20 b
* Means (% ± SE) within a column followed by the same letter are not significantly different at p = 0.05 (Duncan test, after one-way ANOVA).
Table 2. ELISA absorbance measurements (405 nm) of CMV-inoculated plants at different Dpi.
TreatmentDpi 3Dpi 6Dpi 10
Positive control plants2.68 ± 0.46 a,*2.16 ± 0.45 a1.74 ± 0.18 a
Metarhizium anisopliae2.44 ± 0.36 a1.9 ± 0.18 a2.04 ± 0.31 a
Beauveria bassiana1.86 ± 0.28 a2.03 ± 0.31 a2.52 ± 0.62 a
* Means (± SE) within a column followed by the same letter (a) are not significantly different at p = 0.05 (Duncan test, after one-way ANOVA).
Publisher’s Note: MDPI stays neutral with regard to jurisdictional claims in published maps and institutional affiliations.