Article

If You Grow It, They Will Come: Ornamental Plants Impact the Abundance and Diversity of Pollinators and Other Flower-Visiting Insects in Gardens

by
Michala C. Palmersheim
1,
Roger Schürch
1,
Megan E. O’Rourke
2,
Jenna Slezak
1 and
Margaret J. Couvillon
1,*
1
Department of Entomology, Virginia Tech, Blacksburg, VA 24061, USA
2
School of Plant and Environmental Sciences, Virginia Tech, Blacksburg, VA 24060, USA
*
Author to whom correspondence should be addressed.
Horticulturae 2022, 8(11), 1068; https://doi.org/10.3390/horticulturae8111068
Submission received: 26 September 2022 / Revised: 21 October 2022 / Accepted: 5 November 2022 / Published: 14 November 2022
(This article belongs to the Section Insect Pest Management)

Abstract

:
Gardening for pollinators and other flower-visiting insects, where ornamental landscaping plants are added to provide habitats and foraging resources, may provide substantial benefits to declining insect populations. However, plant recommendations often lack empirical grounding or are limited geographically. Here, we created a pollinator garden, replicated across two sites, that contained 25 ornamental landscape plants that were either native or non-native to mid-Atlantic states and perennial or annual. Our objective was to determine the plants that would bring insect abundance and diversity to gardens. We surveyed the number and taxonomy of insects visiting the plants for two summers. We found a significant effect of plant species on both the abundance and diversity of flower-visiting insects. Insects were 42 times more abundant on our most visited plant (black-eyed Susan, Rudbeckia fulgida) versus our least visited plant (petunia, Petunia sp.). There was more than one diversity point difference in the Shannon index between the plant with the most (purple coneflower, Echinacea purpurea) and least (verbena, Verbena bonariensis) diverse visitors. Across our plants, honey bee (Apis mellifera) abundance positively correlated with other insect pollinators, although not specifically with wild bee abundance. Native perennials outperformed non-native perennials and non-native annuals in insect abundance, and both non-native and native perennials attracted more diversity than non-native annuals. Across plants, diversity scores quadratically related to insect abundance, where the highest diversity was seen on the plants with medium abundance. Lastly, we present the weighted sums of all insect visitors per plant, which will allow future gardeners to make informed landscaping decisions. Overall, we have shown that gardening schemes could benefit from a data-driven approach to better support abundant and diverse insect populations within ornamental landscape gardens.

1. Introduction

In response to the widespread and highly publicized declines in insect pollinators [1,2,3,4,5], people are increasingly interested in supporting them locally by providing foraging resources and habitats. Some of these enhancements are occurring at a landscape level [6,7,8,9,10,11,12], while other modifications are enacted at a smaller scale. For example, there is a growing movement for lawn mowing to be reduced or delayed, allowing flowers and nesting habitats to go undisturbed during critical insect foraging and reproductive phases [13,14,15,16]. Backyard initiatives such as “No Mow May” were first popularized by Plantlife, a British conservation charity, and are gaining traction across the USA through promotion from organizations such as the Xerces Society for Invertebrate Conservation. Additionally, gardening for pollinators, where ornamentals are chosen to attract pollinators and other flower-visiting insects, has also become a popular activity for many, including homeowners, scout troops, libraries, and schools [17,18,19,20,21]. Indeed, there is evidence that gardens can offer substantial benefits [22] by providing foraging resources and nesting habitats that can be superior to what is available in nearby nature reserves or parks [23,24].
The quality and quantity of the gardens’ benefits will directly depend upon what is planted in them [25,26,27,28]. However, non-specialist gardeners might experience barriers to making informed choices about plants for pollinators. For example, recommendations by some non-profits, such as the Xerces Society, have lists of plants claiming to attract diverse and abundant pollinators that are often based on expert opinion but lack empirical backing and/or do not cite sources. These non-citations then become serial: the Lady Bird Johnson Wildflower Center and Pollinator Partnership both credit the Xerces Society as their resource in their recommendations. There are also inconsistencies among plant recommendations: a recent meta-analysis of 15 reputable pollinator plant recommendation lists demonstrated very little overlap between lists, even within regions [29]. Occasionally, recommended plant lists do not offer region specificity, which could lead to the introduction of invasive species. Sometimes, lists also make general suggestions, such as the Pollinator Partnership’s recommendation of lavender (Lavandula sp.) due to it being highly attractive to bees, even though there is a tenfold difference in attractiveness to pollinators between different lavender cultivars [30]. Plant recommendation lists often do not differentiate among the types of pollinators they benefit, such as butterflies, native bees, or honey bees, which might be of interest to a gardener. Lastly, one practical barrier to the widespread adoption of pollinator-friendly gardening is that some lists include flowering vegetation that cannot be easily found at nurseries.
In the scientific literature, there are only a few studies that have systematically compared the impacts of different plants on insect pollinators. For example, in a study of 32 popular perennials, their attractiveness to flower-visiting insects varied 100-fold [30]. Likewise, a five-year survey of 111 ornamental cultivars thought to be attractive to flower-visiting insects measured a 13-fold difference in pollinator attractiveness [31]. However, the most attractive species identified in these studies, lesser calamintha (Calamintha nepeta) and borage (Borago officinalis), were often not included in cross-checked recommendation lists of pollinator-friendly plants [30,31]. A few studies do indicate a generalization in plant attractiveness to pollinators, which is that perennial plants provide more support to complex pollinator communities than annuals [25,28,32]. Nevertheless, given that previous research has been confined to a few studies from select regions of the world [29], more remains to be done to inform gardeners on how to optimize their pollinator-friendly efforts.
Here we investigated the effects of 25 ornamental landscape plants, which are readily available in local nurseries, on flower-visiting insects. Plants were either native or non-native to the mid-Atlantic on the Eastern side of the United States, and they were perennial or annual. We surveyed the number and taxonomy of flower-visiting insects through non-destructive sampling and analyzed the data to determine the plants that brought abundant and diverse insects, including pollinators, to gardens. Our goal was to provide the everyday gardener with data-driven recommendations to help them create customizable, pollinator-friendly gardens.

2. Materials and Methods

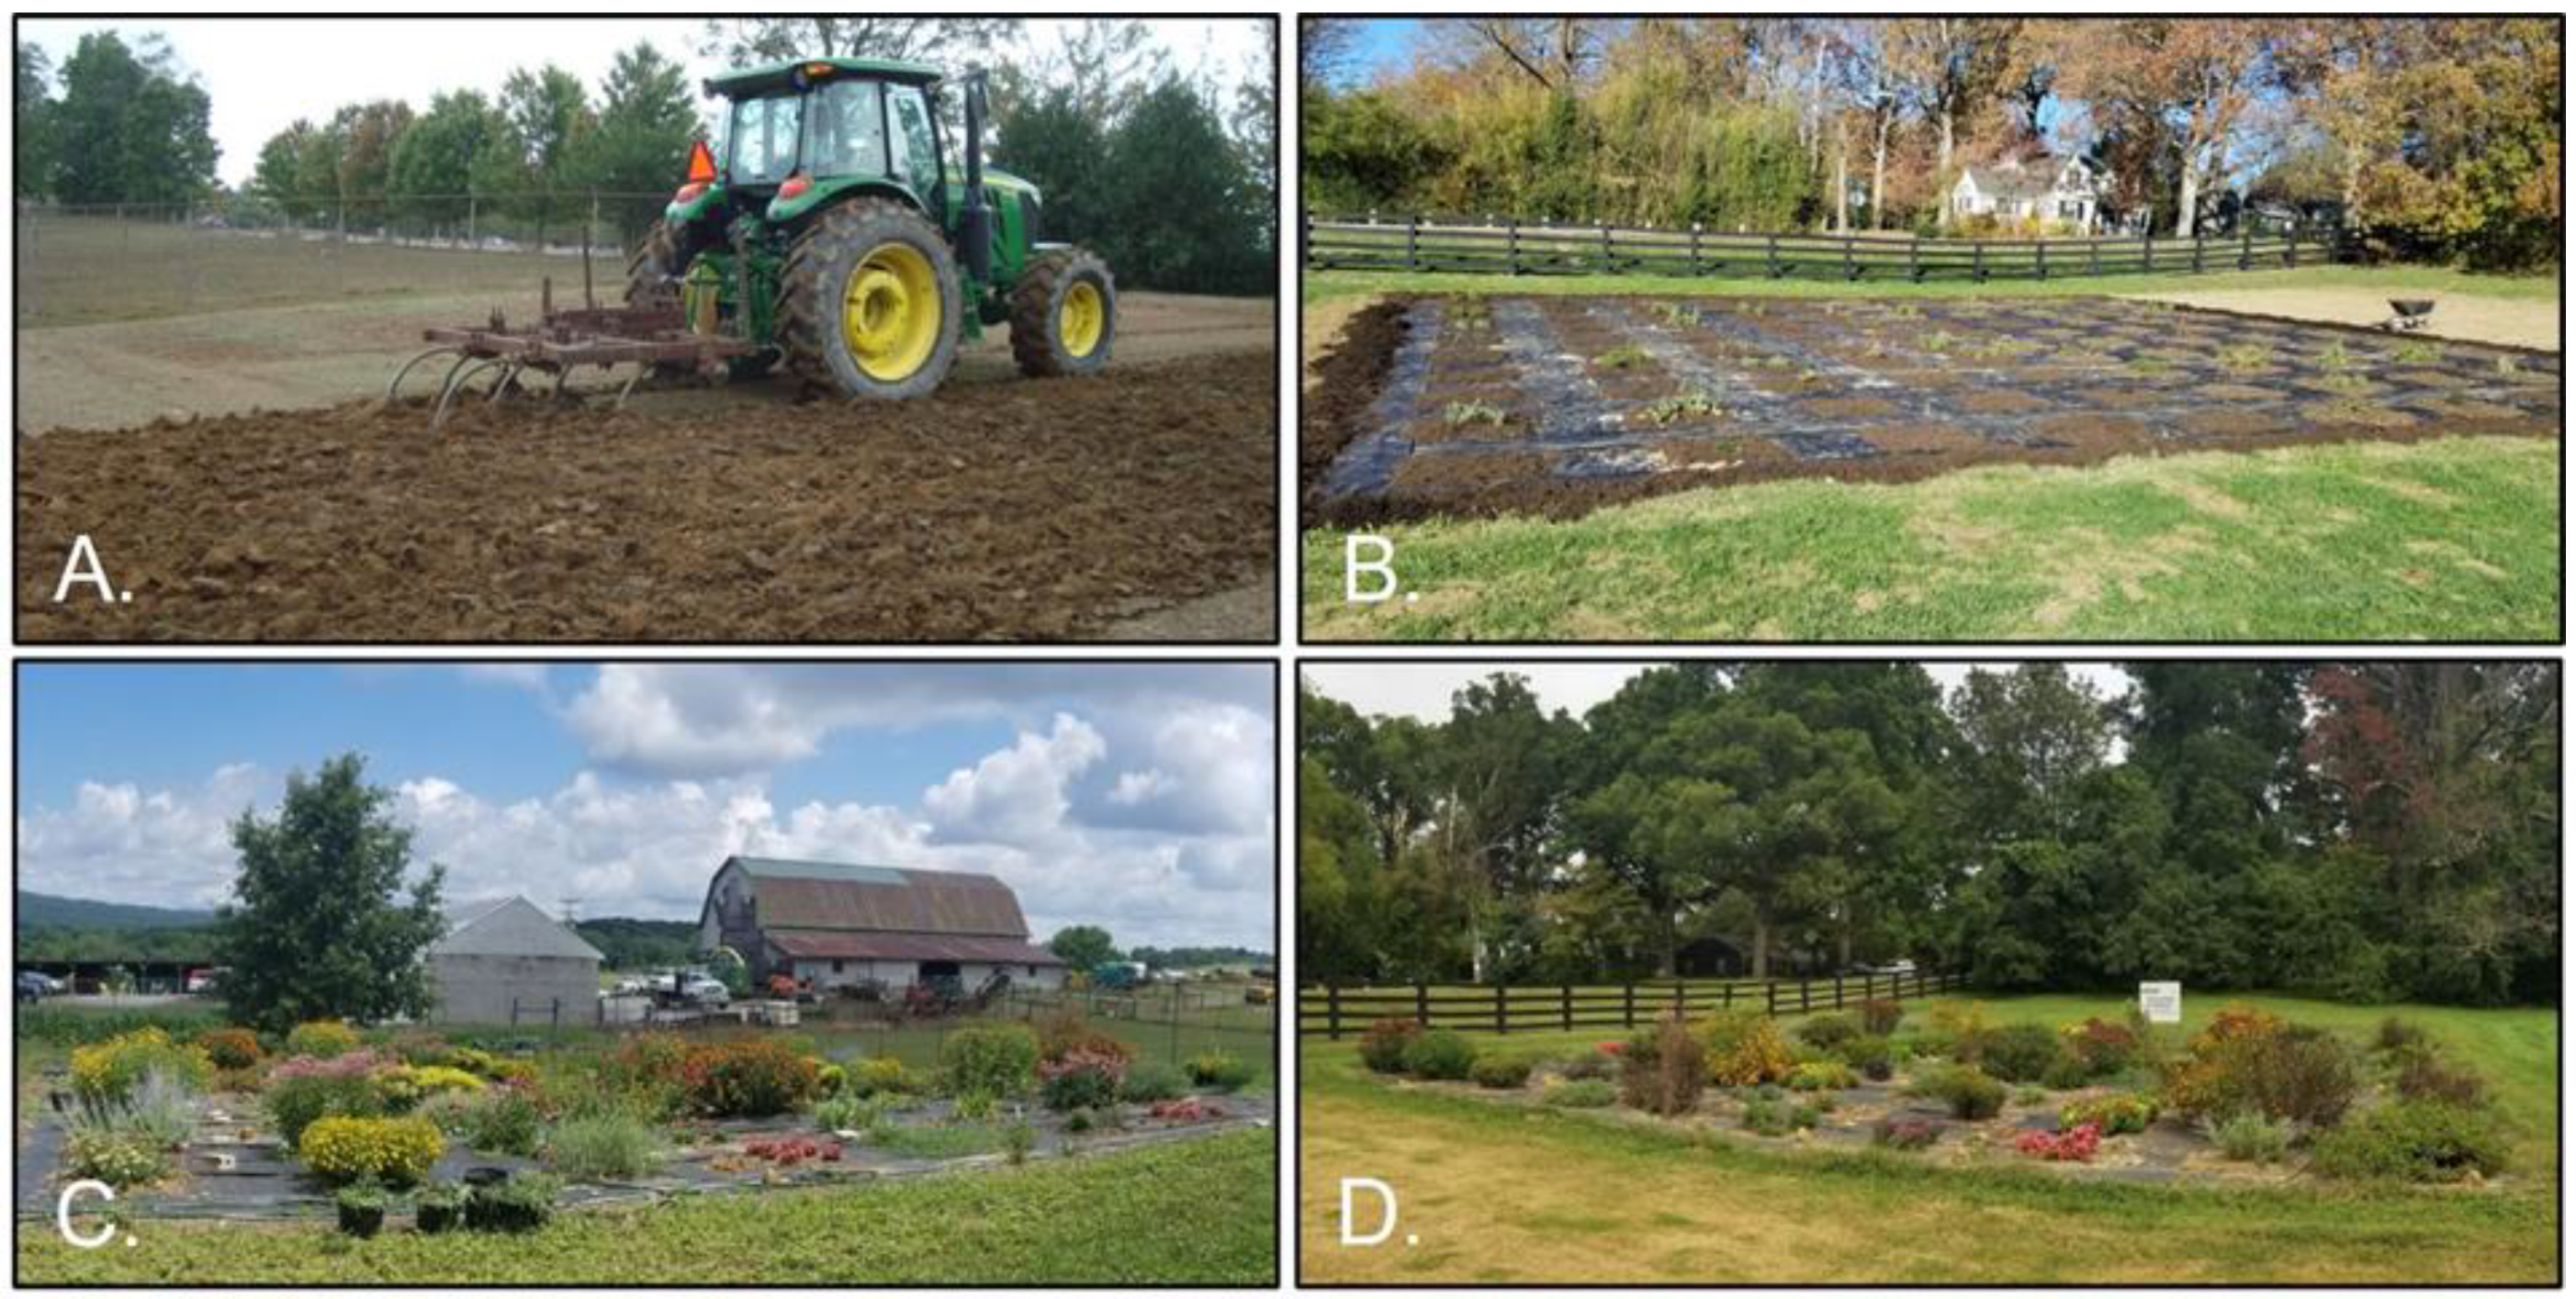
2.1. Study Sites and Site Preparation

We designed (fall 2019), planted (fall 2019/spring 2020 and spring 2021), and monitored two experimental gardens for two summers (2020 and 2021) for pollinator visitation. The gardens were located near the Virginia Polytechnic and State University (Virginia Tech) main campus in Blacksburg, Virginia, with one garden (18.3 × 20.1 m) at the Virginia Tech Turfgrass Research Center (TRC, latitude 37.215760, longitude −80.424180) and the second garden (18.6 × 30.8 ft) at the Virginia Tech Urban Horticulture Center (UHC, latitude 37.222270, longitude −80.458740). These sites were selected because they are close to campus, provided good summer sunshine, had easy access to water, and were approximately 4.8 km apart, which meant that, in general, the foraging ranges of most insect pollinators visiting one site would not overlap the ranges of those visiting the second site [33]. Three honey bee hives were located c. 76 m from the plots at the TRC, and five honey bee hives were located c. 134 m from the plots at the UHC. These hives were not part of our research.
In fall 2019, we began at both sites by chisel plowing and tilling to a 15.2 cm depth (Figure 1). Next, we tested the soil to detect any differences in composition between sites by collecting four samples per site, one per quadrant (see below). The per-site samples were homogenized in a bucket and submitted to the Crop and Soil Sciences Department at Virginia Tech, who confirmed no considerable differences in soil composition between sites, no concerning measurements for the purpose of growing landscape plants, and the high presence of organic matter, which meant that no additional fertilizers were needed [34]. Then, we purchased landscape fabric (Landscape Supply Inc., Roanoke VA) that we cut into 22 pieces, each 19.2 × 0.9 m, and placed in a lattice pattern at each site by securing the strips with 30.5 cm garden staples. In this way, we constructed 100 square plots of exposed tilled soil at each site, with each plot measuring 0.91 × 0.91 ft (Figure 1). We chose 25 different plant species (see below) and replicated each plant species four times at each site, one per quadrant, to fill the 100 plots. We randomized with a random number generator the location of each of the plant replicate within a site and kept the order of plants within the garden identical between the two sites (TRC and UHC).

2.2. Selection and Planting of Ornamental Garden Plants

We selected 25 ornamental garden plants (Table 1, Figure S1 in supplementary online for cultivars/varieties) to include in our study that, based on our experience and published lists from the Xerces Society and the NRCS Plants for Pollinators [35,36], represented a range of attractiveness to insect pollinators, including plants that we did not expect to attract many insects (petunia) as negative controls. We included some plants that are often reported as being good for bees, such as bee balm. We selected plants that bloom from mid- to late-summer, as this is when most insect populations reach their peak abundance and when we anticipated our data collection to occur. Additionally, because we ultimately wanted our recommendations to be accessible to non-specialist gardeners, we selected plants that were easy to obtain and to maintain. We picked a mix of non-native annuals (n = 7) and perennials (n = 18), and within the perennials, we selected those both native (n = 11) and non-native (n = 7) to our mid-Atlantic region (Table 1, Supplementary online table for varieties). Unfortunately, we were unable to obtain any native annuals.
We purchased our plants from Riverbend Nursery (Riner, VA) and Crow’s Nest Nursery (Blacksburg, VA) in fall 2019 (perennials) and in the late spring of 2020 and 2021 (annuals and additional perennials). Each plant was planted by the same person in each of the four quadrants at each site. We planted between 1 and 5 plants per plot, except for zinnias (Zinnia sp.), which had 24 plugs, and petunias (Petunia sp.) and begonias (Begonia sp.), which had nine 10.2 cm pots per plot. In this way, we hoped to achieve largely similar plant patch sizes [37]. Plants were arranged in each plot according to their size and recommended planting distance provided by the nursery tag recommendations [34]. Then we purchased bark mulch from American Mulch & More (Christiansburg, VA) and spread it on each garden plot. Mulch was laid approximately 5 cm deep for each plot and on the outside edge of the landscape fabric bordering the garden to keep a mower away from the fabric. Overwintering perennials were given supplementary mulch on an as-needed basis.
Over our entire study, 5 out of the 25 plants were not present in both years. Specifically, data are unavailable for brown-eyed Susan (Rudbeckia triloba) in 2021 due to unsuccessful overwintering. Limited data are available for catmint (Nepeta × faassenii), as it bloomed earlier than anticipated prior to the start of data collection. We could not re-purchase begonia ”Bada Bing” (Begonia × semperflorens cultorum), dahlia (Dahlia × hybrida), and zinnia (Zinnia sp.) in 2021 due to supplier availability, so we replaced them with a visually similar cultivar begonia ”Rose” (Begonia sp.). At TRC, two of the four dahlia plots did not bloom in 2021. Lastly, petunia (Petunia sp.) was selected to replace zinnia for 2021, as they are both popular annuals; however, the petunias at TRC did not thrive. Although less data were, therefore, collected on these plants, we could account for this by including ”year” as a random factor and/or weighting our sums by number of successful plots (see below). Throughout this study and in our figures, we shall use common names to refer to the plants.

2.3. Maintenance

We watered our plants at the time of planting to encourage establishment and growth. During the experiment, they were watered on an as-needed basis, which was typically for one hour twice a week during the spring and summer months unless sufficient rainfall had occurred. We used a Zinc Green Partial-Circle and Full-Circle Sprinkler Head (Home Depot) and placed four sprinkler heads, connected by a 30.5 m Teknor Apex Neverkink Heavy Duty Water Hose (Home Depot), at each site. Additionally, we trimmed plants using gardening shears to keep them within the plot boundary. The plots were weeded consistently throughout the period of data collection, with priority given to flowering weeds to prevent the presence of competitive resources within our gardens. We avoided weeding in the hour prior to data collection. Lastly, we generally avoided the use of herbicides, although Roundup was applied once in spring 2020 to the perimeter of the UHC site prior to the start of data collection.

2.4. Data Collection

We monitored insect pollinator visitors for two summers on days with suitable weather (i.e., no rain and wind speed less than 16 km/h). The start of data collection was delayed until all annuals could be planted, which was dependent upon their earliest delivery date (mid-July both years). Although a few perennials had begun to bloom, no plant was in full bloom before the start of data collection except catmint (see above). In year one, data collection began on 17 July 2020, and lasted for 13 weeks, ending on the first official day of frost for our region (10 October). We alternated between UHC and TRC each day, and we did not let a full week pass between visits to the same site. In year two, data collection began on 22 July 2021, and lasted for six weeks, ending on 27 August 2021.
We used the “Snapshot Method” to collect our data [30]. Briefly, for each round, we would start at a different, pre-selected random plot and walk through the garden in a team of two (MCP and JS), alternating our walking direction, either to go up or down plot numbers. At each plot, we determined quickly and simultaneously (<10 s) the number and identity of insects described to the lowest possible taxa that were active in each plot (i.e., plant replicate). Most of our plants were in bloom during our study (with some small exceptions, see above), and we only recorded insects that were on flowers, not flying nearby. One person performed the snapshot observation while the second person entered the data into an iPad or smartphone using a customized survey through ArcGIS Survey123 software. We repeated this process every hour (9 a.m. to 4 p.m.), except for noon to allow for a break, beginning at a different plot and swapping observer and recorder roles every hour. Having at least an hour in between each snapshot reduced the likelihood of pseudo-replication; however, because we did not mark or collect our insects, it is possible for the same insect to be counted more than once if that insect was making repeated foraging bouts on the same plant. This behavior would demonstrate a preference for that plant. In 2020, we usually completed six snapshots per day. In 2021, our observer was mostly working alone (MCP), and fewer than six snapshots per day were performed. Overall, we collected data on 34 days: 22 in 2020 and 12 in 2021.
We based our insect identification taxa categories on [30], with some adjustments to include insects native to our region and some additional identifications to order. We did not specifically differentiate between flower-visiting insects, a non-functional category, and insect pollinators, a functional category, even though we recognize that not every insect on a flower is contributing to its reproduction. We could identify six common insect species (Table 1), such as honey bees (Apis mellifera) and common eastern bumble bees (Bombus impatiens); however, other insects could only confidently be identified to the level of genus or family. However, we could not confidently identify wasps to the level of family or even superfamily, although most visitors were from Vespidae. We would record a visitor as “other insect” if we were uncertain about its identification. We opted not to collect the insects in our gardens because we did not want to deplete any populations at our sites. While we recognize the limiting aspect of our categories (Table 1), the insects as they are grouped are appropriate for this study because they reflect a trade-off between having enough taxonomic resolution to perform a diversity calculation while not requiring collection. Additionally, our identification is supported by precedent [30] and represents a level that would be sufficiently significant to an everyday gardener seeking to attract pollinators, which meets the overall objectives of this project.

2.5. Analysis

All analyses were performed in R version 3.6.3, R Foundation for Statistical Computing, Vienna, Austria [38]. For this study, we were interested in some descriptive data on specific groups and five questions. For our descriptive data, we began by summing the raw abundance per insect group per plant across the entire study. We also included the number of plots upon which these data were collected: If a plant grew normally in all four plot replicates at a site and was present at both sites in both years, then n = 16 for that plant (4 replicates * 2 sites * 2 years). Most of our plants (21 out of 25) fall into this category. For the remaining minority (4 out of 25), correcting by number of plots allows us to calculate, when appropriate, the weighted abundance of insects if, for example, a particular plant did not grow or was only present in one year (see above).
For our five questions, we firstly were interested in correlations in the abundance of some specific groups. In particular, we wanted to know how honey bee abundance related to (a) the abundance of all insects (excluding honey bees and flies), (b) bumble bees, (c) Lepidoptera, and (d) all bees excluding honey bees (e.g., wild bees). To do this, we analyzed the weighted abundance sums (Table 1) and performed Spearman’s rank correlations. For the figure, but not the statistical analysis, we removed petunias, as the zero abundance of honey bees on a log-scale axis made visualization difficult.
Secondly, we were interested in investigating the effect of ornamental landscape plants on insect abundance. To determine insect abundance, we integrated all insect abundances over the whole observation period (year). We then set this response, which is Poisson-distributed as count data, in relation to the main predictor variable: plant species. Because we were not interested in specific yearly or site (THC versus UHC) differences, we allowed plots within a site and year to have their own intercept in a generalized mixed-effect model of the Poisson family with a log-link using the lme4 package 1.1-26 [39].
Thirdly, we were interested in investigating the effect of ornamental landscape plants on insect diversity. We first calculated diversity based on our groups using both the Simpsons diversity index and the Shannon diversity index. The two were highly correlated (ρ = 0.77, p < 0.001), so we opted for the Shannon diversity index because we were not interested in differentiating populations between sites [40]. Because diversity data are asymptotically normal [41], we used a Gaussian mixed model (lmer).
For our fourth question, we were interested in whether native perennials, non-native perennials, or non-native annuals attracted the highest abundance or diversity of insect visitors. Unfortunately, we could not determine the independent contribution of native versus non-native and also perennials versus annuals because we did not have any native annuals (see above) and, therefore, could not model interactions. For this analysis, we combined the two variables into one, and we then used a mixed model similar to the one described above: We modeled abundance as a function of the combined native/lifespan variable, again allowing plots within site and year their own intercepts. In contrast to the above models, we also allowed each plant species to have their own intercepts. Then, similar to abundance, we again explored if native perennials and non-native perennials and non-native annuals attracted more or less diverse groups in a linear mixed-effect model. The model with plant species, plots within site, and year random effects indicated a “singular” fit, and we consequently removed plant species as a random effect [42].
Lastly, we explored the relationship between insect abundance and insect diversity by exploratively modeling Shannon diversity as an effect of log-transformed insect abundance (log(insect abundance + 0.001)) using a linear mixed-effect model with the same random-effect structure as above.
For all of the above models, we extracted the marginal means for the fixed-effect plant species ± asymptotic 95% confidence intervals using the emmeans package [43], version 1.7.4-1. Data and code for this project are available through Virginia Tech’s data repository and can be found at doi:10.7294/21529440.

3. Results

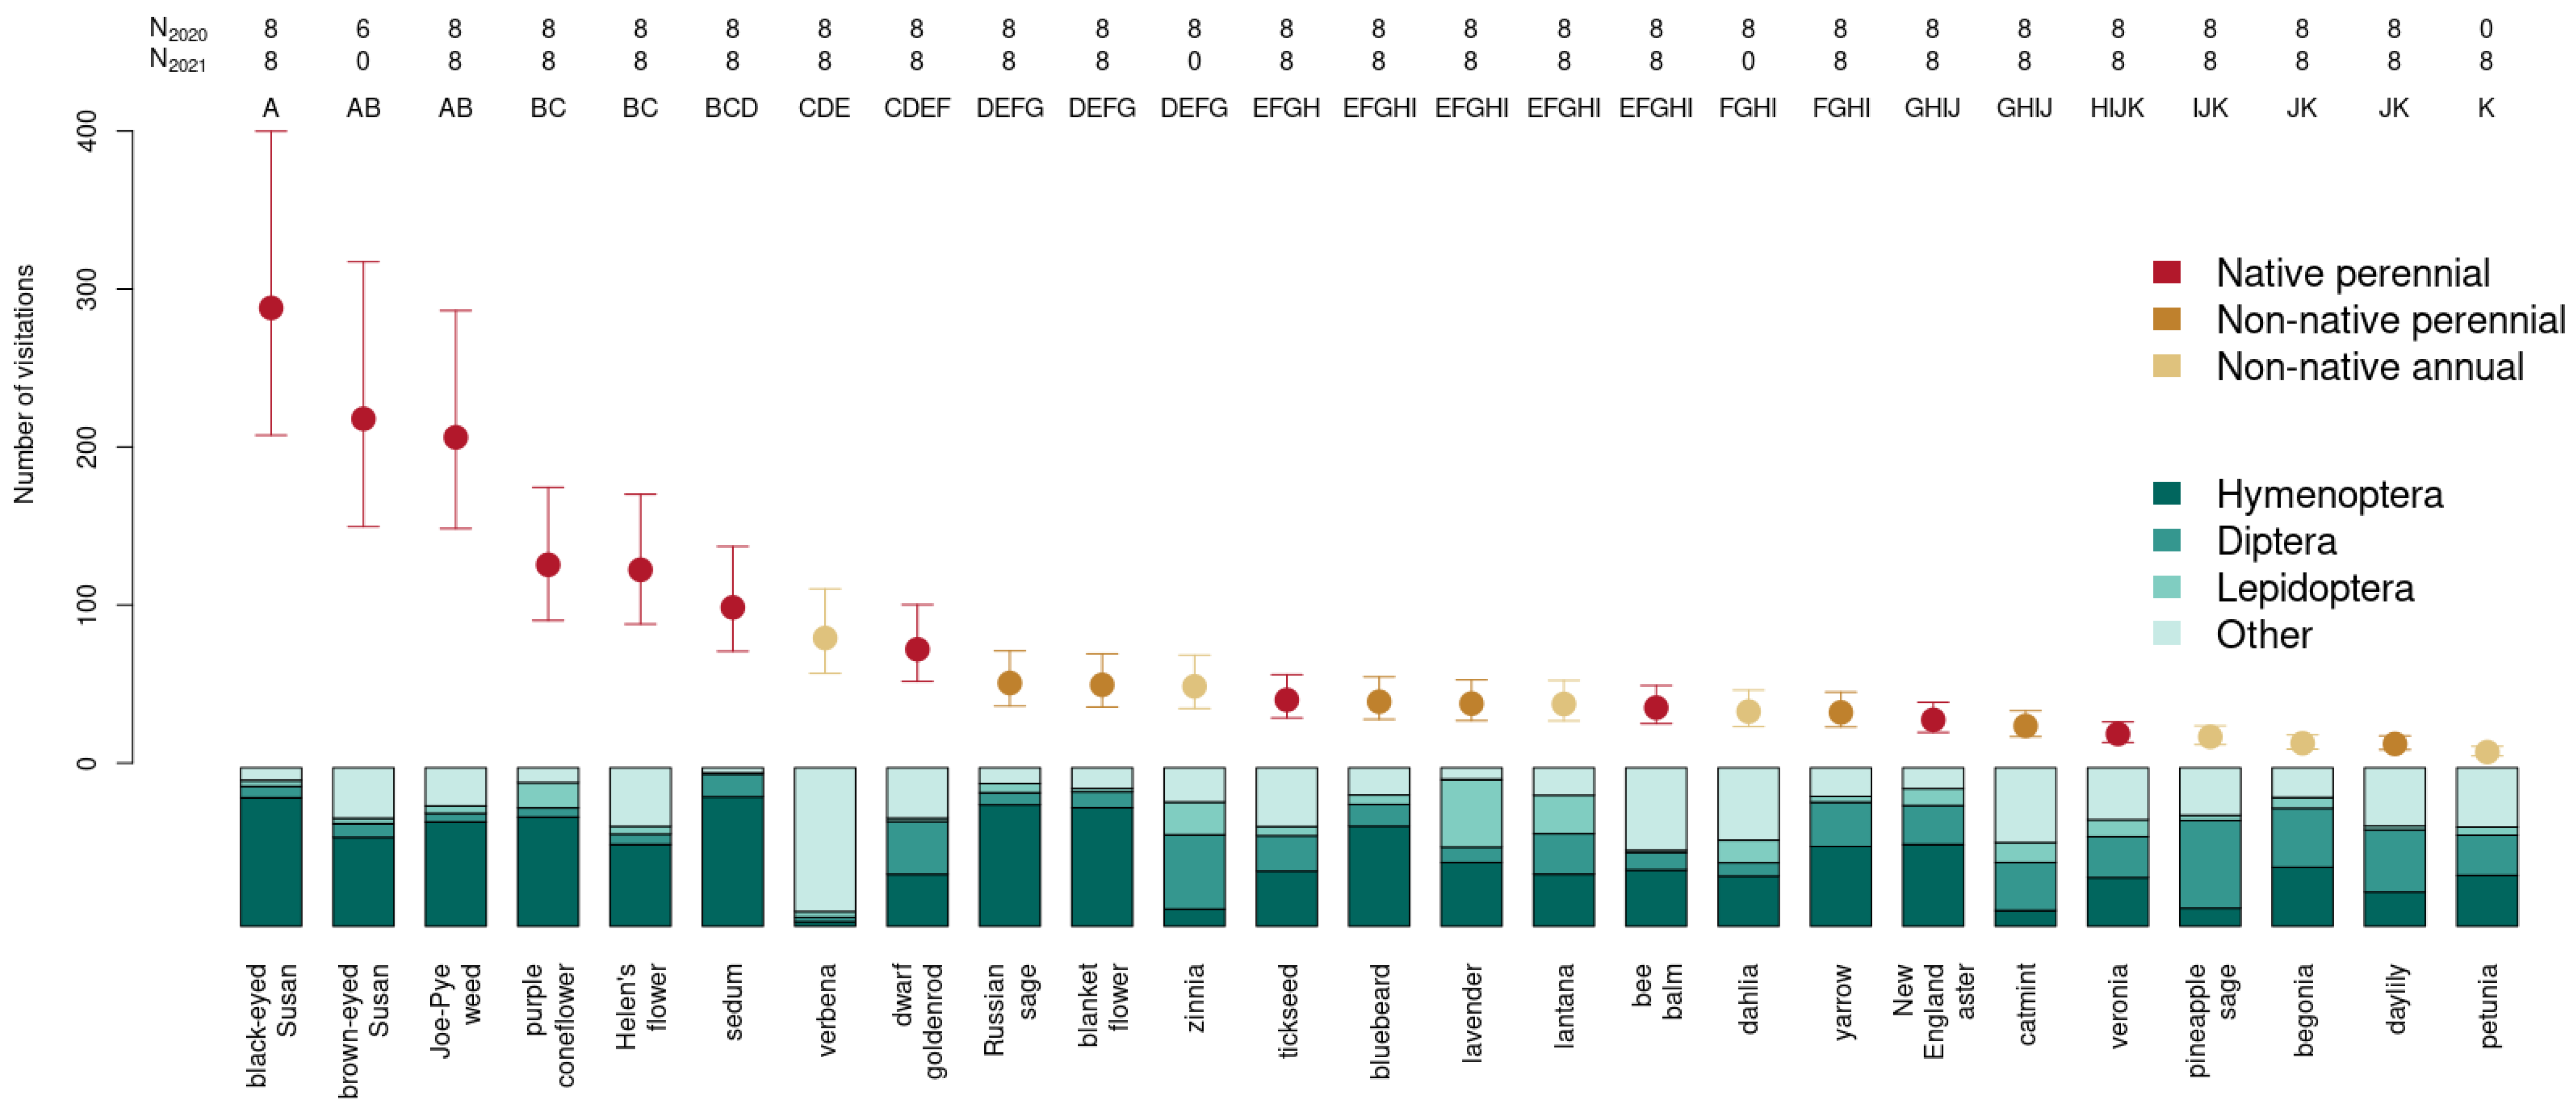
3.1. Insect Weighted Abundance across Plant Species

There was variation in weighted abundance for each insect group per plant across the entire study for both sites and both years (Table 1). We observed 26,804 insects in our study, a majority of whom were from the order of Hymenoptera. Within the Hymenopterans, 94% were bees, of which 18% were honey bees. Lepidoptera made up 7% of the insect visitors, with the families of Hesperiidae and Pieridae contributing to 54% and 17% of all Lepidopteran observations, respectively. We observed 13% Dipteran visitors, with more than half from the family Syrphidae. We also saw wasps (Hymenoptera), beetles (Coleoptera), and some grasshoppers and crickets (Orthoptera). There were insects that we were unable to categorize (“Other insects”, Table 1), but they were a small proportion of our data.
Table 1. Weighted counts of insects, grouped by the identification categories, per ornamental plant, and summed for all plots at both sites across both years. Plant species are grouped by whether they were native perennial, non-native perennial, or non-native annuals. N refers to the number of successful plots for that plant, where n = 16 indicates a plant that was present for both years and successfully grew in all four replicates at both sites. A total of 21 of our 25 plants fell into this category. Insect identification categories are ordered, from left to right, so that better resolved taxonomic categories to species or families come before the “Other” identifications for that order.
NApis MelliferaBombus BimaculatusBombus ImpatiensOther Bumble BeesXylocopa VirginicaAnthidium ManicatumOther wild BeesWaspsHoverfliesOther DipteraPapilionidaeLycaenidaeNymphalidaePieridaeHesperiidaeSphingidaeOther LepidopteraHemipteraPopillia JaponicaOther ColeopteraMantodeaOrthopteraOdonataOther Insects
Native Perennial
Joe-Pye weed1619601130660865117911001125947093699771235024
bee balm16320000171751027460000603482302517228
black-eyed Susan16190934437262212589703211760832461166118342
brown-eyed Susan65.3013.35.3001787368229.3109.30002.742.72.782.710001629.3821.32.7146.7
dwarf goldenrod16604000200183160241030121181366482120174
Helen’s flower166480112303501567630602480433097193307354
New England aster16117061001130536000053806342130514
purple coneflower167062420289723681351690131628702110473907128
sedum1631011117301287461101360202304360160202
tickseed1613000002112213523000012029118229822180
veronia1670210106667312010018016820140308
Non-native Perennial
blanket flower1663021701034013582700031302780828012
bluebeard16102025311411505862701222170997019110310
catmint169030161851151203028191223037142121
daylily1680100029630500000500440160707
lavender164445294716735570101561040723061907
Russian sage1632801331281527777080001929395008171320
yarrow163001021738711335010060124301203324
Non-native Annual
begonia1640210015415724000390324080800
dahlia8720102001182144002227808210030614032
lantana161660000031367892109810555711321759
petunia8000000380201000006002401001000
pineapple sage162100010941815200032145601608011
verbena1621010011163370001632021109010050147
zinnia8140200052261242860001213603210045408218

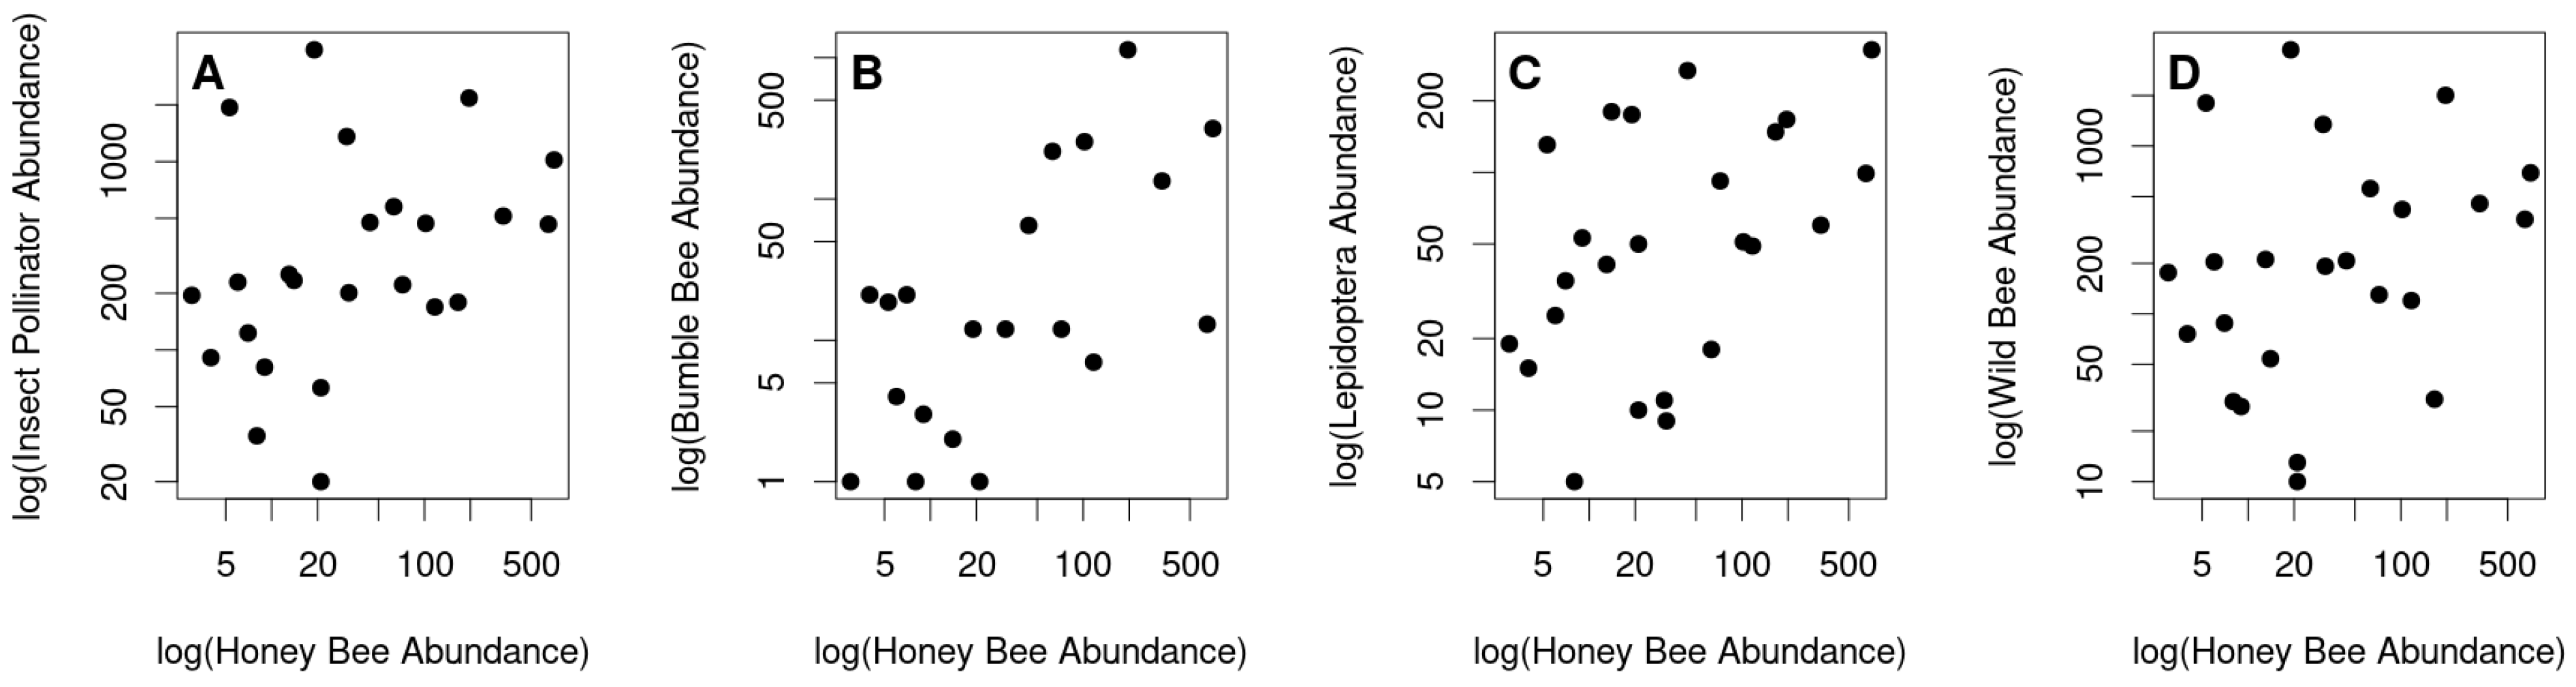
3.2. Honey Bee Abundance Correlates with Other Insect Pollinator Abundance

The abundance of honey bees on a plant is positively correlated with the sum of other flower-visiting insect abundances (Spearman’s rank correlation, ρ = 0.42, p = 0.037, Figure 2A), a relationship driven by correlations between honey bee and bumble bee abundances (ρ = 0.43, p = 0.034, Figure 2B) and honey bees and Lepidopterans (ρ = 0.49, p = 0.012, Figure 2C), but not honey bees and all wild bees in general (ρ = 0.35, p = 0.09, Figure 2D).

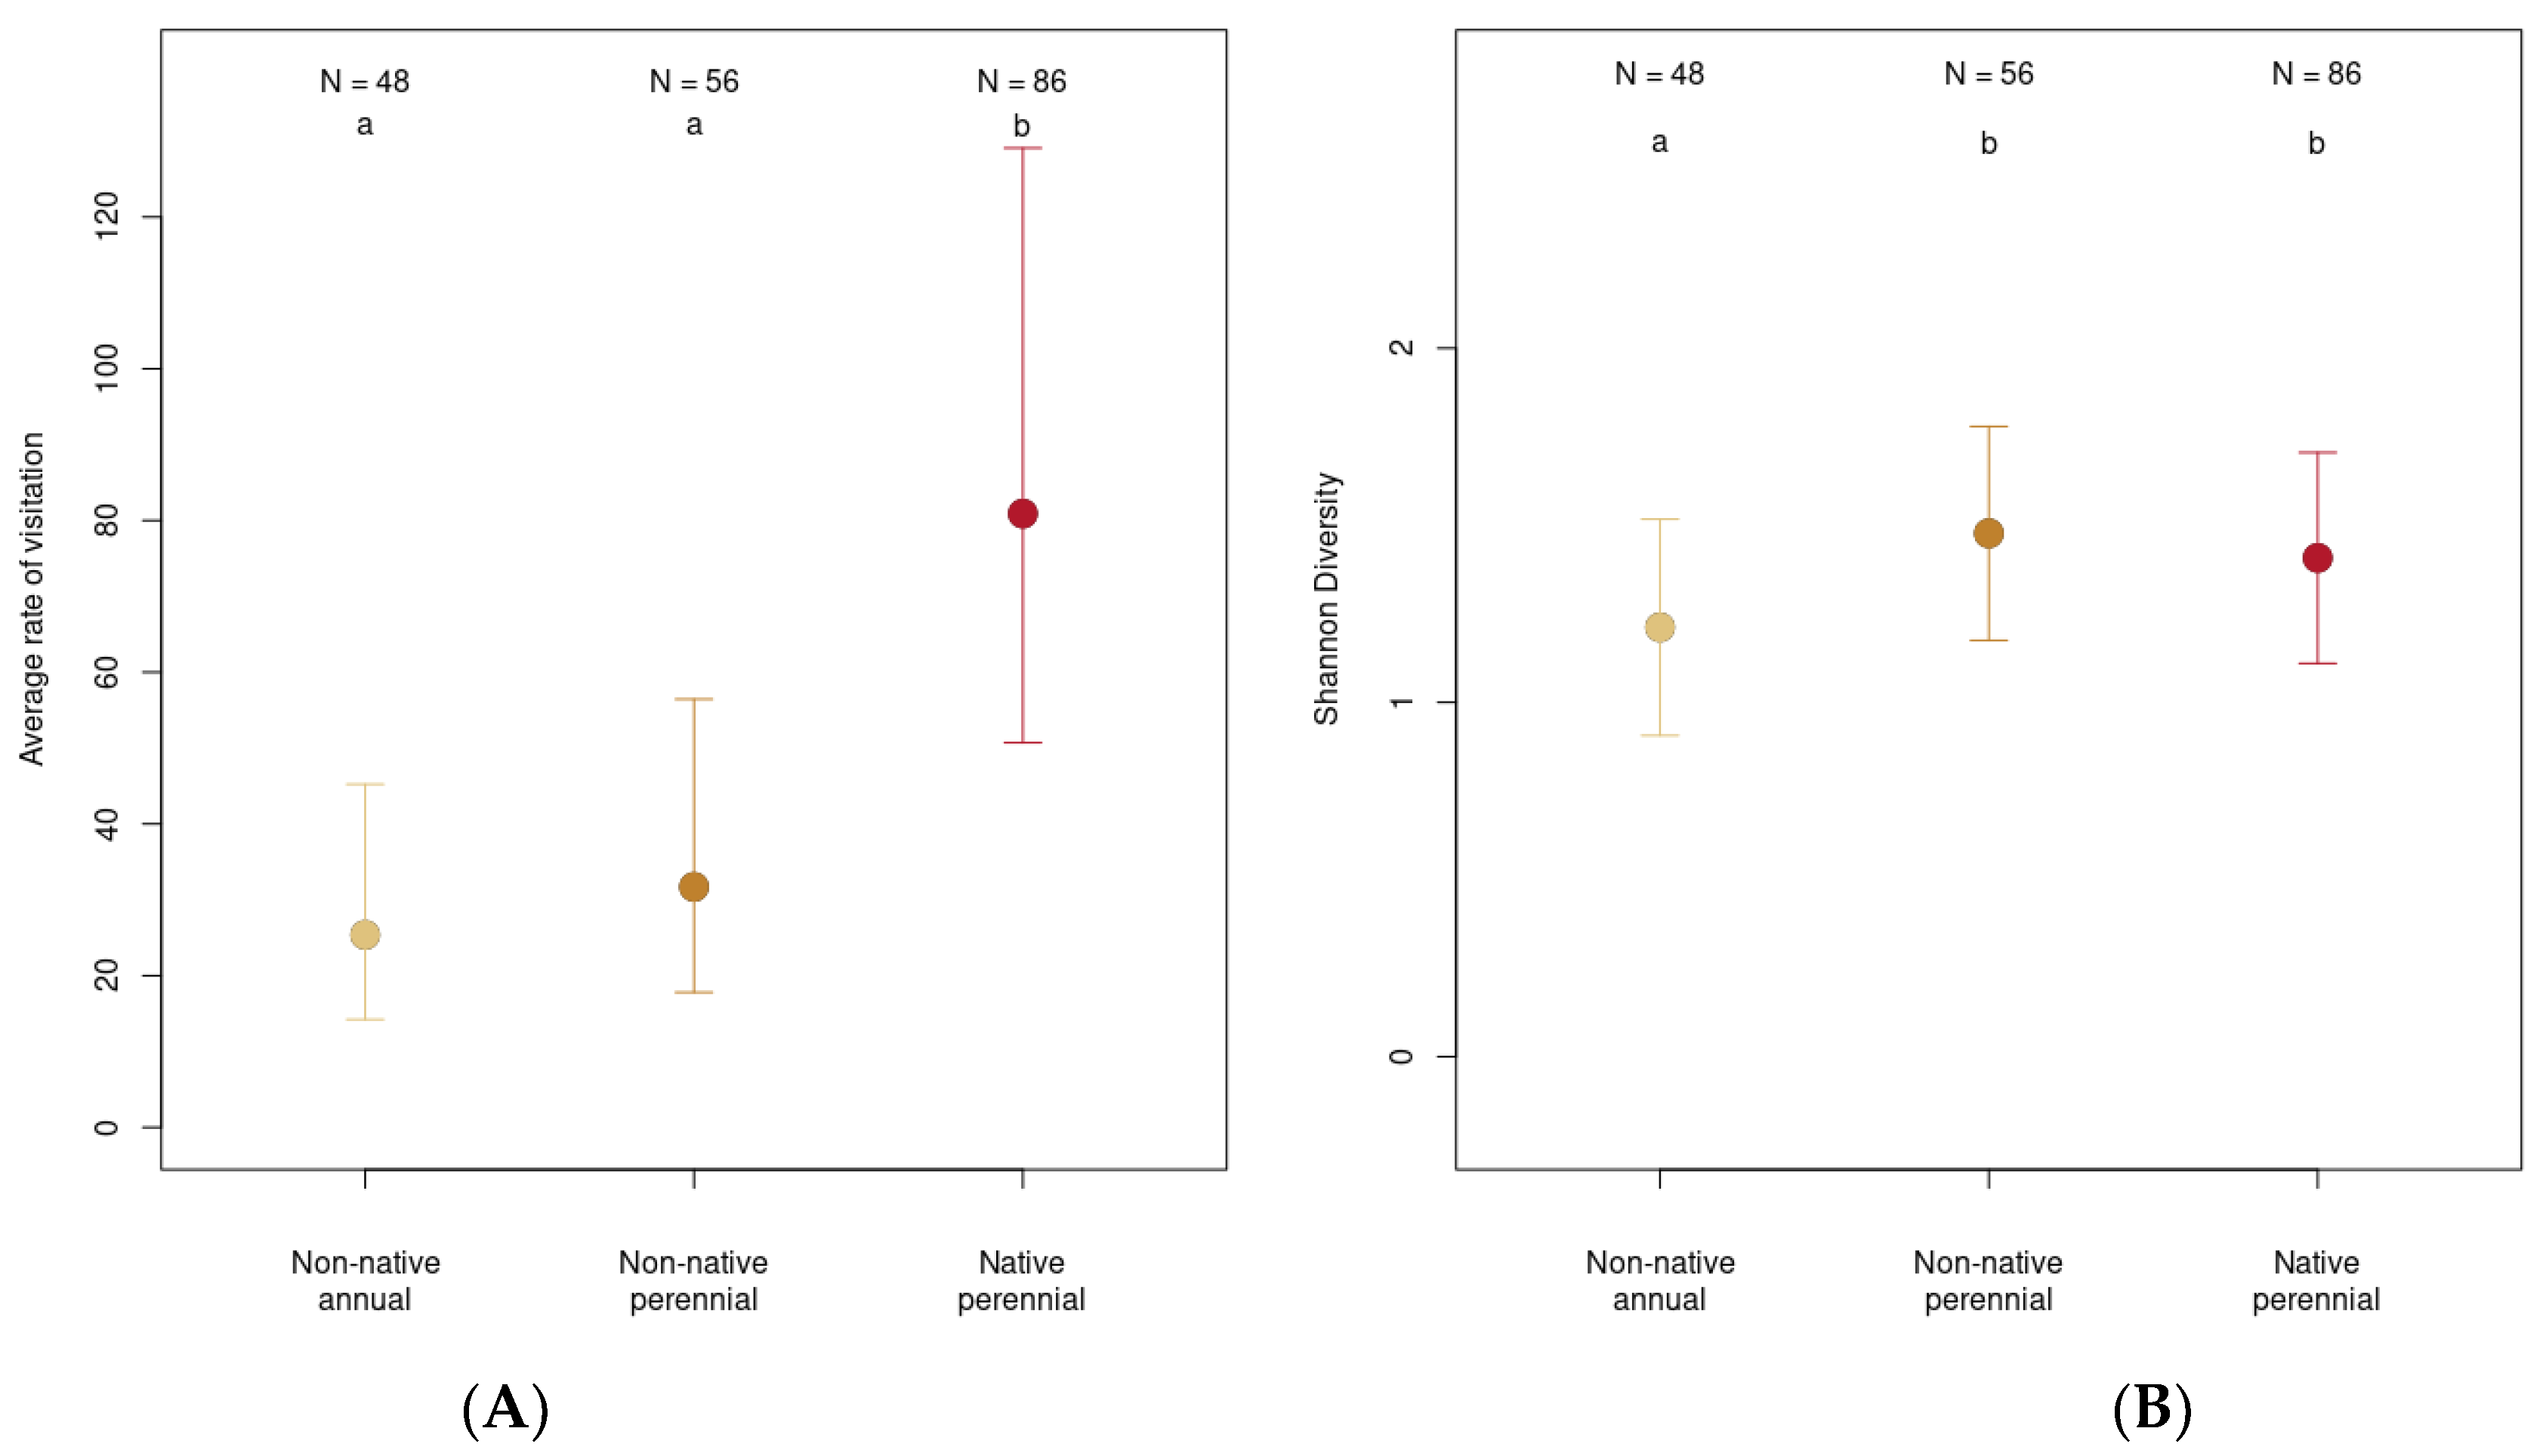
3.3. Choice of Ornamental Garden Plants Significantly Impacts Insect Abundance

There is a significant effect of plant species on the number of insect visitors to that species (likelihood ratio test: χ2 = 299, df = 24, p < 0.001; Figure 3). Abundance ranged from the most visited plant, black-eyed Susan (yearly mean number of insects per plot (95% CI): 288 (207 to 400)), to the least visited plant, petunia (7 (5 to 11); Figure 3). This makes a 41.62-fold (95% CI: (15.97 to 108.46); p < 0.001) difference between the two.
Our six most visited plants, black-eyed Susan, brown-eyed Susan, Joe-Pye weed, purple coneflower, Helen’s flower, and sedum, all received, on average, more than 90 visitors per plot (Figure 3), with the top three (black-eyed Susan, brown-eyed Susan, and Joe-Pye weed) determined to be highly attractive, with 200+ visitors per plot across the year. In contrast, our post hoc analysis revealed that the bottom-ranked five species of plants (veronia, pineapple sage, begonia, daylily, and petunia) did not significantly differ from each other and, on average, received less than 20 insect visitors per plot over the year.
Visitor proportion qualitatively varied with plant species. For example, Hymenopterans were the most represented class of insect visitors, comprising 57% of all our insect observations and were the most common visitors to the six highest ranked plants in our abundance calculations (dark teal bar blocks, Figure 3). Hymenopterans continued to be highly represented within the middle-ranking plants as well. Plants that ranked towards the bottom in visitor abundance tended to have more Diptera (flies, lighter teal bar blocks) and “other” visitors (lightest bar blocks). Some plants attracted a single order of insect visitors, such as black-eyed Susan, sedum, Russian sage, and blanket flower, all of which attracted mostly Hymenopterans (Figure 3). Other plants attracted two different classes, such as bee balm (Hymenopteran and “Other”) and lavender (Hymenopteran and Lepidopteran). Lastly, a few plants displayed visitor proportions that were largely equal across the four orders of visitors, such as zinnia, lantana, dahlia, catmint, and veronia (Figure 3, bar blocks).
Insect abundance visually appears to be affected by whether the plants were a native perennial, non-native perennial, or non-native annual (Figure 3, datapoints by color). In particular, the six highest ranked plant species for attracting an abundance of flower visitors were native perennials (black-eyed Susan, brown-eyed Susan, Joe-Pye weed, purple coneflower, Helen’s flower, and sedum, Figure 3, dark red datapoints). In contrast, the most visited non-native annual, verbena, was ranked seventh for abundance, and the most visited non-native perennial, Russian sage, was ranked ninth. We investigate this more formally below.

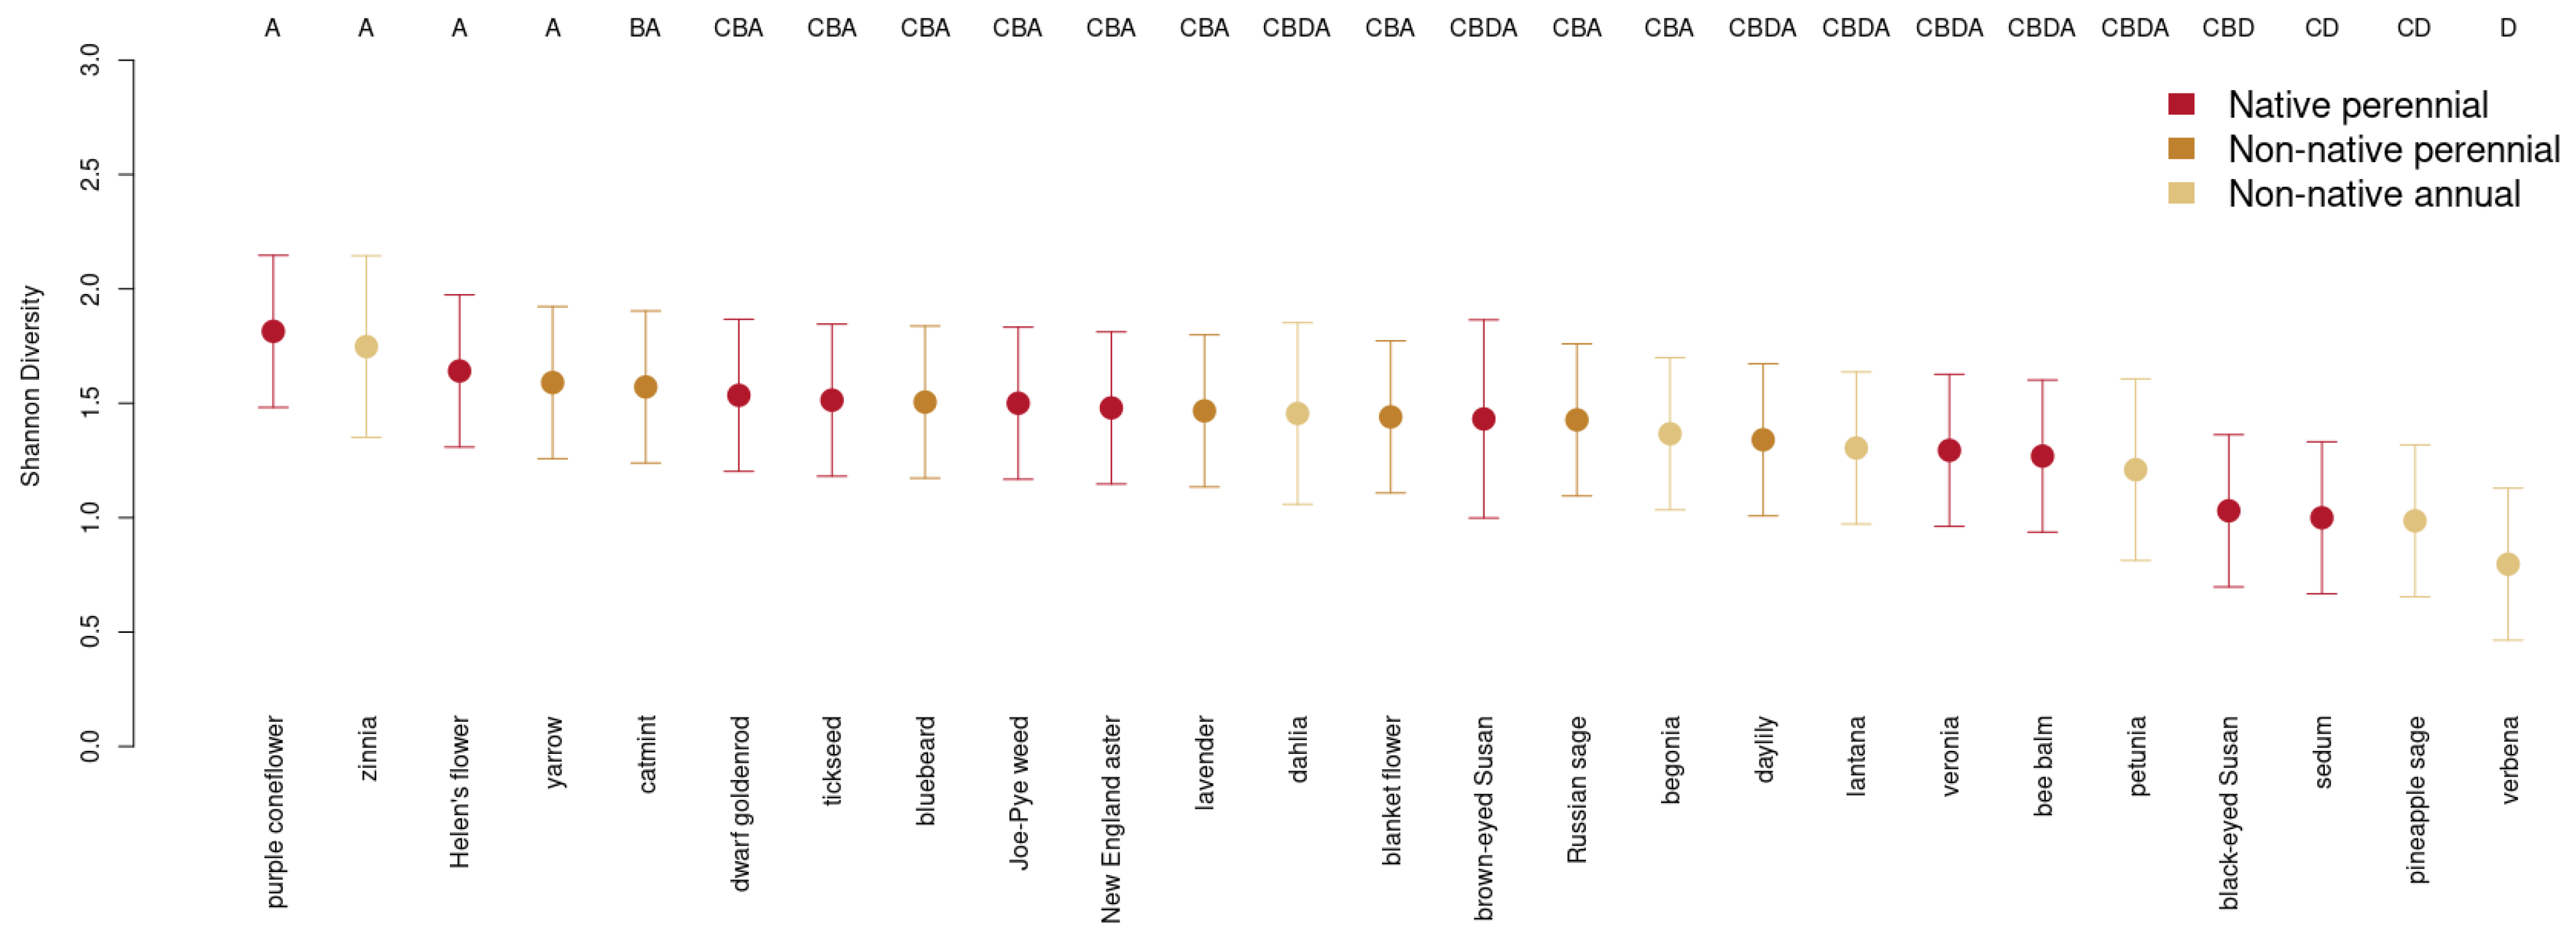
3.4. Choice of Ornamental Garden Plant Significantly Impacts Insect Diversity

There is a significant effect of plant species on the diversity (as determined by the Shannon index) of insect visitors across the foraging year (likelihood ratio test: χ2 = 102, df = 24, p < 0.001; Figure 4). Shannon diversity ranged from the most diverse plant, purple coneflower (yearly mean diversity per plot (95% CI): 1.81 (1.48 to 2.15)), to the least diverse plant, verbena (0.80 (0.46 to 1.13); Figure 4). In other words, the most diverse and the least diverse plant species differed by 1.02 index points (95% CI: (0.46 to 1.58); p < 0.001), or approximately 2.3-fold.
Unlike abundance, we did not initially observe qualitative differences in the diversity of insect visitors to native perennials, non-native perennials, and non-native annuals, which were distributed throughout the graph (datapoints by color, Figure 4). We investigate this more formally in the next section.

3.5. Native Perennials Brought Insect Abundance and Non-Native and Native Perennials Brought Insect Diversity

Native perennial plants attracted the greatest abundance of visitors (mean number of visitors: 80.9 (50.7 to 129.1)), followed by non-native perennials (31.7 (17.8 to 56.4)) and non-native annuals (25.4 (14.2 to 45.2); Figure 5A). In other words, native perennials were visited 3.19 times (1.35 to 7.53) more often compared to non-native annuals and 2.55 times (1.08 to 6.02) more often compared to non-native perennials. Non-native perennials and non-native annuals did not significantly differ between each other. The overall differences among the three groups were significant (χ2 = 10, df = 2, p = 0.007, Figure 5A).
Non-native perennial plants attracted the greatest diversity of visitors (mean diversity: 1.5 (1.2 to 1.8)), followed by native perennials (1.4 (1.1 to 1.7)) and non-native annuals (1.2 (0.9 to 1.5); Figure 5B). In other words, non-native annuals were about -0.27 (-0.43 to -0.10) index points less diverse compared to non-native perennials and -0.20 (-0.34 to -0.05) index points less diverse than native perennials. Post hoc analysis demonstrates no significant difference between non-native perennials and native perennials, but both differed from non-native annuals. The overall differences among the three groups were significant (χ2 = 15, df = 2, p < 0.001, Figure 5B).

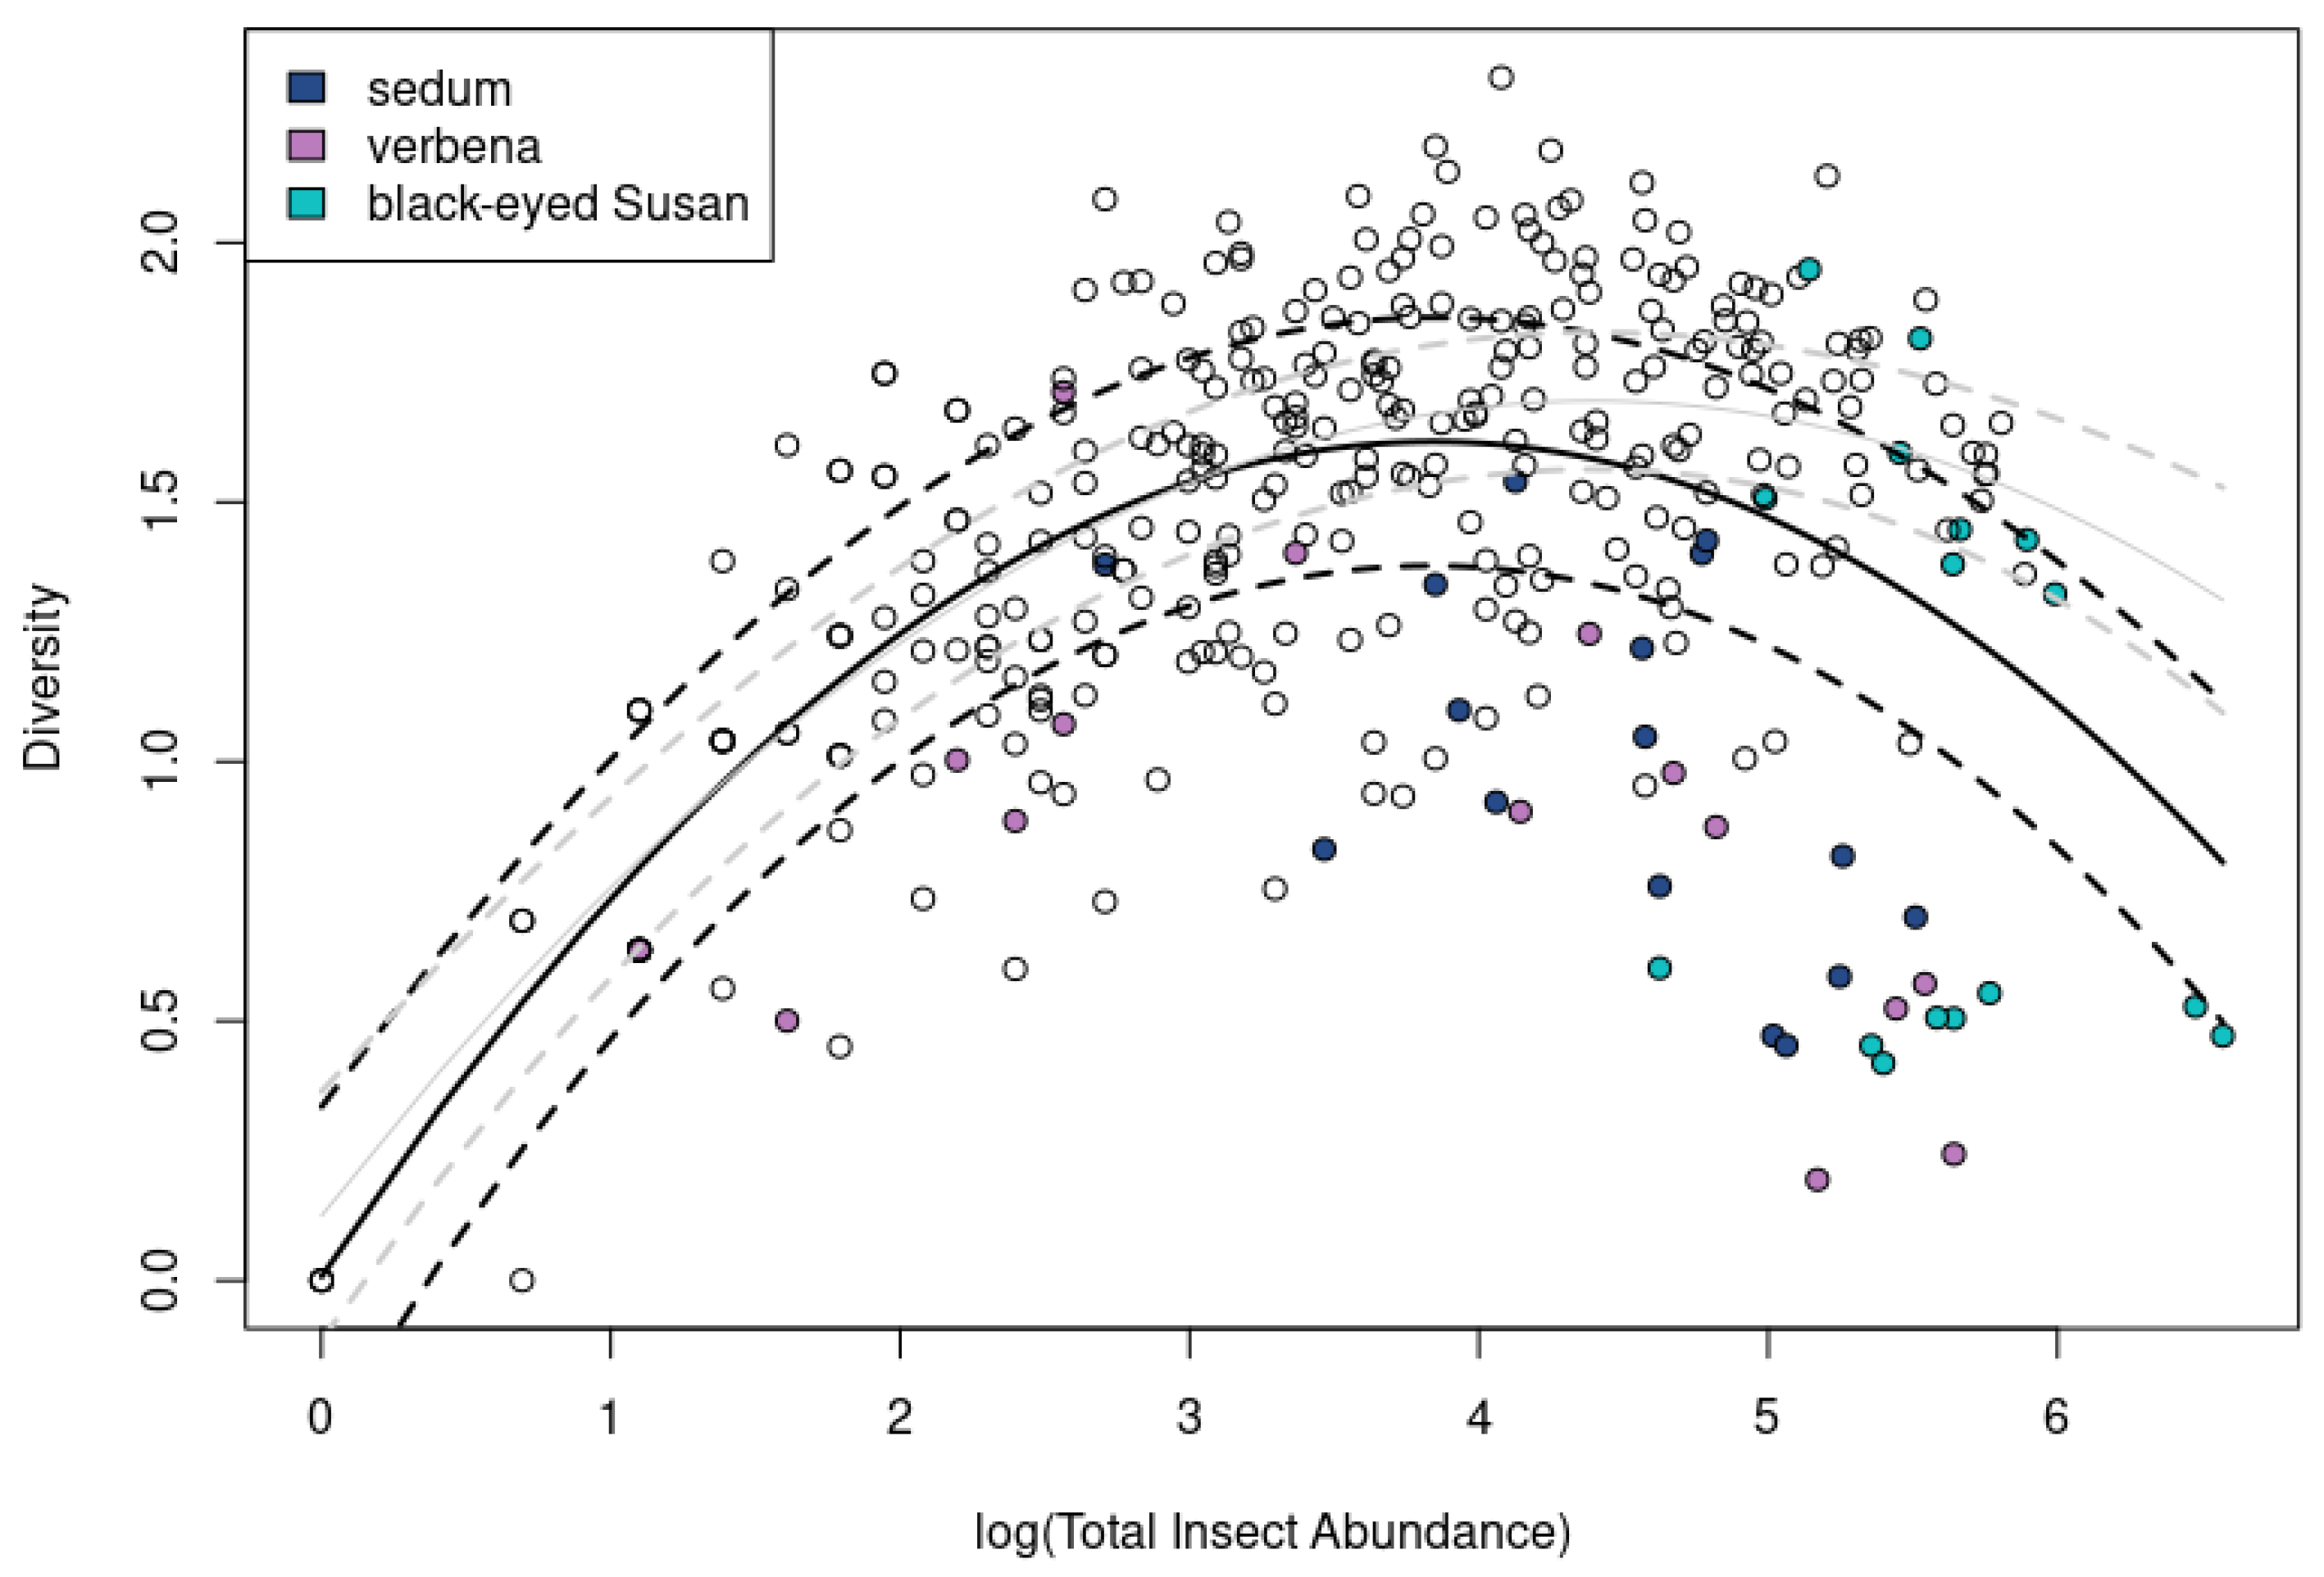
3.6. Insect Diversity Possesses a Curvilinear Relationship to Insect Abundance

Exploratory plots of diversity versus insect abundance revealed a curvilinear relationship: plant species with medium abundance possessed the highest diversity. Plants with either low or high abundance possessed the lowest diversity. An exploratory model with a quadratic term for log(abundance) confirmed the relationship (LRT on effect of quadratic term: χ2 = 117, df = 1, p < 0.001, Figure 6).
When we inspected Table 1, we saw that a few plant species that initially appeared to drive the curvilinear relationship, namely black-eyed Susan, sedum, and verbena, where some of their plots experienced low diversity at high abundances, were characterized by high numbers of groups that were collections of species (“Other wild bees” or “Hemiptera”) and might, therefore, mask diversity. However, when these plants are removed from the analysis, the curvilinear relationship remains significant (LRT on effect of quadratic term: χ2 = 81, df = 1, p < 0.001; Figure 6).

4. Discussion

Here we have shown that the selection of ornamental plants can have large impacts on the abundance and diversity of the flower-visiting insects, including pollinators, that visit gardens. Honey bee abundance positively correlated with the abundance of other flower-visiting insects, although not specifically with wild bees (Figure 2). The abundance of flower-visiting insects varied 42-fold and the diversity of flower-visiting insects varied by over 1 diversity point between the least and most attractive of our 25 ornamental landscape plants (Figure 3 and Figure 5). Native perennials outperformed non-native perennials and non-native annuals in attracting insect pollinators, and native perennials performed similarly to non-native perennials in attracting a higher diversity of visitors compared to non-native annuals (Figure 4). Across our 25 plants, diversity displayed a quadratic relationship to abundance, where the plants attracting a medium abundance of insects were the ones with the highest diversity (Figure 6).
Most of the insect visitors to our two experimental gardens belonged to the pollinating species-rich orders of Hymenoptera (bees, ants, and wasps), Lepidoptera (moths and butterflies), Coleoptera (beetles), and Diptera (flies) [44]. Our study additionally saw representation from Hemiptera (true bugs), Orthoptera (grasshoppers and crickets), and some unidentified insects. Bees, both managed and wild, were very common in our gardens, which largely accounts for the high proportional abundance of Hymenopterans in our data (Table 1, Figure 2 and Figure 3). Bees are immensely important in agriculture, with honey bees, bumble bees, and other bees ranked as the top three taxa of importance to crop production [45,46]. Additionally, bees are some of the most affected by insect declines [1,4,5,47], making their conservation of critical importance. Pollinator gardens may offer refuge to bees, providing foraging resources and nesting habitats [19,22,23,48,49].
Because we were unable to include native annuals in our study, we could not model the impact of native versus non-native and annual versus perennials and instead could only look at our three categories, where we saw that native perennials attracted the highest abundance of insects compared to non-native perennials and non-native annuals, and that non-native and native perennials similarly attracted the most diverse insects compared to non-native annuals (Figure 4). Visually, it appears that perennials, overall, outperform annuals, and natives might be better than non-natives for abundance but not for diversity, though we were unable to test for these issues specifically. Previous work shows that native plants usually do outperform non-native plants in attracting an abundance [50,51,52] of diverse [31] insects, although, see [53,54].
Other studies have generally characterized perennials as better than annuals at attracting insects, especially from bee families [52,55,56,57,58]. This effect may be because multi-year perennials tend to accumulate more resources, which can then be distributed to pollinator rewards [55,59,60]. Additionally, native perennial flowering plants are beneficial in agricultural settings, outperforming non-native annuals in increasing the abundance of beneficial insects [61]. However, it is important to note two things about annuals. Firstly, many annuals were initially bred to provide long-term color aesthetics and not to attract pollinators, so some may possess little or no foraging resources (pollen or nectar) for flower-visiting insects, even though they have the benefit of being some of the easiest plants to grow [62]. For example, “double” flowers, or varieties of flowers with extra petals such as zinnia “Double Zahara”, are often highly bred for human aesthetic appeal and are not accessible to pollinators [63,64]. Because annuals are often preferred for their ornamental value, their addition within gardens should be carefully balanced against more rewarding plants to provide foraging resources for bees. Secondly, some annuals do in fact provide ample pollen and nectar and, likewise, can be highly attractive to insects [52,65], especially later in the foraging season [66]. Taken together, our work and the previous studies demonstrate that evaluating the impacts of being native or non-native and of lifespan (perennial versus annual) are complicated and requires further investigation.
We saw in our data a quadratic, or curvilinear, relationship between abundance and diversity, where plants that attracted low and high abundances of insects tended to bring less diverse insect visitors, and plants with a medium abundance of insect visitors possessed the highest diversity (Figure 6). At first, we suspected this relationship was an artifact of our insect identification categories, where some plants with high abundance and low diversity (verbena, sedum, black-eyed Susan) coincidentally also possessed many visits from “Other wild bees” (Table 1) of unknown identity. This might mean that the plant possessed a higher diversity than we calculated with our indices that was masked by our group identifications, and the curvilinear relationship would be replaced with a linear one. However, the significance of the curvilinear relationship was maintained even when we explored the removal of these potentially problematic plants. Therefore, we considered two possible explanations for these data. It may be that a very high abundance of insects might repel certain taxa, which could decrease diversity. Alternatively, perhaps this parabola is driven by the presence of more specialist plant–pollinator relationships, attracting a low diversity and high abundance of insects, which would, therefore, change if our study included a different assemblage of plants and pollinators.
One limitation of our study is that it was necessarily conducted with a limited sample of 25 plants, which is a small fraction of what is available to gardeners [67,68]. Insect pollinator visitation would change with different plant species or even cultivars within the same species [30,31]. Additionally, some early-season bees, such as Bombus sp. or Osmia sp., would benefit less from our plants, which were chosen to bloom in mid-summer. What, then, could be some general take-homes from these data? Firstly, this study further supports [30], in that quantifying how “attractive” a plant is to flower-visiting insects can be accomplished by surveying the abundance and diversity of insects on plants with a simple method. Secondly, our results show that choices within a garden can have an impact on supporting flower-visiting insects, as we saw a 42-fold difference in abundance between our most and least visited plants. Because we selected our study plants with growth ease and practicality in mind, we hope that these data might be a useful contribution to everyday gardeners and interest groups. Lastly, because we have included insect counts per plant (Table 1), we hope that readers might customize their plant choices to suit a particular suite of insects.
Honey bees are often considered foraging generalists [69]. For this reason and because of their unique communication behavior, which allows scientists to determine where in the landscape a honey bee has collected food [70,71] and can be combined with palynology for plant identification [6,72,73], it has been suggested that honey bees might act as bioindicators, providing biologically relevant information about the availability of foraging resources not just for them, but for all insect pollinators [74,75]. Here, we have shown that honey bee abundance is, in fact, positively correlated with the abundance of other insect pollinators (Figure 2). Upon closer examination, this correlation appears to be driven by the relationship between honey bees and bumble bees and honey bees and butterflies, but not, notably, between honey bees and wild bees, which might limit the usefulness of resulting Best Management Practice recommendations based on honey bee data alone. Although we did not test specific mechanisms to explain this correlation, there is evidence to suggest that honey bees might outcompete wild bees [76,77,78], especially in resource-limited settings, contributing to high niche overlap [79]. However, such a competitive exclusion may, of course, also occur where honey bees are outcompeted by another, larger bee [80]. Our experimental gardens were within the foraging range of honey bee hives, so it is unclear what impact fewer honey bees would have on our insect visitation data.
Insects are generally active from spring until fall, and so it is important for pollen and nectar to be available to them throughout their foraging season. Springtime, when most plants and trees are in bloom, is thought to be a time of year when food for pollinators is in abundance [6,81,82,83]. In some temperate regions, summertime might represent a foraging gap [6,81,84,85] and provide an opportunity for gardens to feed hungry insect pollinators.
Insect pollinators are attracted to plants by many interacting floral traits [45,60,63]. Recently, it was shown that the traits that most reliably influenced pollinator attraction are flower color, display area, and morphology, which coincidently are also the same traits usually selected for in the development of plant cultivars [86]. Overall, the interplay of these attracting characteristics with the productivity of a flower in providing nectar and/or pollen will determine who, how often, and for how long a flower-visiting insect will be on a flower. Here, we have bypassed the more proximate investigations of pollinator attraction and instead focused more directly on what plants bring an abundance and diversity of insects to gardens.
In summary, although many gardeners may wish to prioritize “bee-friendly” plants in their gardens [17], sometimes it is difficult for them to make informed decisions, especially as previous studies evaluating ornamental landscape plants are necessarily limited in geography and scope [25,28,30,31,32,87]. We present data for 25 common landscaping ornamental plants, which can be referenced in developing recommendation lists of pollinator-friendly plants. We have shown that careful selection of plants such as black-eyed Susan, brown-eyed Susan, Joe-Pye weed, purple coneflower, and Helen’s flower will bring an abundance of insects to a garden, while purple coneflower, zinnia, Helen’s flower, and yarrow will attract a diversity of insects. Although the plant options might differ with region and geography, it should be possible to prioritize plants that attract visitors within a garden without sacrificing aesthetics. Additionally, our table on insect counts will allow for selections of plants with specific insect taxa in mind. Overall, these results show that pollinator gardens can be optimized for flower-visiting insects using data-driven plant selection decisions while still maintaining visual appeal for gardeners.

Supplementary Materials

The following supporting information can be downloaded at: https://www.mdpi.com/article/10.3390/horticulturae8111068/s1, Figure S1: Plant Varieties Information.

Author Contributions

Conceptualization, M.J.C.; methodology, M.J.C., M.E.O. and M.C.P.; validation, R.S.; formal analysis, R.S. and M.J.C.; data collection, M.C.P. and J.S.; data curation, R.S.; writing—original draft preparation, M.C.P. and M.J.C.; writing—review and editing, M.J.C., M.E.O. and R.S.; visualization, R.S.; supervision, M.J.C. and M.E.O.; project administration, M.J.C. and M.C.P.; funding acquisition, M.J.C. All authors have read and agreed to the published version of the manuscript.

Funding

This research was supported by a charitable donation from Kaeser Compressors, Fredericksburg, Virginia, USA, to MJ Couvillon to commemorate the 100th anniversary of their parent company, Kaeser Kompressoren of Coburg, Germany; and by the National Institute of Food and Agriculture (# VA-160097 to MJ Couvillon.

Data Availability Statement

All data and code will be made available through Virginia Tech’s data repository and can be found at doi:10.7294/21529440.

Acknowledgments

We are grateful to Mike Goatley and Jonathan Dickerson at the Turfgrass Research Center; John James at the Virginia Tech Urban Horticulture Center; Holly Scoggins for her assistance with plant selection and experimental set-up; and Velva Groover for her help with garden maintenance. We thank Mary Silliman, Taylor Steele, Brad Ohlinger, Chad Campbell, Laura McHenry, Raven Larcom, Morgan Malone, Jason Bielski, Hannah Wojtysiak, Rebecca Geisler, and Cyrus Li for their help planting our gardens. We also thank Parry Kietzman and Chris McCullough for their helpful comments on an earlier version of this work. Lastly, we gratefully acknowledge the Virginia Tech’s Open Access Subvention Fund (OASF) for supporting the pub-lication of this work.

Conflicts of Interest

The authors declare no conflict of interest. The funders had no role in the design of the study; in the collection, analyses, or interpretation of data; in the writing of the manuscript; or in the decision to publish the results.

References

  1. Burkle, L.A.; Marlin, J.C.; Knight, T.M. Plant-pollinator interactions over 120 years: Loss of species, co-occurrence, and function. Science 2013, 339, 1611–1615. [Google Scholar] [CrossRef] [PubMed] [Green Version]
  2. Hallmann, C.A.; Sorg, M.; Jongejans, E.; Siepel, H.; Hofland, N.; Schwan, H.; Stenmans, W.; Müller, A.; Sumser, H.; Hörren, T.; et al. More than 75 percent decline over 27 years in total flying insect biomass in protected areas. PLoS ONE 2017, 12, e0185809. [Google Scholar] [CrossRef] [Green Version]
  3. Hallmann, C.A.; Ssymank, A.; Sorg, M.; de Kroon, H.; Jongejans, E. Insect biomass decline scaled to species diversity: General patterns derived from a hoverfly community. Proc. Natl. Acad. Sci. USA 2021, 118, e2002554117. [Google Scholar] [CrossRef]
  4. Kosior, A.; Celary, W.; Olejniczak, P.; Fijał, J.; Król, W.; Solarz, W.; Płonka, P. The decline of the bumble bees and cuckoo bees (Hymenoptera: Apidae: Bombini) of Western and Central Europe. Oryx 2007, 41, 79–88. [Google Scholar] [CrossRef] [Green Version]
  5. Sánchez-Bayo, F.; Wyckhuys, K.A.G. Worldwide decline of the entomofauna: A review of its drivers. Biol. Conserv. 2019, 232, 8–27. [Google Scholar] [CrossRef]
  6. Carr-Markell, M.K.; Demler, C.M.; Couvillon, M.J.; Schürch, R.; Spivak, M. Do honey bee (Apis mellifera) foragers recruit their nestmates to native forbs in reconstructed prairie habitats? PLoS ONE 2020, 15, e0228169. [Google Scholar] [CrossRef] [PubMed] [Green Version]
  7. Albrecht, M.; Kleijn, D.; Williams, N.M.; Tschumi, M.; Blaauw, B.R.; Bommarco, R.; Campbell, A.J.; Dainese, M.; Drummond, F.A.; Entling, M.H. The effectiveness of flower strips and hedgerows on pest control, pollination services and crop yield: A quantitative synthesis. Ecol. Lett. 2020, 23, 1488–1498. [Google Scholar] [CrossRef]
  8. Fitch, G.; Wilson, C.J.; Glaum, P.; Vaidya, C.; Simao, M.-C.; Jamieson, M.A. Does urbanization favour exotic bee species? Implications for the conservation of native bees in cities. Biol. Lett. 2019, 15, 20190574. [Google Scholar] [CrossRef]
  9. Hopwood, J.L. The contribution of roadside grassland restorations to native bee conservation. Biol. Conserv. 2008, 141, 2632–2640. [Google Scholar] [CrossRef]
  10. Meyer, S.; Unternährer, D.; Arlettaz, R.; Humbert, J.-Y.; Menz, M.H. Promoting diverse communities of wild bees and hoverflies requires a landscape approach to managing meadows. Agric. Ecosyst. Environ. 2017, 239, 376–384. [Google Scholar] [CrossRef]
  11. Wilson, C.J.; Jamieson, M.A. The effects of urbanization on bee communities depends on floral resource availability and bee functional traits. PLoS ONE 2019, 14, e0225852. [Google Scholar] [CrossRef] [Green Version]
  12. Winfree, R.; Bartomeus, I.; Cariveau, D.P. Native pollinators in anthropogenic habitats. Annu. Rev. Ecol. Evol. System. 2011, 42, 1–22. [Google Scholar] [CrossRef] [Green Version]
  13. Buri, P.; Arlettaz, R.; Humbert, J.-Y. Delaying mowing and leaving uncut refuges boosts orthopterans in extensively managed meadows: Evidence drawn from field-scale experimentation. Agric. Ecosyst. Environ. 2013, 181, 22–30. [Google Scholar] [CrossRef]
  14. Buri, P.; Humbert, J.-Y.; Arlettaz, R. Promoting pollinating insects in intensive agricultural matrices: Field-scale experimental manipulation of hay-meadow mowing regimes and its effects on bees. PLoS ONE 2014, 9, e85635. [Google Scholar] [CrossRef] [Green Version]
  15. Larson, J.L.; Kesheimer, A.J.; Potter, D.A. Pollinator assemblages on dandelions and white clover in urban and suburban lawns. J. Insect Conserv. 2014, 18, 863–873. [Google Scholar] [CrossRef]
  16. Garbuzov, M.; Fensome, K.A.; Ratnieks, F.L.W. Public approval plus more wildlife: Twin benefits of reduced mowing of amenity grass in a suburban public park in Saltdean, UK. Insect Conserv. Divers. 2015, 8, 107–119. [Google Scholar] [CrossRef]
  17. Campbell, B.; Khachatryan, H.; Rihn, A. Pollinator-friendly plants: Reasons for and barriers to purchase. HortTechnology 2017, 27, 831–839. [Google Scholar] [CrossRef]
  18. Kalaman, H.; Knox, G.W.; Wilson, S.B.; Wilber, W. A master gardener survey: Promoting pollinator-friendly plants through education and outreach. HortTechnology 2020, 30, 163–167. [Google Scholar] [CrossRef]
  19. Goddard, M.A.; Dougill, A.J.; Benton, T.G. Scaling up from gardens: Biodiversity conservation in urban environments. Trends Ecol. Evol. 2010, 25, 90–98. [Google Scholar] [CrossRef]
  20. Davies, Z.G.; Fuller, R.A.; Loram, A.; Irvine, K.N.; Sims, V.; Gaston, K.J. A national scale inventory of resource provision for biodiversity within domestic gardens. Biol. Conserv. 2009, 142, 761–771. [Google Scholar] [CrossRef]
  21. Taylor, L. From ways of life to lifestyle: Theordinari-ization’of British gardening lifestyle television. Eur. J. Commun. 2002, 17, 479–493. [Google Scholar] [CrossRef]
  22. Kaluza, B.F.; Wallace, H.; Heard, T.A.; Klein, A.M.; Leonhardt, S.D. Urban gardens promote bee foraging over natural habitats and plantations. Ecol. Evol. 2016, 6, 1304–1316. [Google Scholar] [CrossRef] [PubMed] [Green Version]
  23. Baldock, K.C.; Goddard, M.A.; Hicks, D.M.; Kunin, W.E.; Mitschunas, N.; Morse, H.; Osgathorpe, L.M.; Potts, S.G.; Robertson, K.M.; Scott, A.V. A systems approach reveals urban pollinator hotspots and conservation opportunities. Nat. Ecol. Evol. 2019, 3, 363–373. [Google Scholar] [CrossRef] [PubMed] [Green Version]
  24. Lanner, J.; Kratschmer, S.; Petrović, B.; Gaulhofer, F.; Meimberg, H.; Pachinger, B. City dwelling wild bees: How communal gardens promote species richness. Urban Ecosyst. 2020, 23, 271–288. [Google Scholar] [CrossRef]
  25. Erickson, E.; Adam, S.; Russo, L.; Wojcik, V.; Patch, H.; Grozinger, C. More than meets the eye? The role of annual ornamental flowers in supporting pollinators. Environ. Entomol. 2020, 49, 178–188. [Google Scholar] [CrossRef]
  26. Garbuzov, M.; Samuelson, E.E.W.; Ratnieks, F.L.W. Survey of insect visitation of ornamental flowers in Southover Grange garden, Lewes, UK. Insect Sci. 2015, 22, 700–705. [Google Scholar] [CrossRef] [PubMed]
  27. Garbuzov, M.; Ratnieks, F.L. Using the British national collection of asters to compare the attractiveness of 228 varieties to flower-visiting insects. Environ. Entomol. 2015, 44, 638–646. [Google Scholar] [CrossRef]
  28. Harris, B.A.; Braman, S.K.; Pennisi, S.V. Influence of plant taxa on pollinator, butterfly, and beneficial insect visitation. HortScience 2016, 51, 1016–1019. [Google Scholar] [CrossRef] [Green Version]
  29. Garbuzov, M.; Ratnieks, F.L. Listmania: The strengths and weaknesses of lists of garden plants to help pollinators. BioScience 2014, 64, 1019–1026. [Google Scholar] [CrossRef] [Green Version]
  30. Garbuzov, M.; Ratnieks, F.L. Quantifying variation among garden plants in attractiveness to bees and other flower-visiting insects. Funct. Ecol. 2014, 28, 364–374. [Google Scholar] [CrossRef]
  31. Rollings, R.; Goulson, D. Quantifying the attractiveness of garden flowers for pollinators. J. Insect Conserv. 2019, 23, 803–817. [Google Scholar] [CrossRef] [Green Version]
  32. Erickson, E.; Patch, H.; Grozinger, C. Herbaceous perennial ornamental plants can support complex pollinator communities. Sci. Rep. 2021, 11, 17352. [Google Scholar] [CrossRef]
  33. Ratnieks, F.L.W.; Shackleton, K. Does the Waggle Dance Help Honey Bees to Forage at Greater Distances than Expected for their Body Size? Front. Ecol. Evol. 2015, 3, 31. [Google Scholar] [CrossRef] [Green Version]
  34. DiSabato-Aust, T. The Well-Tended Perennial Garden: The Essential Guide to Planting + Pruning Techniques, 3rd ed.; Timber Press, Inc.: Portland, OR, USA, 2017. [Google Scholar]
  35. Adamson, N.L.; Borders, B.; Cruz, J.K.; Jordan, S.F.; Gill, K.; Hopwood, J.; Lee-Mader, E.; Minnerath, A.; Vaughan, M. Pollinator Plants: Mid-Atlantic Region; Xerces Society: Portland, OR, USA, 2017. [Google Scholar]
  36. Daniel, J.B.; Glennon, B.; Gordon, S.; Wentz, C. Virginia Plant Establishment Guide; USDA-NRCS: Washington, DC, USA, 2011. [Google Scholar]
  37. Garbuzov, M.; Madsen, A.; Ratnieks, F.L. Patch size has no effect on insect visitation rate per unit area in garden-scale flower patches. Acta Oecologica 2015, 62, 53–57. [Google Scholar] [CrossRef]
  38. R Core Team. R: A Language and Environment for Statistical Computing; R Foundation for Statistical Computing: Vienna, Austria, 2020. [Google Scholar]
  39. Bates, D.; Mächler, M.; Bolker, B.; Walker, S. Fitting Linear Mixed-Effects Models Using lme4. J. Stat. Softw. 2015, 67, 48. [Google Scholar] [CrossRef]
  40. Morris, E.K.; Caruso, T.; Buscot, F.; Fischer, M.; Hancock, C.; Maier, T.S.; Meiners, T.; Müller, C.; Obermaier, E.; Prati, D.; et al. Choosing and using diversity indices: Insights for ecological applications from the German Biodiversity Exploratories. Ecol. Evol. 2014, 4, 3514–3524. [Google Scholar] [CrossRef] [Green Version]
  41. Hutcheson, K. A test for comparing diversities based on the Shannon formula. J. Theor. Biol. 1970, 29, 151–154. [Google Scholar] [CrossRef]
  42. Barr, D.J.; Levy, R.; Scheepers, C.; Tily, H.J. Random effects structure for confirmatory hypothesis testing: Keep it maximal. J. Mem. Lang. 2013, 68, 255–278. [Google Scholar] [CrossRef] [Green Version]
  43. Lenth, R.V. Emmeans: Estimated Marginal Means, Aka Least Squares Means. Available online: https://cran.r-project.org/web/packages/emmeans/index.html (accessed on 25 September 2022).
  44. Wardhaugh, C.W. How many species of arthropods visit flowers? Arthropod-Plant Interact. 2015, 9, 547–565. [Google Scholar] [CrossRef]
  45. Ollerton, J. Pollinators and Pollination: Nature and Society; Pelagic Publishing Ltd.: Exeter, UK, 2021. [Google Scholar]
  46. Klein, A.-M.; Vaissière, B.E.; Cane, J.H.; Steffan-Dewenter, I.; Cunningham, S.A.; Kremen, C.; Tscharntke, T. Importance of pollinators in changing landscapes for world crops. Proc. Biol. Sci. 2007, 274, 303–313. [Google Scholar] [CrossRef]
  47. Colla, S.R.; Packer, L. Evidence for decline in eastern North American bumblebees (Hymenoptera: Apidae), with special focus on Bombus affinis Cresson. Biodivers. Conserv. 2008, 17, 1379–1391. [Google Scholar] [CrossRef]
  48. Theodorou, P.; Albig, K.; Radzevičiūtė, R.; Settele, J.; Schweiger, O.; Murray, T.E.; Paxton, R.J. The structure of flower visitor networks in relation to pollination across an agricultural to urban gradient. Funct. Ecol. 2017, 31, 838–847. [Google Scholar] [CrossRef]
  49. Goulson, D.; Hughes, W.; Derwent, L.; Stout, J. Colony growth of the bumblebee, Bombus terrestris, in improved and conventional agricultural and suburban habitats. Oecologia 2002, 130, 267–273. [Google Scholar] [CrossRef] [PubMed]
  50. Pardee, G.L.; Philpott, S.M. Native plants are the bee’s knees: Local and landscape predictors of bee richness and abundance in backyard gardens. Urban Ecosyst. 2014, 17, 641–659. [Google Scholar] [CrossRef] [Green Version]
  51. Fukase, J.; Simons, A. Increased pollinator activity in urban gardens with more native flora. Appl. Ecol. Environ. Res. 2016, 14, 297–310. [Google Scholar] [CrossRef]
  52. Lowenstein, D.M.; Matteson, K.C.; Minor, E.S. Evaluating the dependence of urban pollinators on ornamental, non-native, and ‘weedy’ floral resources. Urban Ecosyst. 2019, 22, 293–302. [Google Scholar] [CrossRef]
  53. Kalaman, H.; Wilson, S.B.; Mallinger, R.E.; Knox, G.W.; Kim, T.; Begcy, K.; van Santen, E. Evaluation of Native and Nonnative Ornamentals as Pollinator Plants in Florida: II. Floral Resource Value. HortScience 2022, 57, 137–143. [Google Scholar] [CrossRef]
  54. Matteson, K.C.; Langellotto, G.A. Small scale additions of native plants fail to increase beneficial insect richness in urban gardens. Insect Conserv. Divers. 2011, 4, 89–98. [Google Scholar] [CrossRef]
  55. Garbuzov, M.; Alton, K.; Ratnieks, F.L. Most ornamental plants on sale in garden centres are unattractive to flower-visiting insects. PeerJ 2017, 5, e3066. [Google Scholar] [CrossRef] [Green Version]
  56. Steffan-Dewenter, I.; Tscharntke, T. Succession of bee communities on fallows. Ecography 2001, 24, 83–93. [Google Scholar] [CrossRef]
  57. Fussell, M.; Corbet, S.A. Flower usage by bumble-bees: A basis for forage plant management. J. Appl. Ecol. 1992, 29, 451–465. [Google Scholar] [CrossRef]
  58. Parrish, J.; Bazzaz, F. Difference in pollination niche relationships in early and late successional plant communities. Ecology 1979, 60, 597–610. [Google Scholar] [CrossRef]
  59. Corbet, S.A. Insects, plants and succession: Advantages of long-term set-aside. Agric. Ecosyst. Environ. 1995, 53, 201–217. [Google Scholar] [CrossRef]
  60. Willmer, P. Pollination and Floral Ecology; Princeton University Press: Princeton, NJ, USA, 2011. [Google Scholar]
  61. Tuell, J.K.; Fiedler, A.K.; Landis, D.; Isaacs, R. Visitation by wild and managed bees (Hymenoptera: Apoidea) to eastern US native plants for use in conservation programs. Environ. Entomol. 2014, 37, 707–718. [Google Scholar] [CrossRef] [Green Version]
  62. Weisenhorn, J. Annual Flowers That Attract Pollinators; University of Minnesota Extension: Minneapolis, MN, USA, 2021. [Google Scholar]
  63. Božanić Tanjga, B.; Ljubojević, M.; Đukić, A.; Vukosavljev, M.; Ilić, O.; Narandžić, T. Selection of Garden Roses to Improve the Ecosystem Services They Provide. Horticulturae 2022, 8, 883. [Google Scholar] [CrossRef]
  64. Strzałkowska-Abramek, M. Nectar and pollen production in ornamental cultivars of Prunus serrulata (Rosaceae). Folia Hortic. 2019, 31, 205–212. [Google Scholar] [CrossRef] [Green Version]
  65. Hicks, D.M.; Ouvrard, P.; Baldock, K.C.; Baude, M.; Goddard, M.A.; Kunin, W.E.; Mitschunas, N.; Memmott, J.; Morse, H.; Nikolitsi, M. Food for pollinators: Quantifying the nectar and pollen resources of urban flower meadows. PLoS ONE 2016, 11, e0158117. [Google Scholar] [CrossRef] [Green Version]
  66. Staab, M.; Pereira-Peixoto, M.H.; Klein, A.-M. Exotic garden plants partly substitute for native plants as resources for pollinators when native plants become seasonally scarce. Oecologia 2020, 194, 465–480. [Google Scholar] [CrossRef]
  67. Cubey, J.; Merrick, J. RHS Plant Finder 2022; Royal Horticultural Society: London, UK, 2022. [Google Scholar]
  68. NRCS USDA. The PLANTS Database; United States Department of Agriculture: Washington, DC, USA, 2022. [Google Scholar]
  69. Biesmeijer, J.C.; Slaa, J.E. The structure of eusocial bee assemblages in Brazil. Apidologie 2006, 37, 240–258. [Google Scholar] [CrossRef] [Green Version]
  70. von Frisch, K. The Dance Language and Orientation of Bees; Harvard University Press: Cambridge, MA, USA, 1967. [Google Scholar]
  71. Couvillon, M.J. The dance legacy of Karl von Frisch. Insect. Soc. 2012, 59, 297–306. [Google Scholar] [CrossRef]
  72. Garbuzov, M.; Couvillon, M.J.; Schürch, R.; Ratnieks, F.L.W. Honey bee dance decoding and pollen-load analysis shows limited foraging on oilseed rape—A potential source of neonicotinoid contamination. Agric. Ecosyst. Environ. 2015, 203, 62–68. [Google Scholar] [CrossRef]
  73. Balfour, N.J.; Ratnieks, F.L. Using the waggle dance to determine the spatial ecology of honey bees during commercial crop pollination. Agric. For. Entomol. 2017, 19, 210–216. [Google Scholar] [CrossRef]
  74. Couvillon, M.J.; Ratnieks, F.L.W. Environmental consultancy: Dancing bee bioindicators to evaluate landscape “health”. Front. Ecol. Evol. 2015, 3. [Google Scholar] [CrossRef] [Green Version]
  75. Couvillon, M.J.; Schürch, R.; Ratnieks, F.L.W. Dancing bees communicate a foraging preference for rural lands under High Level Agri-Environment Schemes. Curr. Biol. 2014, 24, 1212–1215. [Google Scholar] [CrossRef] [PubMed] [Green Version]
  76. Mallinger, R.E.; Gaines-Day, H.R.; Gratton, C. Do managed bees have negative effects on wild bees?: A systematic review of the literature. PLoS ONE 2017, 12, e0189268. [Google Scholar] [CrossRef] [Green Version]
  77. Paini, D. Impact of the introduced honey bee (Apis mellifera)(Hymenoptera: Apidae) on native bees: A review. Austral Ecol. 2004, 29, 399–407. [Google Scholar] [CrossRef]
  78. Goulson, D. Effects of introduced bees on native ecosystems. Annu. Rev. Ecol. Evol. Syst. 2003, 34, 1–26. [Google Scholar] [CrossRef] [Green Version]
  79. Angelella, G.M.; McCullough, C.T.; O’Rourke, M.E. Honey bee hives decrease wild bee abundance, species richness, and fruit count on farms regardless of wildflower strips. Sci. Rep. 2021, 11, 3202. [Google Scholar] [CrossRef]
  80. Balfour, N.J.; Garbuzov, M.; Ratnieks, F.L.W. Longer tongues and swifter handling: Why do more bumble bees (Bombus spp.) than honey bees (Apis mellifera) forage on lavender (Lavandula spp.). Ecol. Entomol. 2013, 38, 323–329. [Google Scholar] [CrossRef]
  81. Couvillon, M.J.; Schürch, R.; Ratnieks, F.L.W. Waggle Dance Distances as Integrative Indicators of Seasonal Foraging Challenges. PLoS ONE 2014, 9, e93495. [Google Scholar] [CrossRef]
  82. Garbuzov, M.; Schürch, R.; Ratnieks, F.W. Eating locally: Dance decoding demonstrates that urban honey bees in Brighton, UK, forage mainly in the surrounding urban area. Urban Ecosyst. 2014, 18, 411–418. [Google Scholar] [CrossRef]
  83. Sponsler, D.B.; Matcham, E.G.; Lin, C.-H.; Lanterman, J.L.; Johnson, R.M. Spatial and taxonomic patterns of honey bee foraging: A choice test between urban and agricultural landscapes. J. Urban Ecol. 2017, 3, juw008. [Google Scholar] [CrossRef] [Green Version]
  84. Couvillon, M.J.; Fensome, K.A.; Quah, S.K.L.; Schürch, R. Summertime blues: August foraging leaves honey bees empty-handed. Commun. Integr. Biol. 2014, 7, e28821. [Google Scholar] [CrossRef]
  85. Steele, T.N.; Schürch, R.; Ohlinger, B.D.; Couvillon, M.J. Apple orchards feed honey bees during, but even more so after, bloom. Ecosphere 2022, 13, e4228. [Google Scholar] [CrossRef]
  86. Erickson, E.; Junker, R.; Ali, J.; McCartney, N.; Patch, H.; Grozinger, C. Complex floral traits shape pollinator attraction to ornamental plants. Ann. Bot. 2022, 130, 561–577. [Google Scholar] [CrossRef]
  87. Marquardt, M.; Kienbaum, L.; Kretschmer, L.A.; Penell, A.; Schweikert, K.; Ruttensperger, U.; Rosenkranz, P. Evaluation of the importance of ornamental plants for pollinators in urban and suburban areas in Stuttgart, Germany. Urban Ecosyst. 2021, 24, 811–825. [Google Scholar] [CrossRef]
Figure 1. We conducted our study in two experimental gardens located in Blacksburg, Virginia, USA, approximately 4.8 km apart. At both sites, we (A) chisel plowed and tilled and (B) laid landscape fabric in a lattice to create 100 square plots, so each of our 25 plants could be replicated four times. Photo (C) is the Urban Horticulture Center, or UHC, a month before data collection began in 2020, and photo (D) is the Turfgrass Research Center, or TRC, a month after data collection ended in 2021.
Horticulturae 08 01068 g001
Figure 2. Scatterplot of log honey bee abundance versus log (A) flower-visiting insects, (B) bumble bee, (C) Lepidoptera, and (D) wild bee (i.e., all bees minus honey bees) abundance. The abundance of honey bees on a plant positively correlated with the abundance of insect pollinators in general, a relationship largely driven by the correlations between honey bees and Lepidopterans and honey bees and bumble bees but not by the relationship between honey bees and wild bees.
Horticulturae 08 01068 g002
Figure 3. Ornamental plants significantly impact the abundance of insect visitors. The x axis displays the ornamental plants in our study, and the y axis represents the abundance, seen as annual total number of visitors per plant plot, averaged (95% CI) across plots. Post hoc mean separation test results are displayed as letters on top of the figure, and color bars at the bottom represent proportional abundance for three classes (plus “other”) of insect visitors. Datapoint colors denote whether the plant was a native perennial, non-native perennial, or non-native annual.
Horticulturae 08 01068 g003
Figure 4. Ornamental plants significantly impact the diversity of insect visitors. The x axis displays the ornamental plants in our study, and the y axis displays that plant’s diversity score (95% CI), as calculated with the Shannon’s Diversity Index. Post hoc mean separation test results are displayed as letters on top of the figure, and datapoint colors denote whether the plant was a native perennial, non-native perennial, or non-native annual.
Horticulturae 08 01068 g004
Figure 5. (A) Native perennials attracted more insect pollinators, as measured by average abundance (95% confidence interval) per year, than non-native perennials or non-native annuals. (B) Non-native perennials attracted more diverse groups of insect pollinators, as measured by a diversity score (95% confidence interval), than either native perennials or non-native annuals. Both graphs show statistically significant results, and letters denote post hoc results between categories.
Horticulturae 08 01068 g005
Figure 6. Insect group diversity and insect abundance has a curvilinear relationship across the plants in our study. Each point represents observations per plot per year. The black solid and dashed lines show mean diversity and 95% CI. Black-eyed Susan, sedum, and verbena are highlighted because they were initially suspected to drive the curvilinear relationship; however, the significant relationship was maintained even with their removal (grey solid and grey dashed line show mean diversity and 95% CI).
Horticulturae 08 01068 g006
Publisher’s Note: MDPI stays neutral with regard to jurisdictional claims in published maps and institutional affiliations.

