Article

A Theory of Planned Behavior-Informed Evaluation of Growers’ Intent to Use Automated Nursery Technologies

1
Department of Agricultural Education and Communication, University of Florida, Gainesville, FL 32611, USA
2
Department of Agricultural and Resource Economics, University of Tennessee, Knoxville, TN 37996, USA
3
Department of Plant Sciences, University of Tennessee, Knoxville, TN 37996, USA
4
Department of Horticultural Science, NC State University, Raleigh, NC 27695, USA
5
Human Dimensions Research Lab, University of Tennessee, Knoxville, TN 37996, USA
*
Author to whom correspondence should be addressed.
Horticulturae 2022, 8(11), 1028; https://doi.org/10.3390/horticulturae8111028
Submission received: 10 October 2022 / Revised: 31 October 2022 / Accepted: 1 November 2022 / Published: 3 November 2022

Abstract

:
Labor scarcity and rising production costs due to increasing labor wages and benefits are key concerns among nursery growers. Automated nursery technologies are a means to address labor challenges, but they are not widely adopted. The research objective was to use the Theory of Planned Behavior to evaluate nursery growers’ intention of using automated technologies in their operations to support future educational initiatives. Using a mixed-mode survey, four technology clusters, or a grouping of connected ideas, were examined: Irrigation application, Plant transport, Plant handling, and Agrochemical application. Overall intent to adopt technologies within each cluster was neutral but slightly negative. Attitudes towards adopting automated nursery technologies and perceptions of others’ approval for adoption were positive, and perceived behavioral control and perceptions of others’ adoption were neutral. When used to predict likelihood of adoption through multiple linear regression models, there was variability in characteristics that predicted intent to adopt technologies within each cluster with attitude being the most consistent predictor across the clusters. There were both positive and negative relationships between the social norms variables and behavioral intent. Overall, social norms and attitudes appear to be among the most important characteristics in disseminating automated nursery technology adoption to address labor issues.

1. Introduction

The ornamental horticulture industry is a diverse agriculture sector that includes growers, wholesalers, landscapers, and retailers who produce and sell, install and maintain plants for beautification, property improvement, and ecological goods and services (e.g., commercial and residential landscapes, interiorscapes, urban parks, etc.). Hall et al. [1] estimated that the U.S. ornamental horticulture industry had an economic contribution of $159.57 billion in 2018 and employed 217,574 people. Between 2007 and 2018, the number of employees in the industry increased 2.75%. This increase was primarily due to landscape services (a gain of 15.6%), whereas employees for the nursery and floriculture production sector decreased by 18.9%. This loss of labor has not been isolated to horticulture production, but rather, has been felt across all agriculture sectors [2,3]. However, unlike other agricultural sectors that can be automated due to the uniformity in space and time of monoculture crops and crop tolerance of mechanical handling (e.g., precision farming, combining), many of the production tasks related to ornamental plant production are still performed by hand, making this a very labor-intensive agricultural sector. For instance, several studies have estimated that labor is responsible for 40 to 44 percent of production costs in the ornamental plant industry [4,5]. Consequently, actions to reduce labor needs or improve labor efficiency could aid the industry’s economic sustainability. Automation of production tasks is one means of improving labor efficiency given the potential benefits of reduced resources, labor, costs, and time [6,7,8,9].
The overall purpose of this research was to examine likelihood of adoption of classes of automated nursery technologies (ANTs) grouped by technology type: irrigation application, plant transport, plant handling, and agrochemical application. The Theory of Planned Behavior is one tool that can be used to assess potential drivers of automation adoption [10,11,12,13,14,15,16,17,18]. In this context, the specific objectives were to (1) describe Theory of Planned Behavior and normative variables to characterize the present state of ANT adoption and (2) identify factors related to likelihood of future adoption of each of the four ANT categories. The following paragraphs briefly summarize relevant research related to the Theory of Planned Behavior and nursery automation and applications.

1.1. Theoretical Framework

The Theory of Planned Behavior states that three constructs influence behavioral intention, including attitudes toward the behavior, subjective norms, and perceived behavioral control [19]. Subjects’ attitudes include their positive and negative perceptions of the behavior, or the “degree to which a person has a favorable or unfavorable evaluation or appraisal of the behavior” [19] (p. 188). For example, an individual may perceive or evaluate ANTs as being efficient and cost-saving and therefore positive or as complicated and costly and therefore negative. The Theory of Planned Behavior states that the attitude of the grower has an influence on their adoption behavior, and many studies support this claim. A study conducted to observe the effect of different variables on the adoption of native plants in their garden reported that individuals’ attitudes had a significant relationship with their intentions of using native plants [10]. A significant positive relationship was reported between attitude and the intention to install rain garden technologies [11]. Similarly, a significant and positive relationship was reported for attitude and students’ intention to practice Green Information Technology [12], intention to adopt sustainable technology in greenhouse horticulture [13], intention to adopt sustainable floriculture practices [14], and intention to conserve water [15]. However, there are a few conflicting studies which highlights the value in investigating these relationships in specific contexts and environments. Kumar Chaudhary et al. [16] and Warner [17] reported that attitude was not a significant predictor of behavioral intention for water conservation. Similarly, Hattam [18] reported that attitude had a negative and insignificant influence on farmers’ conversion to organic practices.
Subjective norms are actual and perceived social pressure from peer or professional groups or other individuals who are perceived as having influence or expertise related to the behavior. Ajzen [19] described subjective norms as “perceived social pressure to perform or not to perform the behavior” (p. 188). To provide clarity to adoption of ANTs, in this study, two additional nuances of subjective norms are used. The first is the segregation of subjective norms into descriptive and injunctive norms. Descriptive norms refer to what others actually do or what the norm is, and injunctive norms refer to what others approve of or what ought to be done [20]. Injunctive and descriptive norms are often not distinguished from one another, which can lead to missed opportunities in understanding influences on behaviors [21]. The second nuance is the concept of referent groups. While subjective norms as described in the Theory of Planned Behavior typically refer to the people that are important to a decision-maker [19], individuals belong to many different referent networks that influence their behavior unequally [22]. Referent groups are considered to be important factors affecting an individual’s behavior and social orientation, as well as of people’s behavior in multi-group contexts [23]. In the case of nursery growers, important referent groups may include peer growers, customers, family, and the broader nursery industry. Therefore, rather than referring to growers’ subjective norms in general, it is possible to consider descriptive and injunctive norms from multiple referent groups. For example, a grower may perceive the growers they know would approve of them adopting ANTs (a strong injunctive norm) and also perceive the growers they know do not personally use ANTs themselves (a low descriptive norm).
A strong positive descriptive norm from close peers [17,24], a significant positive descriptive norm from other state residents, and a significant negative descriptive norm from the neighborhood were reported for the intention to adopt water conservation practices [17]. Similarly, neighborhood gardening, a celebrity living in the neighborhood, and celebrity endorsement in the media have all been cited as sources of descriptive norms promoting the rise of native gardens and ecological gardening techniques in a community [25]. However, in another study, a strong descriptive norm explained only the current adoption of water-saving practices and did not predict future behavioral intentions for water conservation [26].
A strong positive injunctive norm from the neighborhood was reported to be more important than those from close peers in predicting the intention to adopt outdoor household water conservation practices [17]. Uren et al. [25] reported a strong injunctive norm for adopting native gardening, in which community members felt guilty for not adopting environmentally friendly and native gardening practices because the community and neighborhood placed a high value on environmental care and conservation.
Lastly, the third predictor of behavioral intention is perceived behavioral control, which is defined as “the perceived ease or difficulty of performing the behavior, and it is assumed to reflect past experience as well as anticipated impediments and obstacles” [19] (p. 188). Past experiences [16], skills, and resources are some of the factors impacting perceived behavioral control and the probability of the behavior occurring. Clark and Finley [15] and Kumar Chaudhary et al. [16] reported a positive and significant correlation between perceived behavioral control and the intention to conserve water. Similarly, a significant and positive relationship was reported between perceived behavior control and the intention to practice Green Information Technology [12], and the intention to convert to organic production [18,27]. However, other studies reported no significant relationship between perceived behavioral control and the intention to conserve water [11,17]. These differences in findings again point to the importance of evaluating these relationships in specific contexts and environments.
Each of the factors described above (i.e., attitudes, descriptive and injunctive norms, perceived behavioral control) can impact the probability of a behavior occurring. For instance, if a grower perceives an ANT positively, observes another grower succeeding with that technology, perceives there would be approval for adopting, and has the resources to install the technology, s/he may be more receptive of adopting that technology compared to a grower lacking these qualities. In turn, behavioral intent can serve as a proxy to adoption and is predicted by attitudes, subjective norms and behavioral controls.
The Theory of Planned Behavior has been used successfully to explain grower adoption of water-saving technologies by strawberry farmers [28] and nursery [29], conservation agricultural practices by farmers from drought-prone areas [30], green pesticides by pea farmers [31], sustainable agriculture practices among pepper farmers [32], organic practices for small-scale avocado farmers [18], plastic recycling in strawberry [33], landscape water conservation behavior among Florida residents [16], and sustainable technology in the greenhouse horticulture industry [13], among others. Here, we use these methods to address adoption of specific ANTs among U.S. nurseries.
When behavioral adoption is the end goal, interventions will be most impactful if they are informed by audience- and innovation-specific research [34]. Very little is known about the processes leading to adoption of ANTs. In 2022, Rihn et al. [35] reported several factors correlated with the propensity to adopt ANTs. Furthermore, in 2022, Warner et al. [36] used the Diffusion of Innovations [37] to identify perceptions of ANTs and factors predicting current and future adoption of ANTs. However, they noted their findings may have been diluted since they considered overall current adoption and likelihood of adoption of 27 ANTs collectively. The present study was undertaken to increase the precision in understanding influences on adoption by examining closely related ANTs. We applied the concept of technology clusters, or a grouping of connected ideas [37] and the four clusters were: irrigation application, plant transport, plant handling, and agrochemical application. The value in assessing behaviors using technology clusters is the adoption of one innovation within these groups of innovations can spur the adoption of others [37].

1.2. Overview of Nursery Automation

Nurseries have slowly increased automation adoption to ease their reliance on insufficient work force availability [35]. Overall adoption rates remain low at near 33% [38]. Automation potential varies by task [9,38]. While automation is perceived as advantageous and recognized by producers as having the potential to improve both crop quality and consistency, these technologies can be expensive to purchase and install because, in part, installation may necessitate changing nursery infrastructure [35,36]. For example, a potting machine can cost $100,000 USD or more with additional expenses incurred for installation and infrastructure required for operation. Anecdotally, the conventional practice has been to hire and lay off employees in response to fluctuating production demands; neither capital intensive automation adoption nor current low labor availability affords that flexibility. Growers weigh these benefits and barriers among other characteristics as they determine whether to adopt ANTs. In this study, we evaluate growers’ intent to adopt ANTs to improve their labor efficiencies. ANTs are grouped into four technology clusters which are described below: irrigation application, agrochemical application, plant transport, and plant handling. Examples of a technology from each cluster is presented in Figure 1.

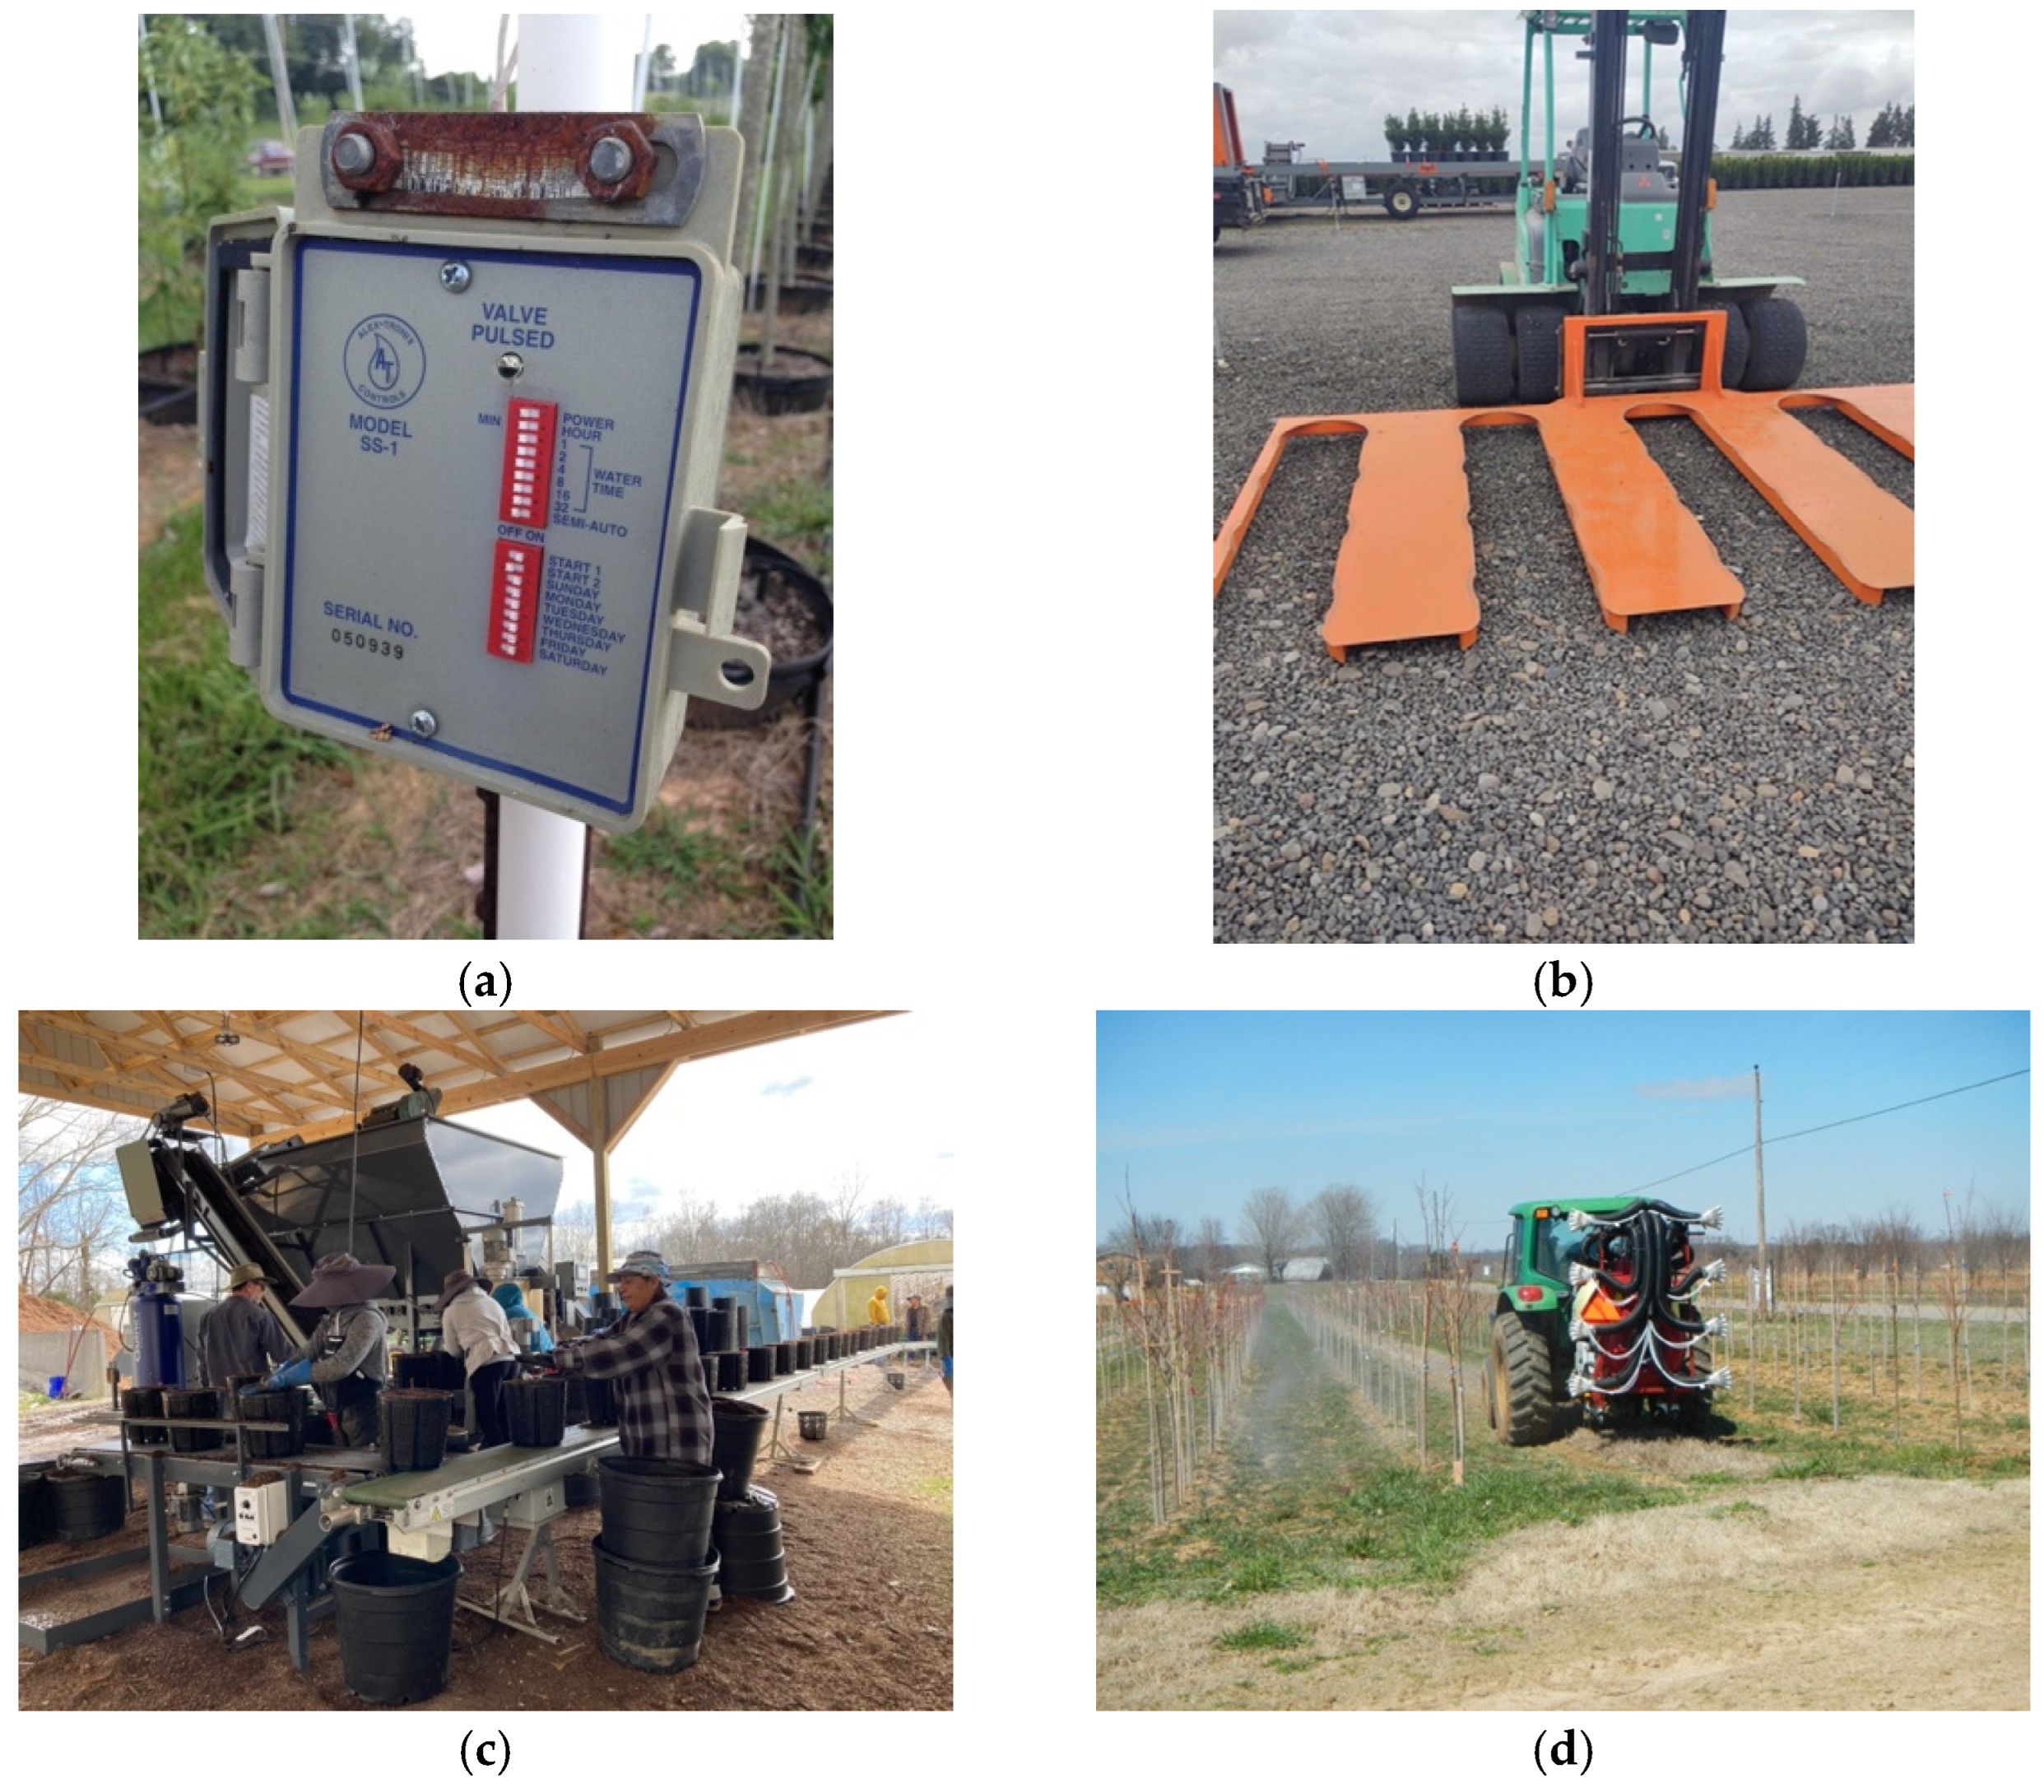
1.2.1. Irrigation Application

Irrigation application in container nursery production must occur at least daily during the growing season. Historically, nursery employees would manually operate valves to control irrigation throughout the day until every zone had been irrigated. Often this is a dedicated position, and the irrigation technician spends every day all day opening and closing valves. While deciding how much, at what time, and at what interval to irrigate is complex, the physical task of opening and closing a valve is repetitive, time consuming, and time sensitive, and thus, lends itself to automation [39].
Timers that can be programmed to open a valve at a given time for a given duration are inexpensive and have been commercially available for decades [Figure 1a]. While unable to provide decision-making support, these timers can replicate the static irrigation operation often performed by low-level laborers. These automated systems generally perform as intended and greatly reduce person-hours spent on irrigation by eliminating the need to manually operate each valve and replacing it with less labor-intensive monitoring the system’s operation-verifying that it is running and troubleshooting as needed. Belayneh et al. [40] calculated that the overall return on investment (ROI) for a sensor-based, automated irrigation system was 37.5%, largely due to a reduction in irrigation employee time. They attributed a $12,150 annual savings to reducing irrigation management time that included physically monitoring irrigation zones. In another study comparing a nursery’s standard once every 48-h irrigation application to an automated daily irrigation system, a grower anecdotally reported labor savings as the most significant benefit [41], despite the automated daily system reducing water use by 60%, due to the time-consuming, inefficient, and disruptive nature of manually operating their irrigation. While both Belayneh et al. [40] and Cypher et al. [41] compare two automated control systems: a timer-based and a sensor-based, their findings underscore the labor and, thereby, economic potential that reducing irrigation labor can have.

1.2.2. Plant Transport

According to Fang et al. [42], the potting and transport of plants to both production and shipping areas require maximum labor inputs due to extensive materials handling operations. For example, labor is required to gather and stage raw materials in the queue that occurs between storage of raw materials (containers, substrates, fertilizer, plants, tags) and the potting area. Then, labor is required to pot plants, load them onto transport vehicles, transport plants to growing areas and unload them. The travel distance after potting affects labor availability during potting if potters also unload plants. If there are enough workers to stage and reload the queue, pot plants, load them, transport and unload them, then the post-potting travel distance can affect potting speed since the carts necessary to stage potted plants can become a bottleneck, particularly if there are not enough carts.
For transport after potting, a tractor or vehicle attached to one or more wagons or carts is used extensively. These mechanisms are propelled by either employees, electric motors, or combustion engines in the forms of rugged forklifts, tractors, or vehicles. The Trike™ Horticultural Forklift (AgriNomix, Oberlin, OH, USA), or self-engineered alternatives, can lift a block of plants simultaneously into a specially sized cart or wagon (Figure 1b). Subsequently, a Trike™ can be stationed at the final growing destination to unload the plants in the production area if the ground and growing area can handle such articulated weight. The ability to integrate this type of technology depends on production system evolution as many nursery production beds, or growing areas, were not designed to be traversed by heavy equipment.
Upon harvest, plants will generally be transported to the sales yard for display and pickup or shipping area for delivery. Generally, this is done manually or by use of conveyors to bring plants to the front of the row and loaded onto similar wagons or carts. Because of the variable nature of sales and nonuniform orders by end use consumers, there is usually not enough plant material of any one cultivar to use the Trike™ to harvest plants for sales. Plants can be left in the field, lifted using a skid steer loader with articulated attachments (Nursery Jaws®, DPM, Inc., Davenport, NE, USA or Tree Boss® Tree Equipment Design, Inc., New Ringold, PA, USA), or a rugged forklift onto wagons for transport to the storage and shipping areas, or loaded directly onto shipping trailers in the field immediately.

1.2.3. Plant Handling

Nursery producers may pot container grown plants in substrates adjacent to the growing area to simply pot, move, and space plants directly in their final growing area (Figure 1c). Depending on species and container size, plants may be grown using tight spacing (i.e., no space between pots) for a period of time or spaced at an interim or final spacing distance between pots to accommodate canopy expansion and growth habit for quality standards. The mobile potting apparatus, which may be no more than a cart full of substrate with hand trowels and input materials is moved to the next designated growing area. When inclement weather occurs or the nursery expands, a more concentrated, covered potting area is preferred to maximize labor utilization and availability, as well as raw materials delivery and handling.
The queue for planting field-grown plants can be quite different because soil preparation and subsequent raw materials handling can occur months previously (e.g., lime amendment), or during planting (e.g., nutrient application), or weeks later (e.g., both nutrient amendments and agrichemicals applied as a drench). Plant material handling consists of covering roots of bare-root plants to prevent desiccation, storing plants in a cold room, or both. It may be preferable to plant by hand because mechanical liner setters or pull behind tractor planters can place plants too deeply, which can affect transplant survival. However, with careful attention to root depth, mechanical planters with labor supervision can efficiently plant bare root or container liners at the proper depth. Manufacturers produce variously shaped tree spades for digging field grown tree root balls and placing them into wire baskets lined with burlap (i.e., balled and burlapped or B&B). The burlap can be tied around the rootball with string or fastened together with a pneumatic c-ring fastener.
During production of both container- and field-grown plant material, labor is used to space plants to manipulate their canopy growth to achieve final market quality. Robotic spacing uses an onsite, calibrated gridded system with guidelines to move individual plants short distances within current growing areas. Field grown trees and shrubs can be simultaneously lifted and shaken to remove soil and either planted again onsite for further growth at greater spacing or sold as bare root liner plants. Once lifted and soil is shaken loose from roots, plants can be mechanically bundled and tied for storage, and later shipped. If plants are to be planted again for further market size at wider spacings, canopy manipulation can be achieved by either pruning, staking and tying trunks or stems, or a combination of both. Stakes can be installed by hand, which occurs mostly in container production) or driven into ground with a mechanical stake driver that can be purchased or fabricated. Tying machines (e.g., Max Tapener®, MAX USA, Plainview, NY, USA) increase efficiency and accuracy after staking.

1.2.4. Agrochemical Application

Nursery producers routinely apply pesticides, plant growth regulators, and fertilizers to crops during production. These inputs may be solid or liquid. Liquid pesticides are typically applied to the crop canopy using air-assisted sprayers that are on trailers pulled by a tractor or attached to the tractor and operated using the tractor power take off. These mechanized air-assisted sprayers provide consistent constant-rate applications. The application rate (i.e., gallons of pesticide solution applied per acre) is often based on grower experience, an approximation of tree row volume, or a combination thereof. Smart farming technology was recently developed to partially automate this application rate decision-making by sensing the crop and calculating the crop volume and plant density based on crop characteristics (Figure 1d). Additionally, the technology controls the nozzle actuation so that the sprayer only applies pesticide to the crop (i.e., does not spray between trees), as opposed to a conventional sprayer that sprays continuously [43].
Numerous studies have shown that pest control was equivalent if not better utilizing the automated technology. For example, Chen et al. [44] found equivalent or better control of five insects and six diseases on eight woody crops in Ohio. Fessler et al. [45] found equivalent and commercially acceptable levels of powdery mildew control. Moreover, this technology reduced foliarly applied fertilizer and pesticide volume by 30–65%. Manandhar et al. [46] examined the costs of this technology on two sizes of apple orchards, which have similar crop sizes and spray frequencies as nurseries. They calculated the payback time at 1.1 to 3.8 years depending on acreage in production and determined that the pesticide application time was reduced 27–32%, which led to a reduction in labor and fuel of nearly 30%. In spite of unbiased and seemingly compelling efficacy and economic data, and a relatively low capital investment (<$35,000), this technology was not immediately widely adopted upon commercialization in 2020 (Smart Apply, Smart Guided, LLC, Indianapolis, IN, USA), underscoring the challenges to nursery technology adoption and the need for further behavioral science research.
Fertilizer is normally applied at the time a crop is potted into a container by either incorporating fertilizer into the substrate or by top dressing it on the surface of the substrate after planting. Depending on the length of the production cycle, fertilizer may be applied again during production. In its most typical form, top dressing entails stooping over and manually spooning fertilizer granules on container-grown crops by hand. It is an uncomfortable, repetitive task. Some producers use a “belly grinder” applicator to broadcast fertilizer but that can waste product due to its imprecise nature. Producers of field-grown nursery crops often apply fertilizer using implements that band or broadcast the fertilizer although more expensive controlled release fertilizers are hand applied. Low-cost (<$500 USD) mechanical fertilizer dispensers are commercially available and offer a labor savings. For example, a comparison between an automated fertilizer dispenser that allows workers to remain in a standing position reduced application time by 43% (Fulcher, unpublished data). Additionally, applicators in this study reported no decrease in energy level after using this dispenser but experienced a 0.25 point on a 1 to 5-point scale energy decrease after manually spooning on fertilizer. Similarly, workers estimated their mobility was reduced 0.25 points versus 1 point after applying fertilizer with the dispenser versus manually applying it.
Data for on-farm adoption of many ANTs and their subsequent effect on economic outcomes is lacking as mechanical advantage proof of concept in addition to reduced labor needs for tasks where some form of advantage was adopted are self-evident. Currently, there are few autonomous or even human-guided robots for use in nursery production of either container or field grown crops. A review of 18 economic analysis publications between 1990 and 2018 investigated the effect of autonomous or automated technologies on field production of various non-ornamental horticulture crops [47]. Most of the publications reviewed reported positive results with automation adoption for returning investment and reducing labor needs. The authors noted that data are lacking for many automations across several disciplines and firm sizes.

2. Materials and Methods

Prior to conducting this study, Institutional Review Board Approval was secured by the research team members’ respective institutions (UTK IRB-20-05942-XM; UFL IRB2020-02135). The study occurred in several steps. First, multiple listening sessions occurred with 71 growers across the U.S. to identify their use of automation, potential for automation to reduce labor needs, and types of production tasks that could be automated. Their responses were used to generate survey content which was then administered to nursery operations across the U.S. In this manuscript, nurseries’ likelihood of adopting the different types of automation to address labor needs is of particular interest and discussed in Section 2.2. For additional information on the study design, please see Warner et al. [36].
This study represents a smaller component of a larger, national survey project in which mixed-mode survey techniques were used to reach the broadest possible audience of U.S. nursery growers with decision-making responsibilities who were 18 years or older. Survey research was appropriate given the exploratory and descriptive nature of the research objectives [48]. Nonprobability sampling [48] was conducted using membership of the Florida Nursery, Growers, and Landscape Association, Oregon Association of Nurseries membership rosters, International Plant Propagators’ Society (IPPS; Monroe, CT, USA) membership rosters, and nursery certificates in Tennessee. For individuals for whom we had email addresses, we recruited potential participants using email with an embedded Qualtrics survey link, followed by a later email reminder.
We mailed survey packets to those with available postal service addresses (excluding those who had responded to the email invitation to mitigate duplicate efforts). If we had no email address for an individual, we sent two separate survey packets. Our sampling frame was comprised of 1225 individuals. Of this total sample, 208 members had no valid email address, 45 members had no valid U.S. Postal Service mail address, resulting in a sample with 1017 valid email addresses and 1181 valid postal addresses. Nine hundred seventy-two (972) sample members had valid email and U.S. Postal Service addresses. Additional recruitment was conducted using the project team’s website, Extension specialists’ contact lists, and an advertisement through Nursery Management magazine.

2.1. Participant Characteristics and Sample Size

We received 189 complete responses with 35 completed online through the magazine advertisement, 56 completed online through direct contact, and 98 completed and returned paper surveys. According to the conservative type 1 completion and cooperation rate calculators of the American Association of Public Opinion Research [49], this corresponds to an 14.1% response rate and the 90.9% cooperation rate (when calculations include the 35 additional completed surveys prompted by the magazine advertisement).
We used pronounced visual cues in the paper instrument to ensure only decision-makers were completing the survey. Similarly, we used an electronic screening question to exit non-decision-makers from the survey. Approximately three quarters of the respondents were owners, presidents, or CEOs, with the remaining respondents acting in other decision-making capacities. More than half of respondents represented operations established prior to 2000. Respondents were 57 years old on average and had been in a nursery decision-making capacity for nearly 23 years. Respondents generally represented the diversity of the nursery industry but they reported slightly lower sales than the industry mean; there was also overrepresentation of firms from the Southeast and underrepresentation of container-only producers (see [35] for further discussion of the sample’s representativeness). Detailed demographics are published in [35,36].

2.2. Measures and Instrumentation

There were four dependent variables representing mean intent to adopt ANTs within each of four technology clusters (Table 1): Intent to adopt irrigation application ANT (Irr_intent_index), Intent to adopt plant transport ANT (Transp_intent_index), Intent to adopt plant handling ANT (Handl_intent_index), and Intent to adopt agrochemical application ANT (Agrochem_intent_index). The individual technologies that comprise each technology cluster are presented in Table 1.
Each intent index was calculated as the mean of the likelihood of adopting ANTs that applied to an individual given whether they were predominately container growers, field growers, or mixed (meaning their operations consisted of a mix of container and field grown production methods). Likelihood was measured on a five-point scale from very unlikely (−2) to very likely (2). In our survey, nine technologies applied to all, seven technologies applied to container only growers, and 12 technologies applied to field only growers. To ensure we were capturing intent to adopt new technologies among current nonadopters, if a respondent indicated they were already using a technology, there was no intent value for that specific ANT for that individual. Thus, the denominators used to calculate each grower’s mean intent for a given technology cluster varied according to their operation type and current adoption.
Independent variables included attitude, perceived behavioral control, four injunctive norms variables (drawn from the growers known to the respondent, other growers in the industry, customers, and family), and two descriptive norms variables (drawn from growers known to the respondent and other growers in the industry). Attitude and perceived behavioral control were semantic differential scales where respondents could select from five points between a series of word pairs (e.g., positive to negative or possible to not possible for attitude and perceived behavioral control, respectively). The injunctive and descriptive norms for each referent group were single five-point Likert-scale items (−2, strongly disagree to 2, strongly agree) which resulted in ordinal variables. An example of an injunctive norm statement is: Most of the growers I know would approve if I used automated nursery technologies. An example of a descriptive norm statement is: Most of the growers I know use automated nursery technologies.

2.3. Quality of Measurements

An expert panel review process was used to establish content and face validity [48]. Through this process, five experts knowledgeable about nursery production and education were tasked with reviewing the instrument to ensure language and terminology were clear, appropriate, and accurate. Expert panel recommendations were incorporated into a revised survey instrument.
The reliability of the survey tools was estimated by calculating Cronbach’s alpha coefficients, and were as follows: attitude (0.95), perceived behavioral control (0.75), intent to adopt irrigation application ANT (0.88), intent to adopt plant transport ANT (0.91), intent to adopt plant handling ANT (0.85), and intent to adopt agrochemical application ANT (0.65). These reliabilities were considered appropriate given the desired threshold is 0.70 [48] although alpha values exceeding 0.60 are considered acceptable for exploratory or complex constructs [50]. Reliability coefficients are not calculated for the normative variables as they are single scale items.

2.4. Data Analysis

All data were analyzed at a p-value of 0.05 using SPSS (version 27.0, IBM Corp., Armonk, NY, USA). Objective one was addressed using descriptive statistics. Objective two was addressed using four separate multiple regression models with one of the technology cluster intent index variables serving as the dependent variable for each. Multiple regression is appropriate when exploring the combined relationships between several independent variables and a dependent variable [48]. The input variables were attitude, perceived behavioral control, injunctive norms (growers, industry, customers, and family), and descriptive norms (growers and industry). Assumptions associated with multiple regression were checked by plotting predicted values residual values (normality), plotting outcome and input variables (linearity), scatter plotting residuals (homoscedasticity), and calculating variance inflation factor (VIF) values to ensure they were less than 10 (absence of multicollinearity).

2.5. Limitations

While the findings presented below are worthy of consideration, they should be interpreted with an understanding of the research limitations. Given the nonprobability sampling approach, generalization of the findings to the population is not possible. There is also a possibility those who opted into the study are somehow different from those who did not (e.g., more interested in ANT).

3. Results

3.1. Objective One: (1) Describe Theory of Planned Behavior and Normative Variables to Characterize the Present State of ANT Adoption

The descriptive statistics addressing objective one (Table 2) revealed all of the intent variables were slightly negative, falling between 0 and −1 on a scale ranging from −2 (low likelihood of adoption) to 2 (high likelihood of adoption). Respondents were least likely to adopt plant handling ANTs. Both attitude and perceived behavioral control were positive although perceived behavioral control was close to neutral.
Perceptions of injunctive norms were positive with each falling between 0 and 1 on a scale ranging from −2 (weak norm) to 2 (strong norm). The strongest perceived source of approval for ANT adoption (i.e., injunctive norms) was from family. Perceived use of ANTs among others (i.e., descriptive norms) was close to neutral with respondents perceiving the growers they know being less engaged in ANT use than growers from the broader industry.

3.2. Objective Two: Identify Factors Related to the Likelihood of Future Adoption of Each of the Four ANT Categories

All four multiple regression models were significant. The R2 values in the following tables indicate the percentage of variability in the dependent variable explained by the independent variables. These values range from 0.163 to 0.207, indicating explanation of 16–21% of the intent to adopt ANTs. These types of values are notable given the complexity of human behavior. Akaike Information Criterion (AIC) values indicate how well each model fits the data and can be used to compare model fit. A significant independent variable would be expected to correspond to a change in the dependent variable when other variables are held constant. Changes to insignificant predictor variables would not be expected to correspond to changes in the dependent variable when considering all model variables together. Unstandardized regression coefficients (B) correspond to the relationships between the raw independent and dependent variables, and their interpretation uses the original scales. For example, an increase of one unit of attitude (e.g., a shift from 1.00 to 2.00) would be expected to be accompanied by a change of B units in behavioral intent. Interpretation of standardized regression coefficients (β) is somewhat less intuitive as this value indicates relationships between variables after standardization. For example, a change of one standard deviation of attitude as standardized is expected to be accompanied by a change of β standard deviations of behavioral intent.
Attitude and descriptive norms associated with other growers were significant in the model predicting adoption of irrigation application ANTs (Table 3). An increase in attitude would be expected be accompanied by an increase in intent to adopt irrigation application ANT. However, an increase in perceptions that other growers (known to the respondent) are using ANT would be expected to correspond to a decrease in intent to adopt irrigation application ANT.
Attitude was the sole significant variable in the model predicting intent to adopt plant transport ANT (Table 4). Similar to the previous model, an increase in this variable would be expected to be accompanied by an increase in intent to adopt plant transport ANT.
In the model predicting intent to adopt plant handling ANT (Table 5) injunctive norms drawn from other growers and customers were the only significant predictors. An increase in injunctive norms drawn from other growers would be expected to be accompanied by an increase in intent to adopt plant handling ANT. Interestingly, an increase in injunctive norms drawn from customers would be expected to be accompanied by decrease in intent to adopt plant handling ANT.
When the independent variables were used to assess intent to adopt agrochemical application ANT (Table 6), attitude, injunctive norms drawn from other growers, and injunctive norms drawn from customers were significant predictors. Attitude and injunctive norms drawn from other growers had a positive relationship with intent. This means an increase in attitude or an increase in perceived approval from other growers would be expected to align with an increase in intent to adopt application efficiency ANT. Similar to the previous model, an increase in perceived approval for ANT adoption from customers would be expected to correspond to a decrease in intent to adopt application efficiency ANTs.

4. Discussion

This study’s first objective sought to describe U.S. nursery growers’ behavioral intent, attitudes, descriptive and injunctive norms, and perceived behavioral control pertaining to ANT adoption. Intent was negative but close to neutral for all four ANT clusters, implying that growers are currently not overly likely to adopt regardless of these technologies being a solution to critical labor issues facing the industry. With positive attitudes and more neutral assessments of behavioral control, ANTs are perceived as being beneficial but growers are not confident that they have the ability to adopt them. Perceptions of approval (i.e., injunctive norms) from the four referent groups (growers, industry, customers, family) were all positive and notably greater than perceived engagement (i.e., descriptive norms) from growers and industry. The highest approval for potential adoption was expected to be from family members. This could be because responding growers believe family members are likely to care the most about potential improvements to quality of life associated with ANT adoption. Or, perhaps many of the firms represented in the study are family businesses, so decision-makers strongly consider and seek family opinions. Further, within these family businesses other members of the family stand to personally benefit from ANT adoption whether from reduced engagement in some tasks personally or through their loved ones having more time available to spend with family. While reports of descriptive norms were positive but close to neutral, respondents perceived slightly less engagement among the growers they know than growers across the industry, implying growers may generally see their peers as less innovative than the industry as a whole. This finding can also be explained by the relatively low number of current ANT adopters that growers might have a chance to observe. The neutral descriptive norms imply ANTs are overall minimally diffused throughout growers’ social system and there is great potential for increased use of these innovations to address labor issues.
The second objective of this research was to identify factors predicting likelihood of future adoption of each of the four ANT categories. Likelihood of adopting irrigation application ANTs was predicted by attitude and growers’ descriptive norms with attitude having a positive relationship and growers’ descriptive norms having an inverse relationship. The first relationship was expected but the second raised questions. Could it be as intentions to adopt ANTs increase, growers see themselves as more innovative than their peers, and growers with lower intentions know they are less innovative? Why would this relationship only emerge for irrigation application ANTs? Perhaps this finding reveals a resistance to change spurred by feelings that existing irrigation routines are seen as sufficient compared to some of the other types of nursery tasks which can be automated, or an appreciation for the complex and nuanced decision-making that still must occur regarding when, how much, or at what interval water should be applied. While automated irrigation has been shown to reduce labor, manual irrigation is a task that generally is conducted by one-two workers because of its critical nature, not entire work crews like potting requires. The penalty for missing even one irrigation cycle can be catastrophic compared to missing one day of potting. Therefore, growers may think relinquishing oversight to automation may lead to plant death while accounting for the opportunity cost of those workers currently responsible for irrigation being available to perform other tasks that are not as easily or affordably automated. Finally, although most irrigation application ANTs are fairly affordable, there may be a layer of complexity to integrate these innovations into existing plumbing and wiring systems designed decades ago.
Irrigation application ANTs comprise the only technology cluster with a descriptive norm variable having a significant relationship with behavioral intent. Despite this relationship being in a counterintuitive direction, the lack of significance in the descriptive norm variables for all other ANT clusters and the presence of significant injunctive norm variables for two ANT clusters is interesting given what others do (i.e., descriptive norms) often relates to behavior more closely than what others approve of (i.e., injunctive norms). The range of diversity in influences of descriptive and injunctive norms on various audiences’ adoption or intent to adopt different practices found in the literature (e.g., [17,24,25]) underscores the need to conduct audience-specific research with specific technologies.
Likelihood of adopting plant transport ANTs was predicted by attitude only. It is interesting to note this technology cluster is the only one under the present study lacking a social predictor. This may be because some plant transport technologies are relatively new; that is, portable conveyer belts and Trike™ forklift are not widely used. In a recent survey, only 9% of respondents reported using a Trike™ and <15% of small (≤$1.4 M in sales) nurseries were using conveyers [38]. In contrast, nearly 75% of all nurseries use trucks, tractors, and wagons. There is great potential to save labor among producers by automating plant transport capabilities because the task is both time and labor consuming, as well as generally physically demanding. There is a prominent need for data regarding the socioeconomic impacts associated with adopting ANTs within this cluster to aid growers.
Likelihood of adopting plant handling ANTs was predicted by growers’ and customers’ injunctive norms, with growers’ injunctive norms having a positive relationship and customers’ injunctive norms having an inverse relationship. Attitude had marginal significance which would likely have emerged as significant with a larger sample size, which would make this construct the only consistent significant predictor among the four technology clusters. Attitude, therefore, appears to be of critical importance across various types of ANTs which corresponds to the Theory of Planned Behavior [19] and other behavioral research using this theory with other practices and audiences (e.g., [10,11,12,13,14,15]). However, the lack of relationship with perceived behavioral control, and inconsistent relationships with normative variables, do not align with the theory.
Likelihood of adopting agrochemical application ANTs was predicted by attitude, growers’ injunctive norms, and customers’ injunctive norms. Similar to the findings for plant handling ANTs, attitudes and growers’ injunctive norms had a positive relationship with behavioral intent and customers’ injunctive norms had an inverse relationship.
The inverse relationship between customer approval and intent to adopt either plant handling or agrochemical application ANTs raises interesting questions. In both cases, the effect size exceeded that of other significant variables. It is difficult to explain why this relationship exists. Perhaps growers believe customers would disapprove of their adoption of plant handling or agrochemical application ANTs, possibly due to a perceived increase in plant costs, but plan to adopt anyways because they know what is best for their operation and their customers. This finding could also reflect general resistance to technology or negative connotations among consumers about the term “technology” in a context where plants are perceived as natural and hands-on labor is valued. There may be a misalignment with the terms that do not match in growers’ minds which presents an opportunity for improvements in communication terminology and materials.
For both plant handling and agrochemical application ANTs it seems to matter more what growers believe other growers think (i.e., injunctive norms) rather than what growers believe other growers do (i.e., descriptive norms). Peer pressure may be high in this industry but because of the perceived social norms rather than observed/actual adoption. Therefore, a strong pressure to maintain one’s reputation and “fit in” with, or exceed, expectations may be a partial explanation. It is unclear where this ideal may come from and the complexities of social norms in this context should be given close attention in future research.
Perceived behavioral control was not a significant predictor of intent to adopt ANTs within any of the technology clusters, which aligns with previous research on water conservation intentions [11,17] but conflicts with reports on intent to convert to organic production [18,27] or use Green Information Technology [12]. This finding implies ability to adopt and use ANTs does not either bolster or hinder growers’ behavioral intent. Rather, individual assessments, represented by attitudes, and social dimensions consisting of others’ ANT use or others’ approval for ANT use, appear to be the most important factors in behavioral intent.
Although the findings raise many questions, they also present opportunities to improve dissemination of ANTs in practice both within and beyond the U.S. Those in both public and private sectors who develop, manufacture, and disseminated ANTs would benefit from a greater understanding of these findings so they can better support the industry. Dissemination of ANTs to address labor issues could potentially be strengthened by increasing attitudes among target grower audiences. Growers could be presented with the characteristics of various ANTs that lead them to develop positive perceptions about them (e.g., by presenting return on investment calculations or information regarding increased plant quality and labor times savings). Social norms must also be considered, but more audience research is needed to understand the counterintuitive normative findings. Following the theory, strategies to increase the visibility of others’ adoption of ANTs and increase others’ communication regarding approval for adoption of ANTs should lead to behavior change.
Automation solutions exist to reduce reliance on low labor availability in nursery production. Current automation adoption is relatively low at 33% of tasks that can be automated [38], and the results, herein, indicate that producers are generally neutral about future adoption even with mounting evidence of continued low labor coupled with demand for higher wages. Perhaps this population of agriculture producers adopts at lower rates generally than other sectors, or they simply do not want to or cannot abandon a production system designed and managed to historically rely on large volumes of low wage labor availability performing repetitive and tedious manual tasks. There is a very real chance that the nursery of the future that is both designed and constructed for automating present and future tasks while relying less on labor and maintaining plant quality is being envisioned currently. At some point, as labor decreases while wages and plant demand increase, producers may be forced to accelerate automation adoption to remain sustainable. In addition to studying economic factors stimulating adoption, a greater understanding of social and behavioral factors, and particularly the attitudes pertaining to ANT and perceived injunctive norms drawn from different referent groups, specific to this population is required.
The literature with which to compare the findings of this study largely focuses on environmentally desirable behaviors, and further research in the ANT domain is needed, especially through the lens of social sciences. The findings may be explored on a more granular level by comparing both descriptive statistics and regression results between men and women growers as well as by firm size or other key characteristics. There are opportunities to potentially improve upon the instrument used by developing indexes for the normative variables rather than single items. Additional statistical modelling, such as structural equation or probit modelling, would potentially provide a more powerful view of the relationship between the variables studied here and multiple approaches should be compared in future research.

5. Conclusions

Theory of Planned Behavior variables revealed behavioral intent within each of the technology clusters was negative but close to neutral with adoption of Plant Handling ANT being the most unlikely. The findings included overall positive attitudes and nearly neutral but positive perceived behavioral control surrounding ANT adoption. Perceptions of approval for ANT adoption were positive with that of family members being the strongest. Perceptions of adoption of ANTs among other growers and others across the industry were close to neutral but positive. Broadly, attitudes and social dimensions explain variability in intent to adopt ANTs within the four technology clusters, although the predictors were not consistent from one innovation to another. Much remains to be explored pertaining to the negative relationships between injunctive norms drawn from customers and intent to adopt two categories of ANT (plant handling and agrochemical application). Similarly, the negative relationship between perceptions of other growers’ adoption of irrigation application ANTs deserves further study. Future adoption may be most likely when potential adopters develop positive perceptions about ANTs and believe their referent groups are supportive of adoption.

Author Contributions

Conceptualization, L.A.W.; methodology, L.A.W. and A.L.R.; formal analysis, L.A.W.; investigation, L.A.W., A.L.R., A.F., A.V.L. and S.S.; resources, L.A.W., A.L.R., A.F., A.V.L. and S.S.; data curation, S.S.; writing—original draft preparation, L.A.W., A.L.R., A.F., A.V.L., S.S. and A.J.; writing—review and editing, L.A.W., A.L.R., A.F., A.V.L., S.S. and A.J.; funding acquisition, A.F., A.V.L., L.A.W. All authors have read and agreed to the published version of the manuscript.

Funding

This research was supported by USDA SCRI grant #2020-51181-32137 and USDA National Institute of Food and Agriculture, Hatch projects 1018367 and TEN00575.

Data Availability Statement

The data presented in this study are available upon reasonable request from the corresponding author.

Acknowledgments

The authors acknowledge Lauren Fessler for technical assistance and the L.E.A.P. Advisory Board for their participation in national stakeholder listening sessions.

Conflicts of Interest

The authors declare no conflict of interest. The funders had no role in the design of the study; in the collection, analyses, or interpretation of data; in the writing of the manuscript; or in the decision to publish the results.

References

  1. Hall, C.R.; Hodges, A.W.; Khachatryan, H.; Palma, M.A. Economic contributions of the green industry in the United States in 2018. J. Environ. Hortic. 2020, 38, 73–79. [Google Scholar] [CrossRef]
  2. Cruz, F.; Kostandini, G.; Mykerezi, E.; Jordan, J.; Tanellari, E. The effects of E-Verify on the share of labor-intensive and capital-intensive crops: Evidence from farm-level data. Agribus. Int. J. 2022, 38, 660–678. [Google Scholar] [CrossRef]
  3. Richards, T.J. Immigration reform and farm labor markets. Am. J. Agric. Econ. 2018, 100, 1051–1071. [Google Scholar] [CrossRef]
  4. Hall, C.R.; Ingram, D. Production costs of field-grown Cercis canadensis L. ‘Forest Pansy’ identified during life cycle assessment analysis. HortScience 2014, 49, 622–627. [Google Scholar] [CrossRef] [Green Version]
  5. Mathers, H.M.; Acuña, A.A.; Long, D.R.; Behe, B.K.; Hodges, A.W.; Haydu, J.J.; Schuch, U.K.; Barton, S.S.; Dennis, J.H.; Maynard, B.K.; et al. Nursery worker turnover and language proficiency. HortScience 2010, 45, 71–77. [Google Scholar] [CrossRef] [Green Version]
  6. Caplan, S.; Tilt, B.; Hoheisel, G.; Baugher, T.A. Specialty crop growers’ perspective on adopting new technologies. HortTechnology 2014, 24, 81–87. [Google Scholar] [CrossRef] [Green Version]
  7. Ling, P.P. From mechanization to the information highway. Greenhouse systems: Automation, culture and environment. In Proceedings of the Greenhouse Systems International Conference, New Brunswick, NJ, USA, 20–22 July 1994; pp. 5–7. [Google Scholar]
  8. Pan, M.; Linner, T.; Pan, W.; Cheng, H.; Bock, T. A framework of indicators for assessing construction automation and robotics in the sustainability context. J. Clean. Prod. 2018, 182, 82–95. [Google Scholar] [CrossRef] [Green Version]
  9. Posadas, B.C. Economic impacts of mechanization or automation on horticulture production firms sales, employment, and workers’ earnings, safety, and retention. HortTechnology 2012, 22, 388–401. [Google Scholar] [CrossRef] [Green Version]
  10. Hu, R. Garden-Related Behaviour and Invasive Plants: A Case Study in Wollongong LGA, New South Wales. Master’s Thesis, School of Earth and Environmental Sciences, University of Wollongong, Wollongong, Australia, 2014. Available online: https://ro.uow.edu.au/theses/4202/ (accessed on 2 September 2022).
  11. Shaw, B.R.; Radler, B.R.; Chenoweth, B.T.; Heiberger, R.; Dearlove, P. Predicting intent to install a rain garden to protect a local lake: An application of the theory of planned behavior. J. Ext. 2011, 49, 4FEA6. [Google Scholar]
  12. Dalvi-Esfahani, M.; Alaedini, Z.; Nilashi, M.; Samad, S.; Asadi, S.; Mohammadi, M. Students’ green information technology behavior: Beliefs and personality traits. J. Clean. Prod. 2020, 257, 120406. [Google Scholar] [CrossRef]
  13. Moons, I.; de Pelsmacker, P.; Pijnenburg, A.; Daems, K.; van de Velde, L.L.J. Growers’ adoption intention of innovations is crucial to establish a sustainable greenhouse horticultural industry: An empirical study in Flanders and the Netherlands. J. Clean. Prod. 2022, 330, 129752. [Google Scholar] [CrossRef]
  14. Hall, T.J.; Dennis, J.H.; Lopez, R.G.; Marshall, M.I. Factors affecting growers’ willingness to adopt sustainable floriculture practices. HortScience 2009, 44, 1346–1351. [Google Scholar] [CrossRef]
  15. Clark, W.A.; Finley, J.C. Determinants of water conservation intention in Blagoevgrad, Bulgaria. Soc. Nat. Resour. 2007, 20, 613–627. [Google Scholar] [CrossRef]
  16. Kumar Chaudhary, A.; Warner, L.A.; Lamm, A.J.; Israel, G.D.; Rumble, J.N.; Cantrell, R.A. Using the theory of planned behavior to encourage water conservation among extension clients. J. Agric. Educ. 2017, 58, 185–202. [Google Scholar] [CrossRef]
  17. Warner, L.A. Who conserves and who approves? Predicting water conservation intentions in urban landscapes with referent groups beyond the traditional ‘important others’. Urban For. Urban Green. 2021, 60, 127070. [Google Scholar] [CrossRef]
  18. Hattam, C. Adopting organic agriculture: An investigation using the theory of planned behaviour. In Proceedings of the International Association of Agricultural Economics Conference, Gold Coast, Australia, 12–18 August 2006. No. 1004-2016-78538. [Google Scholar] [CrossRef]
  19. Ajzen, I. The theory of planned behavior. Organ. Behav. Hum. Decis. Process. 1991, 50, 179–211. [Google Scholar] [CrossRef]
  20. Cialdini, R.B.; Reno, R.R.; Kallgren, C.A. A focus theory of normative conduct: Recycling the concept of norms to reduce littering in public places. J. Personal. Soc. Psychol. 1990, 58, 1015–1026. [Google Scholar] [CrossRef]
  21. Lapinski, M.K.; Rimal, R.N. An explication of social norms. Commun. Theory 2005, 15, 127–147. [Google Scholar] [CrossRef]
  22. Bicchieri, C. Norms in the Wild. How to Diagnose, Measure, and Change Social Norms; Oxford University Press: New York, NY, USA, 2017. [Google Scholar]
  23. Eisenstadt, S.M. Reference group behavior and social integration: An explorative study. Am. Sociol. Rev. 1954, 19, 175–185. [Google Scholar] [CrossRef]
  24. Warner, L.A.; Hobbs, W.H. Examining the potential role of descriptive norms in landscape water conservation programs. J. Ext. 2020, 58, 26. [Google Scholar]
  25. Uren, H.V.; Dzidic, P.L.; Bishop, B.J. Exploring social and cultural norms to promote ecologically sensitive residential garden design. Landsc. Urban Plan. 2015, 137, 76–84. [Google Scholar] [CrossRef]
  26. Warner, L.A.; Turner, S.; Lundy, L. Comparing linkages between descriptive norms and current and intended outdoor water conservation. J. Ext. 2020, 58, 16. [Google Scholar]
  27. Zhllima, E.; Shahu, E.; Xhoxhi, O.; Gjika, I. Understanding farmers’ intentions to adopt organic farming in Albania. New Medit 2021, 20, 97–111. [Google Scholar] [CrossRef]
  28. Lynne, G.D.; Casey, C.F.; Hodges, A.; Rahmani, M. Conservation technology adoption decisions and the theory of planned behavior. J. Econ. Psychol. 1995, 16, 581–598. [Google Scholar] [CrossRef]
  29. Lamm, A.J.; Warner, L.A.; Martin, E.; White, S.A.; Fischer, P. Enhancing extension programs by discussing water conservation technology adoption with growers. J. Agric. Educ. 2017, 58, 251–266. [Google Scholar] [CrossRef] [Green Version]
  30. Tama, R.A.Z.; Ying, L.; Yu, M.; Hoque, M.M.; Adnan, K.M.M.; Sarker, S.A. Assessing farmers’ intention towards conservation agriculture by using the extended theory of planned behavior. J. Environ. Manag. 2021, 280, 111654. [Google Scholar] [CrossRef]
  31. Ataei, P.; Gholamrezai, S.; Movahedi, R.; Aliabadi, V. An analysis of farmers’ intention to use green pesticides: The application of the extended theory of planned behavior and health belief model. J. Rural Stud. 2021, 81, 374–384. [Google Scholar] [CrossRef]
  32. Semuroh, J.; Sumin, V. Factors affecting the intention of sustainable agriculture practices among pepper farmers in Sarawak, Malaysia. Food Res. 2021, 5, 92–100. [Google Scholar] [CrossRef]
  33. Galati, A.; Sabatino, L.; Prinzivalli, C.S.; D’Anna, F.; Scalenghe, R. Strawberry fields forever: That is, how many grams of plastics are used to grow a strawberry? J. Environ. Manag. 2020, 276, 111313. [Google Scholar] [CrossRef]
  34. McKenzie-Mohr, D. Fostering Sustainable Behavior: An Introduction to Community-Based Social Marketing; New Society Publishers: Gabriola Island, BC, Canada, 2011. [Google Scholar]
  35. Rihn, A.L.; Velandia, M.; Warner, L.A.; Fulcher, A.; Schexnayder, S.; LeBude, A.V. Factors correlated with the propensity to use automation and mechanization by the U.S. nursery industry. Agribusiness 2022. [Google Scholar] [CrossRef]
  36. Warner, L.A.; Rihn, A.L.; Fulcher, A.; Schexnayder, S.; LeBude, A.V. Relating grower perceptions and adoption of automated nursery technologies to address labor needs. J. Agric. Educ. 2022, 63, 146–164. [Google Scholar] [CrossRef]
  37. Rogers, E.M. Diffusion of Innovations, 3rd ed.; Simon and Schuster: New York, NY, USA, 2003. [Google Scholar]
  38. LeaP for Sustainability Nursery Labor and Automation [LEAP]. LEAP Nursery Labor and Automation Survey; University of Tennessee: Knoxville, TN, USA, 2020. [Google Scholar]
  39. Yeary, W.; Fulcher, A.; Leib, B. Nursery Irrigation: A Guide for Reducing Risk and Improving Production. University of Tennessee Extension Publication PB 1836. 2016. Available online: https://extension.tennessee.edu/publications/Documents/PB1836.pdf (accessed on 20 August 2022).
  40. Belayneh, B.E.; Lea-Cox, J.D.; Lichtenberg, E. Costs and benefits of implementing sensor-controlled irrigation in a commercial pot-in-pot container nursery. HortTechnology 2013, 23, 760–769. [Google Scholar] [CrossRef]
  41. Cypher, Q.; Wright, W.C.; Sun, X.; Fessler, L.; Fulcher, A. Automated leachating fraction-based system reduces leaching, conserves water, and supports crop growth in a commercial nursery. Appl. Eng. Agric. 2022, 38, 807–816. [Google Scholar] [CrossRef]
  42. Fang, W.; Ting, K.C.; Giacomelli, G.A. Animated simulation of greenhouse internal transport using SIMAN/CINEMA. Trans. Agric. 1990, 33, 336–340. [Google Scholar] [CrossRef]
  43. Zhu, H.; Rosetta, R.; Reding, M.E.; Zondag, R.H.; Ranger, C.M.; Canas, L.; Fulcher, A.; Derksen, R.C.; Ozkan, H.E.; Krause, C.R. Validation of a laser-guided variable-rate sprayer for managing insects in ornamental nurseries. Trans. ASABE 2017, 60, 337–345. Available online: https://elibrary.asabe.org/abstract.asp?aid=47709 (accessed on 1 March 2022).
  44. Chen, L.; Zhu, H.; Horst, L.; Wallhead, M.; Reding, R.; Fulcher, A. Management of pest insects and plant diseases in fruit and nursery production with laser-guided variable-rate sprayers. HortScience 2021, 56, 94–100. [Google Scholar] [CrossRef]
  45. Fessler, L.; Fulcher, A.; Schneider, L.; Wright, W.; Zhu, H. Reducing the nursery pesticide footprint with laser-guided, variable-rate spray application technology. HortScience 2021, 56, 1572–1584. [Google Scholar] [CrossRef]
  46. Manandhar, A.; Zhu HOzkan, E.; Shah, A. Techno-economic impacts of using a laser-guided variable-rate spraying system to retrofit conventional constant-rate sprayers. Precis. Agric. 2020, 21, 1156–1171. [Google Scholar] [CrossRef]
  47. Lowenberg-DeBoer, J.; Huang, I.Y.; Grigoriadis, V.; Blackmore, S. Economics of robots and automation in field crop production. Precis. Agric. 2020, 21, 278–299. [Google Scholar] [CrossRef]
  48. Vaske, J.J. Survey Research and Analysis: Applications in Parks, Recreation and Human Dimensions; Venture Publishing: State College, PA, USA, 2008. [Google Scholar]
  49. AAPOR American Association for Public Opinion Research (AAPOR). Survey Outcome Rate Calculator 4.1. 2020. Available online: https://www.aapor.org/Education-Resources/For-Researchers/Poll-Survey-FAQ/Response-Rates-An-Overview.aspx (accessed on 1 March 2022).
  50. Ary, D.; Jacobs, L.C.; Irvine, C.K.S.; Walker, D. Introduction to Research in Education, 10th ed.; Cengage Learning: Boston, MA, USA, 2019. [Google Scholar]
Figure 1. Representative examples of the 4 technology clusters (a) Irrigation application: Irrigation timer; (b) Plant transport: TrikeTM horticultural forklift; (c) Plant handling: Potting machine; (d) Agrochemical application: Intelligent spray technology. Image credits: A. Fulcher and A. LeBude.
Horticulturae 08 01028 g001
Table 1. Individual Automated Nursery Technologies comprising technology clusters.
Irrigation application
  Irrigation scheduling technology (e.g., leaching fraction, moisture probes; do not consider a rain delay feature)
  Time-based irrigation controller
  Hose and gun or center pivot irrigation
  Permanent, rigid irrigation (such as PVC, field or container)
  Drip irrigation
Plant transport
  B&B tree handler: Tree Boss, Tree Jaws®, etc. to move B&B
  Forklift to move and space product
  Forklift to move B&B
  Trike to move and space product
  Tractor/truck/wagon to move product
  Conveyer belts
Plant handling
  Mechanical liner setter/planter (field)
  Potting machine
  Mechanical stake installer
  Lifter or shaker
  Tree spade
  Pneumatic c-ring fastener for burlapping
  Tying machine (during production; e.g., Max Tapener, etc.)
  Mechanical bundler or tying machine (post-harvest)
  Robotic plant spacers
Agrochemical application
  Pesticide application technology (e.g., GPS tracking, crop sensing)
  Granular fertilizer applicator
  Liquid fertilizer injector
Table 2. Descriptive statistics of Theory of Planned Behavior and normative variables.
VariableM (SD)
Intent to adopt
  Irrigation application ANT−0.188 (1.238)
  Plant transport ANT−0.257 (1.218)
  Plant handling ANT−0.379 (1.104)
  Agrochemical application ANT−0.112 (1.305)
Attitude1.252 (0.885)
Perceived behavioral control0.274 (0.745)
Injunctive norms
  Growers0.630 (0.831)
  Industry0.688 (0.821)
  Customers0.695 (0.770)
  Family0.935 (0.814)
Descriptive norms
  Growers0.029 (1.010)
  Industry0.117 (0.907)
Note. M, mean; SD, standard deviation.
Table 3. Theory of Planned Behavior and Normative Perceptions Predicting Likelihood of Adopting Irrigation Application Technologies among U.S. Nursery Growers.
ConstantAICR2Bβp
Overall model *−0.89733.1140.207 0.012
Attitude * 0.5320.3830.017
Perceived behavioral control
Injunctive norms −0.058−0.0370.804
  Growers 0.3620.2690.072
  Industry −0.325−0.2340.098
  Customers −0.359−0.2460.129
  Family 0.2930.2090.143
Descriptive norms
  Growers * −0.388−0.3350.007
  Industry −0.016 −0.012 0.917
Note. * indicates significant. B are unstandardized regression coefficients and β are standardized regression coefficients. AIC is the Akaike Information Criterion.
Table 4. Theory of Planned Behavior and Normative Perceptions Predicting Likelihood of Adopting Plant Transport Technologies among U.S. Nursery Growers.
ConstantAICR2Bβp
Overall model *−1.00444.5150.184 0.001
Attitude * 0.6550.4290.001
Perceived behavioral control 0.0320.0190.865
Injunctive norms
  Growers 0.2330.1610.157
  Industry −0.276−0.1880.112
  Customers −0.215−0.1350.295
  Family 0.1320.0880.440
Descriptive norms
  Growers −0.186−0.1490.137
  Industry −0.084−0.0610.533
Note. * indicates significant. B are unstandardized regression coefficients and β are standardized regression coefficients. AIC is the Akaike Information Criterion.
Table 5. Theory of Planned Behavior and Normative Perceptions Predicting Likelihood of Adopting Plant Handling Technologies among U.S. Nursery Growers.
ConstantAICR2Bβp
Overall model *−0.82414.2370.163 0.002
Attitude 0.3050.2290.054
Perceived behavioral control 0.2820.1850.095
Injunctive norms
  Growers * 0.2990.2320.040
  Industry −0.155−0.1190.285
  Customers * −0.440−0.3160.013
  Family 0.1910.1430.194
Descriptive norms
  Growers −0.069−0.0640.519
  Industry −0.048−0.040 0.675
Note. * indicates significant. B are unstandardized regression coefficients and β are standardized regression coefficients. AIC is the Akaike Information Criterion.
Table 6. Theory of Planned Behavior and Normative Perceptions Predicting Likelihood of Adopting Agrochemical Application Technologies among U.S. Nursery Growers.
ConstantAICR2Bβp
Overall model *−0.67553.8050.191 0.001
Attitude * 0.4100.2640.047
Perceived behavioral control 0.2560.1450.240
Injunctive norms
  Growers * 0.4100.2770.024
  Industry −0.203−0.1320.275
  Customers * −0.483−0.2990.031
  Family 0.2550.1630.185
Descriptive norms
  Growers −0.071−0.0550.627
  Industry −0.155−0.110 0.310
Note. * indicates significant. B are unstandardized regression coefficients and β are standardized regression coefficients. AIC is the Akaike Information Criterion.
Publisher’s Note: MDPI stays neutral with regard to jurisdictional claims in published maps and institutional affiliations.

