1. Introduction
The production of grapes in the United States (U.S.A.) is primarily concentrated in California and Washington. There are approximately 930,000 acres of bearing grape vineyards in these states, leading to an annual production of 6.1 million metric tons of economically viable grapes and an estimated production value of USD 5.7 billion [
1]. Together, these states make the national and international statistics. According to FAO, the estimated value of grapes produced in the U.S.A. (California and Washington combined) accounts for 7 percent of the world’s production value. In 2019, grapes generated approximately USD 81.5 billion worldwide immediately after harvest [
2].
While the expressive numbers from California and Washington make the statistics, developing grape industries in other parts of the country do not receive nearly as much attention. As a result, growers with commercial operations located elsewhere, local policymakers, and industry stakeholders are invited to generate their intelligence to support these emerging industries. In the Midwest region, for example, there were 12,300 acres of bearing grapes in 2014. That area rose 17.4 percent annually in the last three years of analysis to approximately 20,000 acres in 2017 [
3]. Michigan led the expansion with three-fold growth in both acreage and production figures. The other Midwestern states either reduced acreage or experienced marginal increases. On average, the other states combined had a 22.8 percent acreage reduction over the three years. The overwhelming difference among the states proves that the local industry performance is conditional on the availability of knowledge support on issues that are sensitive to expansion. This article is a modest attempt to generate knowledge and strengthen the midwestern grape and wine industry.
The production of grapes in the Midwest U.S.A. tends to be promoted by public–private agencies with variable policy agendas. In Ohio, for instance, the Ohio Grape Industries Committee allocates resources to projects and personnel based on stakeholders’ hearings and basic research via surveys with industry participants. Nevertheless, limited resources prevent the local leaderships from providing the support that emerging industries require. The grape and wine industry in Ohio and across the Midwest is at its infancy stage and needs further research to reach a self-sustainable size.
Mature grape and wine industries across the globe count on invaluable research support. Within the fields of production and agribusiness management, authors have focused on three main areas: (i) the wine market structure and consumer behavior [
4,
5,
6,
7,
8], (ii) production aspects of table and wine grapes [
9,
10,
11], and (iii) value chain governance and policy [
12,
13]. These articles studied established grape and wine markets such as the Italian, French, South African, and American markets. In some cases, these articles expanded the analysis to evaluate the country’s competitiveness in the international wine market.
The literature also covers interesting occurrences in developing grape and wine markets across the U.S.A. However, the number of studies is limited. The demand for local wine was the focus of analysis in [
14]. Using a sample of wine consumers from Ohio, Kentucky, Pennsylvania, and Tennessee, the authors studied the determinants of consuming local wines and visiting local wineries. Young consumers and rural residents had a higher propensity to try local wines. A second study focused on the demand for wine agritourism in Idaho [
15]. Using a travel cost method, the authors estimated that the value consumers extract from visiting a local winery is comparable to the cost of recreation alternatives. The results imply that Idaho consumers do not strongly prefer visiting local wineries.
Despite significant contributions, we argue that there is a shortage of quality studies on questions and concerns from existing and potential grape growers in developing markets. The literature in place covers marketing aspects of the wine industry that are more relevant for agents with a stake in downstream value chain nodes (retail, for instance). At the production node, the vineyard manager and the policymaker have numerous questions associated with the feasibility of existing and new production enterprises. To the best of our knowledge, one article in the literature addresses this question. The study aimed at the cost structure of grape vineyards and the feasibility of production operations in New York [
16]. This endeavor has never been carried in the Midwest region.
The purpose of this article is to present two samples of production budgets for grapes in the Midwest U.S.A. Budgets are important to guide existing and new growers on production factors to consider when planning or evaluating the enterprise. The sample budgets report investments, operational costs, and fixed costs to grow a popular American-hybrid cultivar and a vinifera cultivar. We rely on primary data stemming from a digital survey with grape growers and secondary data from multiple sources to support our estimations. The collected data led the authors to prepare the sample budgets considering the most common set of activities and horticultural practices adopted by growers. In that sense, the budgets reported in this study are expected to represent the average grape grower in the Midwest U.S.A. It would not be unusual, nevertheless, if the sample budgets reported here fail to capture the specifics of a given operation. Our main goal is to present the factors that decision makers would need to succeed in producing hybrid or vinifera grapes.
After presenting the sample budgets, this article reports a comparative analysis of results obtained from the survey with growers and a feasibility analysis embedded with alternative scenarios. While the comparative analysis highlights key differences in growers’ decisions when conducting key operations in the vineyards, the feasibility analysis reports the performance of three financial indicators under plausible scenarios. It may become evident to readers that balancing labor use and capital intensity may reduce operational costs and improve feasibility of enterprises. In addition, the analyses conducted in this study help explain why vineyards are frequently integrated with wineries and other business units across the Midwest U.S.A.
2. Materials and Methods
2.1. Preparation of Sample Production Budgets
We used primary and secondary data for the preparation of grape production budgets. Primary data were collected via anonymous surveys with grape producers across the Midwest USA. The survey was written and pre-tested in Ohio with industry experts and growers. After small adjustments and editorial work, the validated survey was distributed in 13 states by viticulture and horticulture specialists. The states of interest were Illinois, Indiana, Iowa, Kansas, Kentucky, Michigan, Minnesota, Missouri, Nebraska, North Dakota, Ohio, South Dakota, and Wisconsin. In total, we obtained 45 valid responses from growers with established operations. The responses were useful to illustrate investment and operational decisions commonly made across midwestern operations. Despite differences in the responses provided, our sample budgets capture the most common set of practices in vineyards of vinifera cultivars and American-hybrid cultivars.
Based on the grower’s responses to the survey, auxiliary market research was conducted to collect primary data on input prices for ag-chemicals, fertilizer blends, and soil amendments. The latter research was conducted by a graduate student from The Ohio State University. Price observations were collected primarily with sale representatives from multinational firms and from distributors that conduct transactions online. Price estimates were also collected via phone.
Multiple sources of secondary data were consulted. The sources include: (i) U.S. Bureau of Labor Statistics for farmworker wages [
17], (ii) the most recent fungicide spray program for grapes in Ohio [
18], (iii) the 2018 Weed Control Guide for Ohio, Indiana, and Illinois [
19], and (iv) Ag Decision Maker tables prepared by Iowa State University Extension and Outreach [
20,
21]. We describe in detail below every source consulted to integrate a rich dataset before preparation of sample budgets. Given the broad scope of resources and inputs available for production of grapes in a rather wide geographical region, our budgets rely on informed assumptions when necessary. The next paragraphs present the sources of secondary data and explain the reasoning behind our assumptions when appropriate.
Labor costs—We estimated wage averages for two occupations reported by the U.S. Bureau of Labor Statistics in the Occupational Employment and Wage Statistics report. For the purposes of this study, we considered “farmworkers and laborers” (occupation code 45-2092) as unskilled labor, and “agricultural equipment operators” (occupation code 45-2091) as skilled labor. The average wages were computed based on 12 Midwestern states plus Kentucky. The wage averages used in this study are USD 15.01, and USD 18.34 per hour, respectively.
Fungicides and insecticides—The plant pathology article number 147 “Developing an Effective Fungicide Spray Program for Grapes in Ohio” [
18] offers a comprehensive treatment of disease control in grapes. It presents a multitude of products that can be combined to define effective spray programs. For the purpose of this study, we defined a spray program that attempts to consolidate to the best of our effort survey responses and recommendations stemming from this article. It is important to note that the spray programs considered in this study are not technical recommendations. Always consult with pest and disease management professionals to define a spray program that fits your operation settings and needs.
Herbicides—The bulletin 789 “2018 Weed Control Guide for Ohio, Indiana, and Illinois” [
19] was consulted in a similar fashion. We selected a set of products that were commonly mentioned in survey responses and extracted further recommendations from the bulletin. When reported products were not found in the bulletin we turned to labels of commercial products and extracted technical recommendations from that source. The products and active ingredients considered in this study should not be interpreted as technical recommendations. Always consult with crop scientists and weed experts before deciding on products to spray in your vineyard.
Efficiency of field operations and fuel requirements—We estimated costs for mechanized operations conducted in vineyards departing from primary survey data and technical parameters extracted from tables and spreadsheets previously published by Iowa State University Extension and Outreach [
20,
21]. The costs for non-mechanized operations were estimated based on survey data only.
2.2. Feasibility Analysis
Departing from the sample budgets for a vinifera cultivar and for an American-hybrid cultivar,
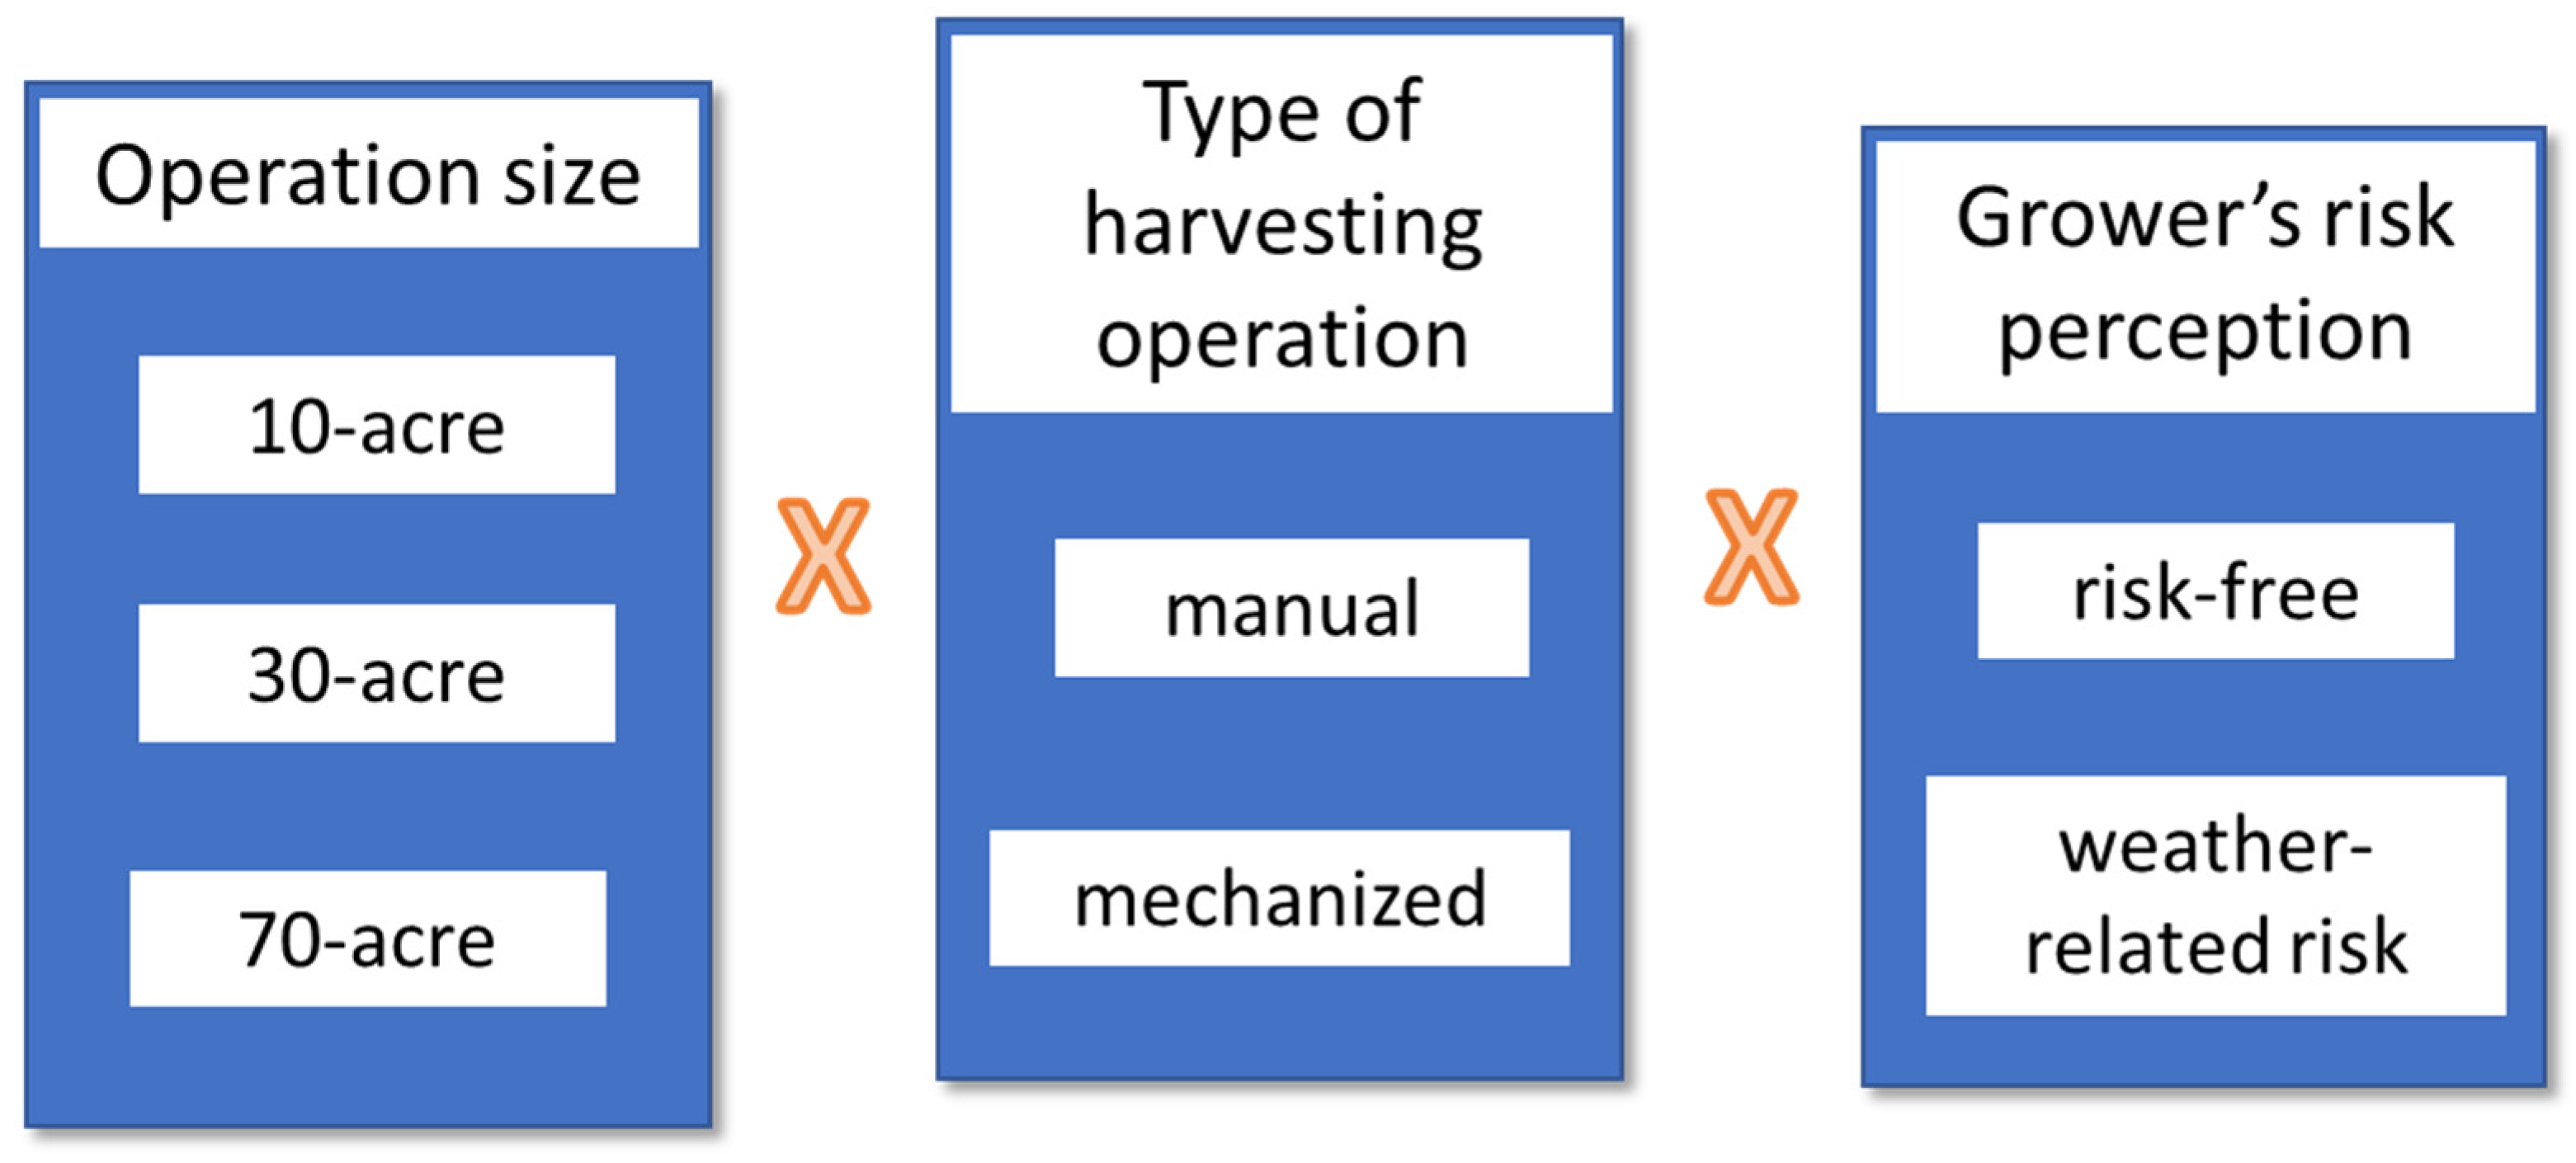
Section 3.4 of the article examines the economic performance of vineyards when three parameters are modified. Alternative operation sizes (10-acre, 30-acre, and 70-acre), types of harvesting operation (manual labor and mechanized operation), and growers’ risk perceptions (risk-free and weather-related risk) take individual levels and are combined to create plausible scenarios for analysis. In total, we report results on 24 alternative scenarios, 12 for hybrid cultivar vineyards and 12 for vinifera cultivar vineyards.
We chose to simulate changes to the parameters ‘operation size’, ‘type of harvesting operation’, and ‘growers’ risk perceptions’ as these parameters are the most likely to impact feasibility. It is widely recognized in the production management literature that economies of scale tend to reduce average operating costs [
22]. The investment in expensive assets is also known for impacting fixed costs [
23]. In addition, our survey results show that commercial grape operations across the Midwest vary significantly in operation size and type of harvesting practice. Simulating these parameters will allow the research results to better represent the reality in which grape growers operate. Finally, open-field crops are highly vulnerable to biotic pressure and abiotic stresses. By simulating different levels of risk, as captured via survey responses, our model will be better equipped to represent what growers experience in reality.
This analysis departs from a 25-year cash flow, resembling the lifespan of productive vineyards. The key financial indicators considered in this analysis are Net Present Value (NPV) and Payback computed at 5% annual discount rate, and Internal Rate of Return (IRR). The NPV indicator demonstrates the net economic value of a given project, or set of investments, over the entire lifespan of that project. Payback refers to the amount of time necessary to recover an investment at a predefined discount rate. Finally, the IRR indicator expresses the discount rate at which the net present value of a project breaks even. A more formal definition for the financial indicators used in this article can be found in [
23]. In this study, we assume a 5% discount rate for the NPV and Payback calculations. We assume an annual discount rate of 5% as it reflects a representative cost of capital rate, and it assumes more risk than the U.S. Department Treasury Bill (at 3% approximately). The NPV model has been used in other studies to estimate net profits resulting from alternative investments or cost simulations [
11,
16].
We are primarily interested in examining how these indicators behave under different scenarios.
Figure 1 below summarizes all interactions considered in the scenarios. It is worth noting that other scenarios could have been examined and reported. The decision to focus on 24 scenarios has to do with the most common types of operations and practices observed in the survey data we gathered.
3. Results
3.1. Sample Production Budget for a Hybrid Cultivar
Study participants indicated via survey responses a wide range of American-hybrid cultivars being grown across the Midwest. In total, 41 cultivars were reported. The use of multiple cultivars in the same production plot was not unusual amongst respondents. The most common cultivars reported were Marquette, Frontenac Gris, Frontenac Blanc, La Crescent, and Petite Pearl. Survey results indicate that the average size of a hybrid vineyard is 8 acres, and plots as small as 2 acres are frequent in the Midwest. Vineyards varied in size from 1 to 40 acres through the survey, which corresponds to the acreage span of the population. For the purposes of preparing a budget for an American-hybrid cultivar, we assumed a 10-acre vineyard grown with Marquette and spaced 10″ apart between rows and 8″ apart between vines.
The investments for establishing a new vineyard of Marquette cultivar are assumed to span three years—year 0 through year 2. Although not necessarily the case, this assumption is unlikely to bias expected economic returns or the overall economic feasibility of a new enterprise. Construction of the trellis system and vine planting are two operations that together account for 77% of the initial investments. Survey responses indicate that the high-cordon (HC) system with two wires dominates any other alternative system. In total, the construction of the HC trellis system is estimated at USD 3625.20 per acre. End and line posts are the most important construction costs. Wooden end posts with 6-inches diameter and 10 feet long were the most frequently used. Growers also reported that wooden line posts with 4-inches diameter and 8 feet long are more frequently used than steel posts. The vine planting operation is estimated to cost USD 3679.37 per acre, and the vine unit cost stands as the most important driver. Survey responses indicate that growers pay on average
$4.30 per vine. Considering the 10″ × 8″ spacing arrangement, a total of 544 plants are needed per acre, leading to USD 2339.20 or 63.6% of the vine planting operation cost.
Table 1 details the items that integrate these investments.
During productive years, spraying operations to control pests and diseases stand as the most important cost of production. Survey responses indicate that 12 applications are frequently necessary to produce quality fruit. Our estimations based on primary and secondary data suggest that growers spend
$563.05 per acre in spraying operations per season. Fungicides and insecticides together represent 86% of that amount. Growers also report that foliar fertilizers are often mixed with chemicals in the spraying tank. On average, growers conduct five applications of foliar fertilizer during the season and spend USD 49.83 on average. Other types of solid fertilizer are applied to the soil every three years and represent an annual average of USD 28.57 per acre.
Table 2 presents the spraying program considered in the production budget for the Marquette cultivar. It is important to highlight that the spraying program presented in
Table 2 does not constitute a technical recommendation.
The second most important set of operations in terms of variable costs are those related to canopy management. Survey responses suggest that 31% of total variable costs are costs of pruning and training plants, cleaning the vineyard after pruning, suckering and shoot thinning, shoot positioning (combing), leaf pulling, and skirting. Growers of hybrid cultivars often rely on manual labor for these operations, which may explain the higher operational costs when compared to producers of vinifera cultivars (a comparative analysis follows below). Canopy management operations take approximately 37 h to execute and account for USD 559.52 per acre during productive years.
Harvesting operations represent the third most important variable costs. Similar to canopy management practices, growers tend to rely on manual labor more often than on mechanization. In total, growers spend USD 285.82 per acre to harvest ripe grapes, and manual labor accounts for 97% of that total.
The fixed costs considered in our production budgets are depreciation of machinery and equipment, the opportunity cost of land, and insurance of self-propelled machinery. Together, these costs account for 20% of total costs during productive years. Depreciation of machinery was estimated based on the number of physical assets employed in production activities, their original prices, the expected longevity of machines and equipment, and interest rate. Survey responses indicate that growers of hybrid cultivars manage vineyards with few pieces of equipment, which explains the heavy reliance on manual labor for important operations like pruning and harvesting. Our computations assume an annual interest rate of 3%. Results led to an annual depreciation amount of USD 654.87 per acre from year 0 through year 12. Depreciation was reduced to zero onwards to year 25 as machines and equipment would be fully depreciated after the 12th year. Therefore, the depreciation average during productive years is estimated at USD 267.90 per acre.
Table 3 summarizes the equipment and machinery considered in the study.
We relied on secondary data from USDA/NASS to estimate the average opportunity cost of land. Opportunity cost of land is defined as the expected economic return that could be generated if the land were dedicated to the second-best alternative use. We assume that renting out the land is the second-best alternative use for most growers across the Midwest. In that sense, we turned to the USDA/NASS database for land rents and estimated the average farmland rent in the region of interest. Our computation led to USD 144.00 per acre on average across all 13 states considered in this study. Finally, insurance of self-propelled machinery is assumed to be 1% of the original price paid for the equipment. In total, growers are estimated to spend USD 36.50 per acre to insure the most expensive machines over the years of use.
Table 4 summarizes budget items and production costs for a 10-acre Marquette vineyard. Values are presented on a per-acre basis.
Annual returns are computed based on survey responses. While it must be recognized that Marquette tends to be a lower yielding variety when compared to Vidal, Chambourcin, and others, it was the most frequent cultivar reported by study participants across the Midwest U.S.A. Respondents indicated an average yield of 1.725 tons (or 3450 pounds) per acre and selling prices of USD 1600 per ton. The average yield obtained in this study is comparable to 2019 estimations amongst Ohio grape growers [
24]. Crop specialists, nevertheless, suggest that yields between 5 and 6 tons per acre should not be unusual for professional growers. The reported prices are relatively higher than expected. In a regular season with mild weather patterns, hybrid grapes sell at the farm for USD 1000 per ton approximately. Reported yield and prices lead to an average return of USD 2760 per acre in this study.
3.2. Sample Production Budget for a Vinifera Cultivar
Study participants indicate a relatively small list of vinifera cultivars being grown in the Midwest. Our survey suggests that vinifera vineyards vary in size from 3 to 85 acres, with the average at 34 acres. In total, six cultivars were reported, and we prepared a sample budget for a 30-acre plot of Cabernet franc cultivated in a vertical shoot position (VS) system and arranged in an 8.5″ × 6″ (row × vine) spacing. During establishment years, the costs associated with the trellis system construction and vine planting operation are the most representative amounts. Our estimates suggest that trellis construction alone sums USD 5907.99 per acre and represents 57% of the initial investment. The vine planting operation costs USD 3346.83 per acre and accounts for 32% of the total investment.
From
Table 5 one can observe that materials drive the costs of trellis system construction. Line posts lead as the most representative item, followed by catch wires. Given the narrow row and vine spacing utilized, survey respondents indicate that 255 line posts are necessary to sustain the rows. Line posts are reported to cost USD 9.43 per unit on average. Three pairs of catch wire and a single run of fruit wire seem to be a common structure for vinifera vineyards. In this arrangement, growers need 36,000 feet of wire approximately, leading to a total wire cost of USD 848.82 per acre. Galvanized 12.5-gauge steel wire is the most common type of wire employed in the vineyards. Growers use manual labor and a combination of tractor and mounted post driver for the installation of end and line posts. In the vine planting operation, the unit cost of vines stands as the most important cost driver. Considering the spacing arrangement adopted, 854 vines per acre are necessary. Survey respondents reported that USD 3.56 per vine is the average price paid, leading to a total cost of USD 3040.24 per acre. The cost of vines alone accounts for 91% of the planting operation cost.
The most impacting variable costs are associated with disease/pest control and canopy management operations. Together, these operations sum USD 683.31 and USD 303.13 per acre, respectively. Growers indicated via survey responses that 14 spraying operations during the growing season is a common practice, and chemicals and biopesticides are by far the most representative elements in pest and disease control. According to our estimations, chemicals and biopesticides account for 84% of pest and disease control. Similar to growers of hybrid cultivars, vinifera growers also spray foliar fertilizers along with chemicals during the growing season. This fertilization practice takes advantage of numerous entries in the vineyard to nurture plants while controlling diseases and pests. Vinifera growers spray foliar fertilizer five times on average during the season. Solid fertilizer is also employed but used less frequently with one application every three years on average.
Table 6 presents the spraying program considered in the sample budget for the Cabernet franc cultivar. Products and application rates presented in
Table 6 do not constitute a technical recommendation.
About one third of the cost associated with canopy management comes from pruning and training operations. Pruning and training vines sum USD 105.58 per acre. These operations rely on mechanized pre-pruning and manual labor. Suckering, shoot thinning, shoot positioning (tucking), leaf pulling, and hedging are the other operations that together sum USD 197.55 per acre. Except for the hedging operation that also uses mechanized support, all other operations depend on manual labor. Our estimations suggest that canopy management operations take 19 labor hours per acre to execute when mechanized aid is used.
Different from hybrid growers, vinifera growers conduct two additional operations to control cold injury in the graft union of vines. These operations are often referred to as hilling-up and de-hilling, with the former being conducted late in autumn and the latter being conducted by mid spring. These operations are mechanized and sum USD 130.88 per acre on average. They are reported below along with lawn mowing and grass trimming under “other operations”.
Harvest operations are frequently mechanized, and the use of self-propelled harvesters is not unusual amongst large operators. Our estimations using primary and secondary data suggest that a mechanized operation costs USD 47.95 per acre while a completely manual operation is estimated at USD 463.33 per acre of a vinifera vineyard. Our sample budget for a 30-acre Cabernet franc vineyard considers a mechanized harvest operation.
Regarding fixed costs, depreciation of machinery and equipment stands as the most important budget item and accounts for 65% of the total fixed cost. This item alone suggests that vinifera operations are more intense in capital use than hybrid cultivar operations. Capital intensity, nevertheless, tends to reduce the dependence and cost of manual labor in many operations. A closer comparative analysis is conducted in
Section 3.3. To compute depreciation, we assumed a 3% annual interest rate. Our estimations lead to annual depreciation amounts of USD 1427.67 per acre from year 0 through year 10. Depreciation was reduced to zero onwards to year 21. Thus, average depreciation during productive years is estimated at USD 454.26 per acre.
Table 7 summarizes the equipment and machinery used in a representative vinifera cultivar operation.
The average opportunity cost for the land was estimated from secondary data. We used USDA/NASS data to estimate the average farmland rent at USD 144.00 per acre. We assume that land rent serves as a good proxy for the opportunity cost of land. Finally, insurance of self-propelled machinery was estimated as 1% of the machinery’s original value. Together these three fixed cost items sum USD 692.93 per acre and account for 30% of the overall cost in productive years.
Average return per acre was estimated based on survey responses. Midwestern vinifera growers indicated an average yield of 3 tons per acre and the value of production at USD 1800 per ton. Simple computation leads to returns of USD 5400 per acre on average. These averages are comparable to results reported in the 2019 Ohio Grape Production and Pricing Index [
24], and in the 2020 production budget for operations in the finger lakes region of New York [
16]. Although return results may sound counterintuitive, our sample shows that vinifera grape growers tend to obtain higher yields than hybrid grape growers. This fact may be related to the level of automation or knowledge applied to field practices and operations. Other counterintuitive aspects are detailed in
Section 3.3, where we compare results from vinifera growers versus hybrid growers.
Table 8 summarizes budget items and production costs for a 30-acre Cabernet franc vineyard. Values are presented for a 1-acre unit.
3.3. Comparative Analysis of Budget Items: Hybrid versus Vinifera Operations
A deeper understanding of budget items may be withdrawn from direct comparisons between hybrid and vinifera operations. Although comparisons are possible, especially regarding common practices and allocation of capital, interpretations must be done carefully as the sample budgets depart from different assumptions to better represent survey respondents.
The first budget item that deserves attention is the cost of building the trellis system. Our estimations indicate that the structure needed to produce vinifera cultivars costs 63% on average more than the structure necessary to produce hybrid cultivars. When it comes to vine planting, vinifera growers tend to procure young vines at a relatively lower cost when compared to hybrid cultivar growers. Our sample indicates that vinifera growers spend on average USD 3.56 per vine while hybrid cultivar growers spend USD 4.30 per vine. This result may sound counterintuitive because vinifera vines are often grafted plants, which require more time and effort to produce. However, it is plausible to infer that economies of scale and effectiveness in input procurement play an important role. Our survey sample is primarily composed of mid- large-scale vinifera growers averaging 34 acres and small-scale hybrid growers who operate 8-acre vineyards, on average.
The eventual difference in acreage cost inherent to vine prices is partially offset because hybrid growers need 544 vines to establish a 1-acre plot in a 10″ × 8″ spacing arrangement, whereas vinifera growers need 854 vines per acre in an 8.5″ × 6″ spacing scheme. Another point of consideration is the type of equipment used for planting the vines. Our sample shows that vinifera growers tend to adopt a more efficient mechanization process for planting the vines. While new vinifera vineyards are established using the combination of a tractor with furrow plow and a tractor with disc, hybrid vineyards are frequently established using tractor power with a mounted posthole auger. Both operations lead to well-established vineyards, but posthole augers require more time and manual labor to fill the holes and firm the soil around the young vines. Based on our estimations, the cost difference associated with the choice over operation types for vine planting may reach USD 1000 per acre.
An appropriate balance between capital intensity and labor use may also benefit financial indicators. Our sample suggests that growers of hybrid cultivars tend to employ less capital than vinifera growers. While hybrid growers are estimated to employ USD 7761 per acre in equipment value, vinifera growers dedicate USD 14,095 per acre in machinery value terms. This difference has numerous consequences. On one hand, the difference and broader use of mechanization impact depreciation: the fixed cost item is 70% higher in vinifera vineyards than in hybrid vineyards (i.e., USD 454 versus USD 268, approximately). On the other hand, less mechanization tends to raise variable costs. Pruning, shoot trimming (skirting or hedging), and harvesting are the most sensible operations to mechanization. Our estimations show that pruning operations can be USD 118 less expensive per acre in vinifera vineyards when a pre-pruner is used in comparison to the use of hand shears alone. Shoot trimming can be USD 198 per acre less expensive if mechanized trimmers are employed in vinifera operations when compared to the use of hand shears. Finally, mechanical harvest tends to reduce operation costs in vinifera vineyards by USD 415 per acre when compared to manual labor assisted with a tractor and a trailer. To put it in perspective, one may notice that savings in labor caused by investments in a pre-pruner, a mechanized trimmer, and a grape harvester more than offsets the increased annual depreciation. A similar comparative analysis is possible for hybrid cultivar vineyards.
Nevertheless, the decision-maker may face budget restrictions when it comes to the acquisition of mechanized equipment. Our estimations suggest that a substantial investment (somewhere between USD 70,000 and USD 170,000 depending on the equipment) would be necessary to cause a USD 731 reduction in variable costs. Operation size and other farm-specific characteristics must be considered by the decision-maker when estimating the feasibility of investing in mechanization. Not all operations will enjoy gains in economies of scale stemming from mechanized assets. In the vinifera case studied here, annual depreciation cost would increase by approximately USD 159 (considering the 25-year project lifespan) but the gains in reduced operational cost would still present advantages.
Another comparison that deserves attention is the apparent preference of hybrid growers for renting equipment or hiring custom applications in operations that seem secondary. In our sample, vinifera growers tended to rely on owned equipment and machinery to conduct operations. Hybrid growers, on the other hand, reported the use of rented equipment for land and site preparation and cover crop seeding during establishment years. Hybrid growers also reported contracting out soil analyses and application of soil amendments. In general, these decisions maintain capital expenditures low but tend to increase variable costs. Our estimations indicate that hybrid growers spend USD 1125 on average to rent equipment for soil land and site preparation and forego investments in physical assets that are likely to sum up higher amounts.
A final comparison relates to superior yields obtained by vinifera growers when compared to hybrid growers in our sample. Economies of scale, higher level of automation, and the effectiveness in conducting field operations are plausible reasons for the difference in performance. While hybrid growers operate small plots (8 acres on average), employ manual labor more often than mechanized equipment, and outsource secondary activities, vinifera growers take a different approach. As a result, vinifera growers tend to obtain more yield per acre and reach productivity levels as expected by crop advisors. Sampled hybrid growers, on the other hand, produce less despite the higher potential of hybrid varieties.
3.4. Feasibility Analysis
In this section, we organize growers’ expected economic returns, risk perceptions to bad weather, acreage, and types of harvesting operations into 24 scenarios. For each scenario, three financial indicators are reported: NPV and Payback computed at a 5% discount rate, and IRR. We depart from a cash flow analysis and assume that vineyards have a lifespan of 25 years, where the first three years are establishment (investment) years. In year 3, the economic return is assumed to be half of its usual return in productive years. From year 4 on, the annual economic return is assumed stable at the average computed value based on yield and appraisal value reported by growers through the survey. When weather risk is considered, annual economic returns during productive years are reduced by 15% every three years.
Hybrid cultivar growers indicated a production yield of 1.72 tons per acre and valued their production at USD 1600 per ton. Thus, annual cash flows of USD 2760 per acre were considered in productive years for this analysis. The economic return in year 3 is assumed at USD 1380. Vinifera growers reported an average yield of 3 tons per acre. Although survey respondents mentioned that the harvest is seldom sold, growers appraised their production at USD 1800 per ton. Thus, the expected economic return used in the analysis in absence of risk is USD 5400 per acre during productive years. Return in year 3 is assumed at USD 2700 per acre. When risk is considered, economic returns are reduced 15% in years 6, 9, 12, 15, 18, 21, and 24. It is important to highlight, however, that the average yields and appraisal values used in this section for hybrid and vinifera grapes may not reflect long-term returns. We used average values as obtained through a survey administered between October 2020 and February 2021.
Table 9 summarizes our findings in the inner cells where acreage, harvest type, and risk perception intersect. The red shaded cell presents the financial indicators for a 25-year cash flow of a 10-acre Marquette vineyard with manual harvest in absence of risk. Adjacent cells show the resulting financial indicators when one or multiple factors (operation acreage, harvest type, and risk) are modified. Interpretation goes as follows: a given 10-acre Marquette vineyard harvested manually and in absence of risk may see improvement in its indicators if 20 acres are added to the operation. Internal Rate of Return (IRR) moves from −1.5% to 1.6%. Net Present Value at a 5% discount rate remains negative but improves considerably from the previous scenario. A second example: the same 10-acre Marquette vineyard breaks even at a 4.5% discount rate if 60 acres are added into production and harvest is mechanized. A third and final example: a 70-acre Marquette vineyard with mechanized harvest may experience a reduction in performance of financial indicators if risk of production loss is considered. The estimated NPV at a 5% discount rate falls from negative USD 600 to USD 2055 per acre, and IRR decreases by 1.2%. The same logic applies to
Table 10 for examining the estimated financial performance of a vinifera vineyard under alternative scenarios.
Results from
Table 9 demonstrate that under the set of assumptions utilized in this study, growing hybrid cultivars is seldom feasible as a stand-alone project in the Midwest U.S.A. These results support the fact that numerous operations across the Midwest are integrated with other business units. A complementing analysis indicates that there are 556 verified businesses operating ‘grape vineyards’ (NAICS code 11133201) across the 13 states considered in this study. Out of the 556 businesses, only 27 enterprises (4.9% of the sample of verified businesses) operate stand-alone vineyards. The vast majority of businesses (342 firms, or 61.5% of the sample) list ‘wineries’ (NAICS code 31213001) as their primary activity and ‘grape vineyards’ as the secondary or tertiary activity. The remainder of firms (187 enterprises) complement the ‘grape vineyard’ business unit with activities ranging from space for events to restaurants, hotels and inns, agritourism operations, liquor stores, and small-scale crafts markets [
25].
All 12 scenarios examined in
Table 9 show IRR below a 5% discount rate. Small-scale operations (10 acres) are unfeasible regardless of the harvest type or risk exposure. Out of the six scenarios under risk of production loss, we found positive IRR for medium and large operations (30 acres and above).
Vinifera vineyards tend to reach slightly higher financial performance in the Midwest U.S.A. when compared to hybrid vineyards. The study of scenarios in
Table 10 demonstrates that small-scale operations show positive IRR regardless of risk perception or harvest type. It is worth noting that manual harvesting operations lead to superior financial performance than mechanized harvest in small vineyards. The financial performance of small vinifera operations, nevertheless, is unlikely to attract stand-alone investments.
Financial performance improves considerably for mid- and large-scale operations. The estimated IRR ranges from 10.4% (30-acre operation with mechanized harvest when risk of production loss is considered) to 16% (70-acre operation with mechanized harvest in absence of risk) in all eight scenarios examined. Despite higher initial investments per acre for the establishment of vinifera vineyards (estimated at 9.4% above the investment necessary for a hybrid vineyard), mid- and large-scale enterprises tend to pay off between 10 and 16 years.
4. Conclusions
The results simulated in this article suggest that the establishment of American-hybrid cultivar vineyards requires USD 9500 per acre approximately. During productive years, variable costs sum USD 1806 per acre. Expected returns derived from growers’ experiences lead to USD 2760 per acre in annual sales and USD 506 per acre in net returns. Additional analyses demonstrate that hybrid cultivar vineyards are seldom feasible as stand-alone projects in the Midwest U.S.A., especially for small-scale operations (10 acres or less) and under risk of production losses due to extreme weather events.
This study also shows that vinifera vineyards are more expensive to establish. Based on survey data and auxiliary secondary data sources, our estimations suggest that new vinifera vineyards take USD 10,455 per acre to establish. Variable costs sum USD 1586 per acre during productive years. Growers report an average yield of 3 tons of viable grapes per acre and appraise the production at USD 1800 per ton. Under these assumptions, annual sales become USD 5400 and net returns USD 3121. Additional feasibility analyses demonstrate that mid- and large-scale vinifera vineyards are feasible at a 5% discount rate even when weather-related risk is considered.
This research uses standard farm financial management tools of accessible communication across policy-oriented, scientific, or professional audiences. The directness of the analytical approach, nevertheless, should not be confounded with a lack of contribution. Policymakers, for example, may find it interesting to know that small-scale vineyards, detached from other business units, are economically unfeasible in the Midwest U.S.A. This result alone may be considered as new policies are devised to promote value-aggregated crops, or to generate initial incentives for beginning and unprivileged farmers. Without a broader organizational approach, perhaps including guidance on establishing more complex business ventures or building geographically protected brands, recipients of policy-supported programs may learn about grape production the hard way. Supported enterprises will fail after a few years in business. These examples of policy attempts are unlikely to succeed if policymakers neglect our research contributions.
From the scientific standpoint, the sample budgets for American-hybrid and vinifera cultivars may be interpreted as baselines for further research. How would the introduction of a new spraying technology impact the costs and expected returns of a representative midwestern grape vineyard? How would alternative investments in automated equipment perform financially? To what extent would collaborative action and the establishment of processing alliances strengthen small-scale producers’ cash flow? These and other research questions need to depart from crop budgets. Our research work fills that baseline need.
Finally, practitioners may use our results to consider alternative business layouts. Our sample budgets and simulated discrete scenarios are the first steps toward preparing venture-specific business plans. New and existing business owners may choose to replicate our analyses while incorporating their specific vineyard practices and assets, leading to deviations from our reported budgets either by reducing costs or increasing sales. Practitioners may use partial budgeting techniques for that matter. It is worth mentioning that our results are beneficial for this audience due to the inclusive language used throughout. Midwestern grape growers are likely to follow our analysis without additional support or “translation” from third parties or expensive crop consultants.
This study is not free of limitations. We argue that both sample budgets and discrete scenarios for feasibility assessment are of difficult generalization. This research focused on vineyards and vineyard owners with existing operations in the Midwest U.S.A. Therefore, the results obtained and reported through this article are conditional to the data collected within a limited geographical region and to supplementary assumptions. In addition, one must note that basing the analysis on a representative operation may fail to capture the reality of any given operation. That is particularly true in the era of industrial agriculture, as growers have a wide variety of tools and practices available to fit their specific needs. We attempted to ease this limitation by relying on reputable and reliable secondary data sources. We recognize, nevertheless, that our attempt does not suffice to circumvent this limitation. The budgets and feasibility assessment results must be used wisely and carefully. In any case, we chose to refer as closely as possible to the primary data collected via surveys. We hope this study will help guide the average grower on the factors pertaining to a successful grape production enterprise in the Midwest U.S.A.


