Article

Estimation of Diagnosis and Recommendation Integrated System (DRIS), Compositional Nutrient Diagnosis (CND) and Range of Normality (RN) Norms for Mineral Diagnosis of Almonds Trees in Spain

by
Mario Ferrández-Cámara
1,
Juan José Martínez-Nicolás
1,*,
Marina Alfosea-Simón
2,
José María Cámara-Zapata
1,
Pablo Melgarejo Moreno
1 and
Francisco García-Sánchez
2
1
Grupo de Investigación en Fruticultura y Técnicas de Producción, Centro de Investigación e Innovación Agroalimentaria y Agroambiental (CIAGRO-UMH), Miguel Hernandez University, 03312 Orihuela, Spain
2
Centro de Edafología y Biología Aplicada del Segura, CEBAS-CSIC, 30100 Murcia, Spain
*
Author to whom correspondence should be addressed.
Horticulturae 2021, 7(11), 481; https://doi.org/10.3390/horticulturae7110481
Submission received: 8 September 2021 / Revised: 25 October 2021 / Accepted: 26 October 2021 / Published: 10 November 2021

Abstract

:
To ensure good fertilization, it is necessary to know the optimum nutrient levels for each crop. The most common method for obtaining this information for almond trees is to perform a foliar analysis coupled with the use of interpretive tools such as the traditional range of normality. However, currently, there are other, more sophisticated methods such as the DRIS (Diagnosis and Recommendation Integrated System) and the CND (Compositional Nutrient Diagnosis) which take into account the relationship between nutrients. However, little information is available with respect to these methods in the case of almond trees. In the present work, 288 samples of three contrasting varieties of almond were analyzed—Ferraduel, Ferragnes, and Garrigues (Prunus dulcis, Mill.)—corresponding to bi-weekly sampling between the months of May and September. Leaf analysis data, run with different mathematical and statistical models, lead to knowledge of the optimum period for harvesting samples and the determination of the ranges of normality and norms of DRIS and CND for the Ferraduel, Ferragnes, and Garrigues varieties. Data gained from the leaf nutrient content reported that the best season to harvest and interpret leaf samples was July. In addition, Ferraduel and Ferragnes had higher N, P, and K (2.22, 0.14, and 1.04 mg Kg−1 dw, respectively) than Garrigues (2.00, 0.09. 0.67 mg Kg−1 dw). The norms obtained with the leaf mineral data showed similar values between the Ferraduel and Ferragnes varieties but different values for Garrigues variety. Therefore, Garriges had the highest N/P, N/K, P/K, and P × Mg norms in the DRIS method and the highest VN and VCa norms in the CND method.

1. Introduction

Almonds are one of the most important Spanish dryland crops, especially in the Mediterranean area, although it is also cultivated in the interior part of the peninsula. This crop has good economic benefits, so its implementation as an irrigated crop is incentivized. The cost of production of almonds is low compared with other fruit trees as it does not require large amounts of water. In addition, this species is able to adapt to adverse soil and climate conditions without economic losses and can thus occupy areas that are not normally suitable for other crops. Additionally, under optimum conditions, almond fruits can be stored for long periods of time prior to exportation.
The production of almonds has progressively increased since the year 2000, reaching a current production level of 3 million tons (shelled) worldwide. The continent with the greatest production is the United States of America, producing almost a million tons, exclusively produced by the state of California. The second-highest producer is Spain, with an approximate production of 200,000 tons per year, followed by Iran, with 100,000 tons [1]. Australia is an emerging producer, with a production level that is growing exponentially. In Spain, the autonomous community with the largest area of cultivation is Andalusia, with around 160,000 hectares, followed by the Comunidad Valenciana, with 93,000 hectares, and the Region of Murcia and Castilla-La Mancha, with 73,000 hectares each. Of the total surface used for almond cultivation in Spain, only a low percentage is irrigated, while most of the crops are dryland [2].
As for the surface area used for almond cultivation, the data from various statistics databases indicate a period of decrease. The dichotomy observed between the yield and surface area is due to the considerable increase in the performance of this crop per hectare. The technical advances in crop yield are led by the United States of America, thanks to the acquisition of new varieties that are more productive, the implementation of irrigation and fertilization systems, improvements in the mechanical harvesting of almonds, and the use of high-density plantations. The rest of the world is beginning to copy the American manner of cultivation, so production will continue to increase in the coming years. In Spain, the main production problem is frost events, so important work is being conducted on genetic improvements to obtain late and extra-late self-fertilizing varieties. Additionally, great efforts are being made towards switching from the typical dryland crop to irrigated crops, whose difference in performance (Kg/ha) can exceed 1000 Kg/ha [3]
In Spain, a wide range of almond varieties are cultivated, among which we find two French-origin cultivars, Ferraduel and Ferragnés, and a Spanish-origin cultivar, Garrigues. The general characteristics of Ferragnés include vigor, vertical growth with a slight spread, high productivity, high adaptability, and a soft shell [4]; it flowers late, with a medium-fast entry into production [5]. Ferraduel is a sister variety to Ferragnés, and it is also characterized by late flowering, at the same time as Ferragnés. The fruit is hard and amygdala-shaped, with no double fruits and a somewhat late maturation period. It has an average performance; however, in dry years, this decreases considerably [5]. Garrigués is a Spanish variety, specifically from the Region of Murcia. It meets nutritional requirements as a vigorous tree that grows upright, which is highly branched, and it has a fast entry into production. It has a high productivity in irrigated coastal areas. It has an average period of flowering with abundant and staggered flowers and does not tolerate drought or a lack of humidity. In the interior areas, it is greatly harmed by frost, and production in dryland areas is very low [5].
Nutritional requirements vary according to the age and phenological state of the plant. Table 1 and Table 2 are representative examples of almond fertilization. In almonds, fertilization is mainly conducted through the soil or foliar application. The most traditional, and currently most common, method is the direct application of nutrients to the soil. The fertilizers move into the soil solution and are absorbed by the roots. To improve the efficiency of soil fertilization, the application criteria or recommendations have to be followed. Fertilization must occur when the tree has vegetative growth activity and therefore a greater capacity to absorb nutrients. It is recommended that fertilizer application be split into two or three separate occasions throughout the period of vegetative growth [6].
Currently, it is thought that the best way to fertilize woody crops is to take into account the nutritional state of the plant via mineral analysis of the leaves. This system is the best method for detecting low levels of nutrients before the onset of deficiency. The nutrient content can be interpreted from the foliar analysis through various methods. The range of normality or sufficiency (RN) methods are utilized frequently, but these are being replaced by more sophisticated methods, such as the Standard Deviation Index (SDI), DRIS (Diagnosis and Recommendation Integrated System), M-DRIS (Modified Diagnosis and Recommendation Integrated System), and CND (Compositional Nutrient Diagnosis). For almonds, however, at present, there is little information associated with the nutritional diagnosis. Moreover, the existing information is obsolete given the appearance of new varieties and the implementation of new fertigation techniques.
Fruit trees acquire nutritional stability in their adult state [7]. Due to this stability, by diagnosing the foliar composition, it is possible to make adjustments in fertilization. It is important to specify the optimal foliar sampling period for each species, which must coincide with the period of nutritional stability. The compositional nutrient diagnosis method (CND) takes into account the association between a given nutrient and the geometric mean of the concentrations on the basis of dry matter recorded for the other nutrients (multivariate relationships), including those that are not determined analytically. This is considered the best way to express balance in plant tissue [7,8]. This methodology has been applied to fruit plants such as banana, orange, pear, mango, guava, etc., but it has not yet been applied to almond cultivation [9,10,11,12].
The main objective of the present work is to establish the ranges of normality (RN) and DRIS and CND norms for the interpretation of nutritional analysis of this crop using three of the more popular almond cultivars in Spain—Ferraduel, Ferragnés, and Garrigues. We want to test the hypothesis that RN, DRIS, and CND norms are variety-dependent; therefore, it is necessary to determine this norm for each specific variety as in almond trees the agronomic characteristic among varieties can be different for each one. In addition, this study also allows us to establish the best time period during the season for collecting foliar samples of these almond varieties. This knowledge will be useful to growers for the design of protocols for collecting samples and to the agronomic engineers and plant nutrition scientists to interpret and understand leaf analysis data. Usually, these types of norms are used mainly in the academic world since, although they are successful in agriculture, they require mathematical knowledge to obtain and interpret. However, new technologies including artificial intelligence (AI), neuronal networks, and cheap and easy to use decision support systems (DSS) could be powerful tools for implementation. Therefore, it is necessary to perform an experimental assay to obtain data to feed to AI and DSS, letting us create these norms and guidelines. In this work, RN, DRIS, and CND norms will be created in a high-yielding population referred to as the “reference population”.

2. Materials and Methods

The selection of experimental plots was conducted according to the criteria by De Oliveira et al. [13] and Sumner [14], who state that plots to determinate DRIS norms have to be commercial and homogenous, with high production performance. Our plots were located between the provinces of Albacete and Murcia (Spain, Figure S1), with similar agroclimatic and edaphic conditions. The trees were cultivated under a drip irrigation system with the usual agronomic management in this area. The varieties studied were Ferraduel, Ferragnes, and Garrigues. The Ferraduel and Ferragenes orchards were located in Hellin (Albacete) and Garrigues in Jumilla (Region of Murcia). All orchards were separated by one kilometer. The orchard had a yield production of about 4000 kg/ha. The foliar samples were collected in the first half of May until the second half of September over two consecutive years, 2017 and 2018, with no significant differences observed between both years. The reported data are from 2017.
During each year, 10 sampling periods were established from May to September, with samples collected every fortnight. This produced 12 foliar samples with 20 mature leaves for every sample. In each sample, the contents of nitrogen, phosphorus, potassium, calcium, and magnesium were analyzed at Fertiberia laboratories (Spain). The leaves were briefly rinsed with deionized water, oven-dried at 60 °C for 48 h, weighed, and ground in a hammer mill. After that, the leaves were digested via nitric-perchloric acid (2:1) at 90 °C. Analysis of K, Ca, and Mg was carried out by atomic absorption spectrometry (Perkin/Elmer 5500). The total N was determined using the semi-micro Kjeldahl method. Total-P was measured colorimetrically using the molybdenum blue method described by Murphy and Riley [15].

2.1. Determination of the Foliar Sampling Period

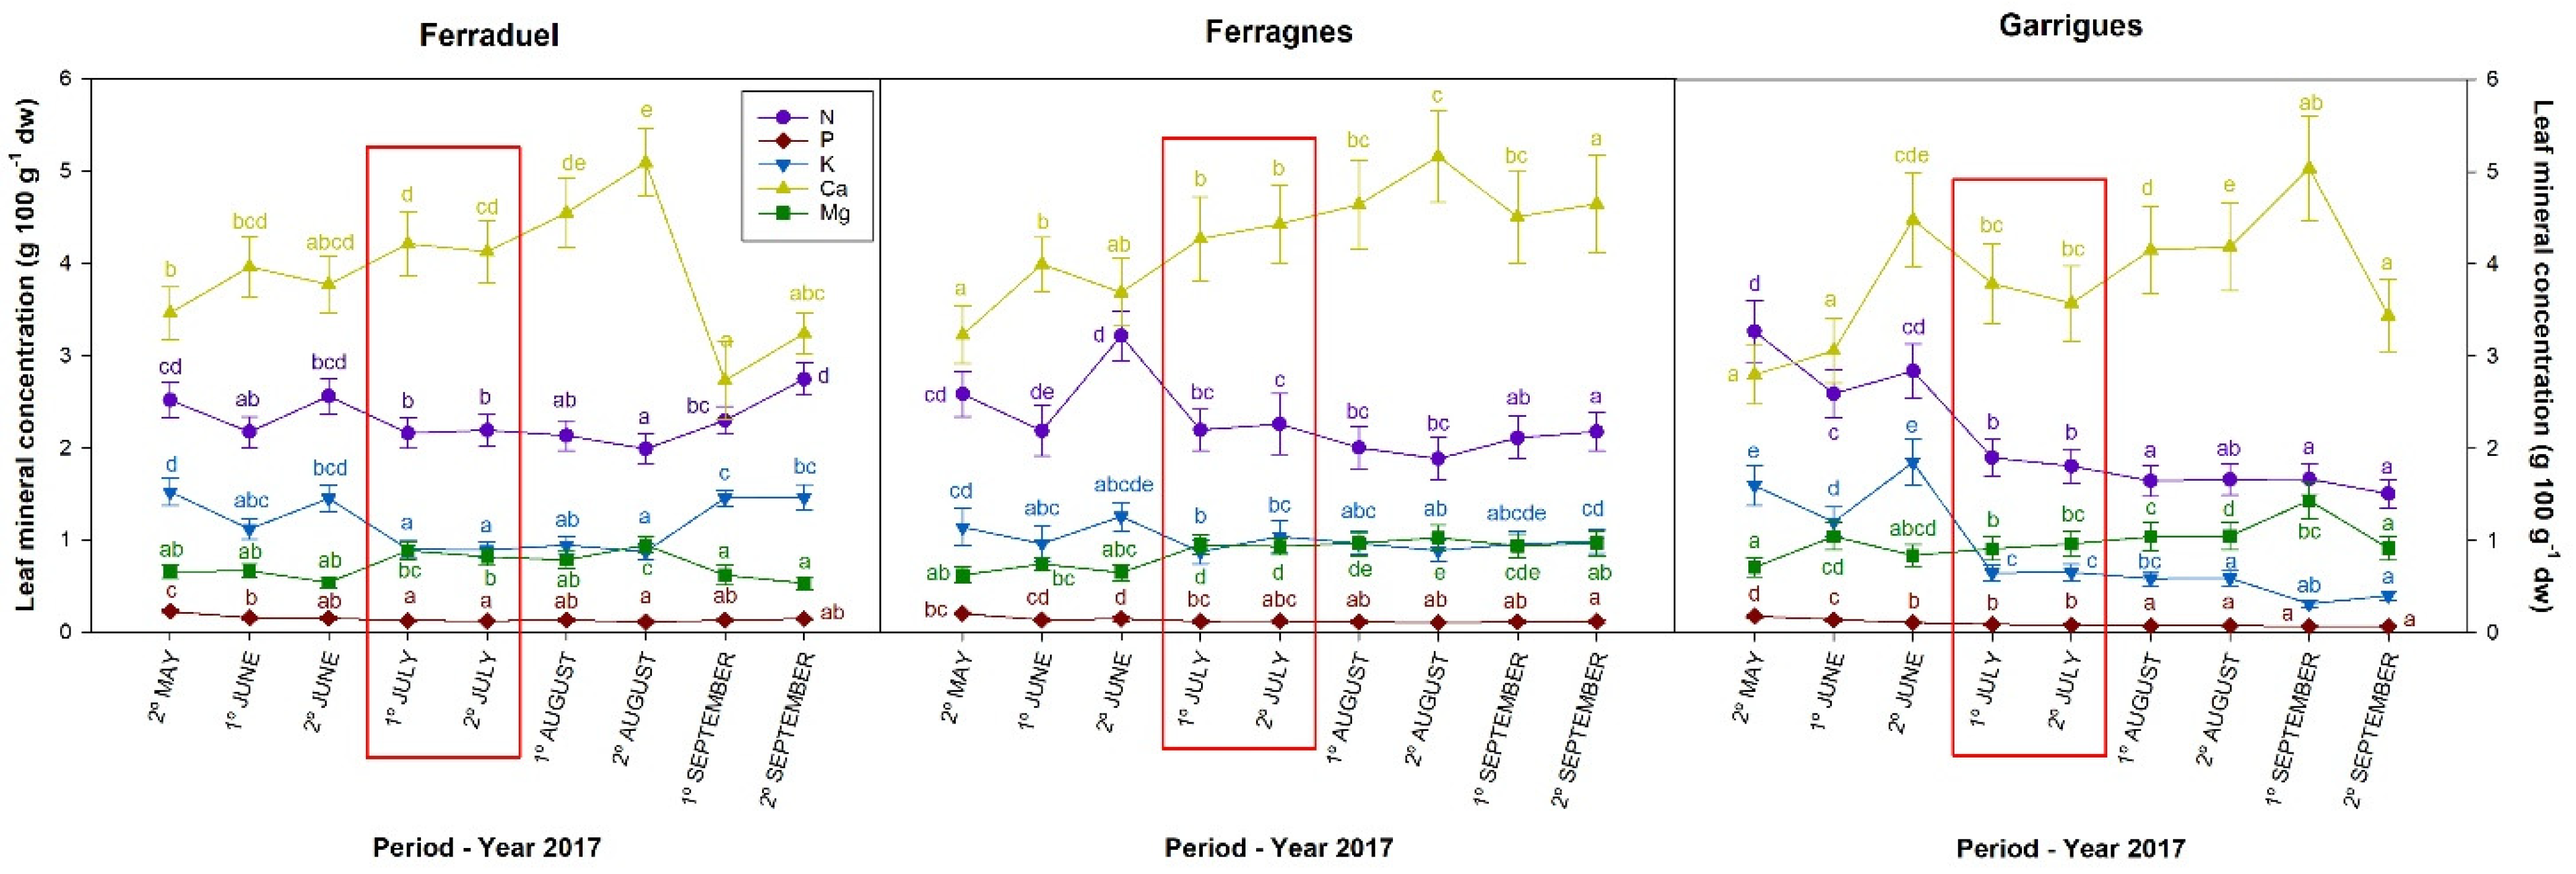
With the results of the foliar analysis obtained, it was possible to establish the best period of the season for taking leaf samples in the almond trees, as previously mentioned, as the nutrients reach a plateau during this collecting time period. The nutrient was considered stable when its concentration did not vary significantly during a sampling time period. A period of time was considered stable when every one of the five macronutrients (N, P, K, Ca, Mg) fulfilled this rule. An ANOVA and comparison of means was performed with each of the five nutrients and the ten sampling dates. Thus, the periods in which the foliar levels were stable was determined. The values of N, P, K, Ca, and Mg throughout the almond sampling period are shown together with the multiple range test, which allowed us to determine the ideal sampling date for each variety.

2.2. Diagnosis Method: Range of Normality (RN), DRIS Norms, and CND Guidelines

Range of normality: knowing the adequate periods for foliar sampling, the range of normality was created by only using the foliar analysis corresponding to July (the most ideal month for collecting samples). The ranges were determined using the mean and standard deviation. The “normal” interval was calculated as the arithmetic mean (m) ± standard deviation (s). For the interval “low”, “very low”, “high” and “very high”, the procedure was the same.

2.3. Acquisition of the DRIS Norms

To obtain the DRIS reference guidelines for the macronutrients for the almond cultivars studied, DRIS calculation was carried out using the Excel program as described in the literature [16,17]. For each nutrient, the mean, standard deviation, and the coefficient of variability were used in the sampling period in which these were stable (see above). All the calculations for all the possible relationships between nutrient pairs were performed (A/B; B/A and A × B) for all the macro-elements: nitrogen (%), phosphorus (%), potassium (%), calcium (%), and magnesium (%). The following norms were calculated: N/P, P/N, N × P, N/K, K/N, N × K, N/Ca, Ca/N, N × Ca, N/Mg, Mg/N, N × Mg, K/P, P/K, K × P, K/Mg, Mg/K, K × Mg, P/Ca, Ca/P, P × Ca, P/Mg, Mg/P, P × Mg, K/Ca, Ca/K, k × Ca, Ca/Mg, Mg/Ca, and Mg × Ca. The selection of the type of ratio was dependent on the variation coefficient, and those with the smallest value were selected. Calculation for the DRIS norms was based on references [9,14,15].
F = ( A B ) = ( ( A B ) ( a b ) 1 ) · 1000 C V   C V   W h e n   A / B   i s   l arg e r   t h a n   a / b F ( A B ) = ( 1 ( a b ) ( A B ) ) · 1000 C V   C V   W h e n   A / B   i s   s m a l l e r   t h a n   a / b F ( a · b ) = ( a · b   p l o t A · B   N o r m ) · 10 S D
In these equations, A/B is the tissue nutrient ratio of the plant to be diagnosed, a/b is the optimum value or norm for that given ratio, CV is the coefficient of variation associated with the norm, and SD is the standard deviation of the norm.

2.4. Acquisition of the CND Guidelines

The calculation of the CND guidelines was conducted according to the studies by Parent and Dafir [8], Aitchison [18], and Khiari [19]. A dimensionless parameter named “Sd” was calculated as the sum of all the nutrients (N + P + K + …), plus an “Rd” value, which represents all the values that were not determined analytically. The sum of all the nutrients plus the “Rd” factor must be 100, so “Rd” is calculated with the following formula:
R d = 100 ( N + P + K + )
The parameter “G” is calculated, which is the geometric mean of all the nutrients including the Rd parameter. The formula for calculating G is:
G = [ N · P · K · R d ] 1 d + 1
Once these two parameters are calculated (Rd and G), the “Vx” is calculated for each nutrient by using Equation (3), where “x” represents each nutrient analyzed:
V x = L n ( x G )
V R d = L n ( R d G )
By definition, the sum of all the components from a plant tissue must be 100%. Therefore, the sum of all the V × x must be zero. After defining the guidelines, the analytical results of a sample can be interpreted with the CND indices ([20]:
I D i = ( V i v i ) S D
where Vi is a multinutrient variable in the planting field evaluated, vi is the reference population average, and SD is the standard deviation of the reference population.

2.5. Statistical Analysis

There were twelve replicates for each genotype per harvest date. All measured parameters (mean, standard deviation, coefficient of variation, and standard error) as well as the analysis of variance (ANOVA) and the Tukey test for the separation of means (p < 0.05) were analyzed statistically using SPSS Version 20.0 software (SPSS Statistical Package, Chicago, IL, USA).

3. Results and Discussion

3.1. Selection of the Sampling Period

Figure 1 shows the evolution of the concentrations of N, P, K, Ca, and Mg over time for the almond varieties Ferraduel, Ferragnes, and Garrigues (Prunus dulcis, Mill.). The nutrients P, K, and Mg were found to be stable over time from May to September in all almond cultivars. Nitrogen was also stable for the Ferraduel and Ferragnes varieties in this time period, while Garrigues was characterized by a slow and progressive decrease in concentration, from 3.5% in May to 1.5% in September. Calcium was the most variable element in the three varieties due to its continuous increase (with some peaks and valleys) from the month of April, reaching its maximum concentration in the summer, although the exact date was dependent on the variety: Ferraduel and Ferragnes in August, and Garriges in September.
Regarding the optimum moment of foliar sampling, although each cultivar has its own optimum time period, the three cultivars studied in this work all present greater stability in the concentration of the analyzed nutrients (N, P, K, Ca, and Mg) during the first and second half of July (Figure 1, red area). Thus, considering these data, we can state that the optimum date for foliar sampling is in the month of July. This is the period of time wherein mineral nutrients simultaneously reach a stable plateau in all three cultivars. The red squares in Figure 1 show the variations of each mineral element in July, with the greatest stability observed for most of the nutrients in this month. This time of the season corresponds with phenological stages wherein the fruits reach the final size and are ready to be harvested. In representative zones of almond cultivars in California, Saa et al. [21] observed that to ensure that the analysis of leaf samples reflects the nutrient status of the almond trees, it is necessary to collect samples in mid-July to early August or in early spring. According to our study, taking into account the variability of results among cultivars and among collecting dates, in Spain, the best period is in July.
With the data obtained in July, the average value, standard error, and variability coefficient were calculated for each nutrient and variety, as shown in Table 1. It was observed that the concentration of these nutrients followed the trend: Ca > N = Mg > P, and this trend is maintained during the duration of the season. In addition, the data show that the concentrations of N, P, K, and Ca were higher in Ferraduel and Ferragnes as compared to Garrigues, while the leaf Mg was lower.

3.2. Range of Normality

Once the mean value, standard deviation, and coefficient of variation were calculated for each cultivar in the month of July, the ranges of normality were calculated following the method described in the Section 2. Table 2 shows that the Ferraduel and Ferragnes varieties had similar ranges of normality. However, Garrigues had much lower values, except for Mg, which had a range of normality of 0.81–1.17. In California, Muhammad et al. [22] found that the critical ranges in almond in samples from July were N 2.3–2.5%, P 0.1–0.3%, K 1.4–2.0%, Ca 2.0–5.0%, Mg 0.25–0.8%. All ranges are similar to those reported in our study, except in the case of K, whereas, in our observation, the trees needed a lower concentration. Maintaining these ranges is critical for obtaining a high level of production and good quality harvest because, in the fertilization of almond trees, imbalances can create severe problems. Such problems include nitrogen excess, increased vegetative growth, and susceptibility to diseases such as hull rot, which reduce yields [21,22]. Some examples of ranges of normality and critical concentrations for almonds and other fruit trees are reported in Table 3.

3.3. DRIS Guidelines

The DRIS norms obtained for the Ferraduel, Ferragnes, and Garrigues varieties were N/P, N/K, N × Ca, N/Mg, K/P, K × Mg, P × Ca, P × Mg, K × Ca, and Ca/Mg, as shown in Table 4. These norms were similar between the Ferraduel and Ferragnes varieties, while differences were found with the Garrigues variety. For example, this variety had higher N/P and P/K norms and a lower N × Ca ratio than the other two varieties. Some examples of DRIS norms in other fruit trees are reported in Table 5. In almond trees, the only DRIS norms reported previously were established in a study in Chaharmahal and Bakhtiari province (Iran) [22,23,24]. In our study, we calculated the DRIS norm from a healthy and high-productivity almond orchard. Therefore, it could be used as a reference population, which could be fed into IA for future DSS installation. Once the DRIS norms are obtained, an interpretation of the nutritional state of any sample can be made, starting with the calculation of the DRIS index, as discussed in Beaufils ([16]) and De Assis ([29]). Those DRIS indexes, which would be low and negative, will be considered as limiting, while positive and high indices will be considered as not limiting. The manner in which to calculate these indices is found in the aforementioned publication.
The main advantages of the DRIS system over other methods include its ability to perform foliar diagnoses regardless of the age, variety, and part of the plant used. This is because the nutrient ratio is used instead of the absolute and/or individual nutrient concentration [28]. This is due to the use of an extensive database to obtain the DRIS standards. However, to improve the precision of this diagnosis, it is necessary to establish norms from regional and local studies that take into account the variability of the nutrients and crops studied (climatic characteristics, production level, etc.). Several studies have compared the precision of the diagnosis between the DRIS system versus critical values and deviation from optimum percentage (DOP), showing that DRIS diagnostic systems are safer and more precise than those of the other systems [22,23].

3.4. CND Guidelines

The CND norms obtained for the three varieties tested are shown in Table 6. These guidelines are also backed by our previous statement that Ferraduel and Ferragnes obtained nutrition values that were different from those of Garrigues. For example, the VN, VP, and VK values were higher in Ferraduel and Ferragnes with respect to Garrigues, but the VCa and VMg values were greater in the Garrigues variety. Once the norms are obtained, the CND indices for any leaf sample could be calculated according to what was established by Aitchison [18]. Some examples of other fruit trees can be observed in the Table 6.
An advantage of CND is that, when using relationships with respect to the total composition, the effect of the variability of a single element on the rest of the nutrients is considered as a global effect, not as the contribution of several individual effects on each of the remaining nutrients. Therefore, it has a great advantage over the DRIS method [35].
The values obtained in this work for the normal ranges (RN), DRIS, and CND standards are of the same order of magnitude as those published by other authors (Table 2, Table 4, Table 6 and Table 7), but there are important differences between these studies when dealing with different species, climatic zones, and fertilization and irrigation management methods. In addition, there are no references relative to CND norms. Therefore, the norms obtained in this work will be of great utility for interpreting the leaf mineral analyses of almond cultivars. The leaf norms of olive cultivars are not yet developed. In the next year, these norms will be validated in a population with low production, and this population will be introduced in DSS to help manage the application of fertilizer.

4. Conclusions

The data of this experiment reported that the optimum period for foliar sampling for the Ferraduel, Ferragnes, and Garrigues cultivars is during July, as in this month, the leaf mineral concentration was becoming stable in all five nutrients analyzed. With respect to the nutritional state for the N, P, K, Ca, and Mg contents, there were differences among varieties. Ferraduel and Ferragnes are very similar varieties; however, they are different with respect to the Garrigues cultivar. The data suggest that Ferraduel and Ferragnes require a higher content of N, P, and Ca than Garrigues. In fact, the DRIS and CND norms for Ferraduel and Ferragnes are very similar between them, but different with regard to Garrigues. These norms could be introduced in the Decision Support Systems (DSS), through their corresponding algorithms, to management of the fertilization in almond orchards, which will increase the effective use of fertilizers, leading to a decrease in the amounts applied. In future assays, we will obtain new norms in function of different agronomic conditions such as water resources used for irrigation, irrigation vs. drought, etc.

Supplementary Materials

The following are available online at https://www.mdpi.com/article/10.3390/horticulturae7110481/s1. Figure S1: Geographical localization of the almond orchards: the blue area indicates the Ferraduel orchard, while the green and yellow areas indicate Ferragenes and Garrigues orchards, respectively. Table S1: Nutrient requirements for almond trees according to yield production. Table S2. Fertilizer application dates via fertigation in almond orchards.

Author Contributions

F.G.-S. and J.J.M.-N. conceived the idea and designed the experiments; M.F.-C., M.A.-S., and P.M.M. performed the experiments; J.J.M.-N. and F.G.-S. contributed to the analysis and discussion of results; M.F.-C. wrote the first draft of the paper, and all authors contributed to improving the paper. All authors have read and agreed to the published version of the manuscript.

Funding

This work has been funded by the Grants for Research Projects 2020, VBDat, Reference 60MX0008IP, from the Miguel Hernández University.

Institutional Review Board Statement

Not appicable.

Informed Consent Statement

Not appicable.

Data Availability Statement

Not appicable.

Conflicts of Interest

The authors declare no conflict of interest.

References

  1. Food and Agriculture Organization. 2021. Available online: http://www.Fao.org/faostat.es (accessed on 25 May 2021).
  2. Ministerio de Agricultura Peca y Alimentación. 2021. Available online: http://www.Mapa.gob.es/estadistica (accessed on 9 June 2021).
  3. Instituto Técnico Agronómico Provincial de Albacete. 2014. Available online: http://www.genvce.org/miembros/instituto-tecnico-agronomico-provincial-itap---diputacion-de-albacete/ (accessed on 5 September 2020).
  4. Junta de Andalucía. Caracterización del Sector de la Almendra en Andalucía; Consejería de Agricultura, Pesca y Desarrollo Rural: Seville, Spain; Secretaría General de Agricultura y Alimentación: Madrid, Spain, 2016. [Google Scholar]
  5. Felipe, J.A. El Almendro I: El Material Vegetal, 1st ed.; Mira Editores, S.A.: Zaragoza, Spain, 2000; pp. 1–461. [Google Scholar]
  6. Arquero, O.; Rodríguez, A.; Quejo, M.J. Manual del Cultivo del Almendro; Junta de Andalucía: Seville, Spain; Consejería de Agricultura, Pesca y Desarrollo Rural: Seville, Spain; Secretaría General de Agricultura y Alimentación: Madrid, Spain, 2013; pp. 1–80. [Google Scholar]
  7. Marschner, P.; Rengel, Z. Marschner’s Mineral Nutrition of Higher Plants, 3rd ed.; Chapter 12—Nutrient Availability in Soils; Academic Press: New York, NY, USA, 2012; pp. 315–330. [Google Scholar] [CrossRef]
  8. Parent, L.E.; Dafir, M. A theoretical concept of compositional nutrient diagnosis. J. Am. Soc. Hortic. Sci. 1992, 117, 239–242. [Google Scholar] [CrossRef] [Green Version]
  9. Egozcue, J.J.; Pawlowsky-Glahn, V. Groups of parts and their balances in compositional data analysis. Math. Geol. 2005, 37, 795–828. [Google Scholar] [CrossRef] [Green Version]
  10. Parent, S.-É.; Parent, L.E.; Rozane, D.E.; Natale, W. Plant ionome diagnosis using sound balances: Case study with mango (Mangifera indica). Front. Plant Sci. 2013, 4, 449. [Google Scholar] [CrossRef] [Green Version]
  11. Hernandes, A.; Parent, S.-É.; Natale, W.; Parent, L.E. Balancing guava nutrition with liming and fertilization. Rev. Bras. Frutic. 2012, 34, 1224–1234. [Google Scholar] [CrossRef]
  12. Rozane, D.E.; Prado, R.D.M.; Natale, W.; Romualdo, L.M.; Franco, C.F. Caracterização biométrica e acúmulo de nutrientes em porta-enxertos de caramboleira cultivada em solução nutritiva. Rev. Ciênc. Agron. 2013, 44, 426–436. [Google Scholar] [CrossRef]
  13. De Oliveira, C.T.; Rozane, D.E.; De Amorim, D.A.; De Souza, H.A.; Fernandes, B.S.; Natale, W. Diagnosis of the nutritional status of ‘Paluma’ guava trees using leaf and flower analysis. Rev. Bras. Frutic. 2020, 42, 1–9. [Google Scholar] [CrossRef]
  14. Sumner, M.E. Application of Beaufil’s diagnostic indices to maize data published in the literature irrespective of age and conditions. Plant Soil 1977, 46, 359–369. [Google Scholar] [CrossRef]
  15. Murphy, J.; Riley, J.P. A modified single solution method for the determination of phosphate in natural waters. Anal. Chim. Acta 1962, 27, 31–36. [Google Scholar] [CrossRef]
  16. Beaufils, E.R. Diagnosis and Recommendation Integrated System (DRIS): A General Scheme for Experimentation and Calibration Based on Principles Developed from Research in Plant Nutrition; Soil Science Bulletin; University of Natal: Pietermaritzburg, South Africa, 1973. [Google Scholar]
  17. Giménez, M.; Martínez, J.; Ferrández, M.; Oltra, M.A.; Madrid, R.; Rodríguez, V.; Rodríguez, O. Initial values of dris norms for artichoke cv. Blanca de Tudela (Cynara scolymus L.) in the provinces of Alicante and Murcia”. Acta Hortic. 2004, 660, 285–291. [Google Scholar] [CrossRef]
  18. Aitchison, J. The statistical analysis of compositional data. J. R. Stat. Soc. Ser. B 1982, 44, 139–177. [Google Scholar] [CrossRef]
  19. Khiari, L.; Parent, L.E.; Tremblay, N. Critical compositional nutrient indexes for sweet corn at early growth stage. J. Agron. 2001, 93, 809–814. [Google Scholar] [CrossRef]
  20. Jones, C.A. Proposed modifications of the diagnosis and recommendation integrated system (DRIS) for interpreting plant analyses. Commmun. Soil Sci. Plant Anal. 1981, 12, 785–794. [Google Scholar] [CrossRef]
  21. Saa, S.; Brown, P.H.; Muhammad, S.; Rio, A.O.-D.; Sanden, B.L.; Laca, E.A. Prediction of leaf nitrogen from early season samples and development of field sampling protocols for nitrogen management in almond (Prunus dulcis Mill. (D.A. Webb)). Plant Soil 2014, 380, 153–163. [Google Scholar] [CrossRef]
  22. Saa, S.; Peach-Fine, E.; Brown, P.; Michailides, T.; Castro, S.; Bostock, R.; Laca, E. Nitrogen increases hull rot and interferes with the hull split phenology in almond (Prunus dulcis). Sci. Hortic. 2016, 199, 41–48. [Google Scholar] [CrossRef]
  23. Muhammad, S.; Saa, S.; Schellenberg, D.; Weinbaum, S.; Brown, P. Almond tree nutrition. In Almonds: Botany, Production and Uses; CABI: Oxford, UK, 2017; pp. 291–320. [Google Scholar]
  24. Chaleshtori, A.A.; Panahpour, E.; Iranipour, R.; Moezzi, A. Diagnosing the Nutritional Balance of Almond (Prunus sp.) Orchards Using DRIS and DOP Methods. J. Plant Growth Regul. 2020, 40, 1640–1651. [Google Scholar] [CrossRef]
  25. Rozane, D.E.; de Paula, B.V.; de Bastos de Melo, G.W.; Haitzmann dos Santos, E.M.; Trentin, E.; Marchezan, C.; da Silva, L.O.S.; Tassinari, A.; Dotto, L.; de Oliveira, F.N.; et al. Compositional Nutrient Diagnosis (CND) Applied to Grapevines Grown in Subtropical Climate Region. Horticulturae 2020, 6, 56. [Google Scholar] [CrossRef]
  26. Maity, A.; Sharma, J.; Sarkar, A.; More, A.; Pal, R.K. Nutrient imbalance indices are closely related with susceptibility of pomegranate to bacterial blight disease. Sci. Hortic. 2016, 211, 79–86. [Google Scholar] [CrossRef]
  27. Anjaneyulu, K. DRIS norms for identifying yield-limiting nutrients in sapota (Manilkara achras (Mill). Fosberg) cv. Cricketball. J. Hortic. Sci. 2007, 2, 115–118. [Google Scholar]
  28. Lucena, J.J.; Ruano, S.; García-Serrano, P.; Ginés, I.; Mariscal, I. Informe DRIS: Normas Para el Diagnóstico del Análisis Foliar del Olivo, Partiendo de la Base de Datos de Fertiberia. Monografía (Informe Técnico); E.T.S.I. Agrónomos (UPM) [Antigua Denominación]: Madrid, Spain, 2002. [Google Scholar]
  29. De Assis Alves Mourão Filho, F. DRIS: Concepts and applications on nutritional diagnosis in fruit crops. Sci. Agric. 2004, 61, 550–560. [Google Scholar] [CrossRef]
  30. Labaied, M.B.; Pereira, A.; Ben Mimoun, M. Establishment of nutrients optimal range for nutritional diagnosis of mandarins based on DRIS and CND methods. Commun. Soil Sci. Plan 2018, 49, 2557–2570. [Google Scholar] [CrossRef]
  31. Xu, M.; Zhang, J.; Wu, F.; Wang, X. Preliminary the Diagnosis and Recommendation Integrated System (DRIS) Norms for Evaluating the Nutrient Status of Apple. Adv. J. Food Sci. Technol. 2015, 7, 74–80. [Google Scholar] [CrossRef]
  32. Hernandes, A.; de Souza, H.A.; de Amorim, D.A.; Natale, W.; Lavres, J.A., Jr.; Boaretto, E.; Camacho, M.A. DRIS Norms for Pêra Orange. Commun. Soil Sci. Plant Anal. 2014, 45, 2853–2867. [Google Scholar] [CrossRef] [Green Version]
  33. Giménez, M.; Nieves, M.; Gimeno, H.; Martínez, J.; Martínez-Nicolás, J.J. Nutritional diagnosis norms for three olive tree cultivars in superhighdensity orchards. Int. J. Agric. Nat. Resour. 2021, 48, 34–44. [Google Scholar] [CrossRef]
  34. Huang, H.; Hu, C.X.; Tan, Q.; Hu, X.; Sun, X.; Lei, B. Effects of Fe-EDDHA application on iron chlorosis of citrus trees and comparison of evaluations on nutrient balance with three approaches. Sci. Hortic. 2012, 146, 137–142. [Google Scholar] [CrossRef]
  35. Rodríguez, O.; Rodríguez, V. Desarrollo, determinación e interpretación de normas DRIS para el diagnóstico nutricional en plantas. Una revision. Rev. Fac. Agron. (LUZ) 2000, 17, 449–470. [Google Scholar]
  36. Labaied Bendaly, M.; Khiari, L.; Gallichand, J.; Kebede, F.; Kadri, N.; Ben Ammar, N.; Ben Hmida, F.; Ben Mimoun, M. Nutrient Diagnosis Norms for Date Palm (Phoenix dactylifera L.) in Tunisian Oases. Agronomy 2020, 10, 886. [Google Scholar] [CrossRef]
Figure 1. The evolution of the concentration of macronutrients at different leaf collecting dates in the Ferraduel, Ferragnes, and Garrigues varieties. The red square indicates the simultaneous period of greater stability in the five nutrients. Values are the average ± standard error (n = 12). For every cultivar and nutrient, the different lowercase letters indicate significant differences between the sampling date for p < 0.001 established by Tukey’s multiple range test.
Horticulturae 07 00481 g001
Table 1. Mean values of leaf macronutrient concentration in July for the Ferraduel, Ferragnes, and Garrigues varieties. Leaf concentration is expressed as a percentage (mg 100 mg−1 dw).
NPKCaMg
Ferraduel
Mean (gr 100 g−1 dw)2.23 b *0.14 b1.04 b4.16 b0.81 a
SD0.390.070.350.880.17
C.V. (%)17.4946.7633.5221.2620.86
SE0.180.020.120.320.08
Ferragnes
Mean (gr 100 g−1 dw)2.22 b0.13 b1.05 b4.03 b0.88 b
SD0.390.060.370.940.19
C.V. (%)17.5844.4136.02322.4321.62
SE0.190.010.120.580.14
Garrigues
Mean (gr 100 g−1 dw)2.00 a0.09 a0.67 a4.05 a0.99 c
SD0.430.0280.350.640.18
C.V. (%)23.1931.0251.2416.7318.38
SE0.190.010.090.430.14
* Within each column, the mean values of the nutrient concentration with the same letter do not represent significant differences at p < 0.05. SD indicates the standard deviation of the samples, SE indicates the standard error, and CV is the coefficient of variation. n = 24.
Table 2. Ranges of normality for the Ferraduel, Ferragnes, and Garrigues varieties.
Ferraduel
Very lowLowNormalHighVery high
Nitrogen<1.451.451.831.842.632.643.01>3.01
Phosphorus<0.010.010.070.080.210.220.27>0.27
Potassium<0.340.340.680.691.391.401.74>1.74
Calcium<2.392.393.263.275.045.055.92>5.92
Magnesium<0.470.470.630.640.970.981.14>1.14
Ferragnes
Very lowLowNormalHighVery high
Nitrogen<1.441.441.821.832.612.623.00>3.00
Phosphorus<0.010.010.060.070.190.200.25>0.25
Potassium<0.2980.290.640.651.391.401.76>1.76
Calcium<2.322.323.253.265.155.166.09>6.09
Magnesium<0.500.500.680.691.071.081.26>1.26
Garrigues
Very lowLowNormalHighVery high
Nitrogen<1.001.001.421.432.232.242.73>2.73
Phosphorus<0.030.030.050.060.120.130.15>0.15
Potassium<0.330.330.320.331.021.031.36>1.36
Calcium<2.542.543.173.184.464.475.10>5.10
Magnesium<0.630.630.800.811.171.181.35>1.35
Table 3. Sufficiency ranges for almond and other fruits trees according to other publications.
ReferencesNPKCaMg
Sufficiency Ranges (g kg−1)
[22] (Almond)2.30.21.42.00.25
[23,24] (Almond)2.110.271.852.040.71
[25] (Grapevines)2.760.651.982.080.53
[26] (Pomegranate)1.880.180.981.850.59
[27] (Sapota)1.26–1.970.05–0.181.00–2.050.21–0.940.32–0.53
[28] (Olive)1.61–1.900.11–0.201.61–1.001.01–2.500.26–0.60
Table 4. DRIS norms established for the Ferraduel, Ferragnes, and Garrigues varieties.
VarietyRatioMeanSDCV
FerraduelN/P17.054.0623.84
N/K2.300.5825.19
N × Ca9.131.8820.63
N/Mg1.760.3218.28
K/P7.742.3129.89
K × Mg0.800.1923.77
P × Ca0.570.1831.01
P × Mg0.110.0325.40
K × Ca4.141.1026.52
Ca/Mg5.271.1121.07
FerragnesN/P17.714.0422.81
N/K2.330.5724.62
N × Ca9.131.7118.71
N × Mg1.910.3618.71
P/K0.140.0533.63
K × Mg0.860.2225.21
P × Ca0.540.1628.92
P × Mg0.110.0220.57
K × Ca4.121.0926.43
Ca/Mg4.840.7916.30
GarriguesN/P21.032.7012.85
N/K3.251.2739.20
N × Ca7.011.4921.28
N × Mg0.560.1527.33
P/K7.452.9239.24
K × Mg0.630.2843.82
P × Ca0.340.0824.67
P × Mg11.753.6030.65
K × Ca2.471.1546.70
Ca/Mg3.920.6616.74
Table 5. DRIS norms for other fruits trees according to other publications.
DRIS Norms
N/PN/CaK/CaN/MgK/PK/MgP × MgCa/Mg
[26] Pomegranate101.0211.943.315.261.730.333.26
Mg/KN/KMg/NCa/MgCa/NMg/PP/NP/K
[27] (Sapota)0.2580.9890.2641.2920.344.5430.0630.062
N × PN × KN/CaN/MgP/KP × CaP/MgK × Ca
[28] Olive0.14791.45001.27657.83370.10240.11650.27051.1382
N/PCa/NCa/PN/KK/PCa/KK/MgN/Mg
[30] Mandarin3.10.6843.7851.0312.0691.7161.752.781
N/PN/KN/CaN/MgK/PK/CaK/MgMg/Ca
[31] Apple11.82.92.047.24.40.762.80.29
N/KP/NP/MgK/PK/CaK/MgCa/NCa/P
[32] Pear2.990.040.1510.560.261.431.3541.01
N/PN/KN/CaN/MgP/KCa/PP × MgCa/K
[33] Picual olive218.135.5811.1559.660.16195.8910.0331.97
N/PK/NN/CaN/MgK/PP/CaP/MgK/Ca
[34] Satsuma7.920.910.686.587.010.090.770.63
Table 6. CND standards (average and standard deviation) of the multinutrient variables obtained from the nutrient content in each of the almond cultivars.
FerraduelFerragnesGarrigues
MeanSDMeanSDMeanSD
VN0.05070.11090.04080.13300.01820.1297
VP−2.75690.2686−2.80730.2658−3.01900.1750
VK−0.75240.2750−0.77180.2744−1.08560.3798
VCa0.65940.25370.66380.25280.74620.2265
VMg−0.97940.2714−0.89850.2713−0.60700.2237
VRd3.77870.08733.77300.07593.94720.1158
R91.62780.782991.53760.803692.56090.7505
G2.10090.17452.10890.14681.79850.2100
Table 7. CND standards for other fruits trees according to other publications.
ReferencesVNVPVKVCaVMgVRd
[27] Olive0.35−1.16−0.370.78−2.024.31
[33] Aberquina olive0.49−2.88−0.600.24−1564.31
[30] Mandarin2.89−0.2321.843.550.096.52
[34] Satsuma mandarin2.510.48 2.39 2.94 0.67 6.31
[36] Date palms3.340.381.492.741.337.57
Publisher’s Note: MDPI stays neutral with regard to jurisdictional claims in published maps and institutional affiliations.

