Article

Performance of Thermal Insulation Covering Materials to Reduce Postharvest Losses in Okra

by
Jutarat Rattanakaran
1,
Rattapon Saengrayap
1,2,
Nattapol Aunsri
2,3,
Sirada Padee
4,
Chureerat Prahsarn
4,
Hiroaki Kitazawa
5,
Chris F. H. Bishop
6 and
Saowapa Chaiwong
1,2,*
1
School of Agro-Industry, Mae Fah Luang University, Chiang Rai 57100, Thailand
2
Integrated AgriTech Ecosystem Research Group, Mae Fah Luang University, Chiang Rai 57100, Thailand
3
School of Information Technology, Mae Fah Luang University, Chiang Rai 57100, Thailand
4
National Metal and Materials Technology Center, National Science and Technology Development Agency, Pathumthani 12120, Thailand
5
Institute of Food Research, National Agriculture and Food Research Organization, Tsukuba 305-8642, Japan
6
National Centre for Food Manufacturing, College of Science, University of Lincoln, Lincoln PE12 7PT, UK
*
Author to whom correspondence should be addressed.
Horticulturae 2021, 7(10), 392; https://doi.org/10.3390/horticulturae7100392
Submission received: 13 September 2021 / Revised: 8 October 2021 / Accepted: 8 October 2021 / Published: 11 October 2021
(This article belongs to the Special Issue Improving Quality of Fruit)

Abstract

:
The efficiency of different thermal insulation covers in minimizing temperature fluctuations in cool chain management was investigated to reduce postharvest loss and maintain okra quality during storage and transportation. The four thermal insulation covering materials: (1) heat reflective sheet with thin nonwoven (HRS + TNNW), (2) heat reflective sheet with thick nonwoven (HRS + TKNW), (3) metalized Tyvek® (MTyvek) and (4) metalized foam sheet (MFS) were studied and compared with perforated linear low-density polyethylene (P-LLDPE) as the typical handing package for okra distribution alongside no covering as the control. The material properties, transpiration rate, vital heat, temperature profiles (air and pulp temperatures), relative humidity, mass loss and incidence of decay were determined throughout a simulated supply chain. Results exhibited that HRS + TNNW and HRS + TKNW covers had the lowest thermal heat energy (Qx) and moderate R-value. These two covers maintained low temperature fluctuation with the lowest rate of air and pulp temperature changes, reflecting in lowest mass loss and decay in okra. The HRS + TNNW cover yielded less decay (1%) in okra, compared to commercial covers; MTyvek (16%) and MFS (9%). Results showed that HRS + TNNW exhibited great potential as a thermal insulation cover to reduce postharvest loss in okra (5%) compared to typical handling (11–18%) and could be considered as alternative material to reduce the use of foam sheets in cool chain management distribution packaging of okra under ambient environment conditions.

1. Introduction

Okra (Abelmoschus esculentus L.) belongs to the Abelmoschus genus of the Malvaceae family [1]. Okra is an economic vegetable crop grown in Thailand and exported to global markets, especially Japan, Hong Kong, Switzerland, Germany and the United Arab Emirates. Japan is the main importer of fresh okra from Thailand (worth approximately 5.50 million USD) per annum and accounts for 82.6% of the total exported okra volume [2]. Concerns in okra production, including fruit quality determination, inadequate harvesting procedures, okra harvester training levels, lack of suitable transportation and insufficient pre-cooling facilities, have all been cited as problems for marketable okra [3].
Optimal storage conditions of okra to extend shelf-life from 7 to 10 days range from 7 to 10 °C with a relative humidity (RH) 95 to 100% [4]. Higher temperatures than 25 °C result in unmarketable quality and a shorter shelf-life of 3 days [5,6,7]. At high temperature, okra is susceptible to water loss, color fading and rotting with consequent loss of commercial value [8]. Okra has a high respiration rate, therefore, temperature is the most significant environmental factor affecting the postharvest quality. Increase in storage temperature to 25–27 °C resulted in an elevated respiration rate (328–362 mg CO2 kg−1 h−1) compared with a lower temperature storage at 4–5 °C (53–95 mg CO2 kg−1 h−1) [4]. Mass losses of okra at 5 °C, 10 °C and 25 °C after 5 days storage were 10%, 16% and 27%, respectively [5].
Cool chain management is an end-to-end controlled temperature process used to preserve the quality of commodities throughout the supply chain [9]. Cool chain management prevents biological decay and ensures the delivery of healthy, high-quality foods to customers. The optimal storage temperature range for fruits and vegetables is 0 to 16 °C [10]. Several studies have investigated cooling and storage cold chain management of okra [4,5,7,11,12,13]. For heat removal after harvesting, forced-air cooling was recommended for the handling of exported okra [14]. In India, room cooling at 15 °C was applied to exported okra before storage at 8 °C [15]. Recently, room cooling at 0 °C for 2 h was applied in combined with usage of thermal insulation covering materials, to reduce decay incidence and mass loss of okra in Thailand [16].
Material properties including thickness, number of surfaces and number of reflective surfaces are important factors that determine insulating ability of the materials [17]. The most common thermal insulation materials used for pallet cover applications such as polystyrene, aluminum foil and nonwoven fabrics were described in terms of material properties, particularly thermal conductivity. A lower thermal conductivity that restricted heat transfer provided improved thermal insulation property [18]. Polystyrene foam and polyurethane have the lowest thermal conductivity of the possible materials used, followed by nonwoven fabrics or polypropylene. Aluminum foil is a reflective insulation material composed of one or more low-emission surfaces that provides high thermal conductivity and reflects heat to effectively minimize heat radiation [19]. Aluminum foil as pallet cover material is used on its own and combined with expanded polyethylene (EPE) as foam sheet for fresh produce covering [20].
Thermal insulation packaging minimizes the rate of temperature change and is used for up to 50% of chilled food [21]. Investigations have been extensively undertaken on thermally insulated packaging boxes for food delivery and pallet covers for fresh produce during distribution and transportation [18,20,22,23]. Pallet covers are used as packaging to minimize waste from food spoilage by delaying rapid changes of temperature and humidity in amaranth [20], chard, cucumber, carrot [22], and strawberry [23]. However, limited studies have addressed the positive impacts of pallet covers in reducing postharvest loss of fresh fruits and vegetables. Previous research studies have addressed thermal insulation covering of fresh fruits and vegetables, but no reports are available for okra or other high respiration rate crops. Most previous studies of thermal insulation coverings on fresh produce only focused on controlling temperature, with no examination of fresh produce quality. Recently, the first report on thermal insulation packaging of fresh produce was done to evaluate efficiency of thermal insulation covering materials combined with room cooling for controlling temperature fluctuation and reduction of postharvest mass loss and decay of okra. Results suggested that room cooling at 0 °C for 2 h for heat removal was important before covering with thermal insulation materials. Combined room cooling with two-layer heat reflective sheet with thin nonwoven (HRS + TNNW) as a developing handling exhibited the highest efficiency for preserving cool temperature and reducing postharvest loss of okra (mass loss and decay) (15%) compared to typical handling (no room cooling and covering) (65%), covering with perforated linear low-density polyethylene (59%) and metalized foam sheet (MFS) (27%). Furthermore, the difference in postharvest loss between no room cooling and room cooling observed in HRS + TNNW and MFS treatments were 11% and 25%, respectively. This indicated that room cooling plays an important role in maintaining the okra quality as a pretreatment before covering with thermal insulation material [16].
According to domestic transportation of okra from community enterprise in Phayao province (in the northern part of Thailand) to food factories (in the central part of Thailand), high temperature and relative humidity fluctuations in transportation vehicles caused postharvest losses of okra such as wilting heat damage and decay. Poor cooling facilities, including no pre-cooling, no cooling storage and non-refrigerated vehicle during transportation, all caused physiological loss. Losses of perishable crops due to a lack of refrigeration were higher in developing countries (23%) than in developed countries (9%) [24]. In this study, a prototype of thermal insulation covering was designed by combining materials between heat reflective sheet and thin nonwoven (HRS + TNNW) as an alternative to foam-based material to minimize okra postharvest losses and transportation cost. The objectives of this study were: (1) to investigate the performance of different thermal insulation covering materials in controlling temperature fluctuations under storage and transportation temperature conditions, and (2) to evaluate the reduction of postharvest loss and the quality of okra, when covered with thermal insulation materials.

2. Materials and Methods

2.1. Determination of Material Properties

Thermal insulation materials employed for covers were perforated linear low-density polyethylene (P-LLDPE), thin nonwoven (TNNW), thick nonwoven (TKNW), heat reflective sheet (HRS), metalized Tyvek® (MTyvek) and metalized foam sheet (MFS). Their thermal properties as rate of heat energy (Qx), R-value, water vapor permeability (WVP) and air permeability were determined. Six replicates were tested and average values were reported.
Equipment settings and thermal heat energy measurements were performed following the procedure of Harvey [25] and our previous research [16]. Briefly, rate of thermal heat energy (Qx) was determined as the rate at which heat energy passed through the material by using two expanded polystyrene (EPS) boxes with a hole (10 × 10 cm2) between two chambers. Temperature data loggers (Tinytag Talk 2: TK-4014-PK, Gemini Data Loggers, Chichester, West Sussex, UK) were used to monitor the temperature change between the two chambers for 3 h until constant, and the transfer rate of thermal heat energy (Qx) in J s−1 unit was calculated.
Water vapor permeability (WVP) was examined for different insulation materials using the desiccant in cup method. Following ASTM96 [26], the specimen or cover material (20 cm2) was sealed to the open mouth of a test dish containing a desiccant and placed in a constant climate chamber (KBF-115, Binder, Tuttlingen, Germany) at 25 °C with 50% relative humidity (RH). WVP was calculated as rate of water vapor transmission in g h−1 m−2 unit. Air permeability was determined using an air permeability tester (FX 3300 LabAir IV, Textest Instruments, Schwerzenbach, Switzerland) according to ASTM D737-04 [27]. The thermal insulation materials were cut into 20 × 20 cm2 squares and results were reported in L m−2 s−1 unit.
The R-value was calculated as resistance to heat flow through the thermal insulation material using the ice-melt procedure of Singh et al. [18]. To calculate the melt rate, the weight of water was reported as m2 °C W−1 unit using Equation (1):
System R-value = (Surface area × Temperature difference)/(Melt rate × Latent heat)
where, surface area is inside surface area of the thermal insulation cover (m2), temperature difference (°C) is ambient temperature − - melting point of ice (25 °C − 0 °C = 25 °C), melt rate (kg h−1) is weight of water collected divided by test time, latent heat is 335 kJ kg−1.

2.2. Plant Materials and Treatments

‘Lady Finger’ okra pods were harvested around 45 days after planting or 6 days after flowering (September 2019) from the okra plantation (latitude 20°13′27.2″N longitude 99°50′05.2″E) in Mae Chan district, Chiang Rai Province, Thailand. The okra pods (5 kg) were carefully transferred into 10 kg plastic baskets to protect against bruising or abrasion from the farm to the Postharvest Laboratory (S7) at Mae Fah Luang University within 30 min. After arrival at the laboratory, okra pods were graded for size uniformity with pod length of 7 to 11 cm (specific size for okra processing) and sorted according to minimum requirements; fresh, green in color, free distinct signs of bruising, smooth and clean at pedicel cut surface. The okra pods (1500 g) were packed in plastic baskets for room cooling treatment for 2 h by setting the cooling medium at 0 °C. The pulp temperature of okra was monitored, using a multichannel data logger (Hioki, LR8431, Nagano, Japan) connected with a type-K thermocouple for 10 channels (plastic baskets), to check uniformity of pulp temperature during room cooling treatment. The final pulp temperature of packed okra in all baskets reached 9 °C after room cooling for 2 h. After cooling, the okra pods were packed in six treatments of different insulation materials (four treatments and P-LLDPE), including no cover as a control.
Six treatments with five replicates included five covering materials; P-LLDPE, HRS + TNNW, HRS + TKNW, MTyvek and MFS (Figure 1) with size of 18 × 32 × 12 cm3, compared with control (no cover). The HRS material was evenly perforated with a pin of diameter 0.55 mm to give total perforation area of 0.09 cm2. Two layers of covers as HRS + TNNW and HRS + TKNW were prepared by attaching HRS and NW via spot bonding (Figure 2). Following the postharvest handling of okra from community enterprise in Phayao province, all six treatments were transferred to simulated storage at 18 ± 2 °C for 48 h, followed by simulated transportation. at 30 ± 1 °C for 15 h.

2.3. Determination of Air and Pulp Temperature in Okra

Air and pulp temperatures inside the okra pod were measured at 30 s intervals from the start of cooling using two types of temperature data loggers; air temperature (Tinytag Talk 2: TK-4014-PK, Gemini Data Loggers) with three replicates and pulp temperature (Tinytag Talk 2: TK-4023-PK, Gemini Data Loggers, Chichester, West Sussex, UK) with four replicates. Percentage RH level was determined by a temperature and relative humidity data logger (Tinytag Ultra 2: TGU-4500, Gemini Data Loggers, Chichester, West Sussex, UK) at intervals of 30 s.
Measured air and pulp temperatures were analyzed using a boxplot at 12 h after simulated storage and transportation. Rates of temperature changes (°C h−1) during temperature rise after cooling to 25 °C for temperature ranges of 25 °C to 30 °C were calculated. Median value temperatures were presented as boxplots and included accumulated time-temperature (ATT) (°C h) throughout the simulated supply chain. Heatmap analyses representing air and pulp temperature levels during 12 h after simulated storage and transportation were presented. Heatmap visualizations were created using MATLAB Software version R2018a (MathWorks Inc., Natick, MA, USA) in this study.
For thermal imaging, temperatures were immediately recorded by a thermal camera (FLIR ONE® Pro LT, Teledyne FLIR, Wilsonville, OR, USA) after removing the cover to provide a rapid visual comparison at the end of simulated transportation.

2.4. Determination of Respiration Rate and Vital Heat

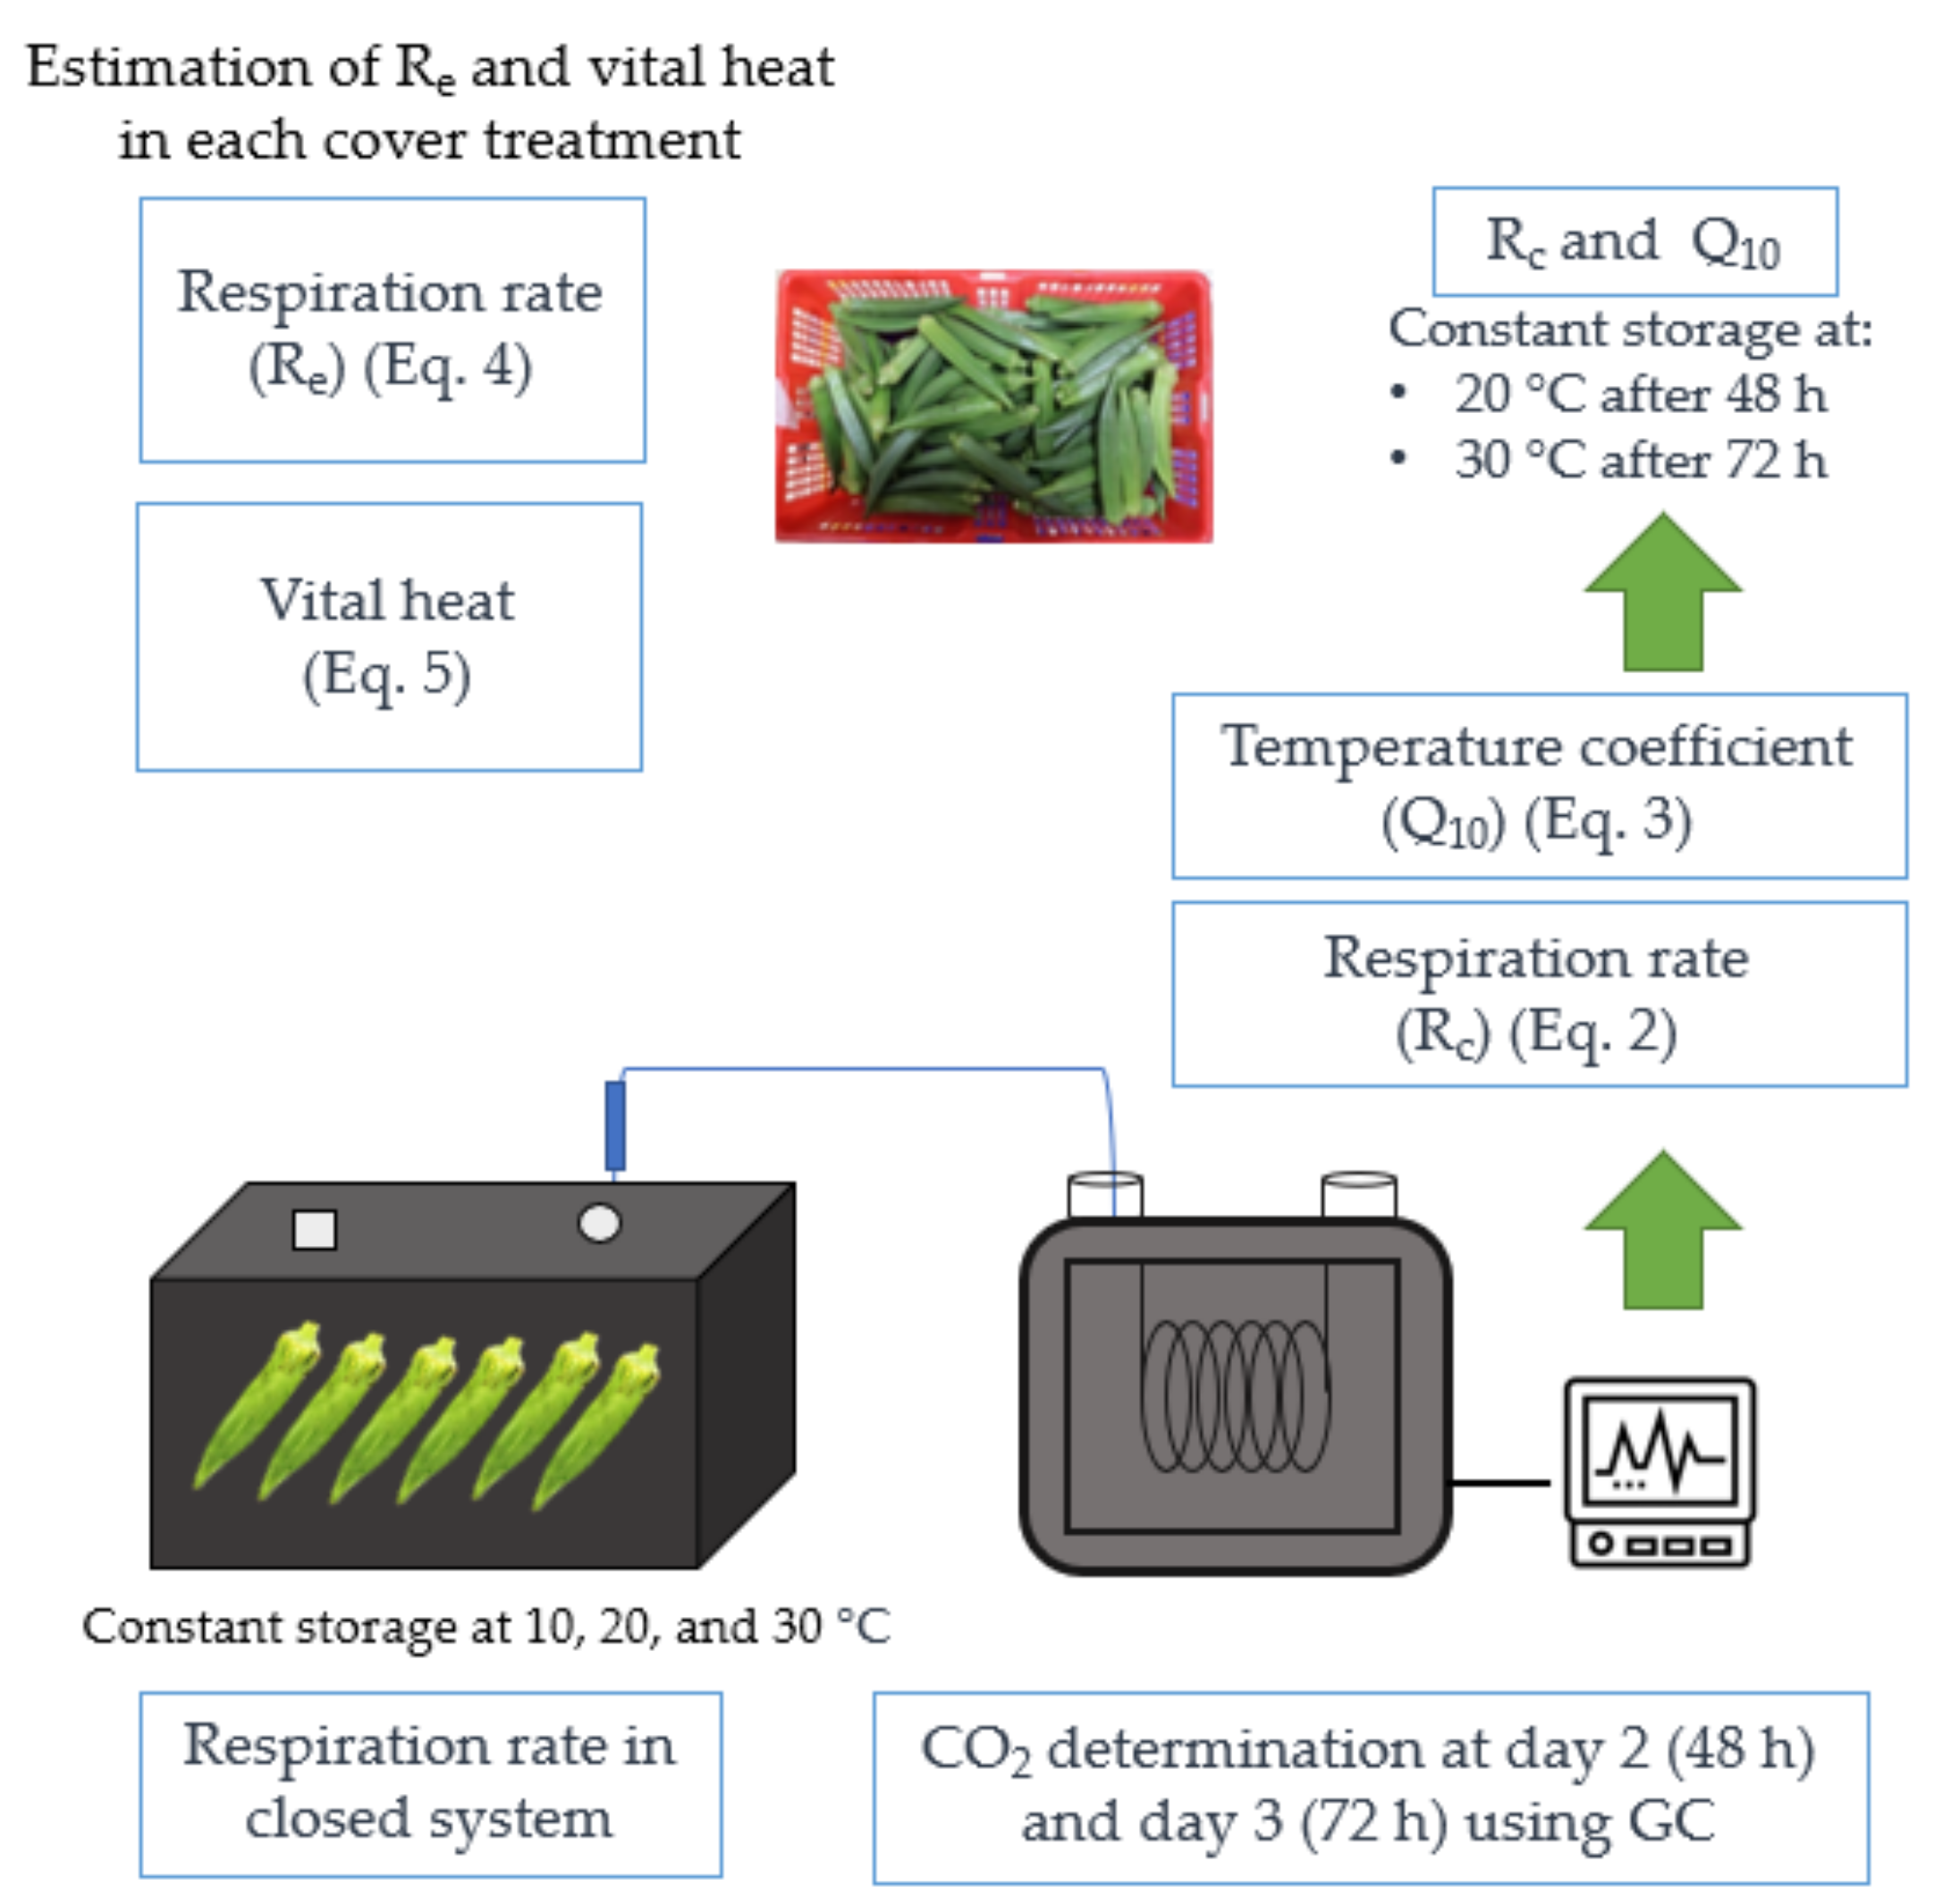
The rate of okra respiration was measured in a closed system, as shown in Figure 3. The details of the test set up were described elsewhere in our previous study [16]. Briefly, the okra pods (150 g) were packed in a plastic food container (8400 mL) under three storage temperature conditions (10, 20, 30 °C) with a range of 70–90% RH with three replicates in each condition. Gas was sampled for CO2 detection at day 2 (48 h) and day 3 (72 h) and analyzed by a gas chromatograph (GC) (7890A, Agilent Technologies, Santa Clara, CA, USA). Respiration rate (Rc) for respiration was calculated to unit of mL CO2 kg−1 h−1 and converted to mg CO2 kg−1 h−1 by multiplying conversion figure at 10 °C (1.89), 20 °C (1.83) and 30 °C (1.77) by Equation (2) [28,29]. The temperature coefficient (Q10) was calculated by Equation (3) [30]:
Rc (mg CO2 kg−1 h−1) = (%CO2 × V)/(100 × FW × T)
where, CO2 is the concentration of CO2 gas (%), V is volume of container (mL), FW is fruit weight (kg) and T = closing time (h):
Q10 = (R2/R1)10/(T2 − T1)
where, R2 and R1 are the respiration rate at temperature T2 and T1, respectively.
The calculated Q10 values on day 2 (48 h) and day 3 (72 h) (Table 1) were then employed to estimate the respiration rate of okra pods (Re) at various air temperature levels inside different covers and no cover. Air temperatures in either covers or no cover were recorded using a temperature data logger (Tinytag Talk 2: TK-4014-PK, Gemini Data Loggers, Chichester, West Sussex, UK) under simulated storage (18 °C for 48 h) and transportation (30 °C for 15 h) temperature conditions. The air temperature level for estimation of okra respiration rate (Re) in each cover treatment was determined from the median air temperature after simulated storage and transportation (Section 2.3). Respiration rates (Rc) at 20 °C after 48 h and at 30 °C after 72 h were used to estimate okra respiration rate under simulated storage and transportation (Section 2.3). Estimated respiration rates of okra among treatments were calculated using Equation (4):
Re = Rc × Q10 (T2 − T1)/10
where, Re is the estimated respiration rate of okra in each cover or no cover, Rc is the respiration rate from closed system, T2 is the final air temperature after simulation, and T1 is the initial air temperature before simulation.
A heat production (2.55 cal) from respiration is calculated by a CO2 production of 1 mg. A respiration rate of 1 mg CO2 kg−1 h−1 indicates a heat production of 61.2 kcal ton−1 day−1. In this study, vital heat from respiration of okra was calculated and converted into a unit of J kg−1 h−1 from kcal ton−1 day−1 in Equation (5) [31]:
Vital heat (J kg1 h1) = Re × 10.7

2.5. Determination of Transpiration Rate

The transpiration rate was calculated from the mass of okra pods using an electric weighing balance (PioneerTM, Ohaus, Parsippany, NJ, USA). Initial mass before cooling and final mass at the end of storage simulation (18 °C for 48 h) and transport simulation (30 °C for 15 h) were determined. Transpiration rate was calculated per unit of surface area (TRA) in g h−1 m−2, given by Equation (6) [32]:
TRA = (mi − mt)/(t × A)
where, mi is the initial fruit mass (g), mt is the mass of fruit at time (g), t is time (h) and A is the surface area of the fruit (m2).
Surface area of the okra pod was calculated by Equation (7) [33]:
S = πDg2
where, S is surface area (m2) and Dg is geometric mean.
The geometric mean of okra was estimated calculation for the cylindrical nature of okra pod shape (Figure 4) by Equation (8) [33]:
D g   =   L   ×   W 2 3
where, L is length (m) and W is width (m).

2.6. Mass Loss Determination

Mass loss of okra pods was determined using an electric weighing balance (PioneerTM, Ohaus). Percentage mass loss (%) was calculated on the basis of initial weight (IW) before cooling and final weight (FW) at the end of simulated storage (18 °C for 48 h) and simulated transportation (30 °C for 15 h) by the equation WL (%) = [(IW − FW/IW] × 100.

2.7. Incidence of Decay

The decay of okra pods was described in four categories as <10% of decay occurrence, 10–25% of decay occurrence, 25–50% of decay occurrence and >50% of decay occurrence. The initial decay symptom exhibited tissue damage containing a small-soaked lesion or the whole pod covered up with a grayish-white mass of mold. The okra pods of each decay symptom were categorized and weighed (D). The percentage decay (%D) in each category was determined on the basis of total weight per plastic basket of pods after storage at 18 °C for 48 h (TW) using; D (%) = [(D/TW) × 100] [34]. Incidence of decay was determined at the end of simulated transportation.

2.8. Statistical Analysis

SPSS for Windows version 20 (SPSS Inc., Chicago, IL, USA) was used for statistical, correlation and cluster analyses. Data analyses for material properties, transpiration rate, vital heat, rate of temperature change, mass loss rate and incidence of decay among the six treatments were compared by mean (α = 0.05) using Tukey’s HSD test. All data variables among six treatments were analyzed using Pearson correlation analysis at the 0.01 level. Material properties, transpiration rate, vital heat, rate of air and pulp temperature changes, accumulated time-temperature, mass loss and incidence of decay from the six treatments were determined as clustering analysis using Ward’s coefficient by agglomerative hierarchical clustering.

3. Results and Discussion

3.1. Materials Properties

Properties of covering materials including thickness, Qx, R-value, WVP and air permeability were shown in Table 2. P-LLDPE (thickness of 0.120 mm) having low insulation property exhibited the highest thermal heat energy value (Qx) of 3.750 × 10⁻⁴ J s−1, while MFS (thickness of 3.100 mm) with high insulation property exhibited the lowest thermal heat energy (1.440 × 10⁻⁴ J s−1). A high R-value of material indicates high insulation property that relates to low thermal heat energy value. Highest R-value of MFS was 0.223 m2 °C W−1 followed by HRS (0.214 m2 °C W−1), MTyvek (0.208 m2 °C W−1), TKNW (0.194 m2 °C W−1), TNNW (0.181 m2 °C W−1) and P-LLDPE (0.161 m2 °C W−1). Heat transmission played a role in temperature transfer and material property that explained the performance of temperature preservation by material covers [22,35]. Heat transfer can be defined as the transmission of energy that results in a temperature differential [35]. Thermal heat energy (Qx) and R-value variables were the principal thermal insulation qualities in this investigation (Table 2). Highest insulation property was observed in MFS that had the lowest thermal heat energy as well as the highest R-value, while MTyvek and HRS materials had lower Qx and greater R-value levels than the two nonwovens of different thicknesses (TKNW and TNNW). Regarding thermal heat energy (Qx), lower Qx level indicated lower heat transfer rate (good insulator) through the material layer [25]. In thermal insulation material applications, the thickness of materials (conduction), the bulk movement of fluids (heat transfer between solid and fluid) (convection) [35], and number of reflective surfaces (radiation) affect the insulating ability [17]. The thermal insulation material prototype was designed as HRS combined with either TNNW (0.270 mm) or TKNW (0.470 mm) to increase insulation property. Developing a thermal insulation material for okra package cover improved more conduction by increasing nonwoven thickness, convection by increasing the number of layer materials and reflective surface by applying HRS with nonwoven material.
In terms of water vapor permeability (WVP), the partial pressure difference between inside and outside of the test material impacts moisture gain or loss in the product [36]. From results, TNNW (0.373 g h−1 m−2) and P-LLDPE (0.360 g h−1 m−2) provided higher WVP than MFS (0.000008 g h−1 m−2) and HRS (0.000002 g h−1 m−2) (Table 2). Similarly, WVP of LLDPE-based nanocomposite films ranged from 0.07 to 0.31 g h−1 m−2 [37], and higher than WVP of aluminum foil (0.009 mm) (0.00042 to 0.00051 g h−1 m−2) [38]. Using high WVP materials gives potential to eradicate vapor condensation, thus reducing microbial activity [36]. Air permeability through TNNW sheet was the highest (917.000 L m−2 s−1), while those through HRS (0.543 L m−2 s−1) and MTyvex (0.497 L m−2 s−1) were the lowest. MFS and HRS materials had low WVP and air permeability values (Table 2), resulting in vapor condensation inside the covers. A designed combination of perforated HRS with either TNNW or TKNW provided good thermal insulation, water and air permeability and highest overall thermal insulation properties to maintain lower air and pulp temperature levels (Figure 5) without moisture condensation inside the cover.

3.2. Temperature and Relative Humidity Inside Cover Materials

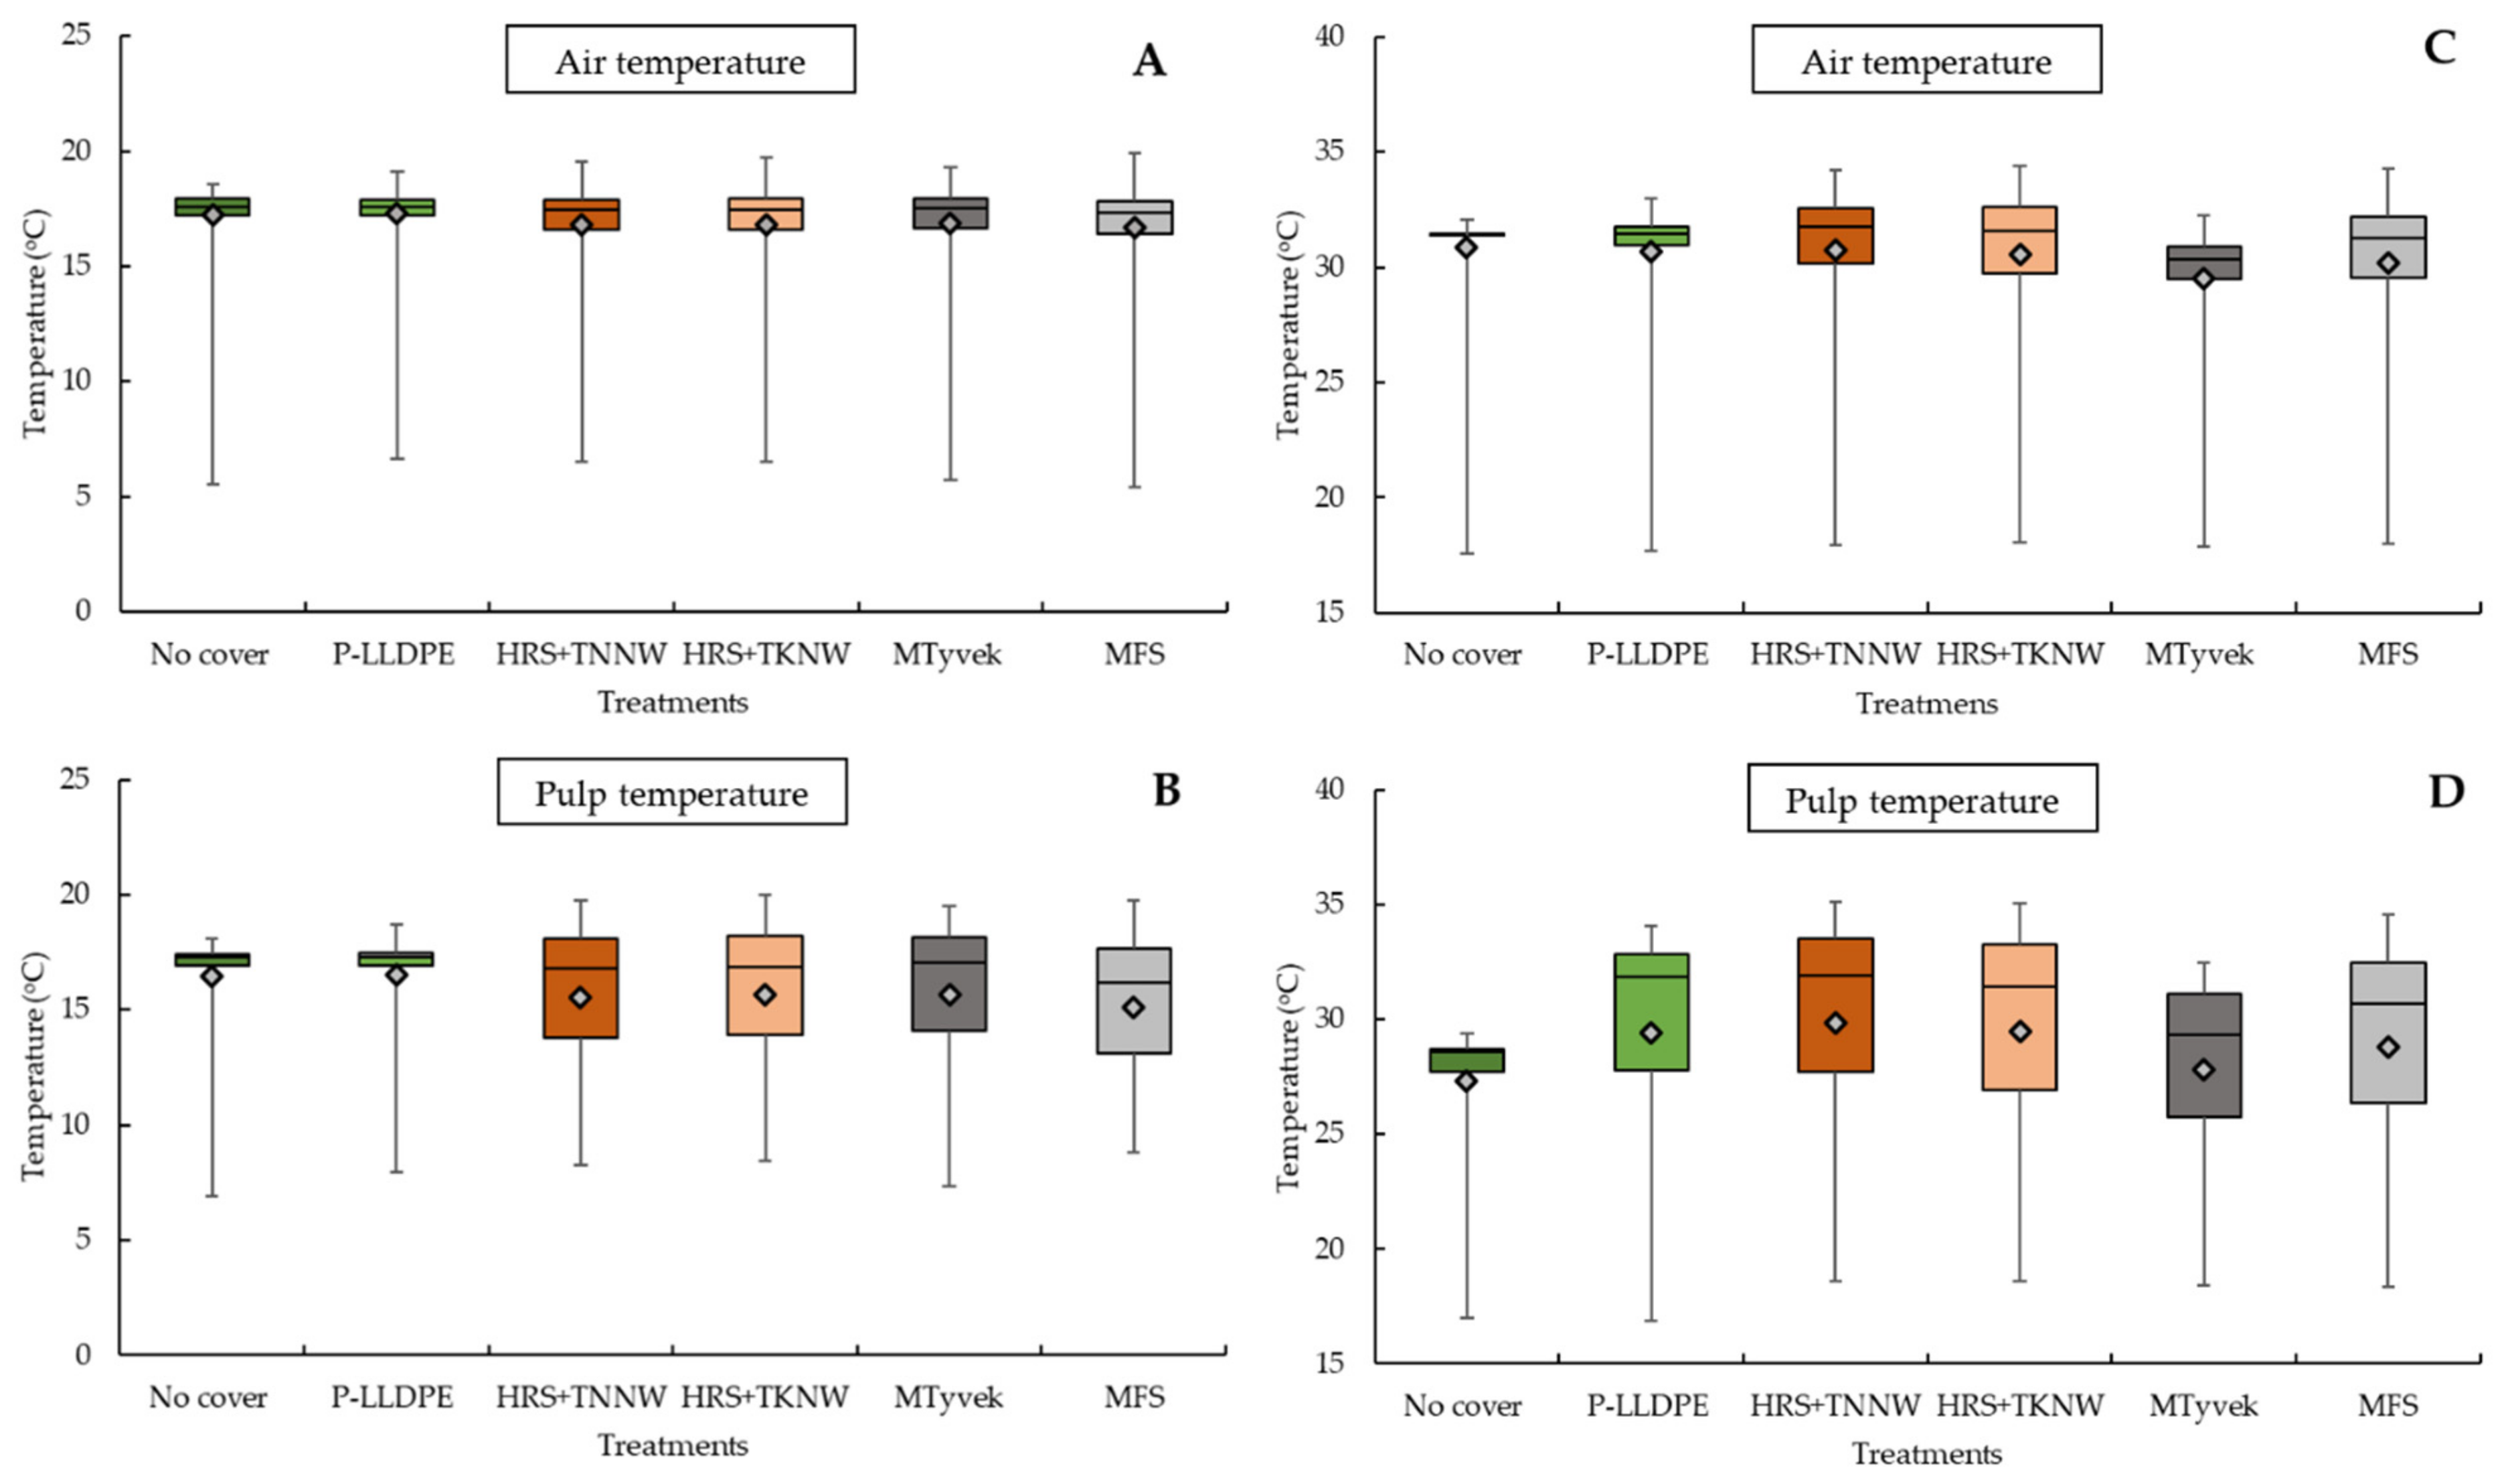
In postharvest handling, application of insulation packaging for fresh produce to preserve cool temperature requires cooling treatment before covering. The efficiency of controlling low temperature was analyzed and presented as a box plot graph (Figure 5). The means (rhombus symbol) of air and pulp temperature levels inside HRS + TNNW, HRS + TKNW, MTyvek and MFS treatments (range of pulp temperature (15.5 °C) and range of air temperature (16.8 °C)) during simulated storage at 18 °C for 12 h were lower than both no cover and P-LLDPE treatments (range of pulp temperature (16.5 °C) and range of air temperature (17.2 °C)) (Figure 5A). Pulp temperature control with low fluctuation was shown by the large size of boxplot. No cover and P-LLDPE treatments exhibited a narrow range of cool air temperature (smaller boxplot) compared with the other four thermal insulation covers (HRS + TNNW, HRS + TKNW, MTyvek and MFS) (larger boxplots) under simulated storage (Figure 5A,B). During simulated storage at 18 °C for 12 h, lower air and pulp temperature levels observed in these four thermal insulation treatments corresponded to their lower Qx values and higher R-values, compared to no cover and P-LLDPE treatments (Table 2). After transferring to a higher temperature (simulated transportation), MTyvek maintained lower mean air and pulp temperatures (29.5 °C and 27.8 °C) than the other five treatments (no cover at 30.9 °C and 27.3 °C, P-LLDPE at 30.7 °C and 29.5 °C, HRS + TNNW at 30.8 °C and 29.9 °C, HRS + TKNW at 30.5 °C and 29.5 °C and MFS at 30.2 °C and 28.8 °C) as shown in Figure 5B,D. In commercial practice, maximum temperature inside Tyvek cover of asparagus reduced by 8–9 °C compared to no cover [39].
In this study, good temperature control during simulated transportation (Figure 5C,D) was associated with lower rates of changes in air and pulp temperatures in the four thermal insulation treatments (Table 3). The no cover treatment showed the highest rates of air and pulp temperature changes at all conditions (T1 to 25 °C and 25 °C to 30 °C), compared to P-LLDPE and the four thermal insulation treatments. This indicated that covering with either P-LLDPE or thermal insulation materials reduced temperature changes under both simulation conditions (Table 3). These findings further support the idea of Liu [40] study. A typical double-bubble foil insulation sheet with 97% heat reflectance and a very low heat conductivity was applied to phosphine fumigation in chilled lettuce. The average rate of temperature change was 0.173 °C h−1. The rise in temperature was only 2.7 °C at the end of the 18 h fumigation treatment at the start of the fumigation (4.5 °C).
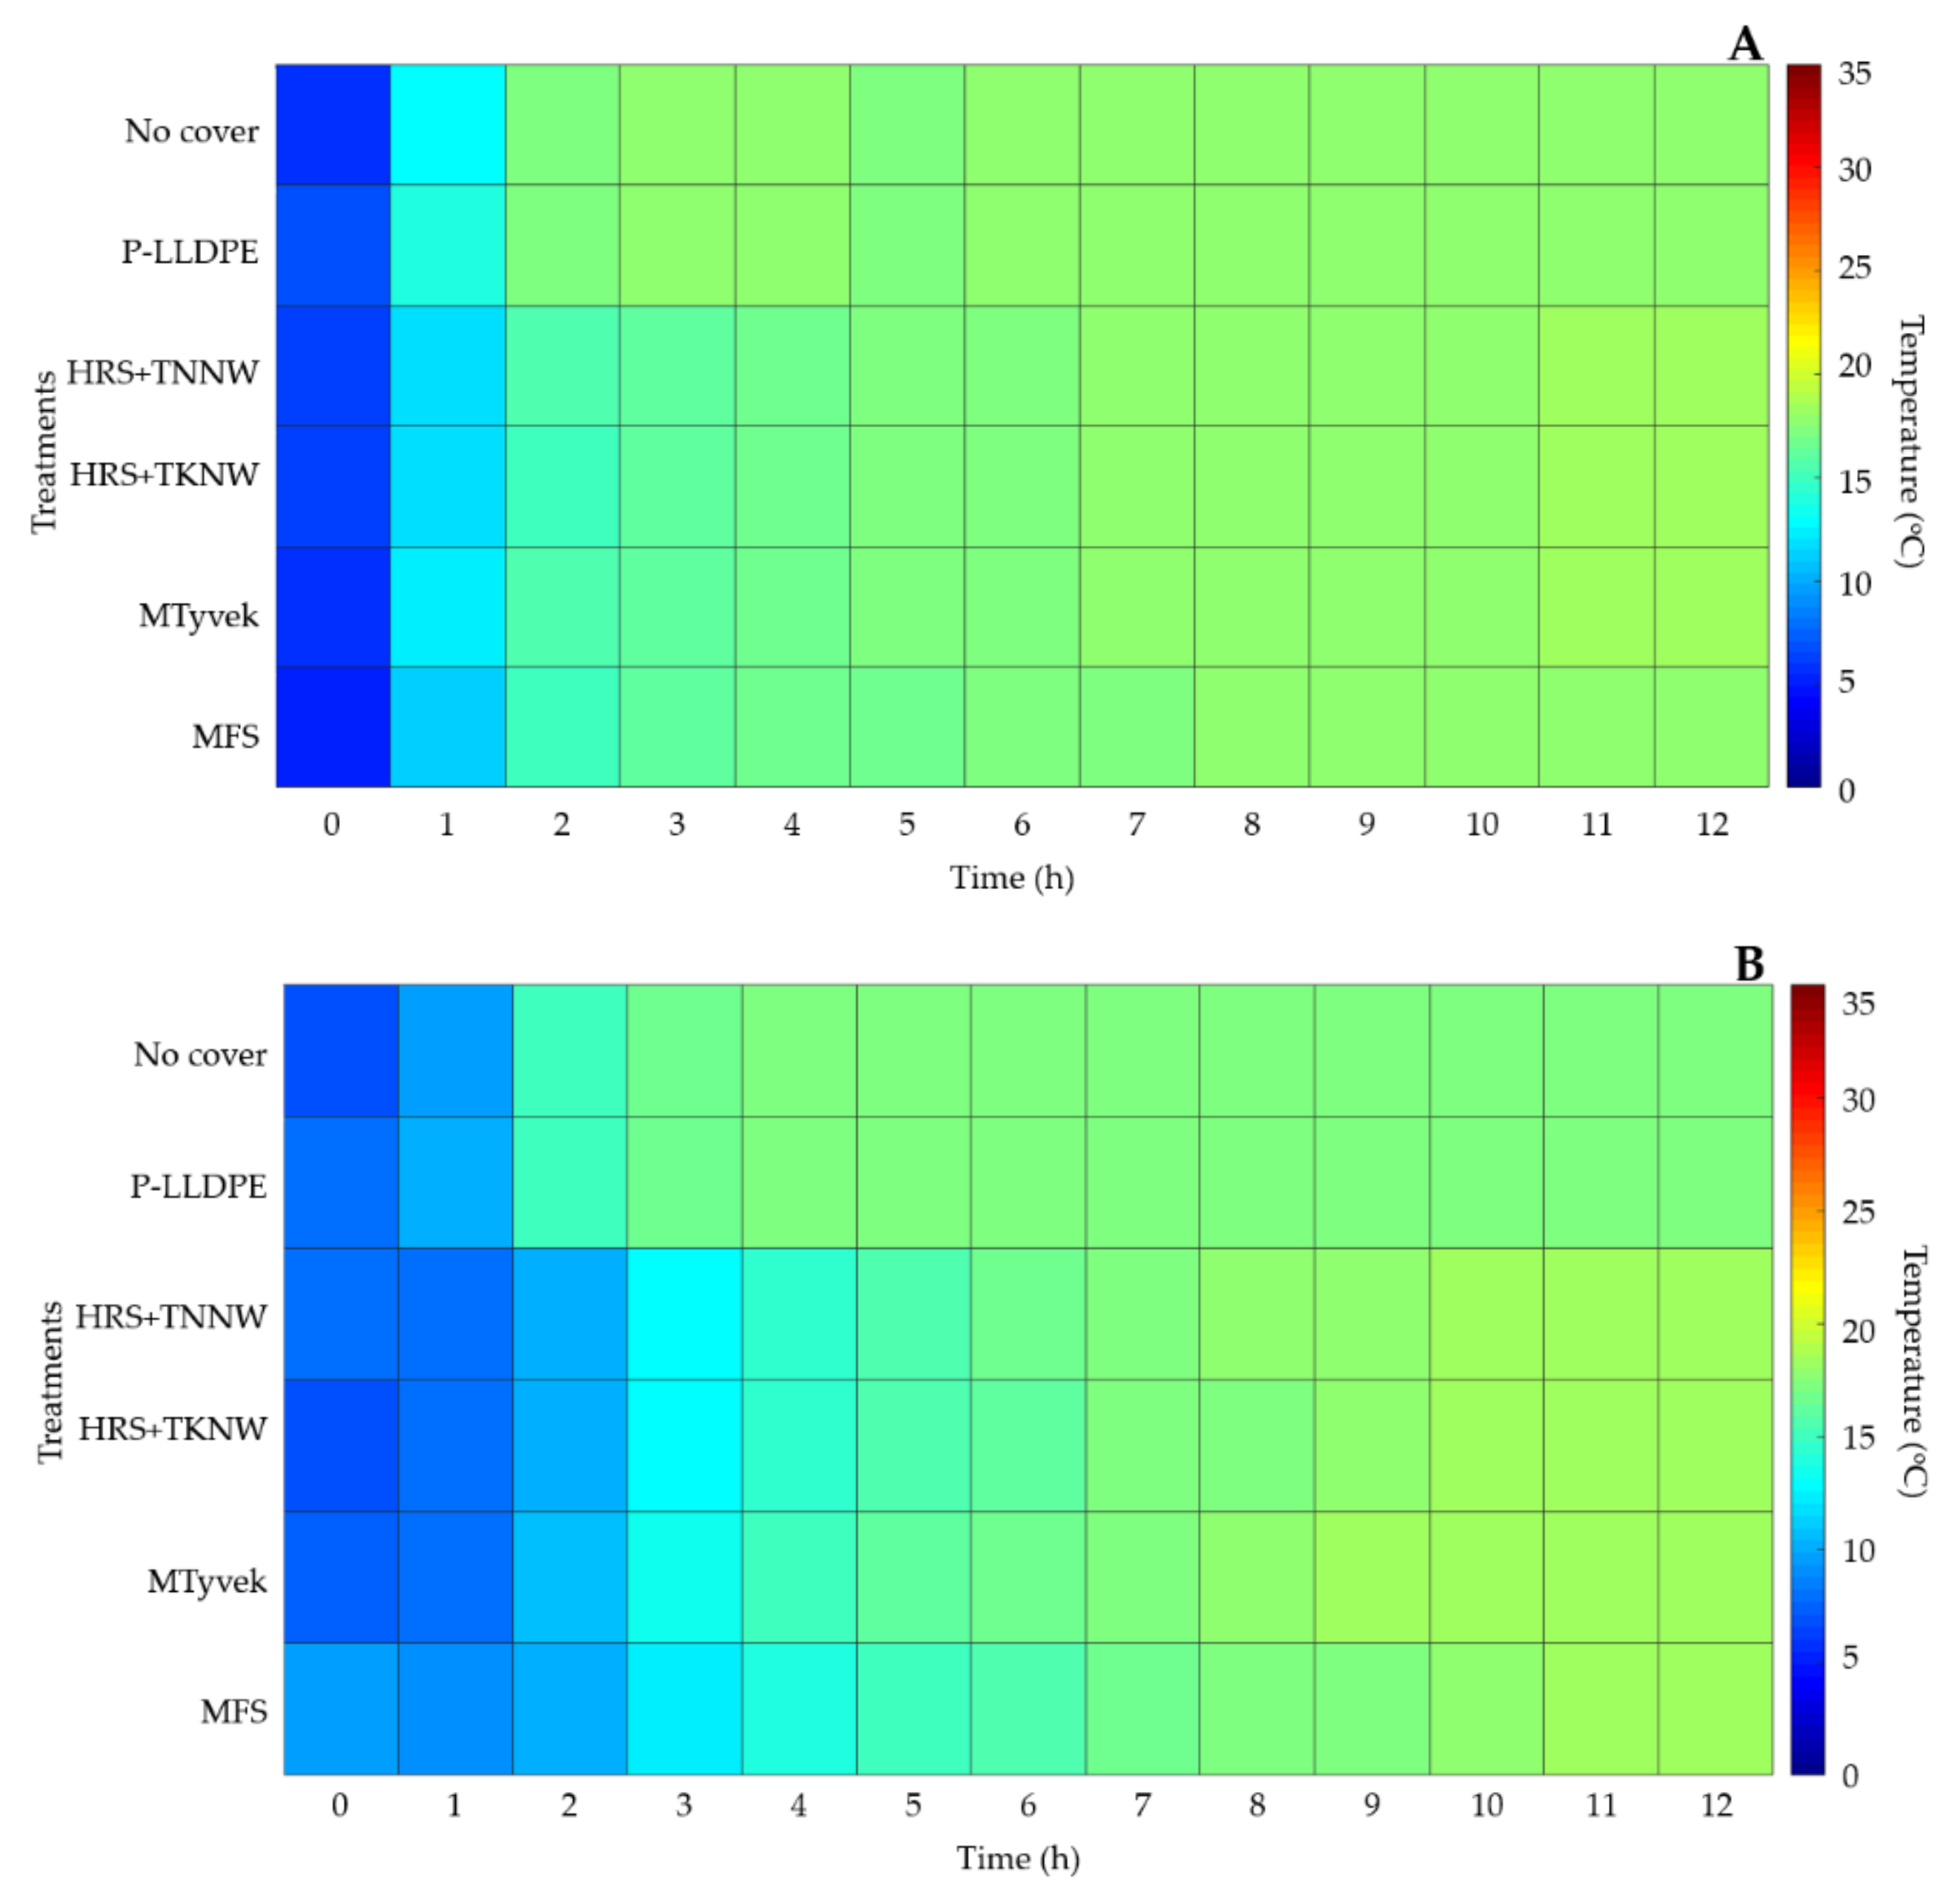
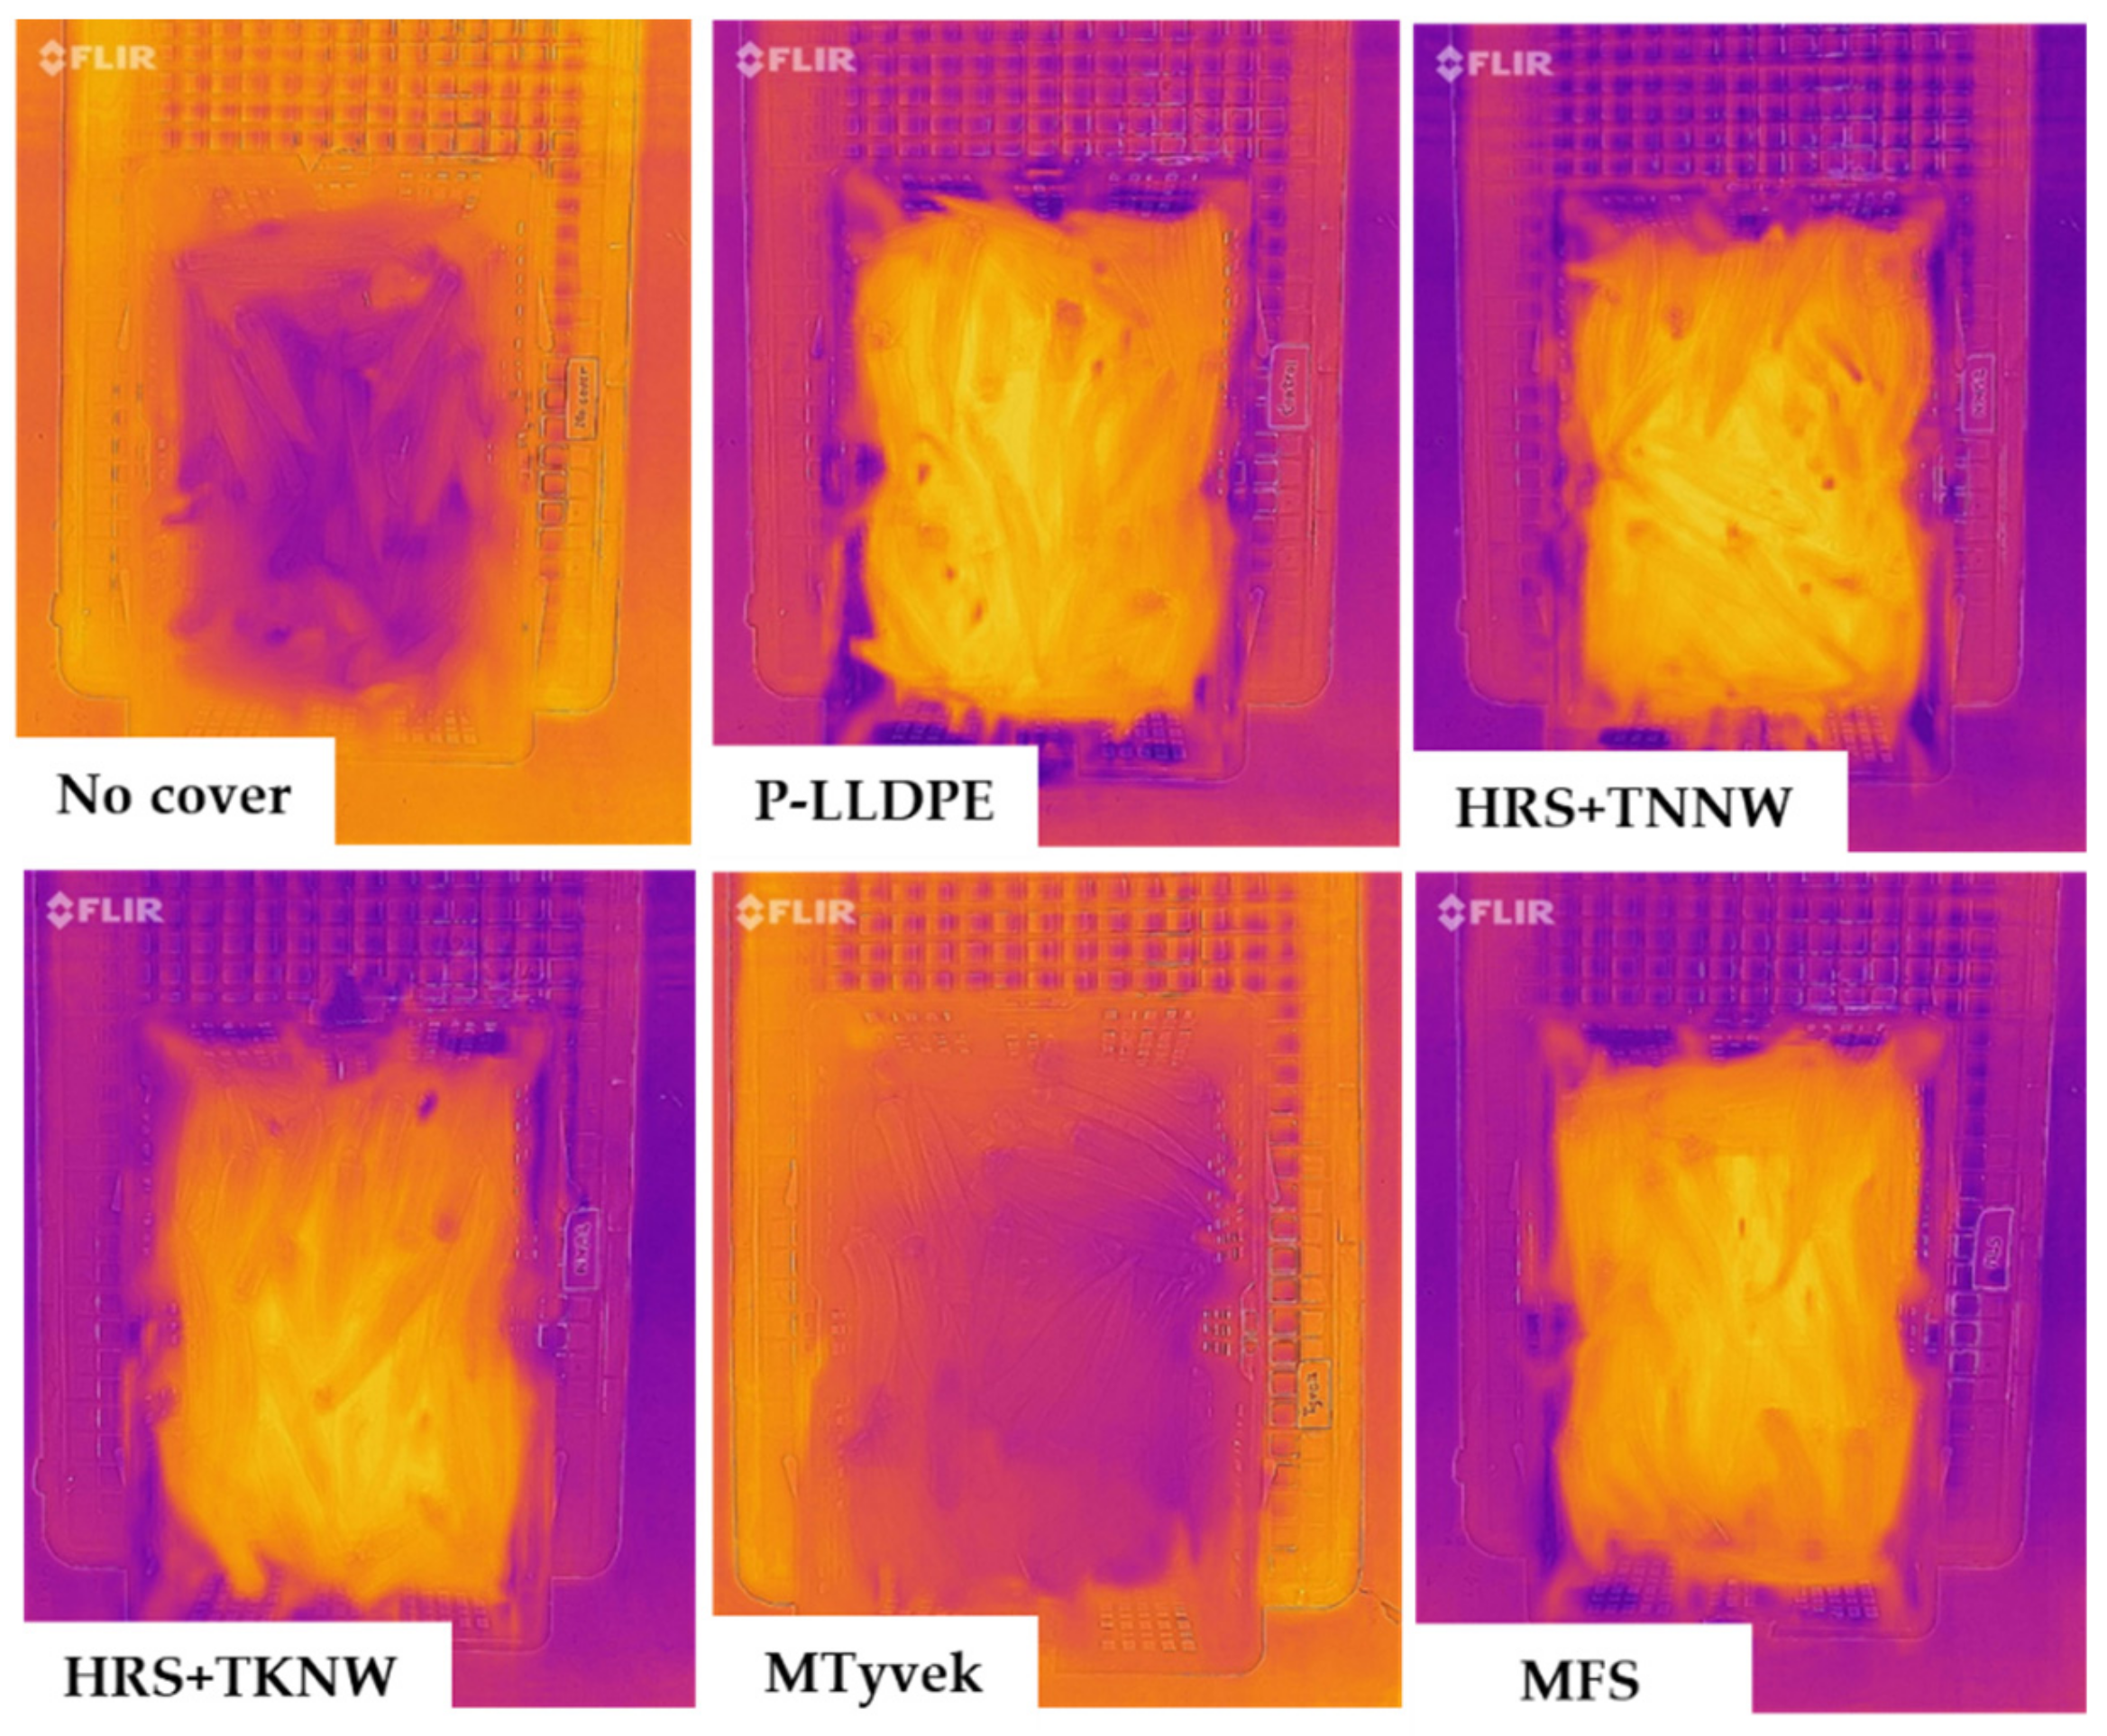
A high rate of temperature change in no cover and P-LLDPE, observed during simulated storage and transportation, was in good agreement with heatmap results that exhibited a matrix of red-blue color tones from 0 to 35 °C during each hour for 12 h testing (Table 3 and Figure 6). In both simulated storage and transportation conditions, no cover and P-LLDPE treatments exhibited higher air temperature than the other four cover treatments (Figure 6A,C), while the other four thermal insulation covers exhibited lower pulp temperature than no cover and P-LLDPE within 6 h for simulated storage (Figure 6B). No cover and MTyvek presented a light orange color tone, indicating lower average air and pulp temperatures during simulated 12 h-transportation compared with the other four treatments (Figure 6C,D). These heatmap results were corresponding well with results of thermal imaging that illustrated purple tone color (representing a low pulp temperature) after simulated transportation at 30 °C for 15 h (immediate removal covering) (Figure 7). This implied that both no cover and MTyvek treatments had higher air ventilation and heat transfer from inside the cover to the environment under simulated transportation. Therefore, the thermal image technique could be considered as an additional rapid technique to monitor the temperature. When temperature assessment is conducted on metalized sheet material, awareness of the camera emissivity setting [22] as well as the impacts of high emissivity coatings and orientation of the readings are important [41].
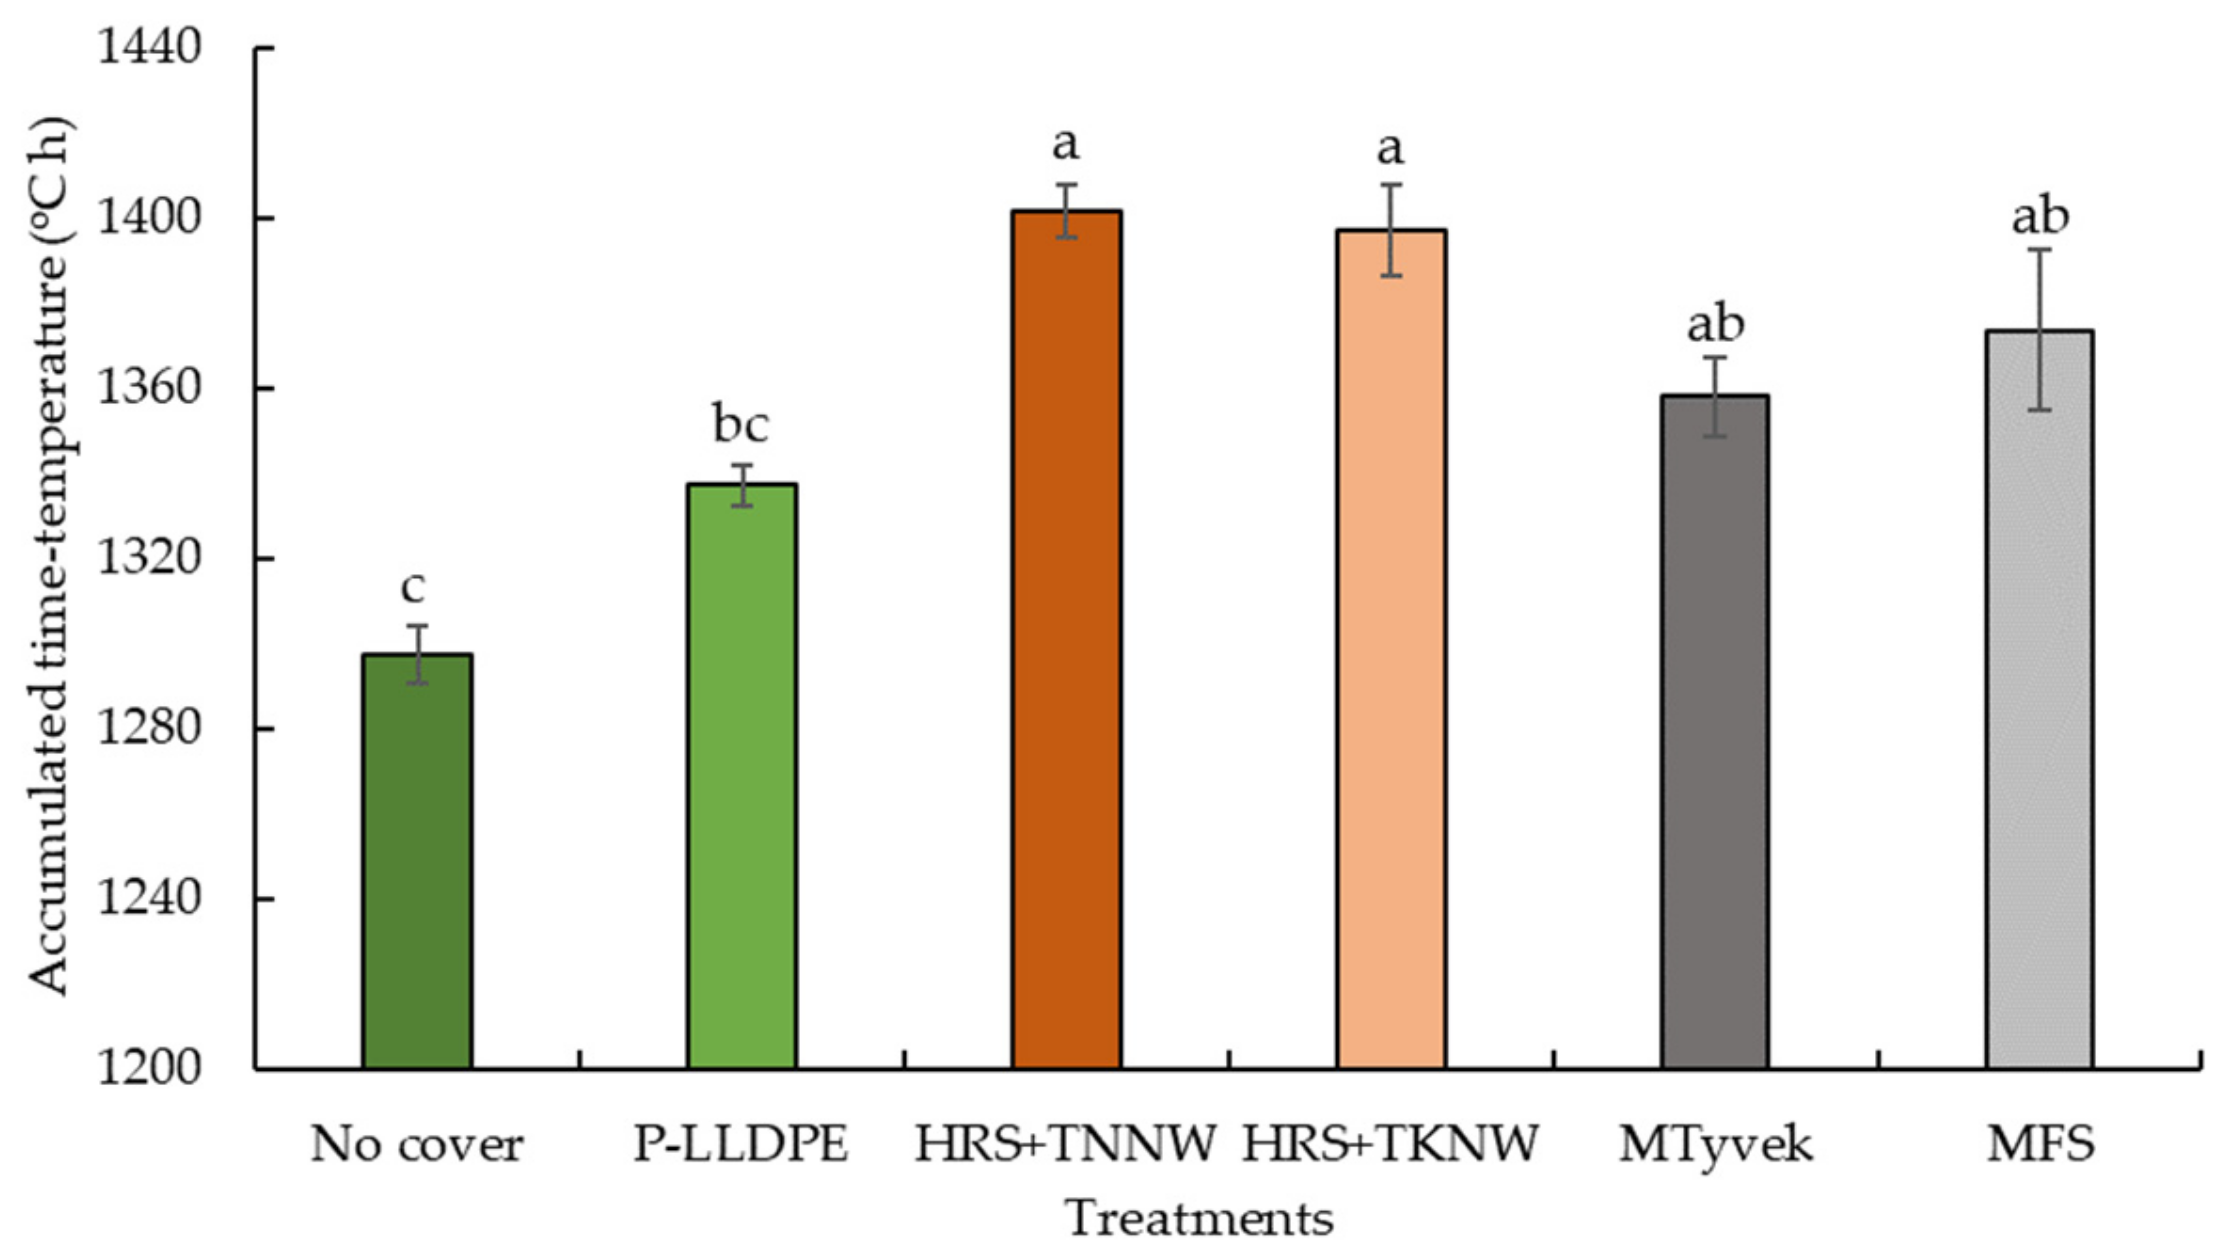
HRS + TKNW treatment exhibited the highest accumulated time-temperature (ATT) of 1396.4 °C h followed by MFS (1373.4 °C h), MTyvek (1357.8 °C h), P-LLDPE (1337.1 °C h) and no cover (1297.0 °C h) (Figure 8). The use of thermal insulation covers containing aluminum sheet (HRS + TNNW, HRS + TKNW and MFS) over 7 h resulted in greater heat accumulation inside the cover, caused by the high respiration of okra compared with no cover and P-LLDPE treatments (Figure 5, Figure 6 and Figure 7). Similarly, our previous study showed that thermal insulation materials (HRS + TNNW and MFS) tended to build up pulp temperature of okra under simulated transportation at 30 °C for 15 h [16]. This result was consistent with Bycroft et al. [42] who recommended that long-term covering of asparagus should be reconsidered due to higher heat accumulation compared to no cover.
From the results, it was suggested that application of a thermal insulation cover for okra (high respiration rate crops) under high temperature (25 °C) should be less than 7 h to avoid increased heat accumulation. Application of frozen gel pack helped to reduce temperature rise of food products (chicken salad and Brie cheese) inside Mylar foil bags under stress temperature at 37 °C [43]. Thus, placement of frozen gel packs is recommended inside thermal insulation covers to maintain low temperature under condition of extremely high temperature. Future study on applying thermal insulation covering in other high respiration rate crops and the use of gel packs or gel phase change materials (PCMs) should also be considered, while investigating the reduction in browning or blackening from mechanical damage under actual or simulated transportation would also be beneficial.
Scant research has been conducted on thermal insulation covers in okra or other high respiration rate crops. This study aimed to evaluate and assess thermal insulation covers in okra as a representative of high respiratory crops. The use of aluminum-based materials in combination with either nonwoven or expanded polyethylene (EPE) materials focused on developing thermal insulation covers (Table 2). Overall results on air and pulp temperatures inside the four thermal insulation covers gave improved performance and maintained low temperature profiles and fluctuation than no cover and P-LLDPE cover treatments (Figure 5, Figure 6 and Figure 8, Table 3). Materials with lower Qx value and higher R-value exhibited higher efficiency in maintaining low air and pulp temperatures (Table 2). Few studies on other fresh produce identified the positive effect of thermal insulation covers in controlling the inside cool temperature. The insulated pallet cover ReflectixTM constructed of aluminum foil and 0.8 cm polyethylene/bubble pack reduced mass loss in amaranth with less wilting and retained the desirable dark green leaf color [20], In strawberry, Tyvek®, a flash-spun nonwoven high-density polyethylene maintained cool temperature and prevented quality loss from supermarket to household refrigerator [23]. Insulation pallet coverings (Tyvek®, metalized PET, metalized PET bubbles) have provided greater temperature retention compared to no covering in chard, cucumber and carrot [22]. Recently, our previous study showed that application of thermal insulation covering (HRS + TNNW and MFS) in combined with room cooling (17 °C) could maintain the lowest mean pulp temperature, compared to P-LLDPE and no cover (19 °C) under simulated storage at 18 °C for 48 h [16]. Most academic reports revealed that application of different commercial covers yielded greater performance of thermal insulation compared to no cover but only a few studies have compared material function design of different commercial covers. In this study, commercial HRS material was perforated using a pin of diameter 0.55 mm to give total perforation area of 0.09 cm2. Two layers of either HRS + TNNW and HRS + TKNW were partially attached using glue as spot bonding. These designed insulation materials possessed moderate Qx and R-value and exhibited good performance in controlling low temperature, heatmap profiles, thermal images and rate of temperature changes compared to commercial MFS that had the lowest Qx and highest R-value levels (Table 2 and Table 3, Figure 5, Figure 6 and Figure 7).
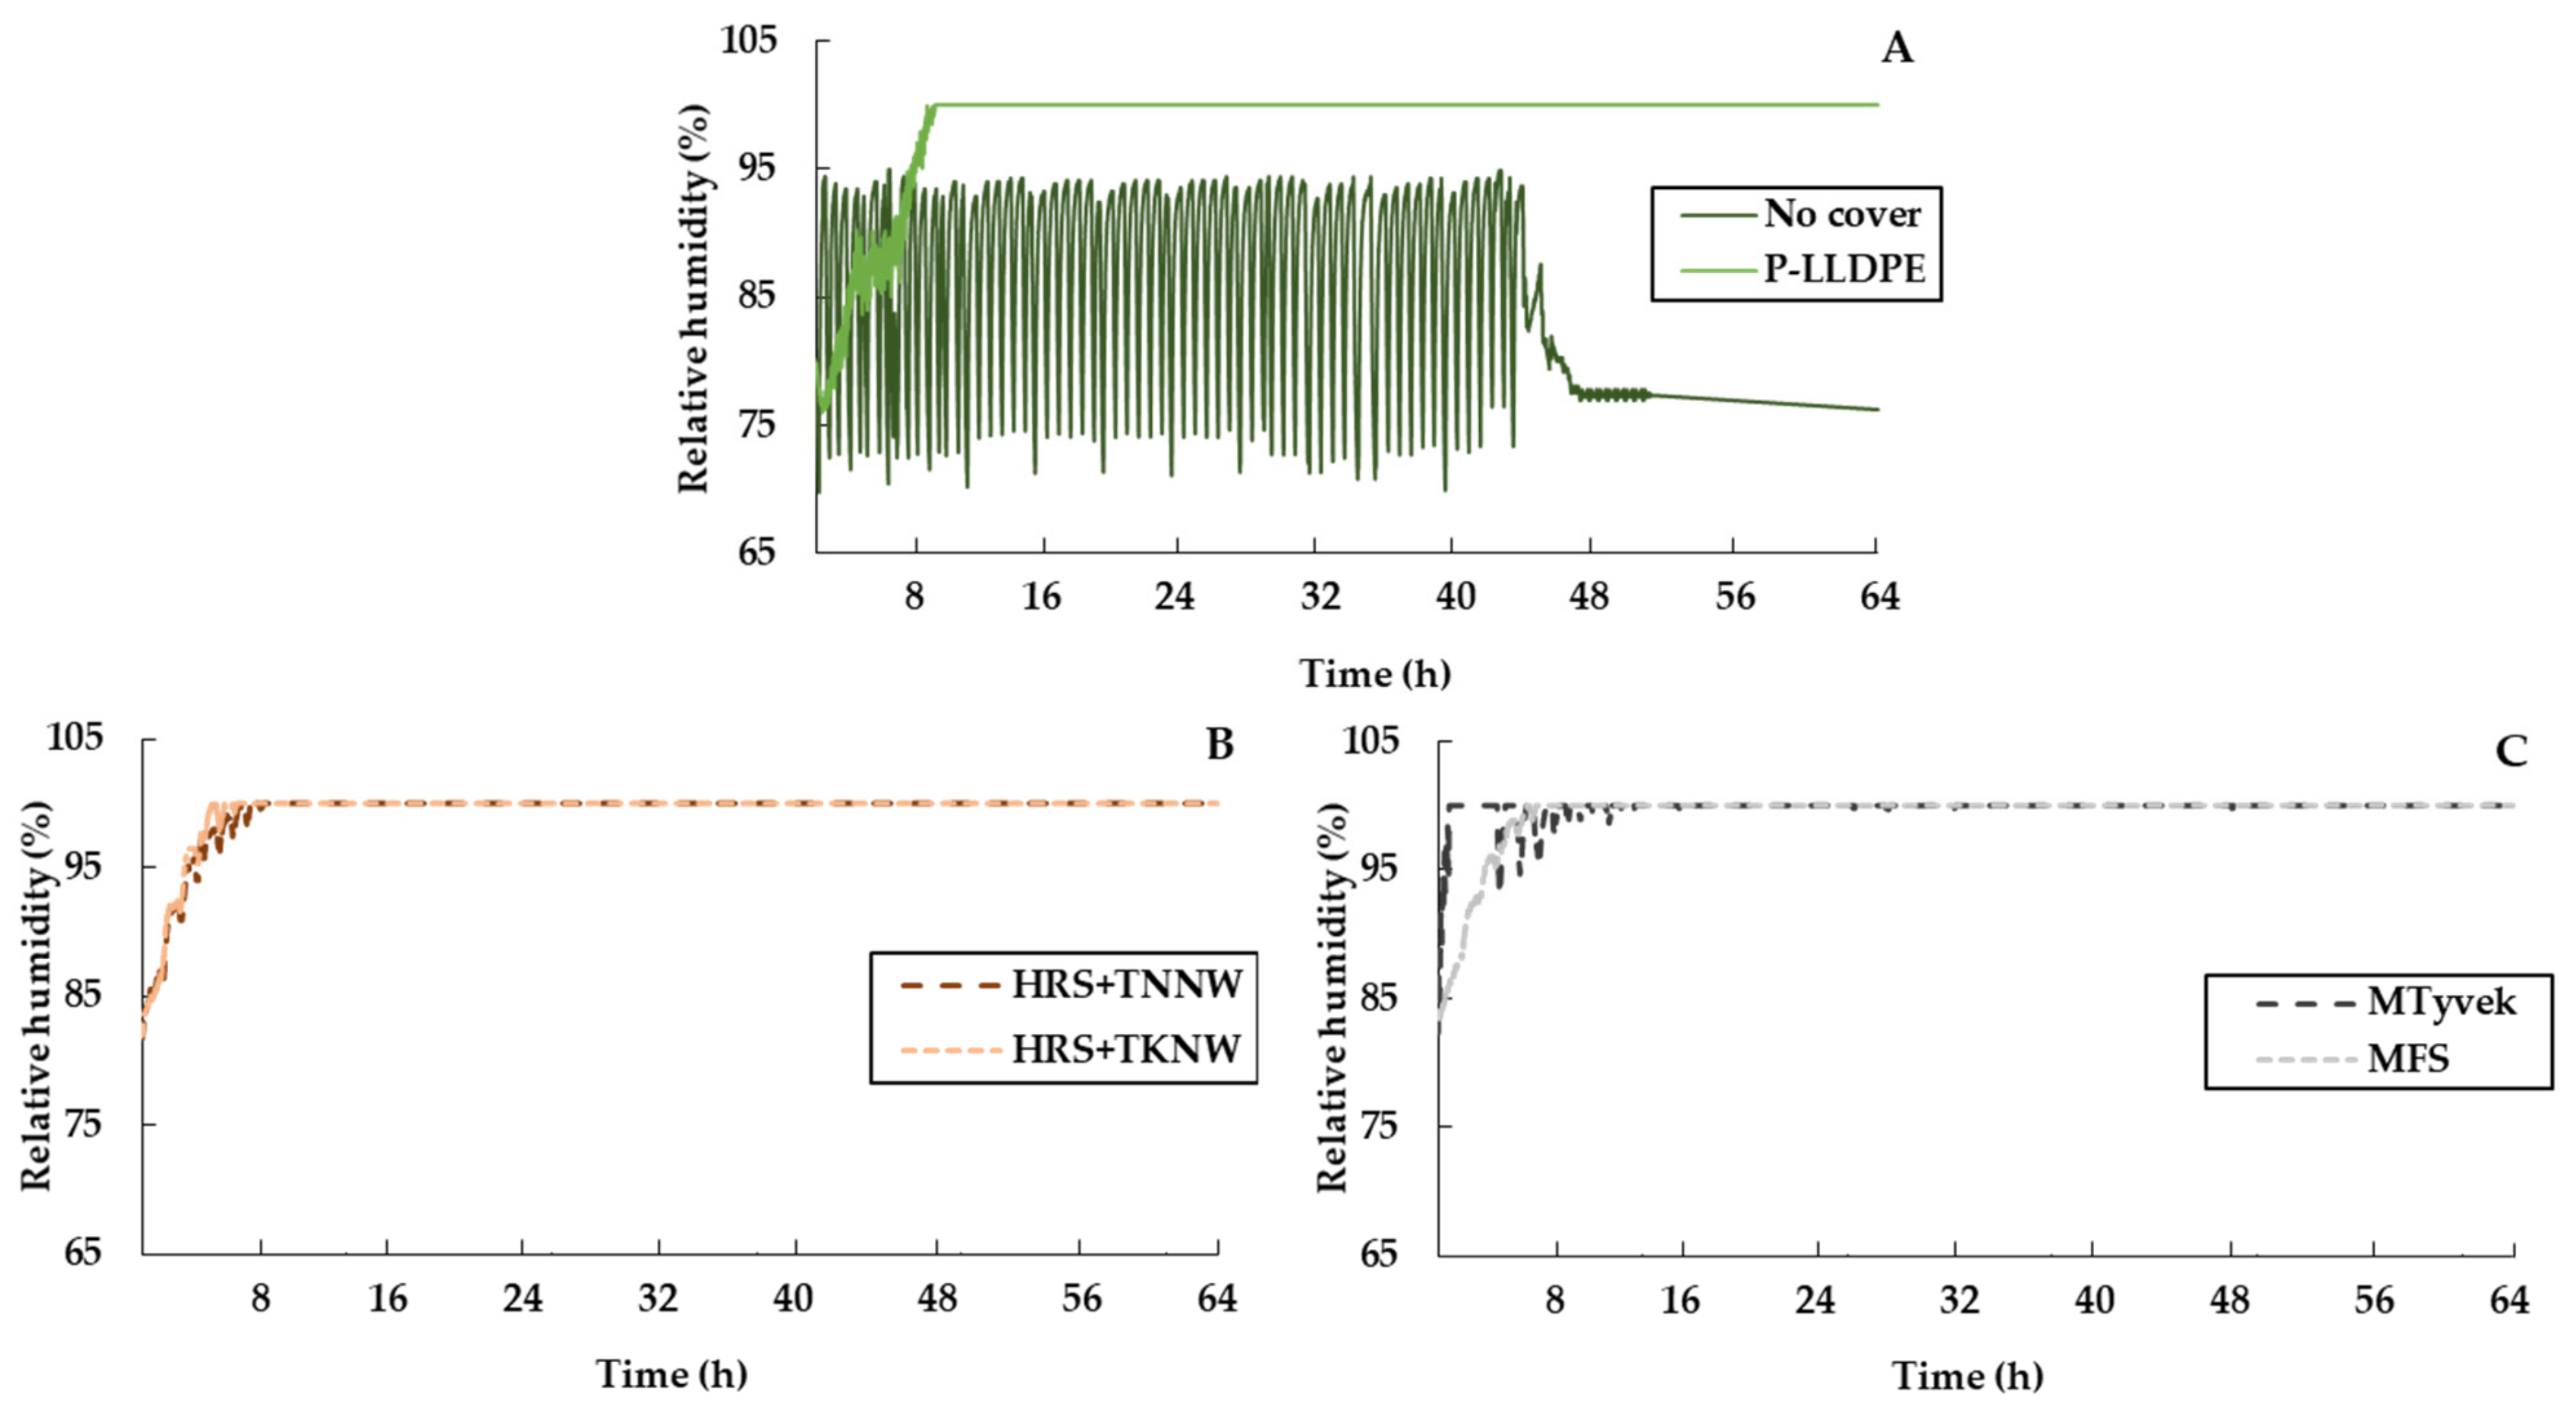
The optimal relative humidity (%RH) for storage of okra at 95 to 100% extended shelf-life by 7 to 10 days [4]. Application of thermal insulation covers reduced relative humidity fluctuation better than no cover throughout simulated storage and transportation conditions. Covering maintained RH level at 100% RH after both simulated conditions for 8 h (Figure 9). Stability of RH level under thermal insulation materials was related to low WVP of the materials. Similarly, our previous study found that thermal insulation covering prevented RH fluctuation better than no covering, resulting in the highest RH level at 100% RH [16]. In this study, MFS cover treatment provided the lowest WVP level (Table 2). It had been reported that RH level inside Tyvek® cargo cover at 50% RH (high water vapor permeability) was lower than aluminum bubble wrap with 80% RH (lower water vapor permeability) [44]. However, limited academic research has focused on the application of thermal insulation materials for maintaining relative humidity. Lim et al. [45] investigated the effect of relative humidity (RH) on the quality of ‘Niitaka’ pears using polyethylene (PE) film pallet covers to maintain high RH in commercial low temperature storage rooms. When opened, the PE pallet cover had a lower RH level (83 to 87%) than when closing PE (93 to 95% RH), while Wheeler et al. [20] discovered that RH level in clamshells packed in both covered and uncovered pallets increased to almost 100% RH within one hour of storage and remained high throughout the storage duration (6 h).

3.3. Transpiration Rate and Vital Heat from Respiration in Different Covers

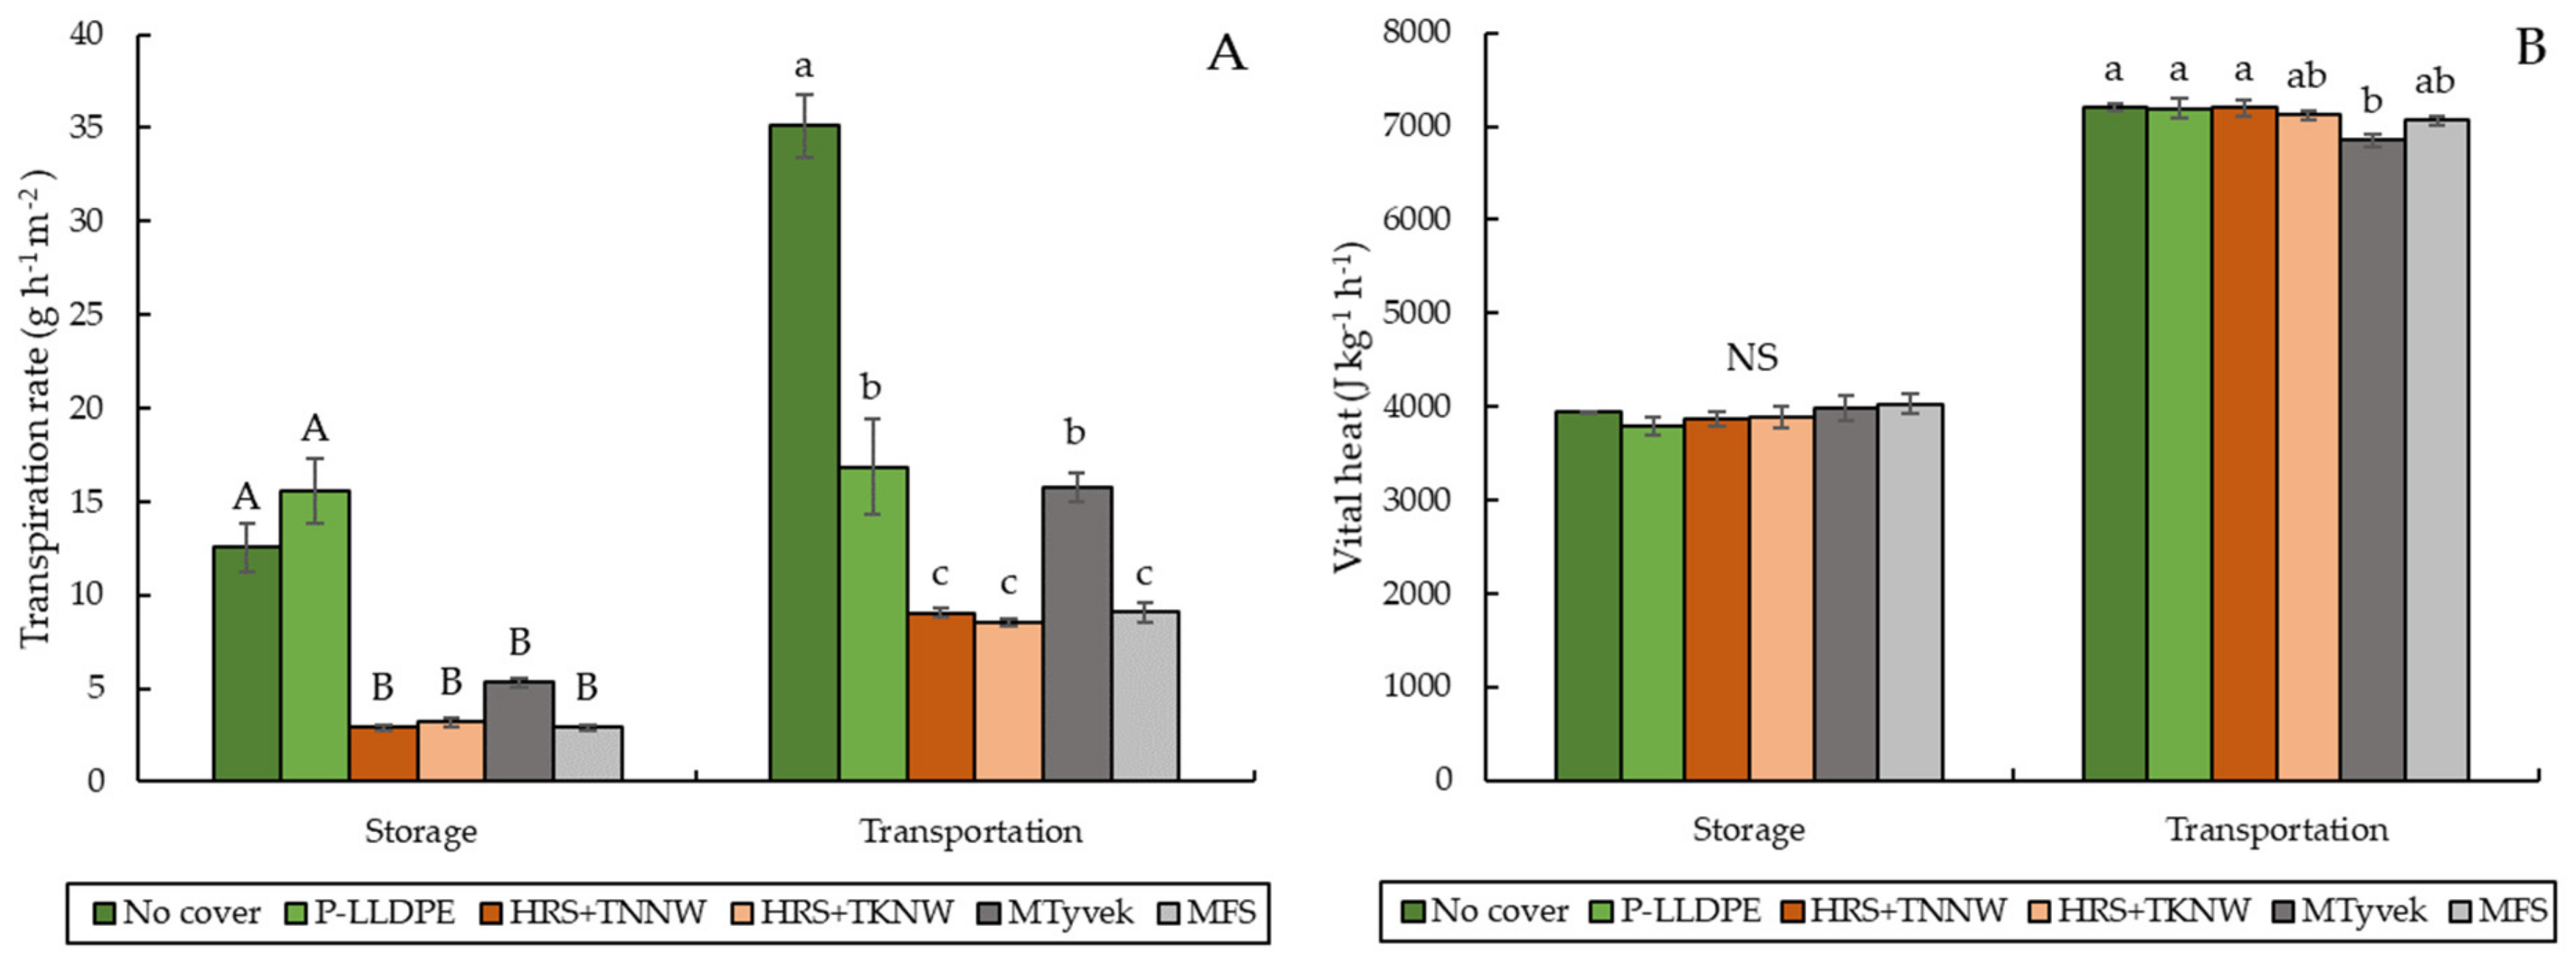
The transpiration rate and vital heat of okra under the six treatments were measured during simulated storage at 18 °C for 48 h and simulated transportation at 30 °C for 15 h. The major contribution of mass loss in pear and pomegranate was due to transpiration rather than respiration [32,46]. In this study, differences among the six treatments were observed in transpiration rate compared to vital heat under both simulated storage and transportation conditions. This implied that thermal insulation materials influenced transpiration rate (mass loss) more than vital heat from respiration rate (Figure 10). During simulated storage, no cover and P-LLDPE provided the highest transpiration rates (12.53 and 15.56 g h−1 m−2, respectively), compared to the other four cover treatments. Under increased temperature during simulated transportation, transpiration rate of all six treatments increased gradually to more than double compared to okra under simulated storage. Highest transpiration rate was found in no cover as the control (35.11 g h−1 m−2) followed by P-LLDPE (16.85 g h−1 m−2), MTyvek (15.76 g h−1 m−2), MFS (9.06 g h−1 m−2) HRS + TNNW (9.05 g h−1 m−2) and HRS + TKNW (8.53 g h−1 m−2) (Figure 10A). This indicated that increase in temperature inside the four thermal insulated cover treatments had less effect on transpiration rate compared to no cover and P-LLDPE treatments. A study on P-LLDPE cover material by Rattanakaran et al. [47] revealed that transpiration rate of okra at 25 °C was greater than at 5 °C (5.16 and 1.93 g h−1 m−2, respectively) after 48 h of testing. Lower transpiration rates in thermal insulation treatments related to their lower WVP, except for TNNW. Lowest transpiration rates of HRS and MFS materials related to the lowest WVP levels (Figure 10 and Table 2). The double layer of HRS + TNNW protected the transpiration rate of okra (Figure 10A).
During simulated storage, no significant difference in vital heat was observed among the six treatments. In this study, MTyvek (6850 J kg−1 h−1) exhibited the lowest vital heat level compared with the other five treatments during simulated transportation at 30 °C for 15 h with no difference among P-LLDPE, HRS + TNNW and MFS covers (Figure 10B). Our results confirmed previous findings of Rattanakaran et al. [16]. The vital heat of okra inside thermal insulation cover (HRS + TNNW and MFS) was lower than that inside P-LLDPE at 30 °C for 1 h, while HRS + TNNW exhibited a lower vital heat than MFS and P-LLDPE at 30 °C for 15 h as simulated transportation. In this study, the box plot of MTyvek showed the lowest mean, median and maximum pulp temperature levels during simulated transportation compared with the other treatments, except for no cover (Figure 5). The thermal image of MTyvek exhibited a blue color, similar to the no cover treatment, whereas the other thermal insulation covers showed an orange color (Figure 7) due to higher heat transfer to the environment as well as improved air ventilation in MTyvek than in the other thermal insulation covers.

3.4. Mass Loss of Okra

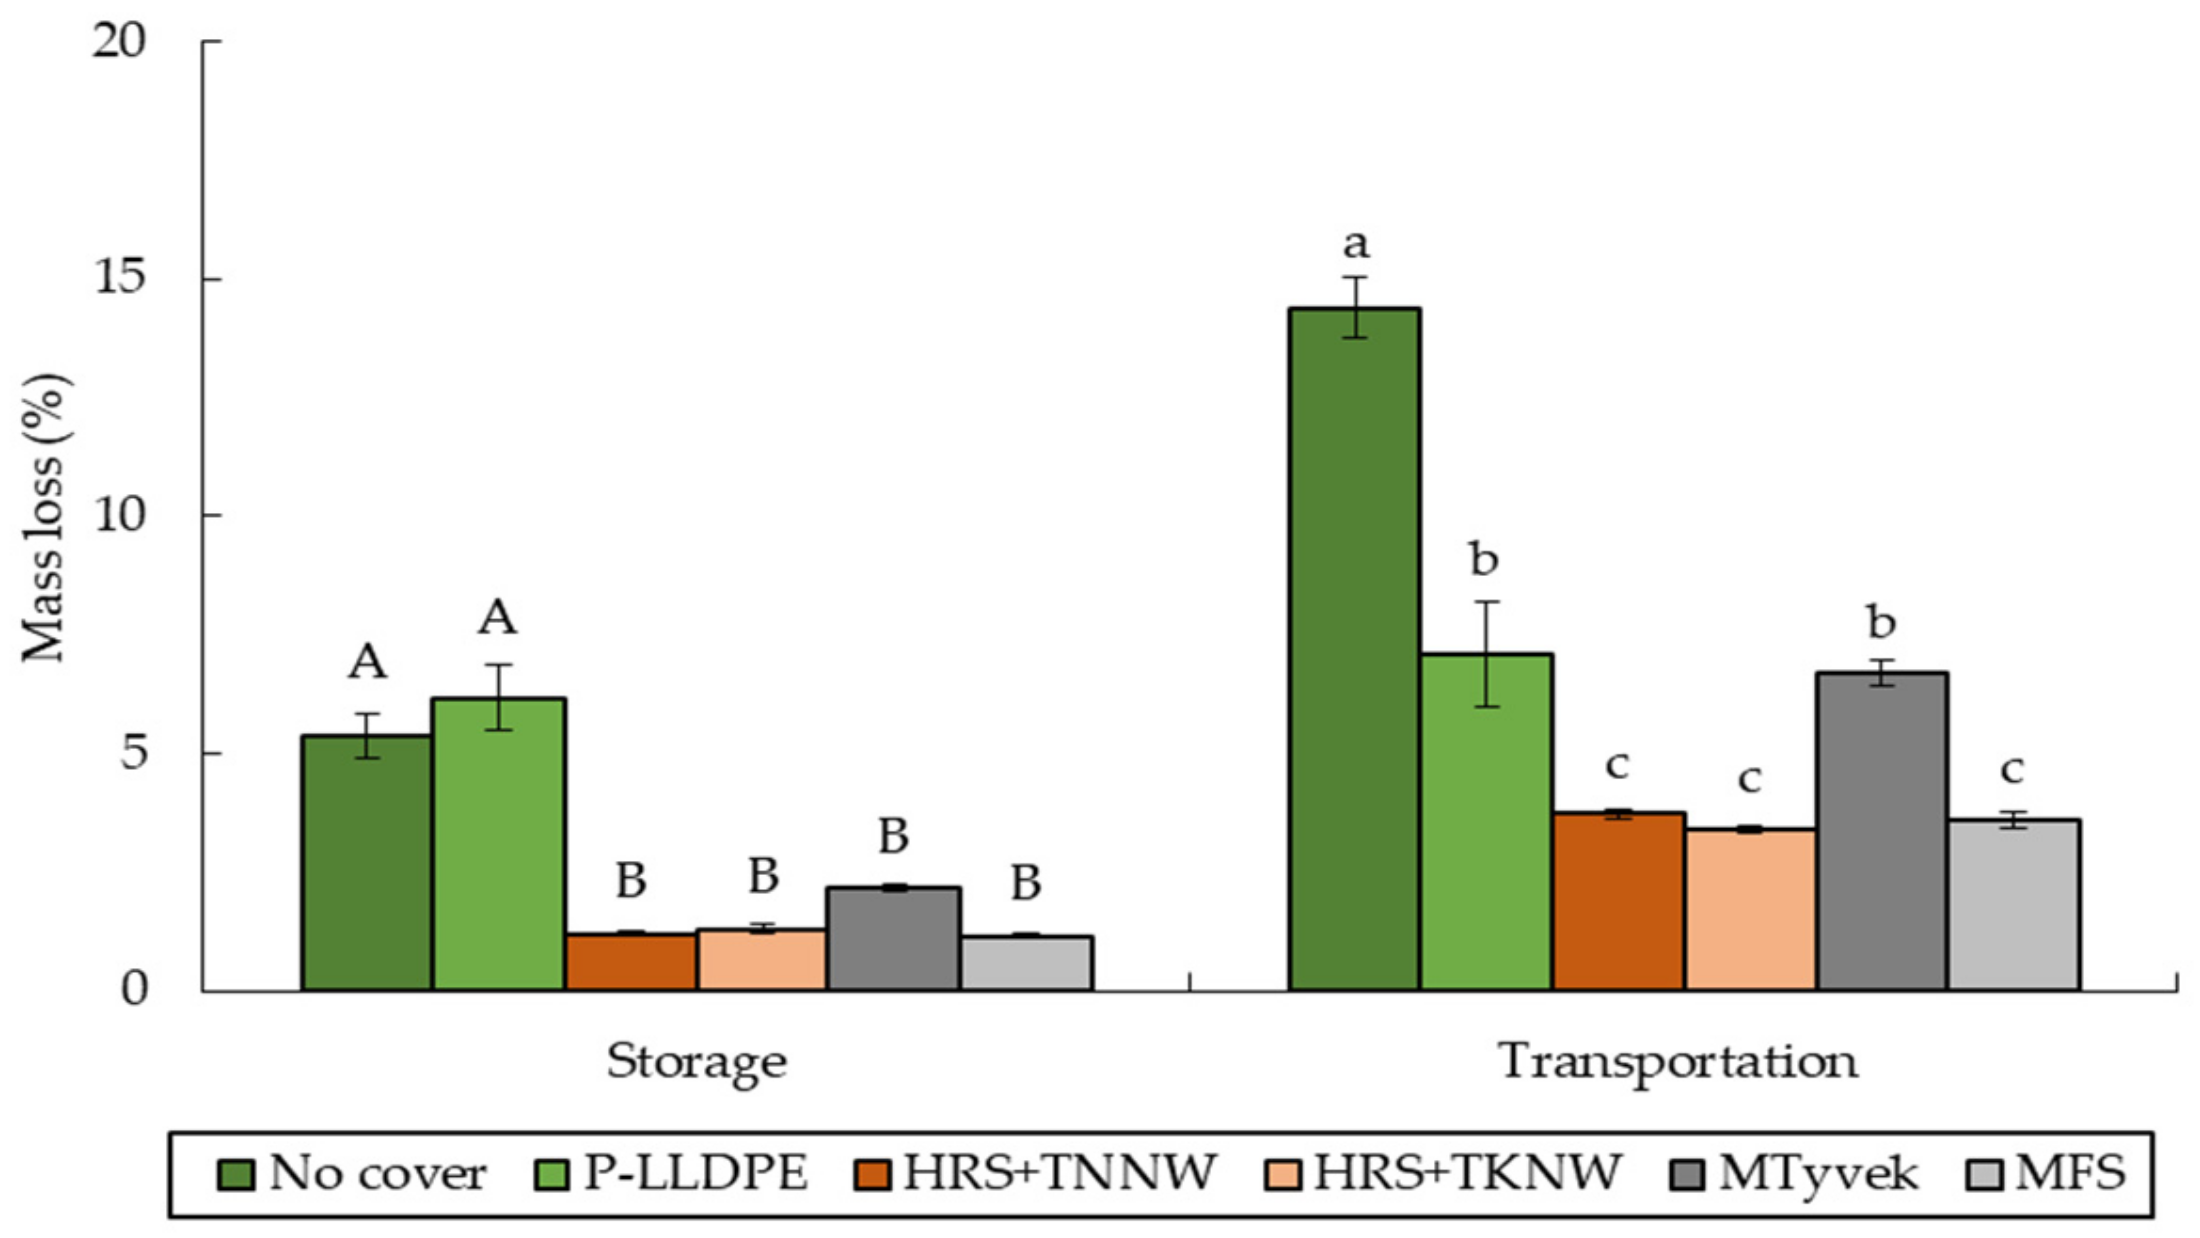
After simulated storage, okra pods in no cover and P-LLDPE treatments showed significant mass loss of fresh weight at 5–6% compared to those of the other four thermal insulation material treatments (approximately 1%). Similarly, after simulated transportation, no cover showed the highest percentage of mass loss (14.4%) followed by P-LLDPE (7.1%), MTyvek (6.6%), HRS + TNNW (3.7%), HRS + TKNW (3.4%) and MFS (3.6%). Combined HRS with nonwovens and MFS treatments gave lower mass loss than MTyvek (2%), P-LLDPE (3.5%) and no cover (11%) (Figure 11). Similarly, HRS + TNNW and MFS had the lowest mass loss of okra (<5%) compared to P-LLDPE (15%) throughout simulated storage and transportation [16]. High mass loss observed in no cover and P-LLDPE treatments corresponded to high transpiration rates (Figure 10A), high rates of air and pulp temperature changes (Table 3) and low relative humidity levels (Figure 9). Scant research has addressed how thermal insulation covers can be applied to reduce mass loss in fresh fruits and vegetables. This finding supports previous reports on thermal insulation materials that reduced mass loss in amaranth when covered with an insulated pallet cover of ReflectixTM composed of aluminum foil/0.8 cm polyethylene/bubble pack. They also found that insulated pallet cover (2%) reduced mass loss better than no cover (11%) during 6 h of display at a retail market [20].

3.5. Incidence of Decay

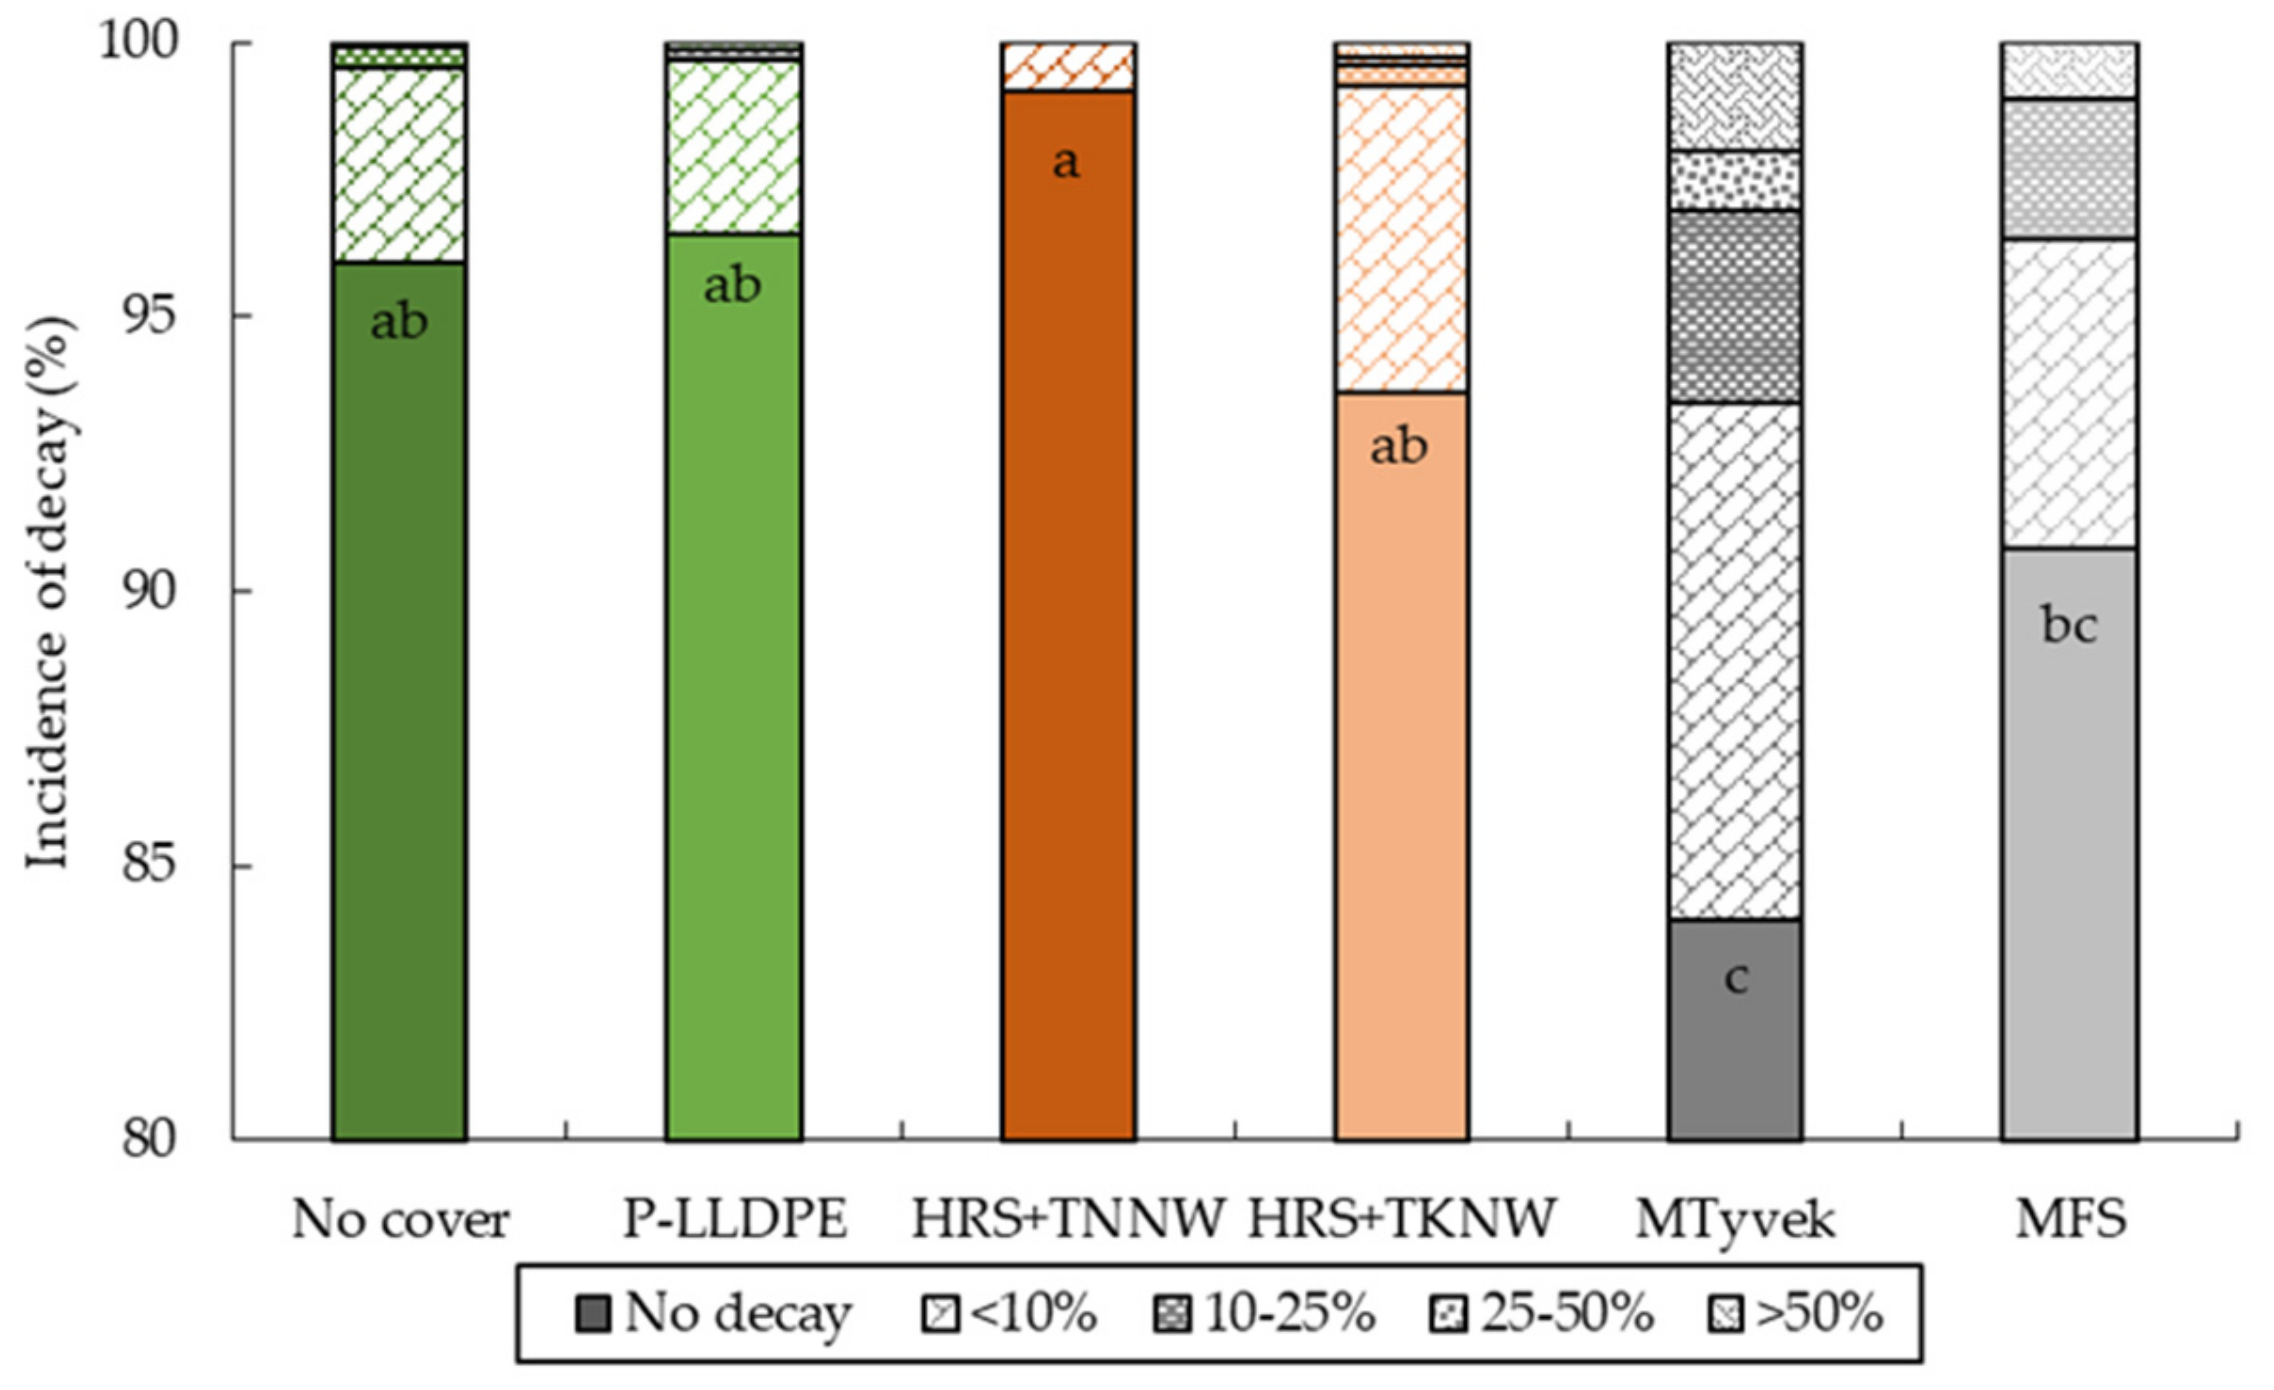
MTyvek treatment exhibited the lowest percent of no decay (84.0%) compared with MFS (90.8%), HRS + TKNW (93.6%), no cover (95.9%), P-LLDPE (96.5%) and HRS + TNNW (99.1%) (Figure 12). The HRS + TNNW treatment exhibited the best thermal insulation performance to prevent postharvest loss of okra from decay (lowest decay incidence with 0.9%) and was found better than HRS + TKNW (higher decay incidence with 6.4%) (Figure 13). There are several possible explanations for this result. Firstly, thin nonwoven (TNNW) and perforated HRS combined with partial bonding, providing air space between the two layers. The TNNW material absorbed moisture from transpiration and respiration processes. Secondly, the moisture inside the cover passed through the nonwoven (inner layer) to the air space between the layers and provided an area for collecting moisture. From our observations, after the simulated transportation, HRS + TKNW, MTyvek and MFS exhibited moisture condensation on the inner side of the cover and this yielding a higher rate of decay, compared to HRS + TNNW. Low WVP level of MTyvek and MFS (Table 2) reduced moisture vapor transfer to the outside, thus leading to high decay. Observation on decay of okra in this study was consistent with Rattanakaran et al. [16], which reported the lowest percentage of okra decay (<20%) in treatments of room cooling combined with HRS + TNNW and MFS, compared to that in P-LLDPE (50%). The results implied that room cooling for okra was important before covering, and significantly reduced okra decay. This result concurred with Emond and Germain [48] who reported that pallets covered with metalized bubble wrap had high condensation on the cases that led to rapid decay and increased mold growth in ‘Kent’ mango. From our findings, the application of thermal insulation covers was suggested for short periods of okra transportation under high temperature to reduce decay and heat accumulation. Gas treatment may reduce decay and control insects by active modified atmosphere packaging inside thermal insulation covers. In strawberry, flushing CO2 gas (10–16%) within the pallet cover was applied to reduce decay during truck transportation. Tectrol pallets treated with a partial vacuum and flushing CO2 exhibited significantly less decay (36%) compared to the noncovered control (41%) [49]. Phosphine fumigation was also applied in thermal insulation covers to control western flower thrips in chilled lettuce [40].

3.6. Pearson Correlation Analysis

In Table 4, material properties (thermal heat energy, R−value and WVP), temperature variables (rate of air and pulp temperature change at initial temperature (T1) to 25 °C and 25 °C to 30 °C, accumulated time−temperature), okra quality (transpiration rate and vital heat during simulated storage and transportation, mass loss and decay incidence) were analyzed, using Pearson correlation, to present correlation coefficient value (r). Mass loss of okra showed positive correlation with thermal heat energy (Qx) (r = 0.702) and transpiration rate (TR) during simulated storage (r = 0.898) and simulated transportation (r = 0.995), while mass loss of okra showed negative correlation with R−value (r = −0.729) and accumulated time−temperature (ATT) (r = −0.939). For the selection of thermal insulation materials, thermal heat energy (Qx) (r = 0.702) and R−value (r = −0.729) properties were considered more than WVP to reduce mass loss in okra. Decay incidence of okra was related to WVP (r = −0.682), vital heat (VH) during transportation (r = −0.744) and rate of pulp temperature change during 25 °C to 30 °C (r = −0.823). The ATT throughout the simulated supply chain showed high correlation with both transpiration rate (TR) storage (r = −0.770) and TR transportation (r = −0.922) as well as mass loss (r = 0.939). Thus, the time-temperature variable affected transpiration as well as mass loss of okra throughout the supply chain. Results indicated that minimizing mass loss in okra could be achieved by focusing on thermal heat energy (Qx) and R-value properties, which were identified as more significant factors than WVP. Minimizing decay incidence required attention on WVP, vital heat and rate of temperature change inside the covering.

3.7. Hierarchical Clustering Analysis

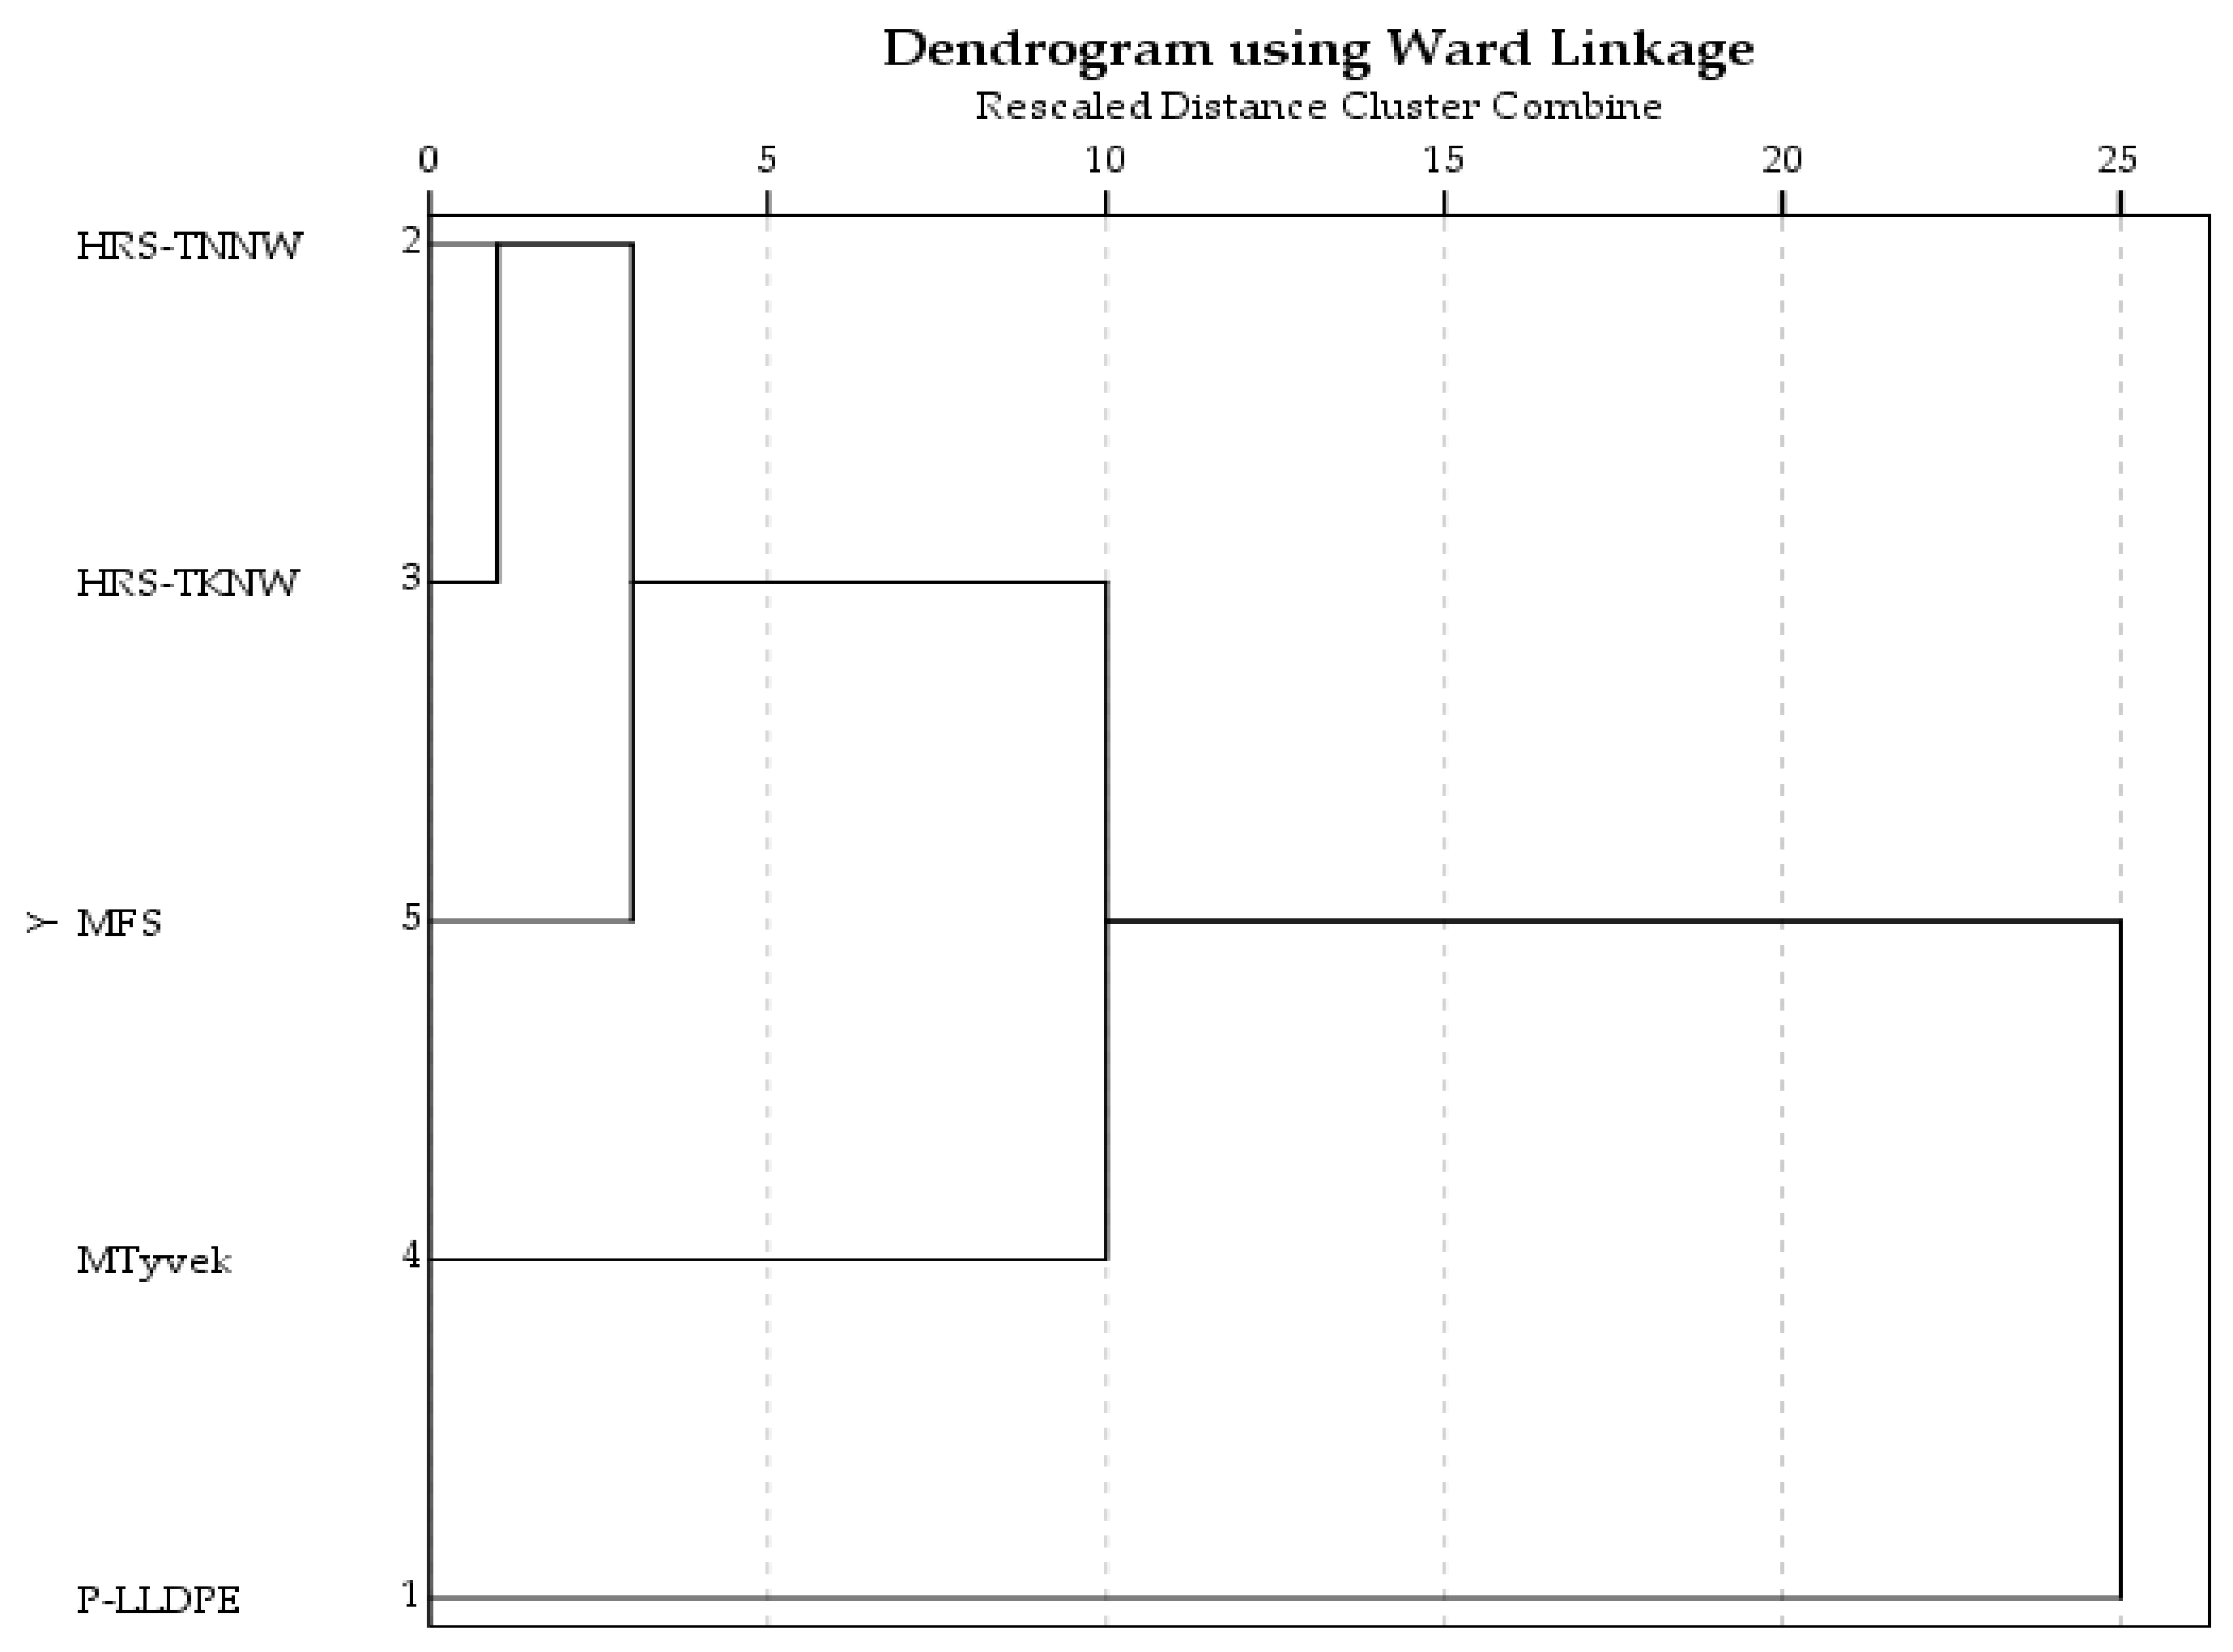
To compare the efficiency between the two thermal insulation cover prototypes and commercial covers, the overall performance of all treatment covers was analyzed by Hierarchical clustering analysis (HCA). Three main parameters; material properties (thermal heat energy, R-value and WVP), temperature variables (rate of air and pulp temperature change at the initial temperature (T1) to 25 °C and 25 °C to 30 °C and accumulated time-temperature) and okra quality (transpiration rate, vital heat during simulated storage and transportation, mass loss and decay) obtained from the five cover treatments, were analyzed as shown in Figure 14. The dendrogram identified various groups of packaging covers. The first division as in-groups consisted of HRS + TNNW and HRS + TKNW with MFS, while the second and third groups consisted of MTyvek and P-LLDPE, respectively. Both developing prototypes of thermal insulation covers (HRS + TNNW and HRS + TKNW) exhibited material properties that affected temperature fluctuation and mass loss, similar to those of the commercial MFS cover. Interestingly, these prototypes (HRS + TNNW and HRS + TKNW) exhibited greater reduction of decay (approximately 8.3%) compared to MFS, while reducing mass loss (quantitative loss) to 2% and decay (quality loss) to 15.1% compared with the commercial MTyvek cover. Dieckmann et al. [50] studied the efficiency of nonwoven fabric as a base material for temperature-controlled deliveries. They found that air-laid nonwoven feather fiber showed potential for temperature control compared with the commercially available expanded polystyrene (EPS) packaging panel. In terms of environmental aspects and packaging sustainability, combined HRS and selected nonwoven material should be developed as a thermal insulation prototype for cover application to reduce foam material (MFS), with lower postharvest loss (decay 1%) for distribution packaging.

4. Conclusions

The performance of thermal insulation covers on preserving quality of okra was evaluated. With MTyvek and MFS covers, the high moisture retention resulted in more condensation and greater decay (16.0% and 9.2%), while P-LLDPE (3.5%) and HRS + TNNW (0.9%) had lower levels than no cover (4.0%). Mass loss was significantly reduced by applying the HRS + TNNW, HRS + TKNW and MFS covers. Two thermal insulation prototypes; HRS combined with either TNNW or TKNW, showed good potential to maintain low temperature, reduce transpiration, and mass loss of okra compared to the two commercial thermal insulation materials (MTyvek and MFS) and typical plastic materials (no cover and P-LLDPE). Form results, it was suggested that thermal insulation covering for fresh okra should have material properties with low thermal heat energy (Qx), high R-value and moderate WVP value to preserve cool temperature and delay okra senescence.

Author Contributions

J.R. conducted experiments, analyzed data, interpreted results, and assisted manuscript writing. R.S. co-investigated, interpreted results, and assisted data analysis. N.A. assisted data analysis. S.P. assisted material analysis. C.P. co-investigated, supported cover materials, interpreted results in material analysis, and assisted manuscript writing. H.K. provided comments and suggestions for the final draft of the manuscript. C.F.H.B. provided comments and suggestions for the final draft of the manuscript. S.C. was the principal investigator of the research, responsible for the overall research management, interpretation of results, and manuscript writing. All authors have read and agreed to the published version of the manuscript.

Funding

This research was funded by the Thailand Graduate Institute of Science and Technology (TGIST), Grant (SCA-CO-2561-6988TH), Thailand.

Institutional Review Board Statement

Not applicable.

Informed Consent Statement

Not applicable.

Data Availability Statement

The data presented in this study are available on request corresponding author.

Acknowledgments

The authors are grateful to the Thailand Graduate Institute of Science and Technology (TGIST), the National Science and Technology Development Agency (NSTDA), and Mae Fah Luang University (MFU) for financial support and the provision of experimental sites for this research study, respectively.

Conflicts of Interest

The authors declare no conflict of interest.

References

  1. Siemonsma, J.S. West African okra—Morphological and cytogenetical indications for the existence of a natural amphidiploid of Abelmoschus esculentus (L.) Moench and A. manihot (L.) Medikus. Euphytica 1982, 31, 241–252. [Google Scholar] [CrossRef]
  2. Thai Customs. Statistic Report. 2020. Available online: http://www.customs.go.th/statistic_report.php?lang=en&tariff_code=07099990003 (accessed on 12 February 2021).
  3. Tsado, E.K. Quality of postharvest handling of marketable okra fruits sold in Minna, Niger State, Nigeria. Eur. J. Agric. For. Res. 2015, 3, 33–45. [Google Scholar]
  4. Perkins-Veazie, P. Commodity summaries: Okra. In The Commercial Storage of Fruits, Vegetables and Florist and Nursery Stocks; Gross, K.C., Wang, C.Y., Saltveit, M., Eds.; United States Department of Agriculture (USDA): Washington, DC, USA, 2016; pp. 430–432. [Google Scholar]
  5. Finger, F.L.; Della-Justina, M.E.; Casali, V.W.D.; Puiatti, M. Temperature and modified atmosphere affect the quality of okra. Sci. Agric. 2008, 65, 360–364. [Google Scholar] [CrossRef] [Green Version]
  6. Babarinde, G.O.; Fabunmi, O.A. Effects of packaging materials and storage temperature on quality of fresh okra (Abelmoschus esculentus) fruit. Agric. Trop. Subtrop. 2009, 42, 151–156. [Google Scholar]
  7. Cheng, Z.; Gong, X.; Jing, W.; Peng, Z.; Li, J. Quality change of postharvest okra at different storage temperatures. J. Food Eng. Technol. 2018, 7, 43. [Google Scholar]
  8. Huang, S.; Li, T.; Jiang, G.; Xie, W.; Chang, S.; Jiang, Y.; Duan, X. 1-Methylcyclopropene reduces chilling injury of harvested okra (Hibiscus esculentus L.) pods. Sci. Hortic. 2012, 141, 42–46. [Google Scholar] [CrossRef]
  9. Greis, N.P. Management the “Cool Chain” A Cold Chain is Only as Cool as Its Warmest Link. Available online: https://www.asiacoldchainshow.com/uploads/Managing%20the%20Cool%20Chain.pdf (accessed on 21 February 2021).
  10. Mercier, S.; Villeneuve, S.; Mondor, M.; Uysal, I. Time-temperature management along the food cold chain: A review of recent developments. Compr. Rev. Food Sci. Food Saf. 2017, 16, 647–667. [Google Scholar] [CrossRef]
  11. Sargent, S.A.; Fox, A.J.; Coelho, E.C.M.; Locascio, S.J. Comparison of cooling and packaging methods to extend the postharvest life of okra. Proceeding Fla. State Hortic. Soc. 1996, 109, 285–290. [Google Scholar]
  12. Rai, D.R.; Balasubramanian, S. Qualitative and textural changes in fresh okra pods (Hibiscus esculentus L.) under modified atmosphere packaging in perforated film packages. Food Sci. Technol. Int. 2009, 15, 131–138. [Google Scholar] [CrossRef]
  13. Liu, J.; Yuan, Y.; Wu, Q.; Zhao, Y.; Jiang, Y.; John, A.; Yang, B. Analyses of quality and metabolites levels of okra during postharvest senescence by 1H-high resolution NMR. Postharvest Biol. Technol. 2017, 132, 171–178. [Google Scholar] [CrossRef]
  14. FAO. Good Practice in the Design Management and Operation of a Fresh Produce Packing-House; FAO Region Office for Asia and the Pacific: Bangkok, Thailand, 2012; pp. 44–47. [Google Scholar]
  15. Dhall, R.K.; Sharma, S.R.; Mahajan, B.V.C. Development of post-harvest protocol of okra for export marketing. J. Food Sci. Technol. 2014, 51, 1622–1625. [Google Scholar] [CrossRef]
  16. Rattanakaran, J.; Saengrayap, R.; Prahsarn, C.; Kitazawa, H.; Chaiwong, S. Application of room cooling and thermal insulation materials to maintain quality of okra during storage and transportation. Horticulturae 2021, 7, 188. [Google Scholar] [CrossRef]
  17. Burgess, G. Practical thermal resistance and ice requirement calculations for insulating packages. Packag. Technol. Sci. 1999, 12, 75–80. [Google Scholar] [CrossRef] [Green Version]
  18. Singh, S.P.; Burgess, G.; Singh, J. Performance comparison of thermal insulated packaging boxes, bags and refrigerants for single-parcel shipments. Packag. Technol. Sci. 2008, 21, 25–35. [Google Scholar] [CrossRef] [Green Version]
  19. Wang, G.; Zhao, J.; Wang, G.; Mark, L.H.; Park, C.B.; Zhao, G. Low-density and structure-tunable microcellular PMMA foams with improved thermal-insulation and compressive mechanical properties. Eur. Polym. J. 2017, 95, 382–393. [Google Scholar] [CrossRef]
  20. Wheeler, L.; Kitinoja, L.; Barrett, D. Use of insulated covers over product crates to reduce losses in amaranth during shipping delays. Agriculture 2015, 5, 1204–1223. [Google Scholar] [CrossRef] [Green Version]
  21. Sharp, A.K.; Irving, A.R. Insulating covers for pallets of food. In Proceedings of the I.I.F.-I.I.R. Commission D2, Prague, Czech Republic, 30 March–3 April 1981; pp. 139–148. [Google Scholar]
  22. Melis, R.B. New Techniques and Methods for Cold Chain Monitoring and Tracking in Perishable Products. Ph.D. Thesis, Universidad Politécnica de Madrid, Madrid, Spain, 2016. [Google Scholar]
  23. Chaiwong, S.; Bishop, C.F.H. Use of an insulated bag from the supermarket to maintain ‘Elsanta’ strawberry temperature to households. Acta Hortic. 2015, 1079, 187–192. [Google Scholar] [CrossRef]
  24. Kitinoja, L. Use of Cold Chains for Reducing Food Losses in Developing Countries. Available online: http://www.postharvest.org/Cold_chains_PEF_White_Paper_13_03.pdf (accessed on 10 June 2020).
  25. Harvey, B.V. Mild Chilling Injury of Banana (Cavendish cv. Williams) and Its Control in The Field. Ph.D. Thesis, The University of Adelaide, Adelaide, Australia, 2005. [Google Scholar]
  26. ASTM. Standard Test Methods for Water Vapor Transmission of Materials; E96-E95; ASTM International: West Conshohocken, PA, USA, 1995; pp. 785–792. [Google Scholar]
  27. ASTM. Standard Test Method for Air Permeability of Textile Fabrics; D737-96; ASTM International: West Conshohocken, PA, USA, 1996; pp. 230–234. [Google Scholar]
  28. Saltviet, M.E. Measuring Respiration. Available online: http://ucce.ucdavis.edu/files/datastore/234-20.pdf (accessed on 10 June 2020).
  29. Postharvest Research Laboratory. Laboratory manual for horticulture postharvest technology. In Training Programe, 9th Horticulture Postharvest Technology; Postharvest Research Laboratory, Kasetsart University: Nakhon Pathom, Thailand, 2004; pp. 24–27. [Google Scholar]
  30. Kader, A.A.; Saltveit, M.E. Respiration and gas exchange. In Postharvest Physiology and Pathology of Vegetables, 2nd ed.; Bartz, J.A., Brecht, J.K., Eds.; Marcel Dekker Inc.: New York, NY, USA, 2003; pp. 7–29. [Google Scholar]
  31. Patel, B.B.; Roy, F.S.; Saiyad, M.J.S.; Joshi, D.C. Respiration behaviour and heat of respiration of mango (cv. Langdo) under different storage conditions. Int. J. Agric. Environ. Biotechnol. 2016, 9, 855–859. [Google Scholar] [CrossRef]
  32. Lufu, R.; Ambaw, A.; Opara, U.L. The contribution of transpiration and respiration processes in the mass loss of pomegranate fruit (cv. Wonderful). Postharvest Biol. Technol. 2019, 157, 110982. [Google Scholar] [CrossRef]
  33. Iweka, C.; Uguru, H. Environmental factors on the physical characteristics and physiological maturity of okra (Abelmoschus esculentus, cv. Kirikou) pods and seeds. Direct Res. J. Agric. Food Sci. 2019, 7, 99–109. [Google Scholar]
  34. Ngure, J.W.; Aguyoh, J.N.; Gaoquiong, L. Interactive effects of packaging and storage temperatures on the shelf-life of okra. ARPN J. Agric. Biol. Sci. 2009, 4, 43–52. [Google Scholar]
  35. Harding, K.G. Heat Transfer Introduction; University of the Witwatersrand: Johannesburg, South Africa, 2018; pp. 1–62. [Google Scholar]
  36. Mangaraj, S.; Goswami, T.K.; Panda, D.K. Modeling of gas transmission properties of polymeric films used for MA packaging of fruits. J. Food Sci. Technol. 2015, 52, 5456–5469. [Google Scholar] [CrossRef] [Green Version]
  37. Manikantan, M.R.; Varadharaju, N. Preparation and properties of linear low density polyethylene based nanocomposite films for food packaging. Indian J. Eng. Mater. Sci. 2012, 19, 54–66. [Google Scholar]
  38. Dutta, A. Redesigning the Coffee Laminate from Aluminum Foil Based Laminate to metalized Polyethylene Terephthalate Laminate: A Comparative Study. Ph.D. Thesis, Asian Institute of Technology, Bangkok, Thailand, 2015. [Google Scholar]
  39. Dupont™, Tyvek® Cargo Covers: The Science behind the Covers. Available online: http://www.dupont.com/products-and-services/fabrics-fibersnonwovens/covers/articles/air-cargo-covers-science-behind.html (accessed on 10 November 2020).
  40. Liu, Y.B. Low-temperature phosphine fumigation of chilled lettuce under insulated cover for postharvest control of western flower thrips, Frankliniella occidentalis (Pergande) (Thysanoptera: Thripidae). J. Asia Pac. Entomol. 2011, 14, 323–325. [Google Scholar] [CrossRef]
  41. Gowen, A.A.; Tiwari, B.K.; Cullen, P.J.; McDonnell, K.; O’Donnell, C.P. Applications of thermal imaging in food quality and safety assessment. Trends Food Sci. Technol. 2010, 21, 190–200. [Google Scholar] [CrossRef]
  42. Bycroft, B.L.; Brash, D.W.; Bollen, F. Using insulation and cooling to improve the asparagus cool chain. Acta Hortic. 1996, 415, 323–332. [Google Scholar] [CrossRef]
  43. Li, Y.; Schrade, J.P.; Su, H.; Specchio, J.J. Transportation of perishable and refrigerated foods in Mylar foil bags and insulated containers: A time-temperature study. J. Food Prot. 2014, 77, 1317–1324. [Google Scholar] [CrossRef]
  44. Dupont™, Tyvek® Air Cargo Covers Offer Ideal Protection for Your Perishable and Temperature-Sensitive Shipments. Available online: https://www.r-bag.hu/upload/files/DP-Tyvek-Air-cargo-cover-Brochure-K24389-2013.pdf (accessed on 11 June 2021).
  45. Lim, B.S.; Lim, C.I.; Gross, K.C. High relative humidity under pallet coverage maintained ‘Niitaka’pear fruit (Pyrus pyrifolia Nakai) quality during low temperature storage. Korean J. Hortic. Sci. Technol. 2005, 23, 135–139. [Google Scholar]
  46. Xanthopoulos, G.T.; Templalexis, C.G.; Aleiferis, N.P.; Lentzou, D.I. The contribution of transpiration and respiration in water loss of perishable agricultural products: The case of pears. Biosyst. Eng. 2017, 158, 76–85. [Google Scholar] [CrossRef]
  47. Rattanakaran, J.; Saengrayap, R.; Prahsarn, C.; Chaiwong, S. Model development and validation for mass loss attributes of okra under dynamic conditions. In Proceedings of the International Conference on Food and Applied Bioscience 2020, Chiang Mai, Thailand, 6–7 February 2020; pp. 134–139. [Google Scholar]
  48. Emond, P.J.; Germain, M. Report: Study of Thermal Protection for Mango Pallets during Mixed Load Shipment, National Mango Board. Available online: https://www.mango.org/wp-content/uploads/2018/03/Thermal_Protection_for_Mango_Pallets_Eng-1.pdf (accessed on 9 May 2021).
  49. Macnish, A.J.; Padda, M.S.; Pupin, F.; Tsouvaltzis, P.I.; Deltsidis, A.I.; Sims, C.A.; Brecht, J.K.; Mitcham, E.J. Comparison of pallet cover systems to maintain strawberry fruit quality during transport. HortTechnology 2012, 22, 493–501. [Google Scholar] [CrossRef] [Green Version]
  50. Dieckmann, E.; Nagy, B.; Yiakoumetti, K.; Sheldrick, L.; Cheeseman, C. Thermal insulation packaging for cold-chain deliveries made from feathers. Food Packag. Shelf Life 2019, 21, 100360. [Google Scholar] [CrossRef]
Figure 1. Five insulation materials as treatments.
Horticulturae 07 00392 g001
Figure 2. Function design of the combination between HRS and NW materials.
Horticulturae 07 00392 g002
Figure 3. Determination of respiration rate and vital heat.
Horticulturae 07 00392 g003
Figure 4. Geometry of an okra pod shape.
Horticulturae 07 00392 g004
Figure 5. Boxplot of air (A) and pulp (B) temperature profiles during simulated storage at 18 °C for 12 h. Air (C) and pulp (D) temperature profiles during simulated transportation at 30 °C for 12 h. The lower and upper quartiles are represented by boxes. The horizontal line represents the median temperature in each box while the mean temperature is indicated by (◊). Minimum and maximum temperatures are presented by vertical lines extending above and below each box.
Horticulturae 07 00392 g005
Figure 6. Heatmap chart of air (A) and pulp (B) temperature profiles during simulated storage at 18 °C for 12 h. Air (C) and pulp (D) temperature profiles during simulated transportation at 30 °C for 12 h.
Horticulturae 07 00392 g006aHorticulturae 07 00392 g006b
Figure 7. Thermal imaging among the six treatments represented pulp temperature after finishing simulated transportation at 30 °C for 15 h (removal covering). Purple and orange color zones represent cool and warm temperature gradients, respectively.
Horticulturae 07 00392 g007
Figure 8. Accumulated time-temperature (ATT) (°C h) among the six treatments after simulated storage at 18 °C for 48 h and simulated transportation at 30 °C for 15 h. Different letters indicate significant differences at p < 0.05. Values are mean ± S.E. from four replicates.
Horticulturae 07 00392 g008
Figure 9. Relative humidity (% RH) profiles among the six treatments of no cover and P-LLDPE (A), HRS + TNNW and HRS + TKNW (B) and MTyvek and MFS (C) after simulated storage at 18 °C for 48 h and simulated transportation at 30 °C for 15 h.
Horticulturae 07 00392 g009
Figure 10. Transpiration rate (A) and vital heat (B) among the six treatments during simulated storage at 18 °C for 48 h and simulated transportation at 30 °C for 15 h. Different letters indicate significant differences at p < 0.05. Values are mean ± S.E. from five replicates.
Horticulturae 07 00392 g010
Figure 11. Mass loss (%) among the six treatments after simulated storage at 18 °C for 48 h and simulated transportation at 30 °C for 15 h. For Tukey’s HSD post hoc test, different letters in each simulation test indicate significant differences at p < 0.05. Values are mean ±S.E. from five replicates.
Horticulturae 07 00392 g011
Figure 12. The percentage of decay incidence in six treatments after simulated storage at 18 °C for 48 h and simulated transportation at 30 °C for 15 h. No decay shown by different letters in each treatment indicates significant differences at p < 0.05 for Tukey’s HSD post hoc test. Values are mean ± S.E. from five replicates.
Horticulturae 07 00392 g012
Figure 13. Okra from six treatments after simulated storage at 18 °C for 48 h and simulated transportation at 30 °C for 15 h.
Horticulturae 07 00392 g013
Figure 14. Hierarchical cluster analysis based on material properties, transpiration rate, vital heat, air and pulp temperatures and okra quality. Ward’s method for dissimilarity was utilized during agglomerative hierarchical clustering.
Horticulturae 07 00392 g014
Table 1. Okra respiration rate in a closed system after three storage conditions at (10, 20 and 30 °C) for 2 and 3 days.
Temperature (°C)Rc (mg CO2 kg1 h1)Q10
Day 2Day 3Day 2Day 3
10183.33195.26
1.401.51
20245.11276.68
1.371.46
30333.15399.05
Table 2. The properties of six covering materials (thickness, thermal heat energy, WVP, R-value and air permeability).
MaterialThickness (mm)Thermal Heat Energy
(Qx × 10−4) (J s−1)
R-Value
(m2 °C W1)
Water Vapor Permeability
(g h−1 m−2)
Air Permeability
(L m−2 s−1)
P-LLDPE0.131 ± 0.20 e3.750 ± 0.07 a0.161 ± 0.00 d0.360 ± 0.03 a172.801 ± 5.85 b
TNNW0.282 ± 0.10 d3.255 ± 0.04 b0.181 ± 0.00 c0.373 ± 0.11 a917.000 ± 64.27 a
TKNW0.478 ± 0.28 c3.148 ± 0.00 b0.194 ± 0.00 c0.0083 ± 0.00 b168.623 ± 21.70 b
HRS1.445 ± 0.02 b2.368 ± 0.15 c0.214 ± 0.01 b0.000002 ± 0.00 d0.543 ± 0.07 d
MTyvek0.127 ± 0.03 e2.947 ± 0.02 bc0.208 ± 0.00 b0.00057 ± 0.00 c0.497 ± 0.03 d
MFS3.109 ± 0.01 a1.440 ± 0.06 d0.223 ± 0.01 a0.000008 ± 0.00 d45.503 ± 4.20 c
Note: Different letters indicate significant differences at p < 0.05. Values are mean ± S.E. from six replicates.
Table 3. Rates of air and pulp temperature change in six treatments under 15 h of simulated transportation at 30 °C.
TreatmentRate of Temperature Change(°C h−1)
Air TemperaturePulp Temperature
T1 to 25 °C25 °C to 30 °CT1 to 25 °C25 °C to 30 °C
No cover18.94 ± 1.20 a14.05 ± 2.48 a5.38 ± 0.04 a3.27 ± 0.28 a***
P-LLDPE16.11 ± 1.19 ab4.70 ± 0.44 b4.21 ± 0.24 b2.72 ± 0.15 ab
HRS + TNNW13.35 ± 1.94 bc2.66 ± 0.63 b3.36 ± 0.04 c2.50 ± 0.23 ab
HRS + TKNW11.41 ± 0.14 bc2.17 ± 0.38 b3.02 ± 0.23 cd2.33 ± 0.09 b
MTyvek11.15 ± 1.02 bc1.46 ± 0.30 b2.72 ± 0.05 d1.27 ± 0.13 c
MFS9.26 ± 0.65 c2.17 ± 0.51 b2.91 ± 0.06 cd1.92 ± 0.14 bc
Note: Different letters indicate significant differences at p < 0.05. Values are mean ± S.E. from three (air temperature) and four (pulp temperature) replicates. *** It is noted that no cover treatment was estimated temperature at 28 °C due to the maximum pulp temperature level at air temperature at 30 °C.
Table 4. Pearson correlation analysis evaluating by material properties, transpiration rate, vital heat, air and pulp temperatures and okra quality.
QxWVPR ValueTR_
Storage
TR_
Transport
VH_
Storage
VH_
Transport
RoP
T1to25
RoP
T25to30
RoA
T1to25
RoA
T25to30
ATTMLDecay
Qx1.000
WVP0.674 **1.000
R_value−0.925 **−0.791 **1.000
TR_
storage
0.743 **0.723 **−0.874 **1.000
TR_
transport
0.679 **0.549 *−0.720 **0.911 **1.000
VH_
storage
−0.361−0.4070.408−0.283−0.1751.000
VH_
transport
0.2050.406−0.4410.203−0.089−0.1021.000
RoP
T1to25
0.659 **0.849 **−0.851 **0.819 **0.625 *−0.2780.578 *1.000
RoP
T25to30
0.2870.519 *−0.5030.340−0.046−0.2140.781 **0.651 **1.000
RoA
T1to25
0.743 **0.745 **−0.816 **0.692 **0.543 *−0.524 *0.3430.647 **0.3641.000
RoA
T25to30
0.514 *0.695 **−0.760 **0.712 **0.518 *−0.4020.721 **0.854 **0.624 *0.635 *1.000
ATT−0.655 **−0.3100.605 *−0.770 **−0.922 **0.1040.284−0.4140.210−0.416−0.2941.000
ML0.702 **0.537 *−0.729 **0.898 **0.995 **−0.164−0.0880.633 *−0.0520.532 *0.506−0.939 **1.000
Decay−0.271−0.682 **0.449−0.2160.1280.289−0.744 **−0.622 *−0.823 **−0.488−0.525 *−0.3650.1321.000
Note: Rate of pulp temperature changes (RoP); rate of air temperature changes (RoA); water vapor permeability (WVP); transpiration rate (TR); thermal heat energy (Qx); vital heat (VH); accumulated time-temperature (ATT); mass loss (ML). ** Correlation is significant at the 0.01 level (2-tailed). *Correlation is significant at the 0.05 level (2-tailed).
Publisher’s Note: MDPI stays neutral with regard to jurisdictional claims in published maps and institutional affiliations.