Article

Effects of Interval Flooding Stress on Physiological Characteristics of Apple Leaves

1
College of Horticulture, Hebei Agriculture University, Baoding 071000, China
2
College of Electrical and Mechanical Engineering, Hebei Agricultural University, Baoding 071000, China
3
College of Landscape and Tourism, Hebei Agriculture University, Baoding 071000, China
*
Authors to whom correspondence should be addressed.
The author contributed equally to this work.
Horticulturae 2021, 7(10), 331; https://doi.org/10.3390/horticulturae7100331
Submission received: 10 August 2021 / Revised: 12 September 2021 / Accepted: 17 September 2021 / Published: 22 September 2021

Abstract

:
As a result of the continuous global warming in recent years, the average annual number of rain days in China has been on the decline, while the number of rainstorm days has gradually increased. These conditions make it extremely easy to form a waterlogging environment, which has an adverse impact on plant growth and development. In many apple-producing areas in China, apples are subject to severe flooding during planting. In this study, two-year-old apple rootstock M9T337 was used to explore the effects of interval water stress on the morphological and physiological parameters of apple leaves. The purpose was to determine the plant’s adaptability to waterlogged environments and provide theoretical reference for management and maintenance after waterlogging. The results showed that the effect on flooded (T2) on apple stock was greater than that of waterlogged (T1), Short-term (7 d) waterlogging (T1) did not affect the growth of seedlings but was conducive to the accumulation of dry matter. Furthermore, the initial stress was be imprinted on the plants, which could directly affect their response to later stress. The results of principal component analysis (PCA) revealed that PC1, PC2, and PC3 explained 26.92%, 17.46%, and 13.03% of the physiological changes under water stress, respectively. By calculating the weight of each indicator, we concluded that high-frequency resistance r, relative chlorophyll content (SPAD) and maximum photochemical efficiency Fv/Fm are important parameters for apple rootstocks affected by water stress.

1. Introduction

Apple (Malus pumila) is one of the most important fruit tree species in China and has gradually become the pillar of China’s agriculture. In 2017, apple area and output accounted for 18% and 16.7% of total fruit area and total output, respectively; in 2018, apple area and output accounted for 16.3% and 15.3% of total fruit area, respectively [1]. The development of the apple industry is of great significance to improve farmers’ income and integrate agricultural resources [2]. In the process of apple growth and development, water is a major factor [3]. Water stress can affect the growth of roots, the change in which inevitably influences the physiological characteristics of aboveground leaves [4].
Since the second half of the 20th century, with accelerated industrialization and the increasing severity of the greenhouse effect, dramatic global climate change, increased extreme weather, uneven rainfall distribution and frequent waterlogging have been more prevalent [5]. Flooding often occurs in the east and south of China. The reasons for this are heavy annual rainfall, heavy rainfall, and continuous rainfall. Flooding in a broad sense includes two levels, i.e., partial (waterlogging) and total inundation (flooding) of plants by standing water [6,7], and this stress usually induces a series of functional disorders in plants. Flooding affects the growth and development of plants, especially those of xerophytes, the morphology and physiology of which are severely affected in waterlogged conditions. Most vascular plants also show significant damage and even death in flooded environments [8]. Moreover, since fruit trees have very long growth and development periods, they are highly susceptible to waterlogging stress throughout their growth cycles [9]. Furthermore, 80% of the annual precipitation is concentrated from July to August in summer, which exposes the plants to repeated flooding, leading to a decrease in apple fruit quality and yield as well as serious economic losses [10].
Grafted seedlings are generally used in apple production and the selection of rootstocks is the key to the success of apple cultivation [11]. Rootstocks of fruit trees can not only improve the resistance of scion varieties, but also regulate their growth, yield, and fruit quality. Du Xuemei et al. [12] investigated the affinity between rootstock and scion, physiological effects of rootstock on scion, and effects of rootstock on tree growth. It was found that apple rootstock could directly affect the physiological activities of grafted varieties, thus affecting their growth and development. Mao Ke et al. [13] also found that apple rootstocks had a great impact on apple yield through the study of salt stress.
At present, the research on water stress of rootstocks at home and abroad has mainly focused on continuous drought stress and waterlogging stress. Sharma et al. [14] indicated that water stress could significantly reduce the height of rootstocks and affect the metabolic activities of the plants. Xu Qihe et al. [15] found that the water content of rootstock leaves decreased gradually with the duration of drought stress by conducting a study on three apple rootstocks under continuous drought stress and rehydration. Li Yan et al. [16] studied grape rootstocks and observed that waterlogging affected plant root activities, thus influencing aboveground chlorophyll content. However, there have been few studies on interval water stress, in which the rootstock resumes normal growth after a short period of water stress and suffers a second water stress after a period of time.
In this experiment, the dwarfing apple rootstock M9T337 was used as the test material. Through short-term artificial simulation of interval water stress, the changes in plant morphology and leaf-related physiological parameters were monitored to observe the effects of water stress on leaf water content (LWC), electrical impedance spectroscopy (EIS) parameters, rate of electrolyte leakage (REL), soluble sugar, starch, maximum photochemical efficiency (Fv/Fm), and relative chlorophyll content (SPAD). It was assumed that the first water stress would be imprinted on the plant, which could directly lead to changes in the plant during the second water stress. By measuring the physiological and morphological parameters of the apple rootstocks under interval water stress, we determined their adaptability to waterlogged environments and studied their stress resistance mechanism, which has important theoretical and practical significance for improving apple yield and quality.

2. Materials and Methods
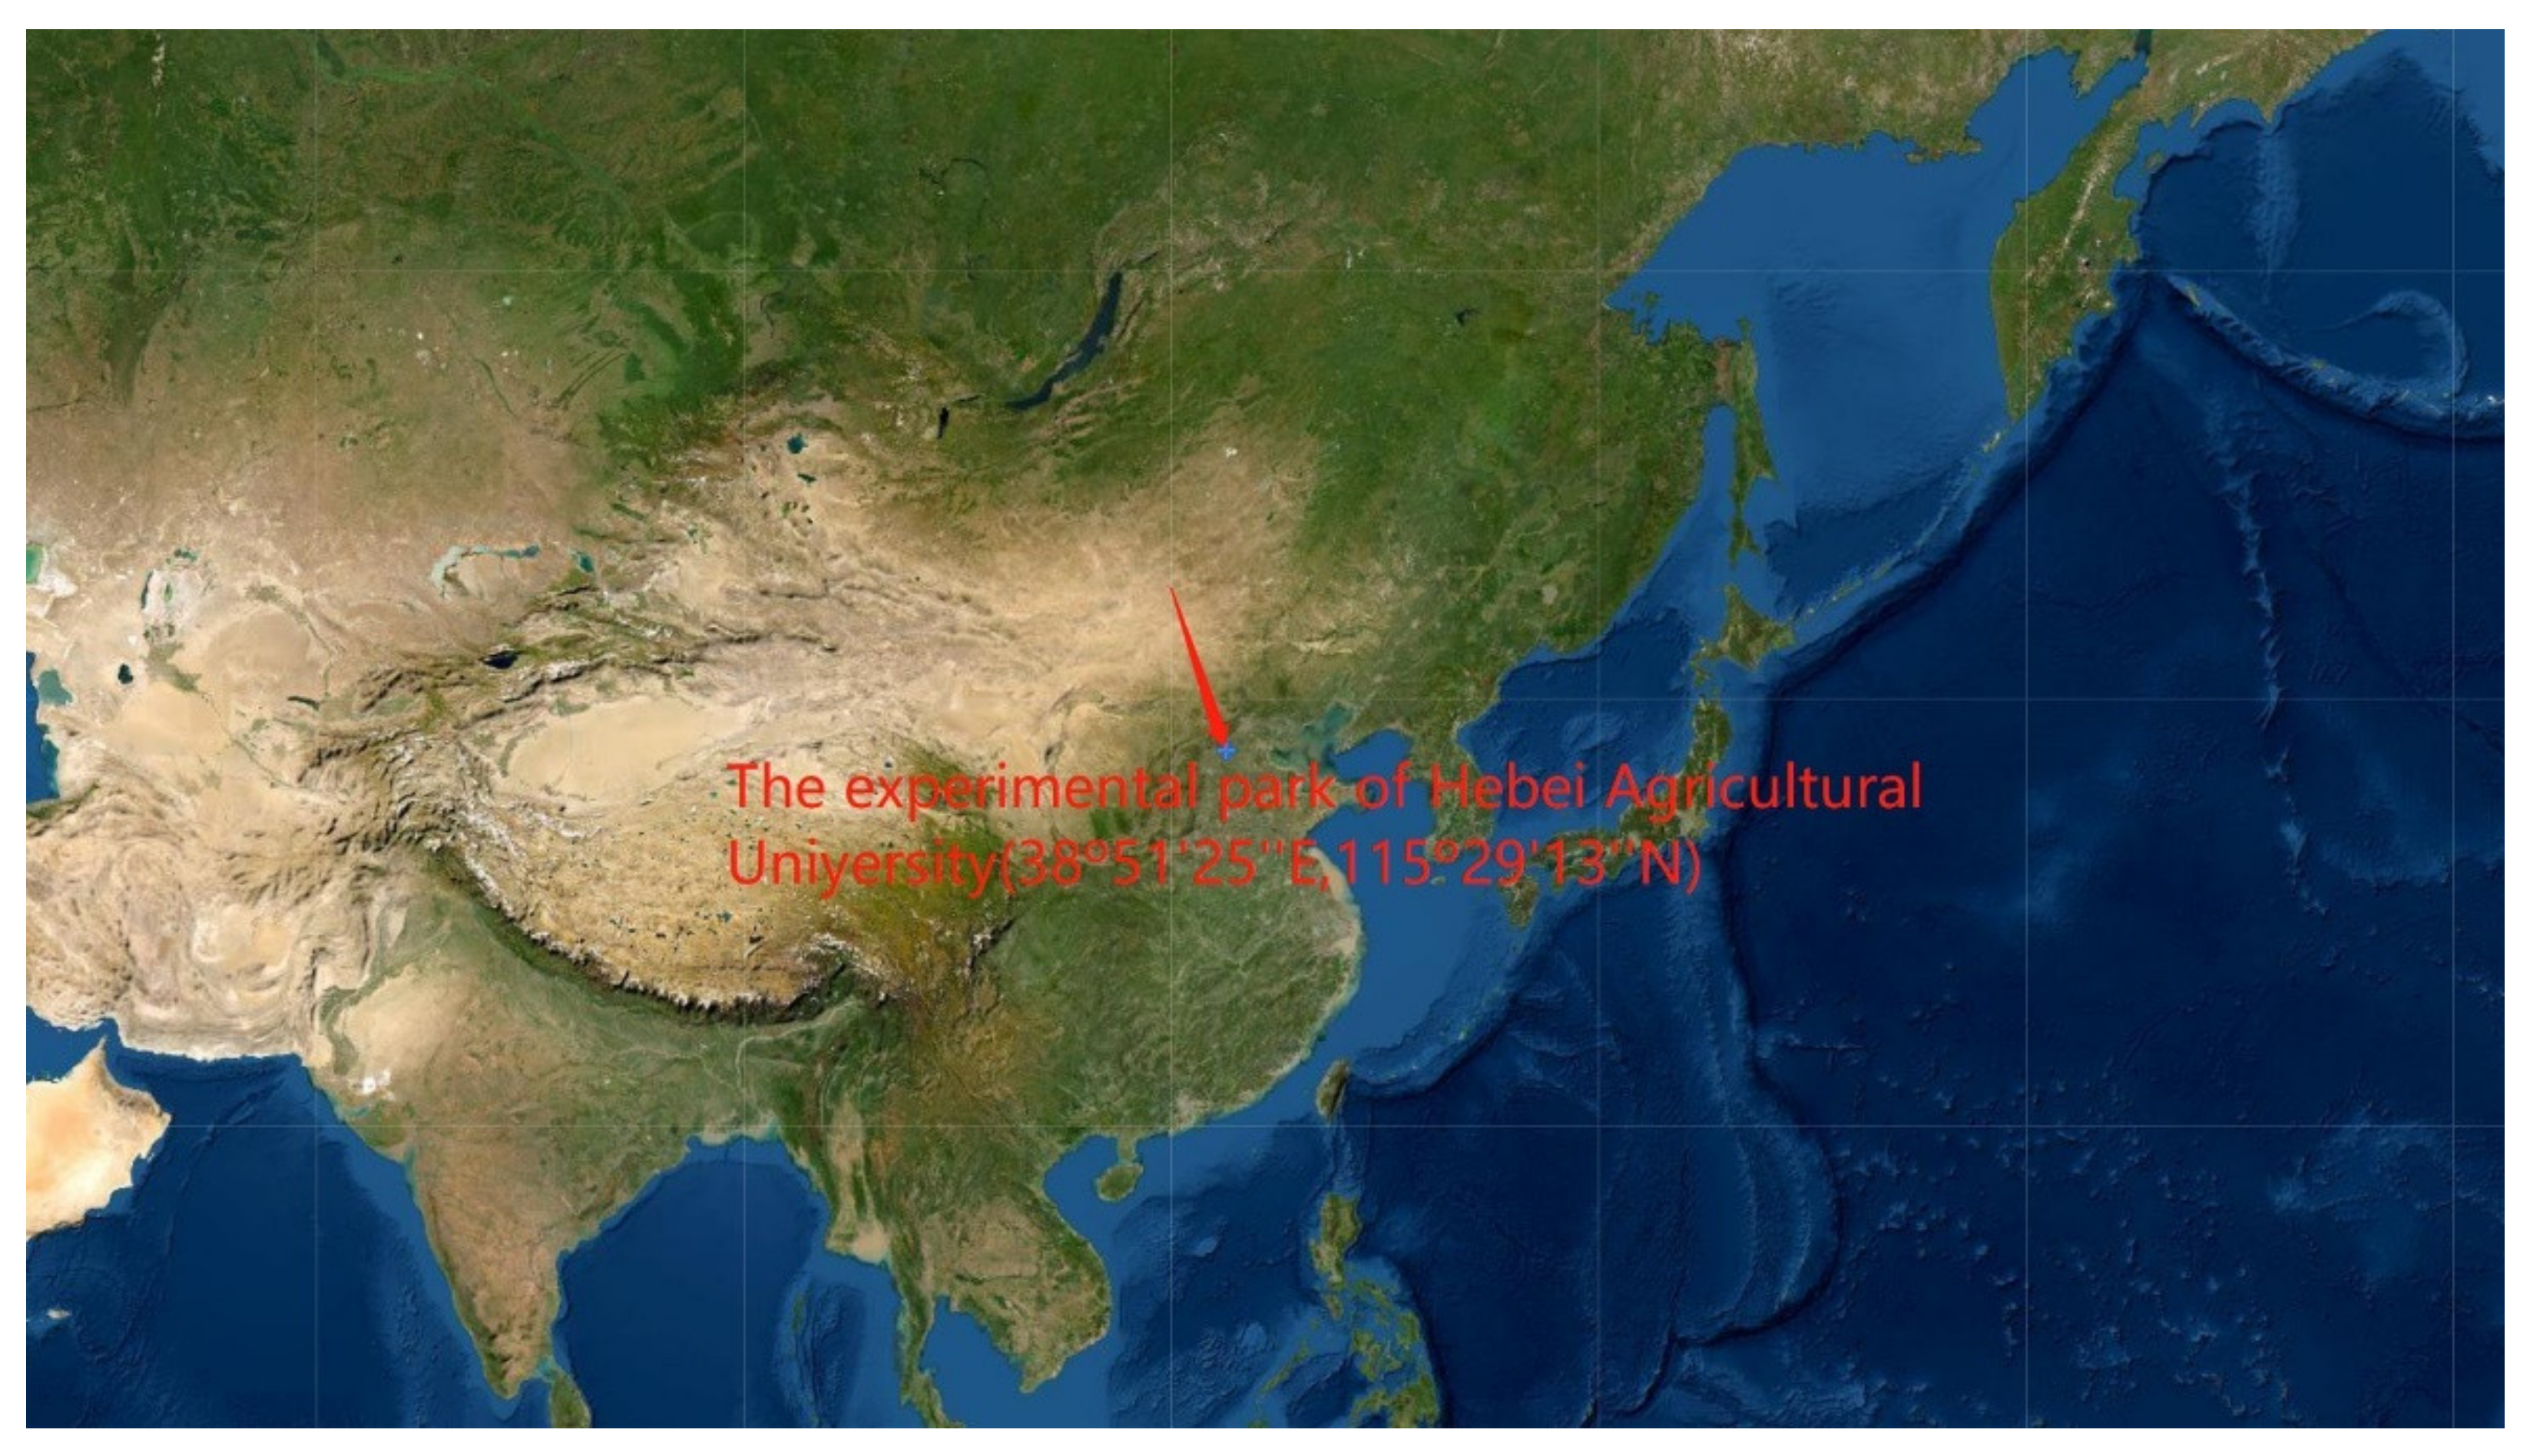
2.1. Plant Material

Two-year-old apple rootstocks M9T337 with consistent growth (plant height 50 cm, stem diameter 10 mm, no branches) were selected from the nursery of Hengshui town, Fengxiang County, Baoji City, Shaanxi Province (34°28′12″ E,107°32′24″ N). The seedlings were wrapped in cling film during transportation to avoid direct sunlight and prevent moisture dissipation. The seedlings were planted in pots with seedling substrate (containing 65% organic matter, pH value 7.0, 25 °C) in the experimental park of Hebei Agricultural University (38°51′25″ E,115°29′13″ N) (Figure 1) on 22 March, 2019. The potting container was a plastic flowerpot with a diameter of 18.5 cm, a height of 22 cm, a bottom diameter of 12.5 cm, and a round hole, and the planting height was 40 cm above the ground. Then, the seedlings were watered once after planting. From 23 March to 30 April, watering was performed every two days (9:00 a.m.). From 1 May to the end of the experiment, evaporation from the soil and transpiration from the plants gradually increased because of the rising temperatures, so watering was performed once a day at 9:00 a.m.

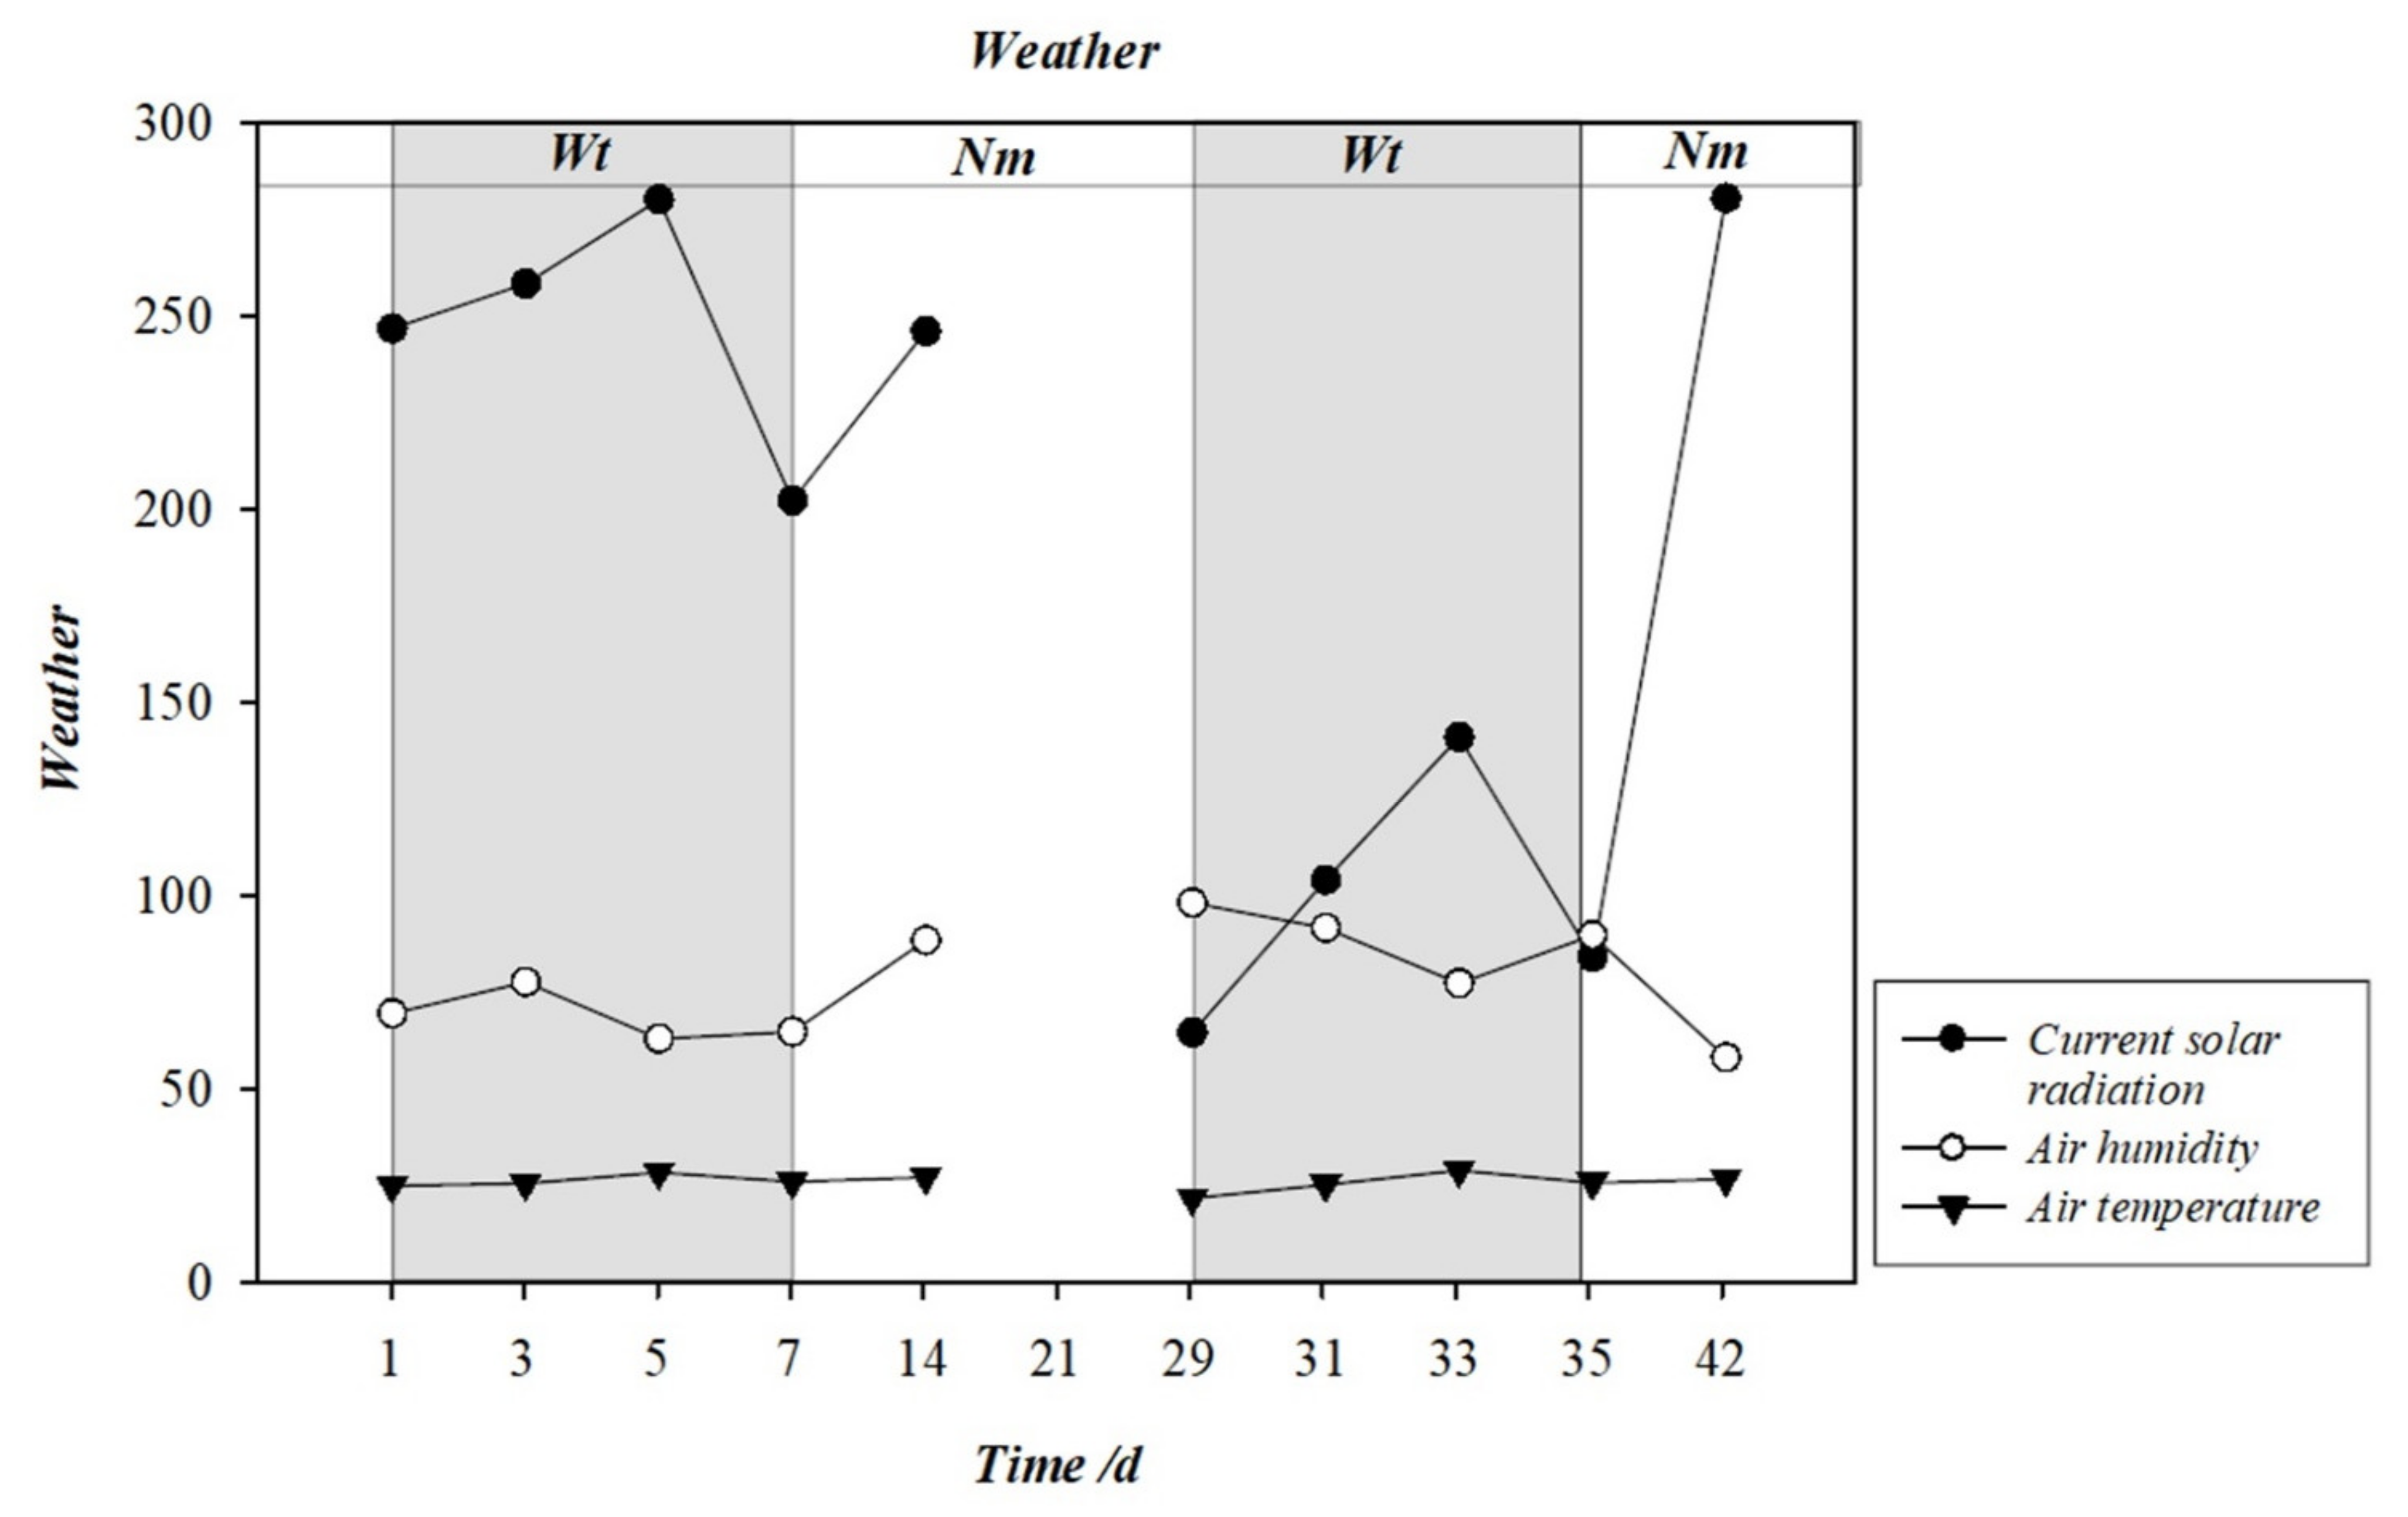
2.2. Experimental Design

The experiment was conducted from 8 July to 18 August 2019, with moisture stress periods from 8 July to 14 July and 5 August to 11 August. The solar radiation, air temperature, and air humidity in the test environment were monitored (Figure 2). The experiment adopted randomized group design with three treatments: waterlogged (T1) treatment (water level flush with the soil surface in the pots), flooded (T2) treatment (water level 2–3 cm above the soil surface in the pots) and control (CK) treatment (75–80% water content, watered once a day at 9:00 a.m.). Soil moisture content was measured by a portable, fast humidometer (Theta Probe ML2X with an HH2 moisture meter Delta-T Devices, Cambridge, UK) in each of the 140 pots. The experiment was sampled 10 times, and 9 repetitions were set for each sampling. Fifty seedlings for each treatment were kept in reserve, and the total number of plants was 420 (9 × 3 × 10 + 3 × 50 = 420). The water stress experiment was carried out by the pond flooding method. Two square ponds, 600 cm long, 115 cm wide, and 28 cm high, were constructed in the experimental area as the T1 and T2 treatment test areas. To simulate natural precipitation distribution, rootstocks were subjected to flooding stress from 8 July to 14 July and from 5 August to 11 August and watered once a day at 9:00 a.m. for the rest of the time. The pond was filled with water at 05:00 a.m. on 8 July to start the first water stress test. Samples were taken at 1d, 3d, 5d, and 7d during the water stress period. The normal maintenance period for the seedlings after the water stress ended was 14 July–4 August. CK was watered once a day at 9:00 a.m., and the T1 and T2 treatments were watered at the same time as CK when the soil moisture content was below 80%. All samples were taken at 14 d of the experiment. The second water stress period was from 5 August to 11 August, with the same method as the first one. Samples were taken at 29 d, 31 d, 33 d, 35 d and 42 d.

2.3. Measurement and Methods of Indicators

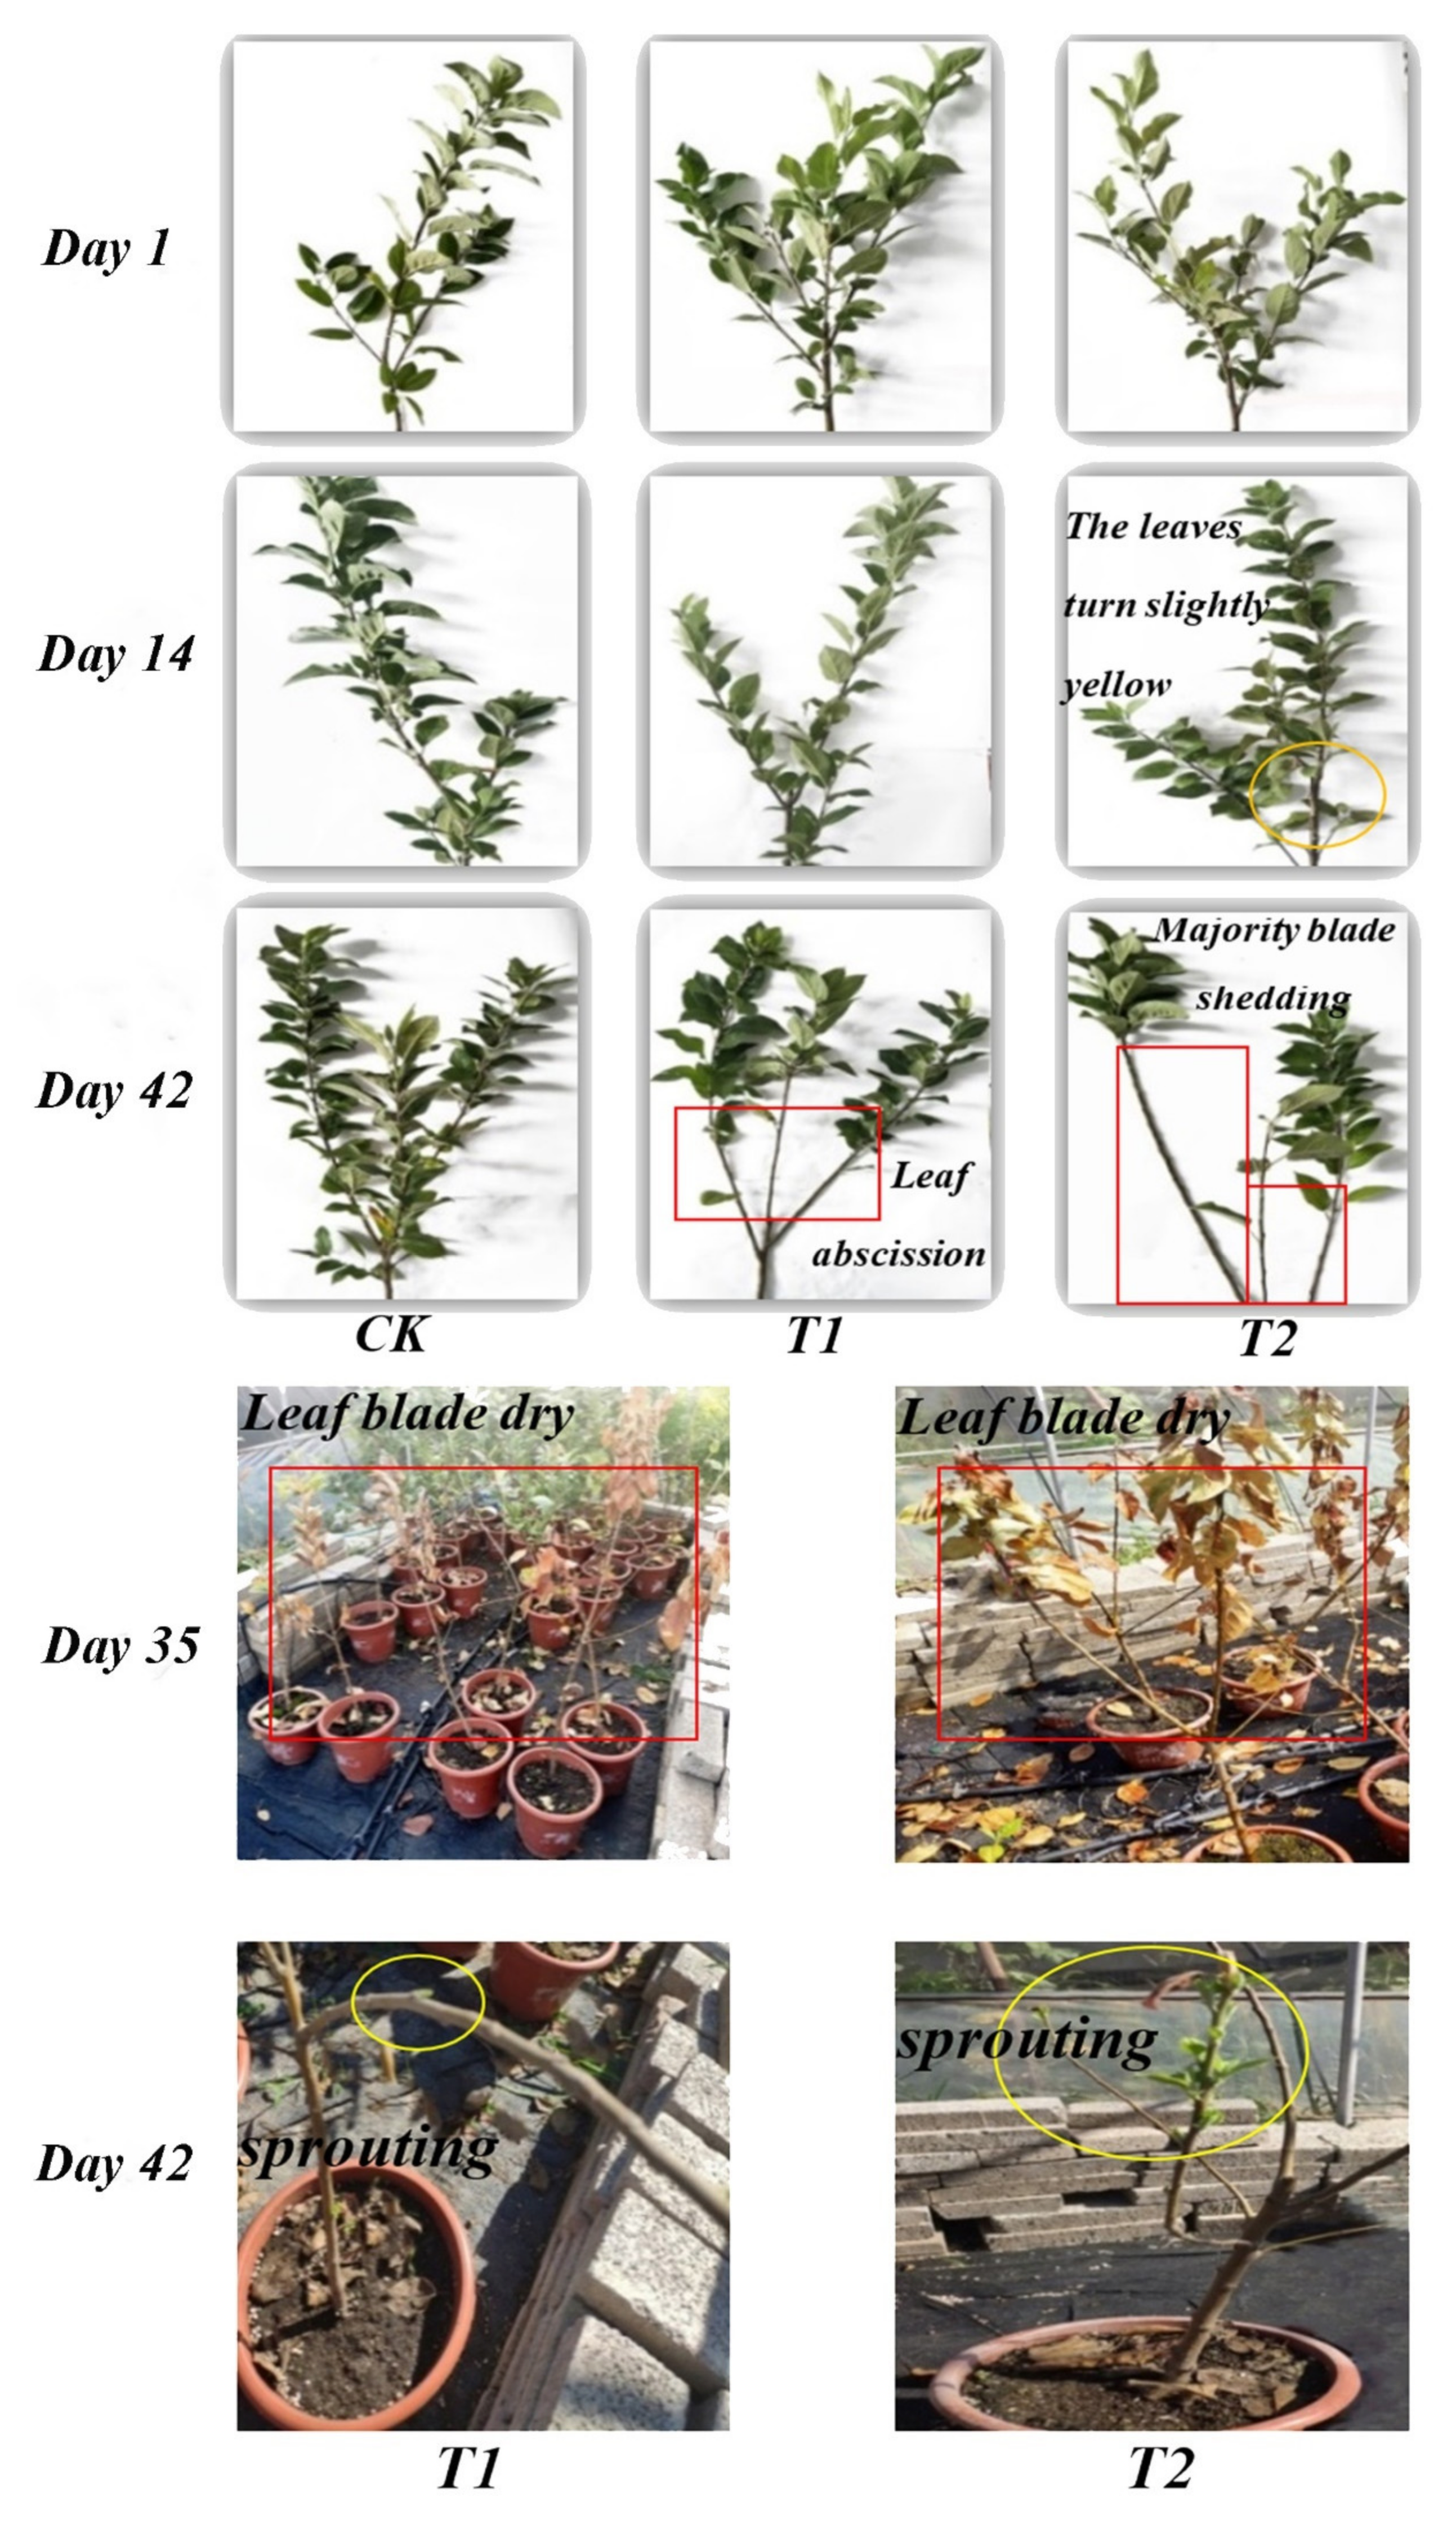
2.3.1. Plant Morphology Observation

The sampled plants were photographed to observe the leaf color change and defoliation and to calculate the plant mortality.

2.3.2. Determination of Leaf Water Content (LWC)

Using the drying oven method [17], 5 g of central leaves randomly taken from each seedling were rinsed and dried with water, distilled water, and deionized water in turn, and then weighed for fresh weight. Then, the seedlings were dried in an oven at 80 °C for 48 h, taken out, and placed in a desiccator for 24 h. The dry weight was weighed separately, and the water content was calculated according to Equation (1).
W a t e r   c o n t e n t = F r e s h   w e i g h t D r y   w e i g h t F r e s h   w e i g h t × 100 %

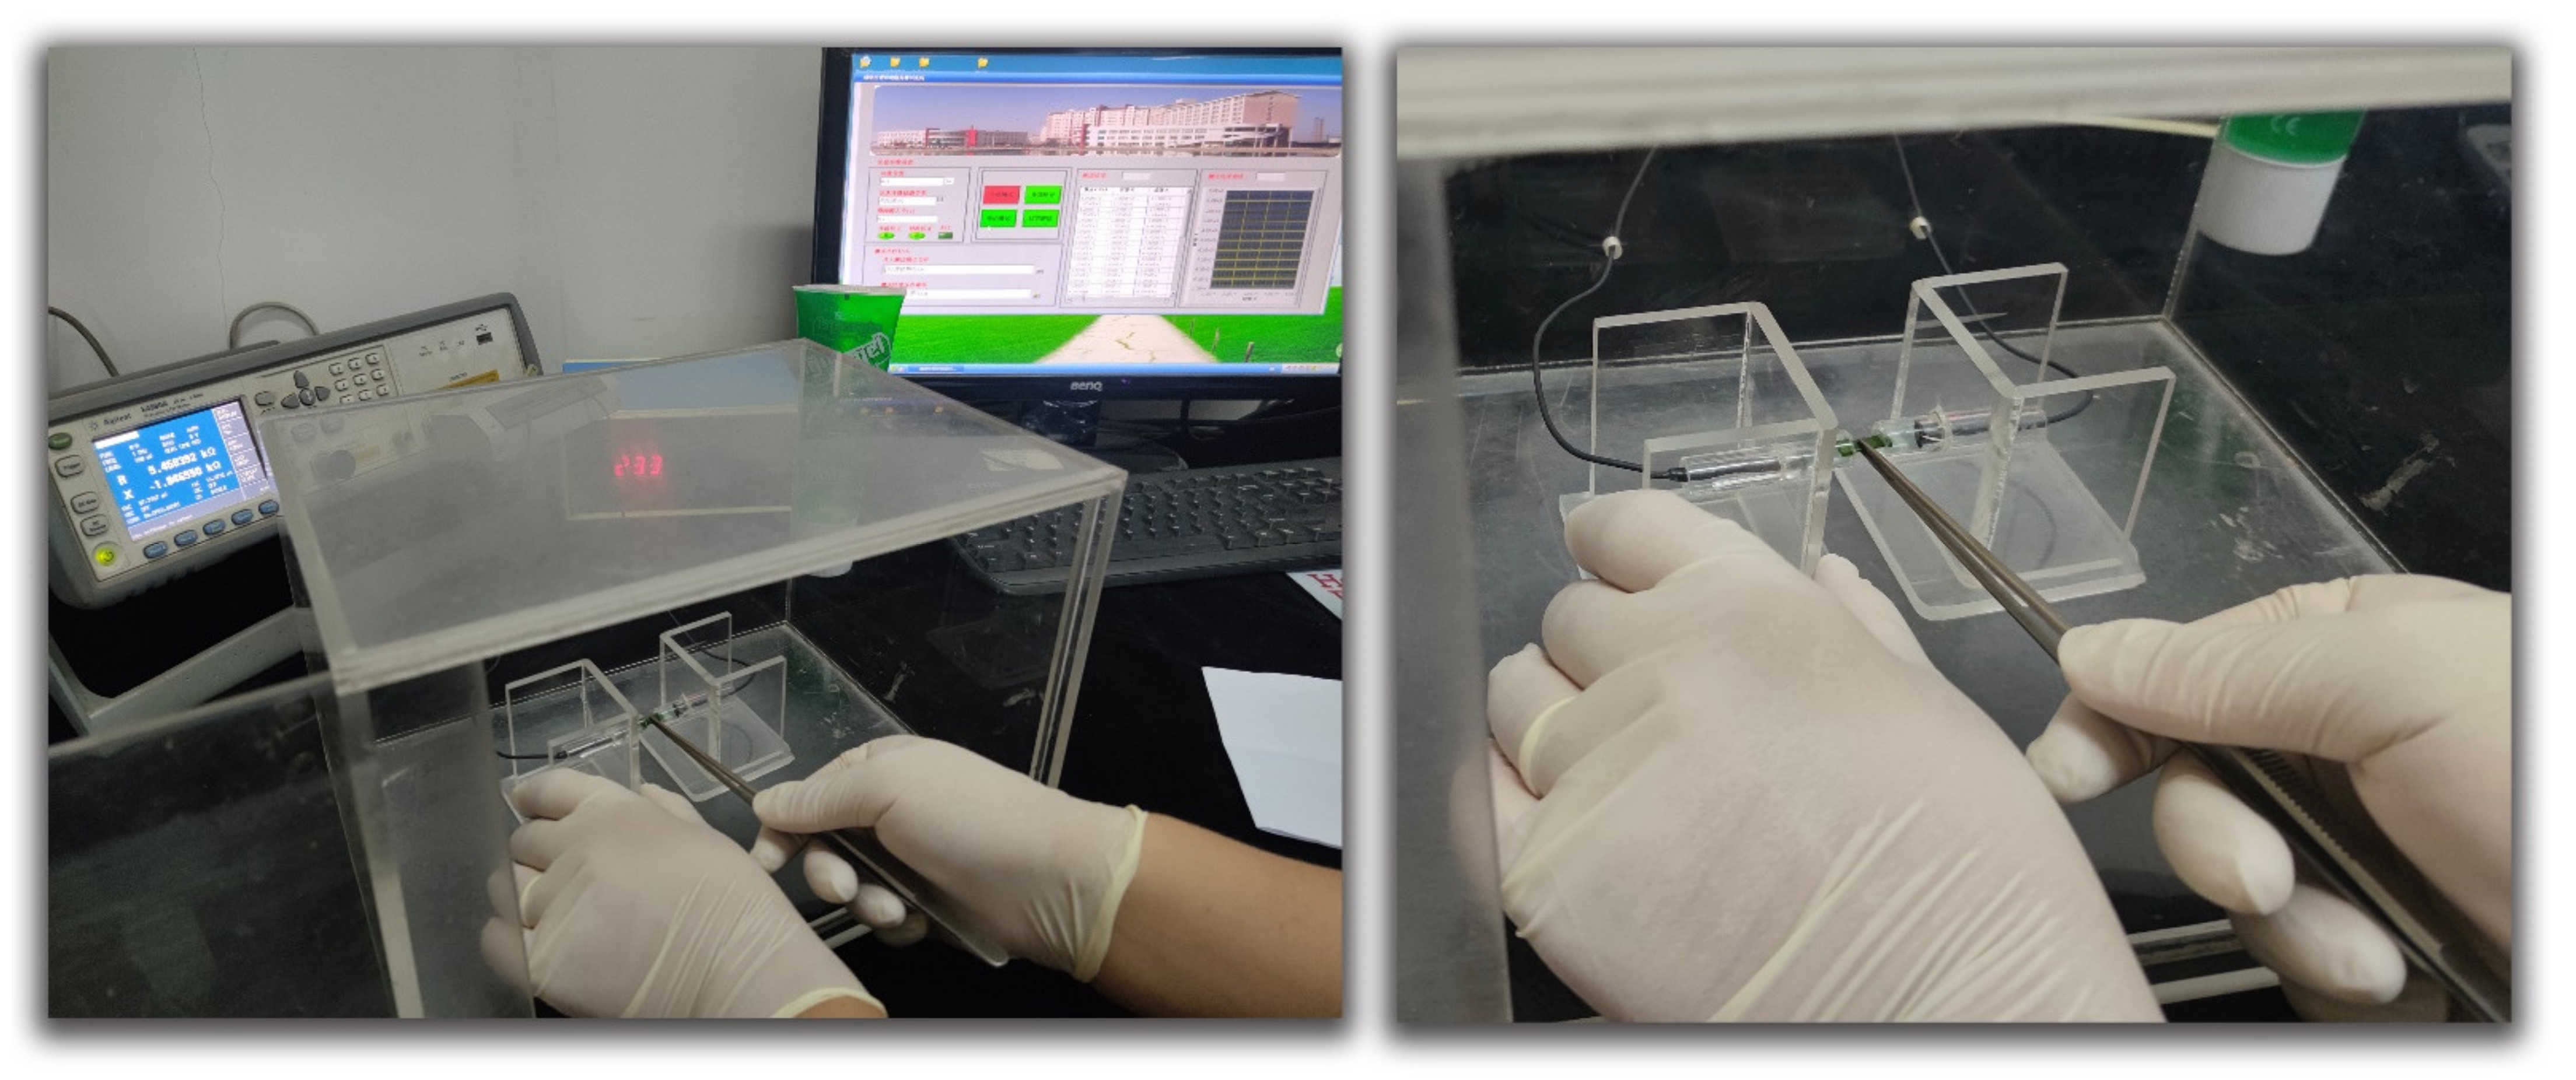
2.3.3. Determination of the Electrical Impedance Spectroscopy (EIS) of Leaves

For each sampling, nine dwarfing apple rootstocks were randomly selected from each treatment group, and one complete leaf was randomly collected from the middle of the current year branch of each selected dwarfing apple self-rooted rootstock for determination of electrical impedance spectroscopy (EIS) parameters. The thickness of apple leaves was measured with a thickness gauge (Mitutoyo NO. 7331, Kawasaki, Kanagawa Prefecture, Japan) to the nearest 0.01 mm, and the EIS was measured with an impedance analyzer (E4980A, Agilent, Palo Alto, California, USA). The Ag/AgCl electrode (RC1, WPI Ltd., Sarasota, FL, USA) was connected to the impedance analyzer with electrode gel added to eliminate the polarization resistance of the electrode, and the cross-section of the leaf was connected to the gel (Figure 3). The electrical impedance values of the samples were measured at 42 frequency points in the range of 80 Hz-1 MHz under the excitation of 100 mV voltage.

2.3.4. Determination of the Rate of Electrolyte Leakage (REL)

The method of determining the rate of electrolyte leakage was adopted from [18]. Current year leaves were randomly picked from the middle of the new shoot of each rootstock and washed with deionized water. For each treatment, four small pieces without the leaf veins were taken from the middle of each leaf using a punch and placed in a test tube. After that, 13 mL of deionized water was added to each test tube, which was then sealed and labeled. Another 3 tubes were used as nontreatment controls, with 13 mL of water added and shaken in a shaker (150 rpm) for 24 h. Then, the initial conductance value C1 and the control conductance value Cnontreatment1 were measured by a digital conductivity meter (DDSL-308, Shanghai Jingke Remagnetics). After the measurement, the tubes were sealed with cling film, placed in a boiling water for 30 min, and then shaken in a shaker (150 rpm) for 24 h. After all of this, the final conductance value C2 and the control conductance value Cnontreatment2 were measured. The REL was calculated according to Equation (2).
Rate   of   electrolyte   leakage R E L = C 1 C n o n - t r e a t m e n t 1 C 2 C n o n - t r e a t m e n t 2 × 100 %

2.3.5. Determination of Leaf Starch and Soluble Sugar Content

Anthrone colorimetric method was employed to determine the starch and soluble sugar content [19]. Determination of starch content: 2 mL of the extract was taken and added to the test tube, then 5 mL of 0.2% anthrone reagent was mixed to render the color and determine the absorbance value. The amount of starch was evaluated from the standard curve to calculate the starch content. Determination of soluble sugar content: 2 mL of the solution and 5 mL of 0.2% anthrone reagent were mixed to render the color and determine the absorbance value at 620 nm. The amount of soluble sugar was evaluated from the standard curve to calculate the soluble sugar content.

2.3.6. Determination of Maximum Photochemical Efficiency (Fv/Fm)

One leaf was randomly selected from the middle of each sample and fixed directly with a dark treatment clamp using in vivo measurements. The samples were dark-adapted for 20 min, and then the basic fluorescence value Fo and the maximum fluorescence value Fm (after excitation by a 0.8 s 3000 mmol·m−2·s−1 saturating light pulse) were determined using a portable fluorometer (HandyPEA, Hansatech, UK). The maximum photochemical efficiency of photosystem II was determined by the Fv/Fm ratio, where Fv = FmFo.

2.3.7. Determination of Relative Chlorophyll Content (SPAD)

SPAD values were measured on the upper-middle leaves of the plants using a handheld SPAD meter (SPAD-502Plus, KONICA MINOLTA). Five clean, disease-free leaves were randomly selected from the upper-middle part of each plant, with the veins avoided for measurement.

2.4. Data Processing and Analysis

The experiment determined the changes in the morphological, physiological, and biochemical parameters of apple rootstock leaves under two water stresses. The data were compiled using Microsoft Excel 2016 software and plotted using SigmaPlot 12.5. Analysis of variance and principal component analysis (PCA) were performed on the experimental data using SPSS v22.0 software, and weights were calculated for each characteristic parameter [20].
l i j = e i j λ i i = 1 ,   2 ,   ,   m ;   j = 1 ,   2 , ,   p
w j = i = 1 m λ i l i j i = 1 m λ i j = 1 p i = 1 m λ i l i j i = 1 m λ i i = 1 ,   2 ,   ,   m ;   j = 1 ,   2 , ,   p
i: Numbering of principal components
j: Numbering of characteristic parameters
λi: Eigenvalues corresponding to the first i principal components
lij: Coefficients of characteristic parameters in linear combinations of different components
wj: Weights of the characteristic parameters in the composite score model

3. Results

3.1. Plant Leaf Morphology

At the end of the first water stress, only the rootstocks of T2 showed a small amount of leaf yellowing at 14 d (Figure 4). After the second water stress, the rootstocks of both T1 and T2 showed notable changes compared to those of CK at 42 d. The rootstocks of T1 presented 35–45% defoliation, while those of T2 lost most of their leaves with more than 75% defoliation (Figure 4). Defoliation or leaf drying appeared on some plants of T1 and T2 after two water stress treatments, but new buds germinated after normal maintenance, and only a few died. The mortality rates were 6% (3) and 8% (4) for T1 and T2, respectively (Figure 4).

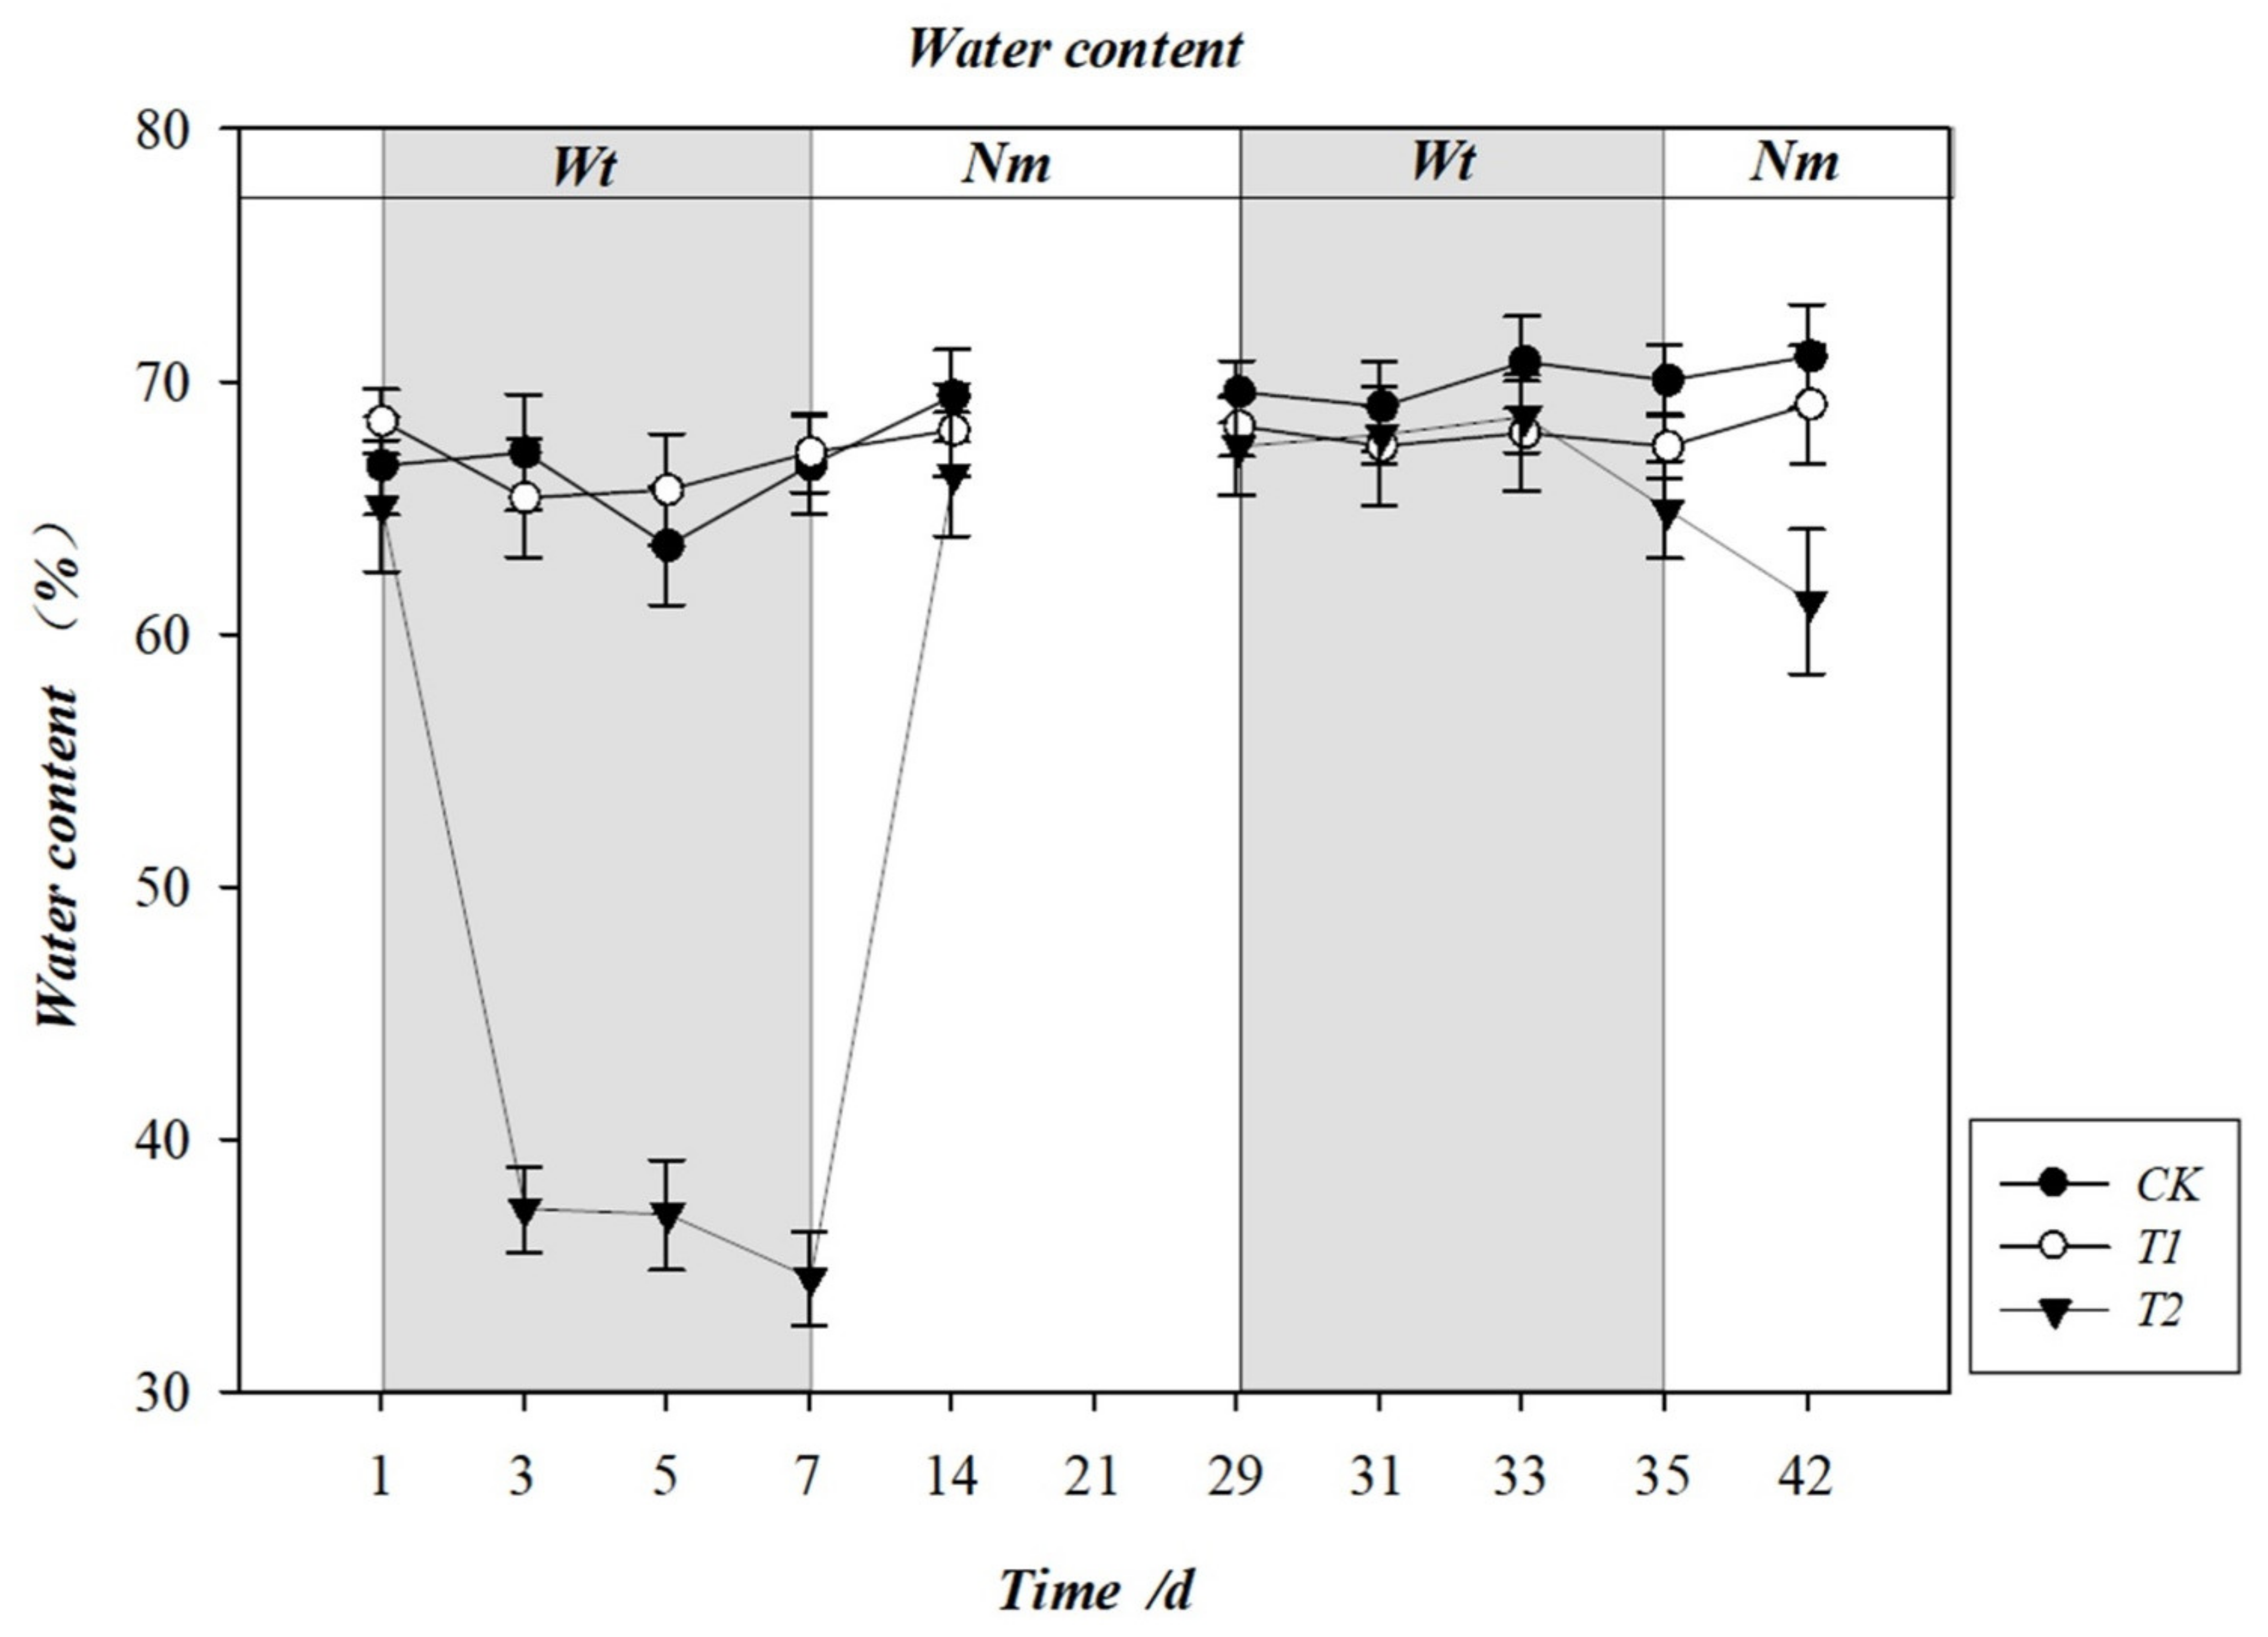
3.2. Effect of Water Stress on Leaf Water Content (LWC)

The experiment results indicated that short-term T1 had a small effect on leaf water content (LWC) and that flooding stress had a large effect on leaf water content. The second T1 brought about remarkable changes in LWC (Figure 5), whereas the second T2 was less influential than the first T2 on leaves. During the first water stress, the difference between the LWC of T1 and of CK was not significant, and the LWC of T2 was significantly lower than that of CK at 3 d, 5 d, and 7 d (Figure 5, Table 1). During the second water stress, the LWC of T1 was significantly lower than that of CK at 33 d and 35 d, while the LWC of T2 was significantly lower than that of CK at 35 d and 42 d (Figure 5, Table 1).

3.3. Effect of Water Stress on High Frequency Resistance r and Low Frequency Resistance r1 of Leaves

The experiment results exhibited that T1 had a bearing on leaf high-frequency resistance r, which was significantly higher under T1 than under CK at 3 d and 14 d during the first water stress and at 31 d and 35 d during the second water stress (Figure 6A, Table 2). T2 had little effect on r, which was significantly higher under T2 than CK only at 7d during the experiment (Figure 6A, Table 2).
During the first water stress, in terms of the low-frequency resistance r1, the T1 group displayed a general trend of first increasing and then decreasing, and r1 of T1 was significantly (p < 0.05) higher than that of CK at 3 d (Figure 6B, Table 3); r1 of T2 peaked at 7 d, when it was 26% higher than that of CK, but was significantly (p < 0.05) lower than that of T1 at 3 d (Figure 6B). At the second water stress, r1 of T1 reached a peak of 24% higher than that of CK at 33 d. The r1 of T2 was significantly (p < 0.05) higher than that of CK at 35 d, and no significant difference between r1 of T1 and T2 was observed. After both stresses were lifted, there was no significant difference among the low-frequency resistances of all treatments (Figure 6B, Table 3).

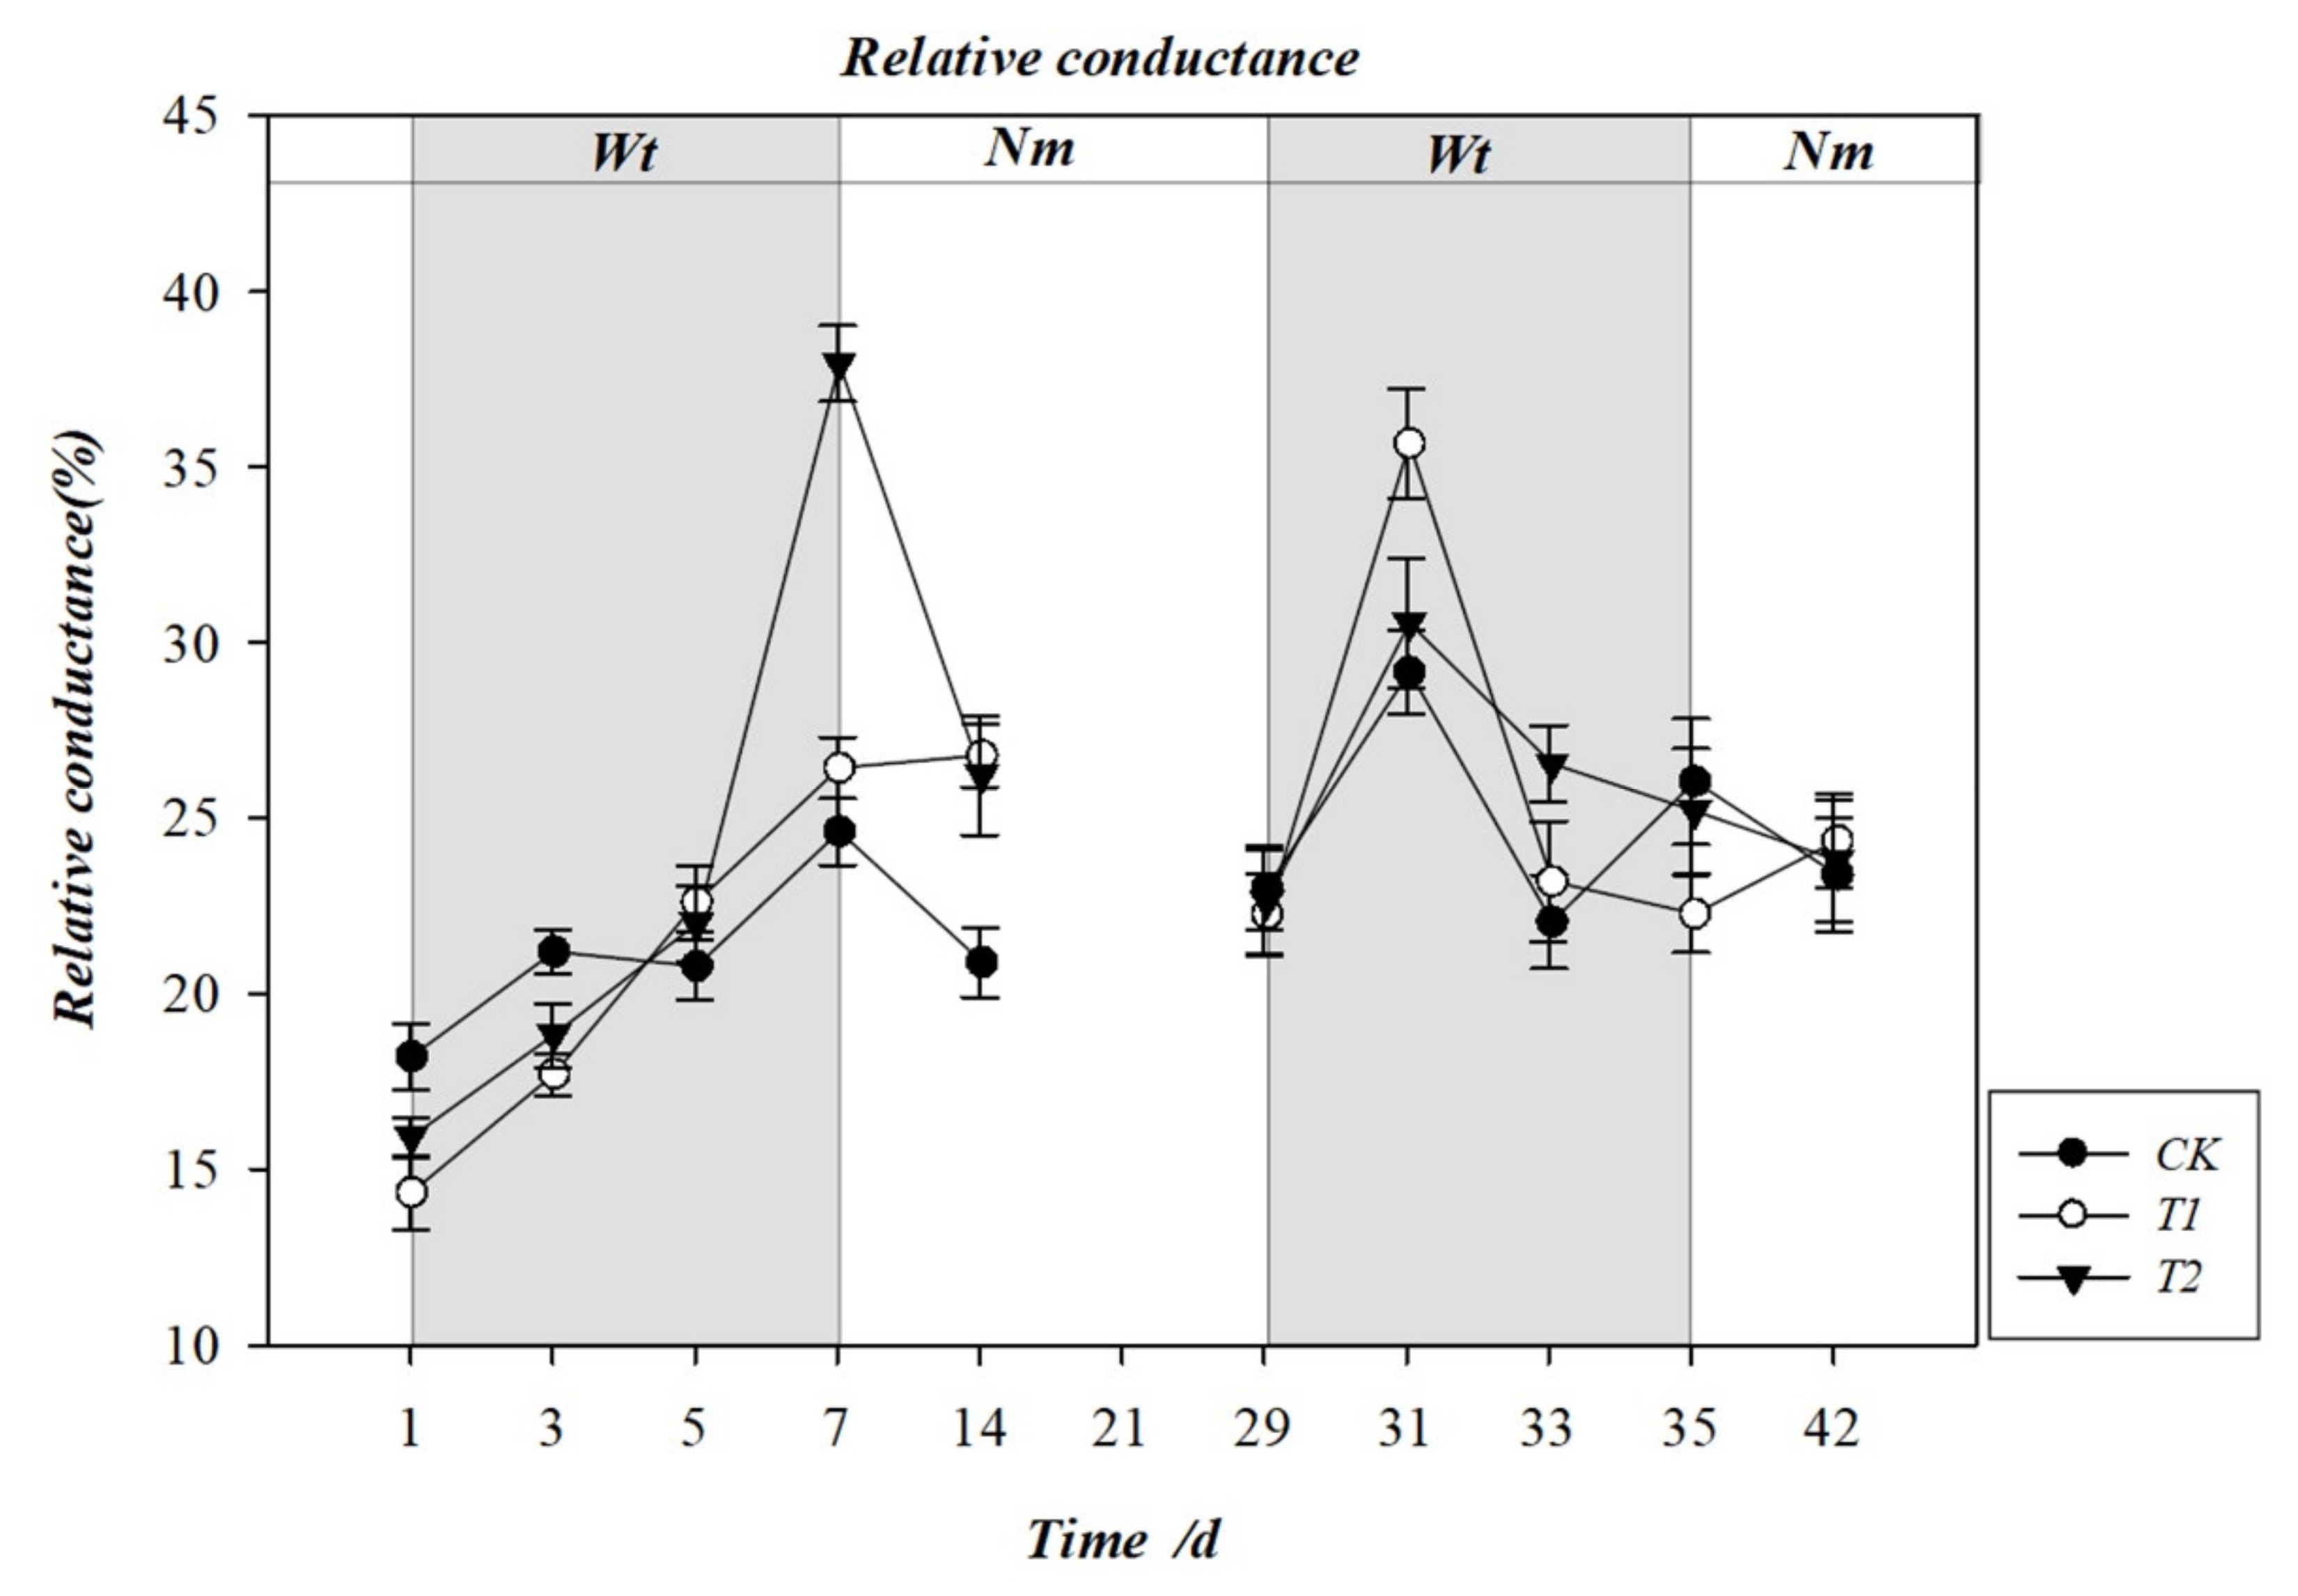
3.4. Effect of Water Stress on the Rate of Electrolyte Leakage (REL)

During the first water stress, the rate of electrolyte leakage (REL) under T1 showed an overall increasing trend, which was highly significantly (p < 0.01) lower than that of CK at 3 d. The REL of T2 was significantly (p < 0.05) lower than that of CK at 3 d and highly significantly (p < 0.01) higher than that of CK and T1 at 7 d (Figure 7, Table 4). All treatment groups exhibited a downward trend after the stress was relieved (Figure 7), with no significant difference. At the second water stress, the REL of T1 reached a peak at 31 d, 18.2% higher than that of CK, and the REL of T2 also reached a peak at 31 d, 3.6% higher than that of CK (Figure 7). No significant difference between the REL of T1 and T2 was recorded. After stresses were lifted, there were no significant differences among the REL of all treatments (Figure 7, Table 4).

3.5. Effect of Water Stress on Leaf Starch and Soluble Sugar Content

During the first water stress, the starch content of all treatments showed an increasing trend (Figure 8A). The starch contents of T1 and T2 were significantly higher than that of CK at 3 d (p < 0.05). After the stress was lifted, the starch content of CK was significantly higher than that of T1 and T2 at 14 d (Figure 8A, Table 5). During the second water stress, the starch content of T1 displayed a rising trend followed by a decreasing trend, reaching a peak at 31 d. The starch contents of CK and T2 showed similar trends, both fluctuating up and down (Figure 8A). And there was no significant difference among the starch contents of all treatments during the water stress period. Seven days after the stress was lifted, the starch content of T2 was significantly higher than that of CK at 42 d (p < 0.05) (Figure 8A, Table 5).
During the first water stress, the soluble sugar content of T1 presented a trend of first increasing and then decreasing, whereas that of T2 showed a trend of first decreasing and then increasing (Figure 8B). The soluble sugar content of T1 peaked at 5 d and was significantly higher than those of CK and T2 (p < 0.05). All treatments presented a descending trend after the release of stress, and there were no significant differences among the soluble sugar contents of treatments until 14 d (Figure 8B, Table 6). During the second water stress, the soluble sugar content of T1 showed a rising trend followed by a decreasing trend, while that of T2 fluctuated (Figure 8B). A decreasing trend in the soluble sugar contents of all treatments was displayed after stress release, and the soluble sugar contents of T1 and T2 were still significantly higher than that of CK (p < 0.05) 7 days after stress release (Figure 8B, Table 6).

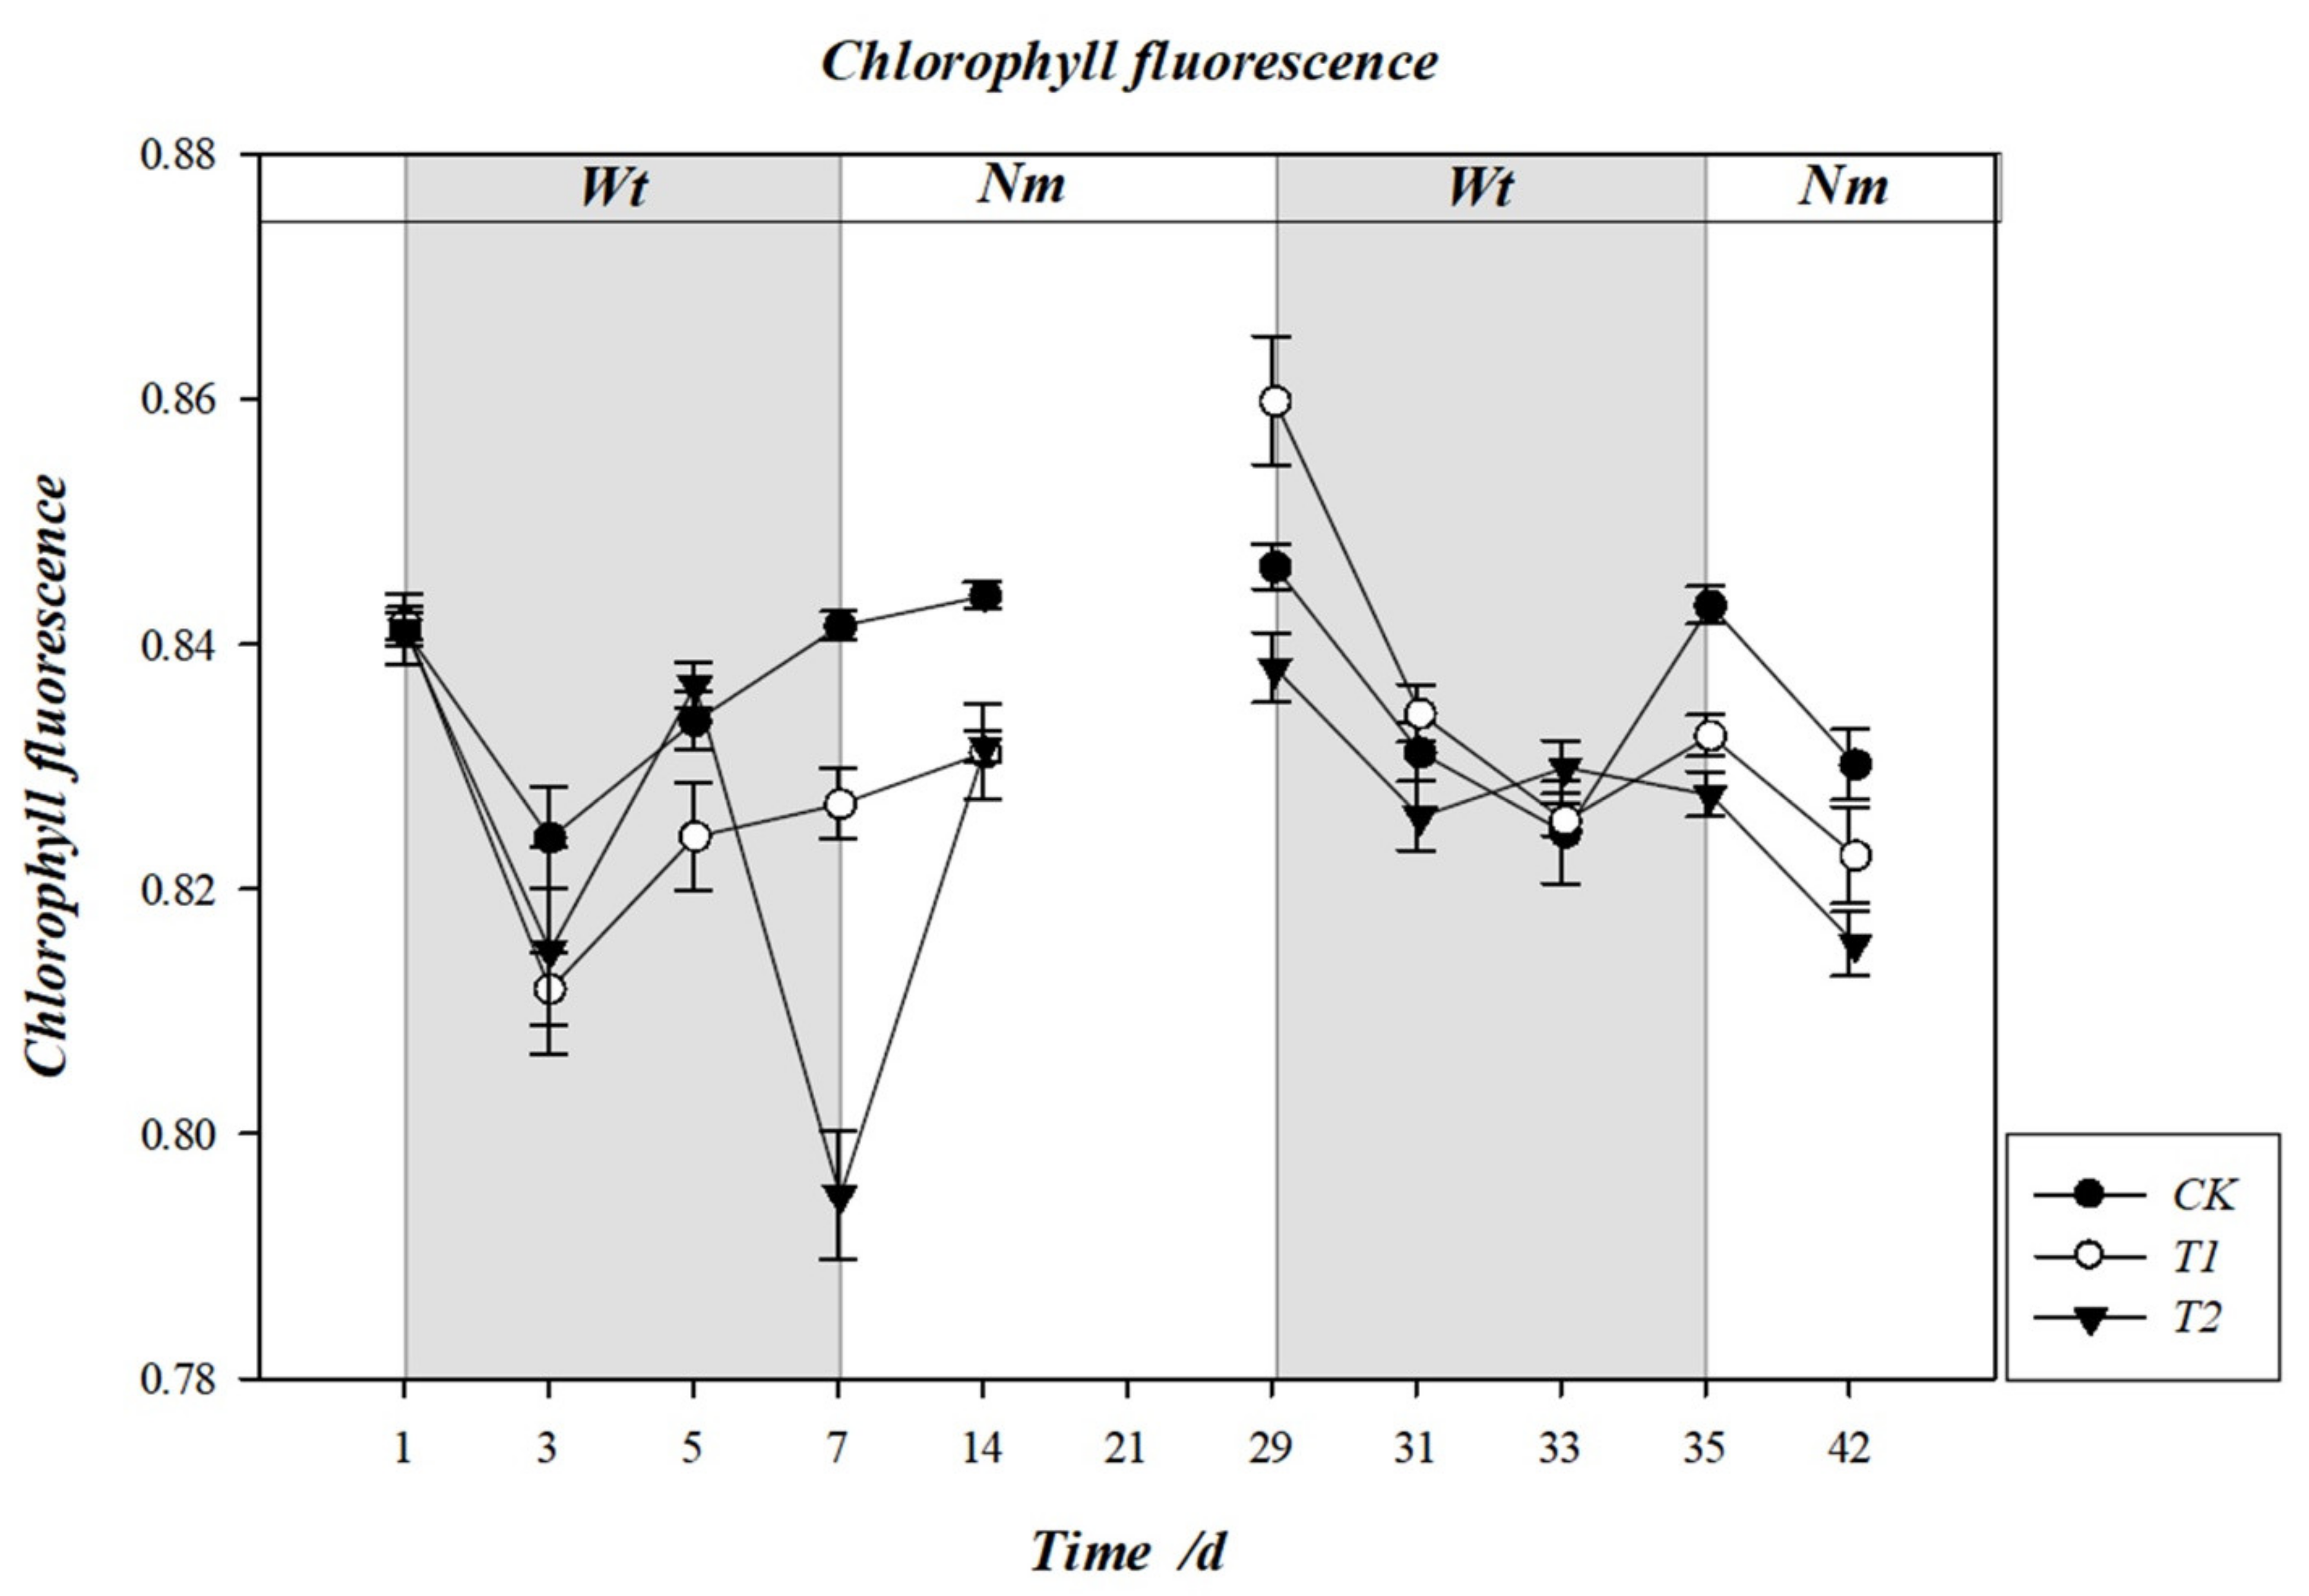
3.6. Effect of Water Stress on the Maximum Photochemical Efficiency Fv/Fm

During the first water stress, the maximum photochemical efficiency Fv/Fm of T1 showed an overall decreasing trend followed by an increasing trend, reaching the lowest value at 3 d, 1.7% lower than that of CK (Figure 9). The Fv/Fm of T2 was significantly (p < 0.05) lower than those of CK and T1 at 7 d (Figure 9, Table 7). An increasing trend in the Fv/Fm was observed in all treatments after the release of stress, and difference among them was not significant. At the second water stress (Figure 9), the lowest value of the Fv/Fm under T1 arose at 42 d, 0.13% lower than that of CK (Figure 9), whereas the Fv/Fm of T2 was significantly (p < 0.05) lower than that of CK at 35 d. There was no significant difference between the Fv/Fm of T1 and T2. After the second water stress was lifted, no significant differences appeared among the Fv/Fm of all treatments (Table 7).

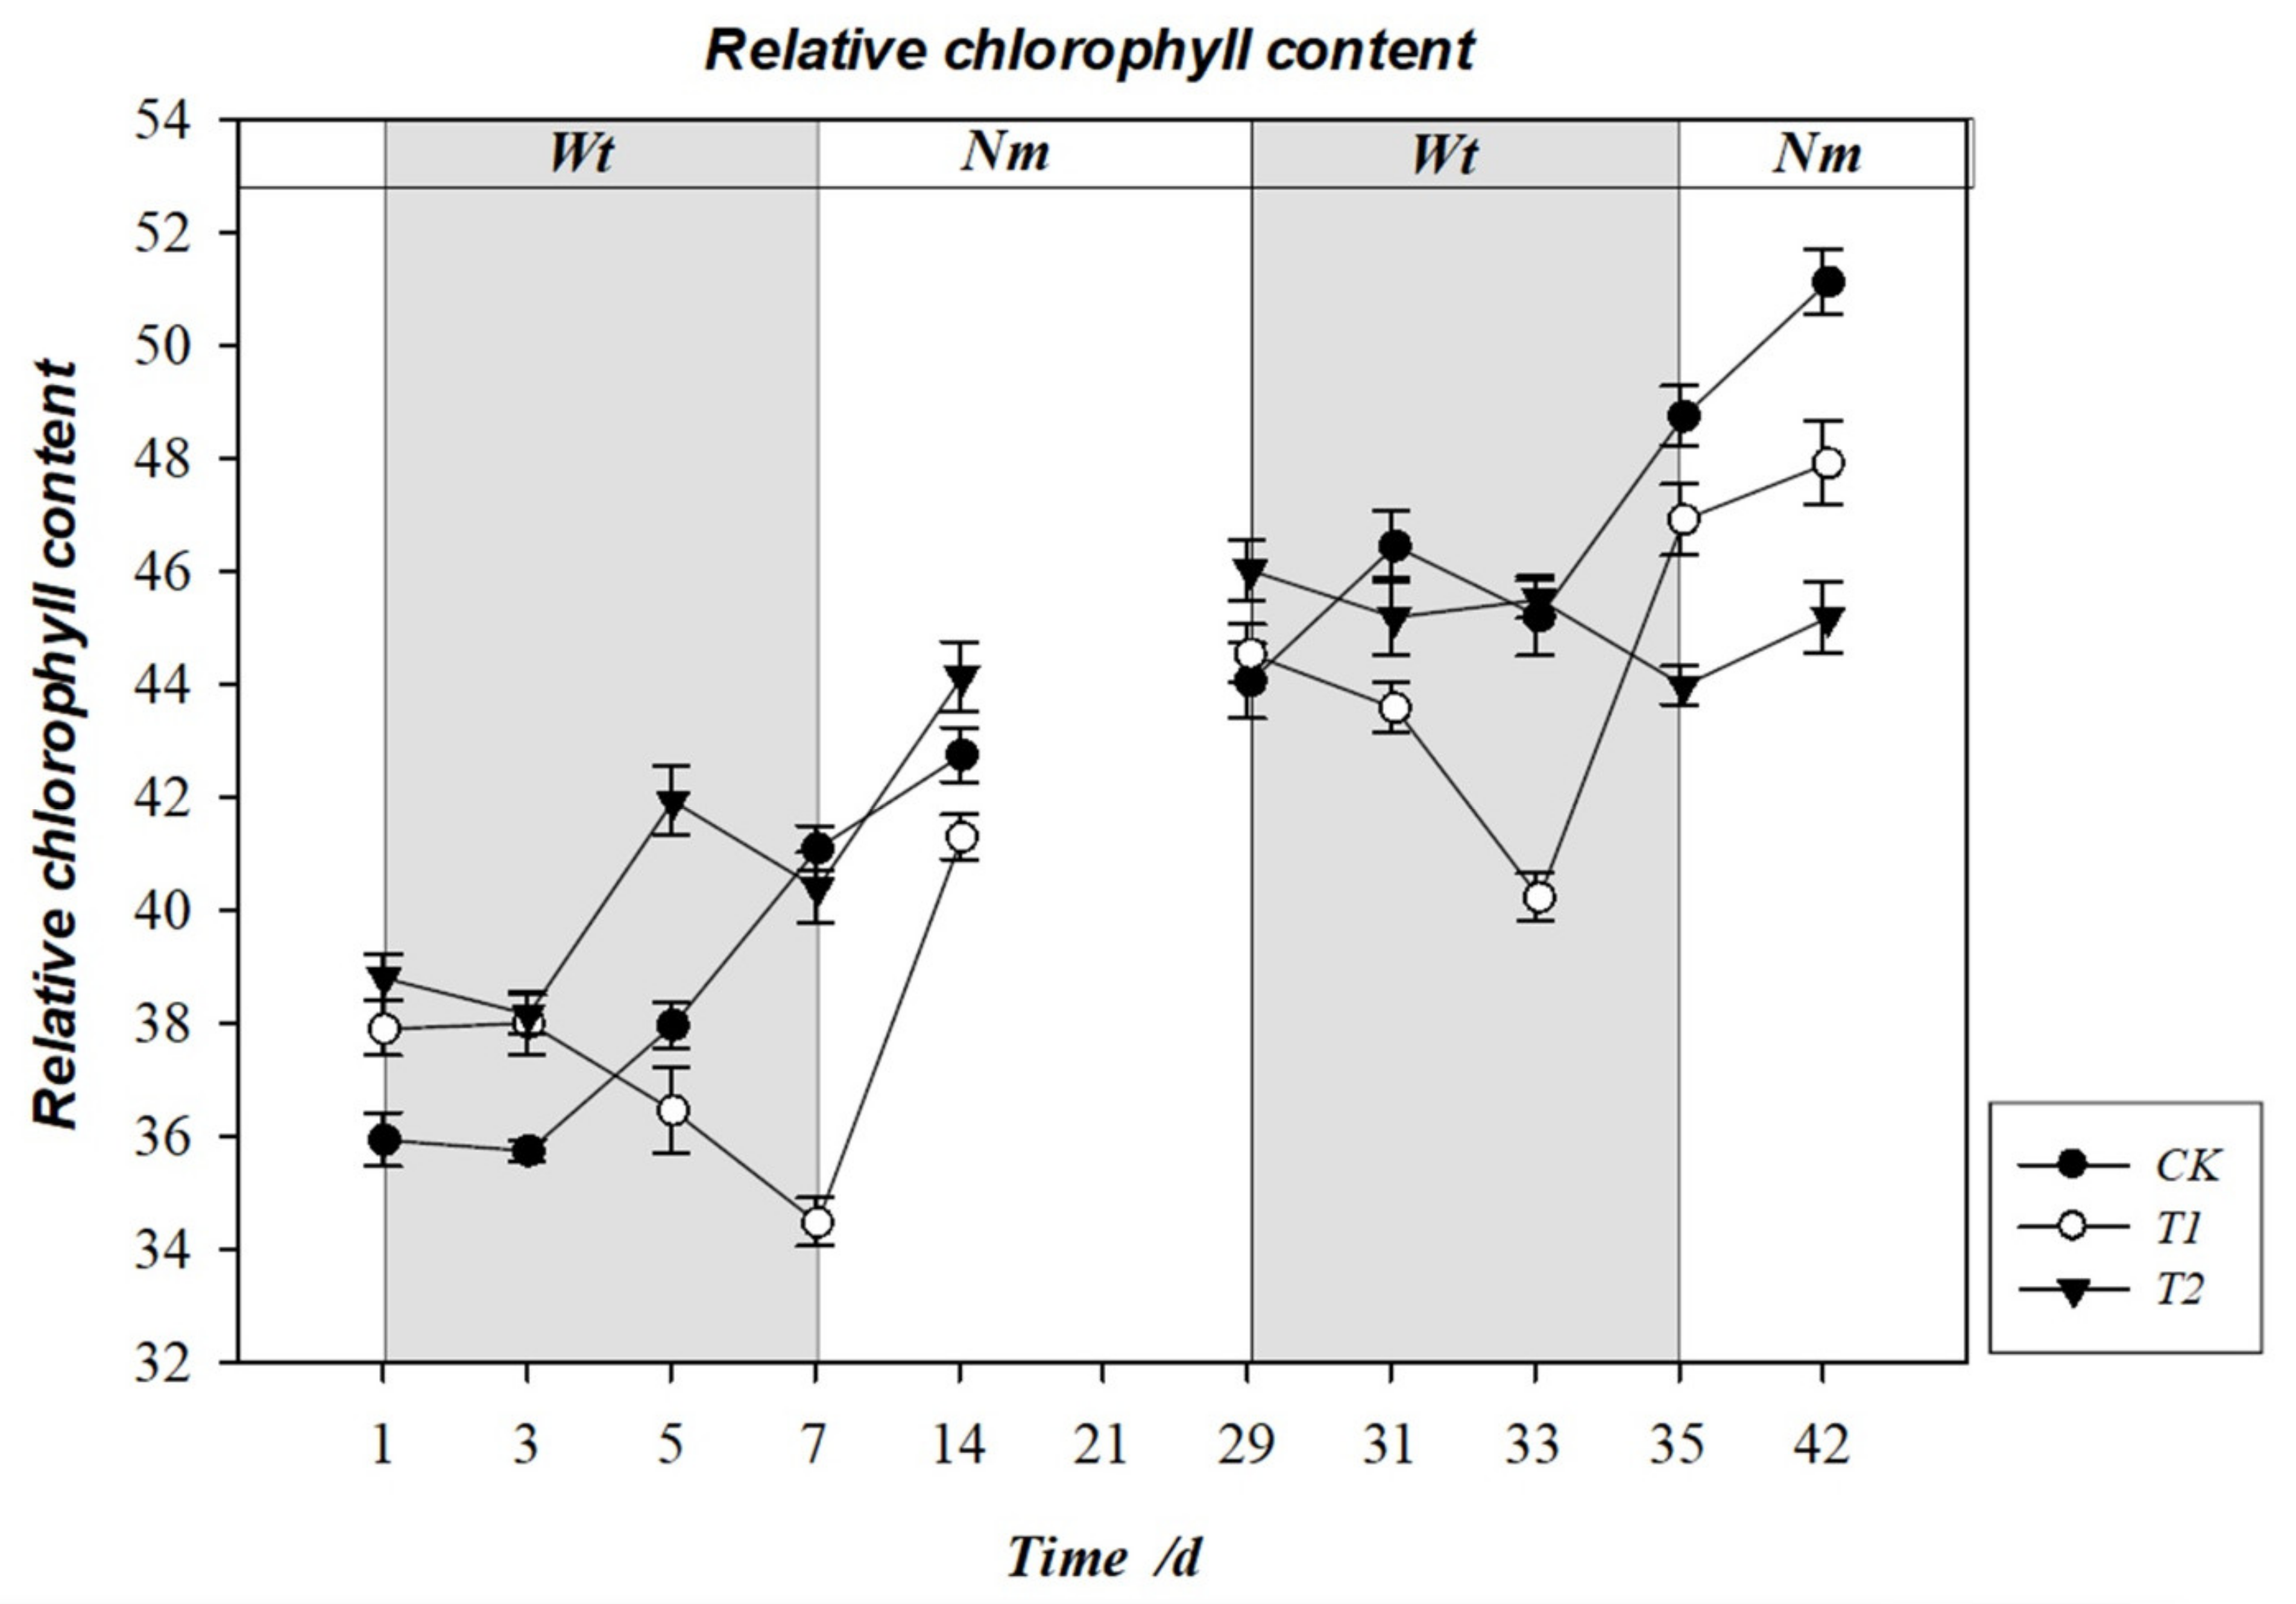
3.7. Effect of Water Stress on Relative Chlorophyll Content (SPAD)

During the first water stress, an overall decreasing trend in relative chlorophyll content (SPAD) was exhibited in T1, which was significantly (p < 0.05) higher than that of CK at 3 d. The SPAD value of T2 reached its highest value at 5 d, 6.7% higher than that of CK, and the SPAD value of T1 was significantly (p < 0.05) lower than that of T2 at 7 d. After the stress was lifted, the SPAD value of all treatments took on an increasing trend, and the differences among them were not significant (Figure 10, Table 8). For the second water stress, the SPAD value of T1 reached its lowest value at 33 d, 11.8% lower than that of CK (Figure 10), while the SPAD value of T2 was significantly (p < 0.05) lower than that of CK at 35 d. There was no significant difference between the SPAD values of T1 and T2. After stress release, the SPAD value of T2 was significantly (p < 0.05) lower than that of CK at 42 d, but no significant changes were observed between those of T1 and CK (Table 8).

3.8. Principal Component Analysis of Leaf Physiological and Biochemical Parameters

The results of the principal component analysis revealed that the variability among the parameters of apple leaves grown under flooding stress could be explained by the first three components (Table 9). Of the total variation, the first three components of water stress explained 57.41% of the physiological changes. The first component (PC1) explained 26.92% of the physiological changes; it was highly positively correlated with r and r1 and negatively correlated with starch content. The second component (PC2) explained 17.46% of the physiological changes and was positively correlated with REL and SPAD. The third component (PC3) accounted for 13.03% of the physiological changes and had positive correlation with Fv/Fm and starch. Among the studied parameters, high-frequency resistance, low-frequency resistance, conductivity, chlorophyll, starch, and maximum photochemical efficiency were important parameters for the response of leaves to apple seedlings, and they reflected the degree of resistance of seedlings to waterlogging stress, which in turn reflected the degree of seedling tolerance to flooding stress. Among these important parameters, high-frequency resistance and low-frequency resistance were key parameters for PC1, chlorophyll content and soluble sugar for PC2, and maximum photochemical efficiency for PC3. The weights of indicators refer to the importance of the corresponding indicators in the comprehensive evaluation. After the weight computation of the above indicators, the weight values of r, SPAD, and Fv/Fm were 0.25, 0.20, and 0.18, respectively (Table 9). It was concluded that r, SPAD, and Fv/Fm of apple leaves can be used as important parameters to determine the degree of water stress on apple seedlings.

4. Discussion

Research has shown that water stress directly results in root hypoxia [21], which in turn brings about oxidative damage to the leaves with the accumulation of oxidative products [22]. In this study, a small amount (<20%) of leaf yellowing was observed in T2 plants after the first water stress, while the distinctions between T1 and CK plants were not significant. However, defoliation occurred in both T1 and T2 plants after the second water stress (Figure 4). This phenomenon indicates that T1 does not affect the morphology of dwarfing apple rootstock in a short period of time (7 d), but significant changes arise if a second water stress occurs. The seedlings that lost their leaves sprouted again at 42 d (Figure 4), because the damage caused by the second stress was not irreversible. This explains why there was new leaf sprouting when the stress was removed.
Water is an important component of the plant body, and the water content of a plant organ reflects the amount of dry matter accumulated in it. The lower the water content, the higher the dry matter accumulation, and vice versa [23,24]. The experiment demonstrated that the variability of T2 plants was greater at the first water stress and less at the second stress (Table 1), since the cells were filled with water after the first water stress, which accelerated the accumulation of dry matter and improved the adaptation to flooding at the same time, in agreement with the findings of Victor et al. [25]. In contrast, the rootstocks of T1 showed a significant difference at the second stress but not at the first stress (Table 1). The explanation could be that the short-term (7 d) water stress did not have a remarkable impact on the amount of dry matter accumulation, but the second water stress resulted in partial leaf abscission and preferential supply of nutrients to new sprouts. Thus, the morphological parameters of T1 were significantly lower than those of CK.
The most sensitive part of the plant to water stress is the leaf, which can directly reflect the plant’s adaptability to adversity [26,27]. In this experiment, significant differences in r and r1 among treatments were observed for a total of 6 days during the first water stress, but for only 3 days during the second water stress (Table 2 and Table 3). This was because flooding stress led to low oxygen content in the soil, making the plants vulnerable to the damage of low oxygen stress. However, the plants were less damaged during the second stress than the first stress, as the plants adjusted their physiological defenses after the first stress. That resulted in columnar arrangement of cells and larger cortical cell gaps, which were more conducive to oxygen transport. As a result, the plants’ ability to adapt to flooding stress was enhanced.
Plant cell membranes play a regulatory role in controlling the exchange of substances inside and outside the cell [28]. When the selective permeability of the plasma membrane is disrupted, there is extravasation of intracellular electrolytes, which is manifested as an increase in conductivity [29]. The experiment showed that significant or highly significant differences were likewise observed among the parameters of all treatments in the first water stress, but no significant differences were observed in the second water stress (Table 4), indicating that the cell membrane was more severely damaged under the first waterlogging stress. This damage caused a large amount of ion extravasation from the leaves, contributing to increased electrolyte permeability and enhanced conductivity of the medium, in agreement with the findings of Wang et al. [30]. The first water stress promoted cell membrane lipid peroxidation through the production and elimination of free radicals in the plant, thus improving the plant’s resistance before the second water stress.
During the first stress, the accumulation rates of leaf starch content of T1 and T2 in the first 3 days was higher than that of CK (Figure 8A), which reveals that short-term flooding stress had a positive effect on the accumulation of starch content. From 3 d on, the accumulation rates of T1 and T2 were lower than that of CK, which agrees with the results of Liu et al. [31]. With the extension of the stress time, starch in the leaves was actively hydrolyzed into sugars to maintain respiratory consumption and strengthen the resistance to adversity. However, the soluble sugar content of leaf slowly decreased during the first water stress (Figure 8B). It is likely that the soluble sugars in the leaves were transported to the more stressed roots and stems to resist the damage caused by stress [32]. The leaf starch content of T1 was lower than that of CK during the stress time except for 3 d, and the leaf starch content of T2 was lower than that of CK throughout the stress period (Figure 8B), which helps to confirm the speculation that soluble sugars were transported to the roots and stems. During the second water stress, the rate of starch decomposition accelerated as the rootstock became more stressed, and soluble sugars accumulated in the leaves to maintain the osmotic potential of the leaf cells and enhance the resistance to adversity.
Water stress affects the photochemical reactions of leaves by photoinhibition, resulting in photooxidative stress as the leaves absorb more light energy than the plant can utilize, thus generating excess light energy [33,34,35,36,37,38,39]. It was found that Fv/Fm was significantly lower in T2 than in CK and T1 at both water stresses (Table 7). This demonstrates that the loss of photosynthetic machinery, chlorophyll degradation, and reduced heat dissipation capacity of seedling leaves under T2 impeded photosynthetic electron transfer, leading to a decrease in photosynthetic rate, in agreement with the findings of Zhao et al. [40]. After the release of stress, Fv/Fm of both T1 and T2 appeared lower than that of CK (Figure 9), which may have been caused by the preferential supply of nutrients to the new shoots sprouting at 42 d (Figure 4).
Chlorophyll is the main pigment for photosynthesis in plants, and under normal conditions, SPAD values in plants increase gradually throughout the growth process of plants [41]. This experiment showed that significant or highly significant differences were observed among the SPAD values of all treatments at both water stresses (Table 8), indicating that the amount of chlorophyll content had a direct bearing on the rate of light energy conversion and the formation of photosynthetic products under water stress conditions. With the decrease of chlorophyll content, the photosynthesis of plants also decreased. However, after the second water stress was lifted, the SPAD values of T2 were significantly lower than those of CK (Figure 9, Table 8). This is consistent with the findings of Musa et al. [42] and Cristiane et al. [43] and may be caused by the preferential supply of nutrients to the new shoot germination after the second water stress.
In this experiment, changes in the physiological parameters of apple rootstock leaves under water stress were investigated, and the data were statistically analyzed using principal component analysis. The results showed that the initial stress was imprinted on the plants, which could directly affect their response to the second stress [44,45]. The resistance to the second water stress was improved after the first stress, although some relevant physiological parameters of the leaves were notably affected by the previous water stress. The physiological parameters of plants with short-term T1 could recover rapidly, even to the level before the stress; this observation agrees with the findings of Walter et al. [46] and Galle et al. [47].

5. Conclusions

According to the experimental results, the first water stress had a greater effect on the plant than the second water stress. The high-frequency resistance, relative chlorophyll content, and maximum photochemical efficiency of the leaves were important parameters for apple rootstocks that were affected by water stress. The effect of T2 was greater than that of T1, and short-term (7 d) T1 did not affect plant growth, but rather facilitated the accumulation of dry matter, which can be used in production to promote plant growth and to harden off plants for flooding resistance.

Author Contributions

Planning, J.Q., X.Y. and P.Z.; writing—original draft preparation, P.Z. and W.Y.; sampling and data collection, P.Z. and W.Y.; data analysis and result interpretation, P.Z., W.Y., B.D., Y.M. and J.S.; writing—review and editing, all authors. All authors have read and agreed to the published version of the manuscript.

Funding

This research was supported by grants from the China Agriculture Research System (CARS-27). The funding organizations provided financial support to the research projects but were not involved in the design of the study, data collection, analysis of the data, or writing of the manuscript.

Institutional Review Board Statement

Not applicable.

Informed Consent Statement

Not applicable.

Data Availability Statement

The datasets generated during and/or analyzed during the current study are not publicly available because of [REASON(S) WHY DATA ARE NOT PUBLIC] but are available from the corresponding author on reasonable request.

Acknowledgments

We would like to thank Zhang Gang for his guidance on the research direction, Liu Yu for her help in the details of the experiment, and Li Xiao and Zhang Yu for their extensive participation in the experiment.

Conflicts of Interest

The authors declare no conflict of interest.

Abbreviations

T1: waterlogged; T2: flooded; CK: control; Nm: normal maintenance period; Wt: water stress period; LWC: leaf water content; EIS: electrical impedance spectroscopy; r: high-frequency resistance; r1: low-frequency resistance; REL: rate of electrolyte leakage; Fv/Fm: maximum photochemical efficiency; SPAD: relative chlorophyll content; PCA: principal component analysis.

References

  1. Qiang, X.M.; Li, X.H.; Li, J. Under the New Situation, China’s Apple Industry Develops with the High Quality; Northwest Horticulture: Harbin, China; Mabton, WA, USA, 2021; pp. 6–8. [Google Scholar]
  2. Chen, X.S.; Han, M.Y.; Su, G.L.; Liu, F.Z.; Guo, G.N.; Jiang, Y.M.; Mao, Z.Q.; Peng, F.T.; Shu, H.R. Discussion on today’s world apple industry trends and the suggestions on sustainable and efficient development of apple industry in China. J. Fruit Sci. 2010, 27, 598–604. [Google Scholar] [CrossRef]
  3. Zheng, Y.; Li, H.K.; Zhang, T.R.; Yang, J.F.; Zang, R.Q.; Zhang, Y.Y.; Wang, L.C. Effects of Black Ground Fabric Micro-ridge Mulching on Root Zone Soil Moisture of Dwarf Apple. Acta Agric. Boreali-Occident. Sin. 2019, 8, 631–640. [Google Scholar] [CrossRef]
  4. Jackson, R.B.; Sperry, J.S.; Dawson, T.E. Root water uptake and transport: Using physiological processes in global predictions. Trends Plant Sci. 2000, 5, 482–488. [Google Scholar] [CrossRef]
  5. Zheng, F.; Sun, C.; Li, J.P. Climate Change: New Dimensions in Disaster Risk, Exposure, Vulner ability, and Resilience. Clim. Chang. Res. 2012, 8, 79–83. [Google Scholar] [CrossRef]
  6. Gao, L.Y.; Li, H.Q.; Chen, T.; Shen, Y.X.; Ren, C.M. Advances in plant response to waterlogging. J. Grassl. Forage Sci. 2010, 2, 1–5. [Google Scholar] [CrossRef]
  7. Kozlowski, T.T.; Kramer, P.J.; Pallardy, S.G. The physiological ecology of woody plants. Tree Physiol. 1991, 8, 213. [Google Scholar] [CrossRef]
  8. Gu, X.B.; Xue, L.; Lu, L.H.; Song, G.H.; Xie, M.; Zhang, H.Q. Characteristics of the response of Actinidia polygama to long-term waterlogging stress. J. Fruit Sci. 2019, 36, 327–337. [Google Scholar] [CrossRef]
  9. Yan, F.F. Study on the Response of Apple Dwarf Rootstock to Water Stress; Baoding Agricultural University of Hebei: Baoding, China, 2010. [Google Scholar]
  10. Guo, A.X.; Shi, X.J.; Wang, Y.X.; Hu, Y.; Zhu, Y.F. Effect of drought stress on the photosynthesis, chloroplast ultrastructure and antioxidant system in leaves of three apple rootstocks. Agric. Res. Arid Areas 2019, 37, 178–186. [Google Scholar] [CrossRef]
  11. Bai, D.F.; Li, Z.; Qi, X.J.; Chen, J.Y.; Gu, H.; Huang, W.Q.; Ren, J.J.; Zhong, Y.P.; Fang, J.B. Physiological responses and tolerance evaluation of four species of Actinidia to waterlogging stress. J. Fruit Sci. 2019, 36, 163–173. [Google Scholar] [CrossRef]
  12. Du, X.M.; Yang, Y.Z.; Gao, J.D.; Wang, Q.; Cai, H.C.; Li, C.Y. Advances of Effect of Apple Rootstocks on Grafted Varieties. Acta Agric. Boreali-Occident. Sin. 2020, 29, 1–8. [Google Scholar]
  13. Mao, K.; Dong, Q.; Li, C.; Liu, C.; Ma, F. Genome Wide Identification and Characterization of Apple bHLH Transcription Factors and Expression Analysis in Response to Drought and Salt Stress. Front. Plant Sci. 2017, 8, 480. [Google Scholar] [CrossRef] [PubMed] [Green Version]
  14. Sharma, S.A.N.J.E.E.V.; Sharma, N. Effect of rootstocks on leaf water potential, water relations, antioxidant activities and drought tolerant in flemish beauty pear under water stress conditions. Indian J. Plant Physiol. 2008, 13, 266–271. [Google Scholar] [CrossRef]
  15. Xu, Q.H.; Li, Z.; Xu, K.; Wang, K.; Yang, F.; Cheng, C.G. Effects of continuous drought stress and rehydration on osmotic regulation of three apple rootstocks. China Fruits 2010, 3, 17–22. [Google Scholar] [CrossRef]
  16. Li, Y.; Du, Y.P.; Fu, Y.D.; Heng, D. Physiological Responses of Waterlogging on Different Rootstock Combinations of Cabernet Sauvignon Grape. Acta Hortic. Sin. 2013, 40, 2105–2114. [Google Scholar] [CrossRef]
  17. Zhao, S.J. Plant Physiology Experiment Guidance M; China Agricultural Science and Technology Press: Beijing, China, 1998; Volume 10. [Google Scholar]
  18. Li, H.S. Modern Plant Physiology, 3rd ed.; M. Life World, Higher Education Press: Beijing, China, 2012; Volume 11, p. 2. [Google Scholar]
  19. Zhang, X.Z. Experimental Techniques in Plant Physiology; Liaoning Science and Technology Press: Shenyang, China, 1994. [Google Scholar]
  20. Zhao, J.; Chen, S. Identification of the Ore-Forming Anomaly Component by MSVD Combined with PCA from Element Concentrations in Fracture Zones of the Laochang Ore Field, Gejiu, SW China. J. Earth Sci. 2021, 32, 427–438. [Google Scholar] [CrossRef]
  21. Jia, L.; Qin, X.; Lyu, D.; Qin, S.; Zhang, P. ROS production and scavenging in three cherry rootstocks under short-term waterlogging conditions. Sci. Hortic. 2019, 257. [Google Scholar] [CrossRef]
  22. Man Cuso, S.; Rinaldelli, E. Response of young mycorrhizal and non-mycorrhizal Plants of olive tree (Olea European L.) to saline conditions. Dynamics of electrical impedance Parameters of shoots and leaves. Adv. Hortic. Sci. 1996, 10, 126–134. [Google Scholar]
  23. Deng, X.; Chen, X.B.; Long, S.H.; Qiu, C.S.; Guo, Y.; Hao, D.M.; Wang, Y.F. Effects of water stress on physiology and dry matter accumulation of flax (Linum usitatissimum L.) seedling. Chin. J. Oil Crop. Sci. 2015, 37, 846–851. [Google Scholar]
  24. Wang, H.Z.; Liang, Z.S.; Han, X.L.; Han, L. Effect of soil drought on seedling growth and dry matter allocation of four native tree species on Loess Plateau. J. Plant Resour. Environ. 2005, 14, 10–15. [Google Scholar] [CrossRef]
  25. Ziegler, V.H.; Ploschuk, E.; Weibel, A.; Insausti, P. Short-term responses to flooding stress of three Prunus rootstocks. Sci. Hortic. 2017, 224, 135–141. [Google Scholar] [CrossRef]
  26. Lilley, J.M.; Ludlow, M.M. Expression of osmotic adjustment and dehydration tolerance in diverse rice lines. Field Crop. Res. 1996, 48, 185–197. [Google Scholar] [CrossRef]
  27. Qiu, L.I.U.; Zhihui, L.I.; Jiyou, W.U. Research Progress on Leaf Anatomical Structures of Plants under Drought Stress. Agric. Basic Sci. Technol. 2016, 17, 4–7. [Google Scholar] [CrossRef]
  28. Yin, D.M.; Chen, S.M.; Chen, F.D.; Guan, Z.Y.; Fang, W.M. Morpho-anatomical and physiological responses of two Dendranthema species to waterlogging. Environ. Exp. Bot. 2010, 68, 122–130. [Google Scholar] [CrossRef]
  29. Masoumi, A.; Kafi, M.; Nabati, J.; Khazaei, H.R.; Davari, K.; Zare Mehrgerdi, M. Effect of Drought Stress on Leaf Water Status, Electrolyte Leakage, Photosynthesis Parameters and Chlorophyll Fluorescence of Two Kochia Ecotypes (Kochia scoparia) Irrigated with Saline Water. Pizhūhishhā-yi zirā̒ī-i Īrān. Iran. J. Field Crop. Res. 2012, 10, 476–484. [Google Scholar] [CrossRef]
  30. Wang, H.B.; Miao, L.F.; Fan, Y. Effects of Prolonged Waterlogging Stress on Growth and Physiological Characteristics of Mango Seedlings. Nat. Sci. J. Hainan Univ. 2021, 39, 141–145. [Google Scholar] [CrossRef]
  31. Liu, Y.L.; Tang, X.B.; Li, L.Z. Effects of waterlogging stress on solute and Starch contents in Ginkgo biloba leaves. J. Hubei Agric. Mech. 2009, 5, 60–61. [Google Scholar] [CrossRef]
  32. Meng, Y.; Lu, B.; Zhang, G. Correlation of contents of soluble sugar and starch in leaves and stems of white birch under waterlogging and flooding stresses. J. For. Ecol. Sci. 2018, 33, 50–55. [Google Scholar]
  33. Desotgiu, R.; Pollastrini, M.; Cascio, C.; Gerosa, G.; Marzuoli, R.; Bussotti, F. Chlorophyll a fluorescence analysis along a vertical gradient of the crown in a poplar (Oxford clone) subjected to ozone and water stress. Tree Physiol. 2012, 32, 976–986. [Google Scholar] [CrossRef] [PubMed] [Green Version]
  34. Lunch, C.K.; LaFountain, A.M.; Thomas, S.; Frank, H.A.; Lewis, L.A.; Cardon, Z.G. The xanthophyll cycle and NPQ in diverse desert and aquatic green algae. Photosynth. Res. 2013, 115, 139–151. [Google Scholar] [CrossRef]
  35. Rappaport, F.; Béal, D.; Joliot, A.; Joliot, P. On the advantages of using green light to study fluorescence yield changes in leaves. Biochim. Biophys Acta 2007, 1767, 56–65. [Google Scholar] [CrossRef] [PubMed] [Green Version]
  36. Lazár, D. Chlorophyll a fluorescence induction. Biochim. Biophys. Acta 1999, 1412, 1–28. [Google Scholar] [CrossRef] [Green Version]
  37. Turan, M.A.; Katkat, V.; Taban, S. Variations in Proline, Chlorophyll and Mineral Elements Content of Wheat Plants Grown under Salinity Stress. J. Agron. 2007, 6, 137–141. [Google Scholar] [CrossRef] [Green Version]
  38. Hussain, M.I.; Reigosa, M.J. Allelochemical stress inhibits growth, leaf water relations, PSII photochemistry, non-photochemical fluorescence quenching, and heat energy dissipation in three C3 perennial species. J. Exp. Bot. 2011, 62, 4533–4545. [Google Scholar] [CrossRef]
  39. Huang, W.; Zhang, S.B.; Cao, K.F. Stimulation of Cyclic Electron Flow during Recovery After Chilling-Induced Photoinhibition of PSII. Plant Cell Physiol. 2010, 51, 1922–1928. [Google Scholar] [CrossRef] [PubMed] [Green Version]
  40. Zhao, B.Q.; Ren, P.; Xu, Z.S. Effects of Water Stress on Photosynthetic Characteristics and Yield Formation in Oats (Avena sativa L.) with Different Drought Resistance. J. Triticeae Crop. 2020, 40, 1399–1407. [Google Scholar]
  41. Ueki, K.; Iwamori, H. Geochemical differentiation processes for arc magma of the Sengan volcanic cluster, Northeastern Japan, constrained from principal component analysis. Lithos 2017, 290–291. [Google Scholar] [CrossRef]
  42. Seymen, M. How does the flooding stress occurring in different harvest times affect the morpho-physiological and biochemical characteristics of spinach? Sci. Hortic. 2021, 275. [Google Scholar] [CrossRef]
  43. Da-Silva, C.J.; do Amarante, L. Time-course biochemical analyses of soybean plants during waterlogging and reoxygenation. Environ. Exp. Bot. 2020, 180. [Google Scholar] [CrossRef]
  44. Zhang, X.Y.; Li, T.; Tan, G.F.; Huang, Y.; Wang, F.; Xiong, A.S. Effects of dark treatment and regular light recovery on the growth characteristics and regulation of chlorophyll in water dropwort. Plant Growth Regul. Vol. 2018, 85, 293–303. [Google Scholar] [CrossRef]
  45. Bruce, T.J.; Matthes, M.C.; Napier, J.A.; Pickett, J.A. Stressful “memories” of plants: Evidence and possible mechanisms. Plant Sci. 2007, 173, 603–608. [Google Scholar] [CrossRef]
  46. Walter, J.; Nagy, L.; Hein, R.; Rascher, U.; Beierkuhnlein, C.; Willner, E.; Jentsch, A. Do plants remember drought? Hints towards a drought-memory ingresses. Environ. Exp. Bot. 2011, 71, 34–40. [Google Scholar] [CrossRef]
  47. Gallé, A.; Haldimann, P.; Feller, U. Photosynthetic performance and water relations in young pubescent oak (Quercus pubescens) trees during drought stress and recovery. New Phytol. 2007, 174, 799–810. [Google Scholar] [CrossRef] [PubMed]
Figure 1. Satellite map of the test area.
Horticulturae 07 00331 g001
Figure 2. Changes in meteorological factors in the experimental area during the trial period: 1 d is 8 July, Wt (shaded part) is the water stress periods, and Nm is the normal maintenance periods.
Horticulturae 07 00331 g002
Figure 3. Determination of the electrical impedance spectroscopy (EIS).
Horticulturae 07 00331 g003
Figure 4. The changes in plants during the experiment when water stress was applied and after the stress was lifted. CK is the control, T1 is waterlogged, T2 is flooded, and defoliation and sprouting are marked by ellipses.
Horticulturae 07 00331 g004
Figure 5. Leaf water content variation curves. CK is control, T1 is waterlogged, and T2 is flooded; 1 d is 8 July, Wt (shaded part) is the water stress periods, and Nm is the normal maintenance periods.
Horticulturae 07 00331 g005
Figure 6. Variation curves of leaf high-frequency resistance r (A) and low-frequency resistance r1 (B). CK is control, T1 is waterlogged, and T2 is flooded; 1 d is 8 July, Wt (shaded part) is the water stress periods, and Nm is the normal maintenance periods.
Horticulturae 07 00331 g006
Figure 7. REL variation curves. CK is control, T1 is waterlogged, and T2 is flooded; 1 d is 8 July, Wt (shaded part) is the water stress periods, and Nm is the normal maintenance periods.
Horticulturae 07 00331 g007
Figure 8. Leaf starch content (A) and soluble sugar content (B) variation curves. CK is control, T1 is waterlogged, and T2 is flooded; 1 d is 8 July, Wt (shaded part) is the water stress periods, and Nm is the normal maintenance periods.
Horticulturae 07 00331 g008
Figure 9. Leaf maximum photochemical efficiency Fv/Fm variation curves. CK is control, T1 is waterlogged, and T2 is flooded; 1 d is 8 July, Wt (shaded part) is the water stress periods, and Nm is the normal maintenance periods.
Horticulturae 07 00331 g009
Figure 10. Variation curves of relative chlorophyll content. CK is control, T1 is waterlogged, and T2 is flooded; 1 d is 8 July, Wt (shaded part) is the water stress periods, and Nm is the normal maintenance periods.
Horticulturae 07 00331 g010
Table 1. Significant difference analysis of leaf water content of apple rootstocks under interval water stress.
Pairwise Comparison Process Time
1 d3 d5 d7 d14 d29 d31 d33 d35 d42 d
T1–CK0.2600.1220.1110.6780.1590.2150.2330.018 *0.027 *0.078
T2–CK0.3030.000 **0.000 **0.000 **0.003 **0.0510.3920.0630.000 **0.011 *
T1–T20.0560.000 **0.000 **0.000 **0.0760.4520.7300.5750.034 *0.381
*, statistically significant and p < 0.05; **, statistically highly significant and p < 0.01; CK is the control, T1 is waterlogged, and T2 is flooded.
Table 2. Significant difference analysis of high-frequency resistance r of apple rootstock leaves under interval water stress.
Pairwise Comparison Process Time
1 d3 d5 d7 d14 d29 d31 d33 d35 d42 d
T1–CK0.7270.025 *0.9920.6200.015 *0.5260.033 *0.4720.039 *0.310
T2–CK0.7910.6550.3250.010 ** 0.4620.7020.1100.6750.2090.971
T1–T20.5390.0660.3300.033 *0.0790.3120.5600.2580.3930.293
*, statistically significant and p < 0.05; **, statistically highly significant and p < 0.01; CK is the control, T1 is waterlogged, and T2 is flooded.
Table 3. Significant difference analysis of low-frequency resistance r1 of apple rootstock leaves under interval water stress.
Pairwise Comparison Process Time
1 d3 d5 d7 d14 d29 d31 d33 d35 d42 d
T1–CK0.6490.049 *0.5930.7310.0920.0510.1760.1480.0990.385
T2–CK0.4930.6580.3080.1170.5180.4480.0740.8380.019 *0.486
T1–T20.8160.022 *0.6220.2160.2870.2050.6450.2110.4470.122
*, statistically significant and p < 0.05; CK is the control, T1 is waterlogged, and T2 is flooded.
Table 4. Significant difference analysis of REL of apple rootstock leaves under interval water stress.
Pairwise Comparison Process Time
1 d3 d5 d7 d14 d29 d31 d33 d35 d42 d
T1–CK0.3460.006 **0.4030.5960.1710.8080.3240.8420.5170.759
T2–CK0.5740.046 *0.6000.002 **0.2050.8840.8230.3680.8900.597
T1–T20.7000.4010.7530.007 **0.9150.9220.4440.4810.6090.862
*, statistically significant and p < 0.05; **, statistically highly significant and p < 0.01; CK is the control, T1 is waterlogged, and T2 is flooded.
Table 5. Significant difference analysis of leaf starch content of apple rootstocks under interval water stress.
Pairwise Comparison Process Time
1 d3 d5 d7 d14 d29 d31 d33 d35 d42 d
T1–CK0.9890.036 *0.9890.8180.005 **1.0000.3960.3140.2060.281
T2–CK0.8410.023 *0.3730.4990.0640.8840.7630.8410.6870.009 **
T1–T20.8290.8630.3650.6560.3360.9220.5850.4210.3890.128
*, statistically significant and p < 0.05; **, statistically highly significant and p < 0.01; CK is the control, T1 is waterlogged, and T2 is flooded.
Table 6. Significant difference analysis of soluble sugar content of apple rootstock leaves under interval water stress.
Pairwise Comparison Process Time
1 d3 d5 d7 d14 d29 d31 d33 d35 d42 d
T1–CK0.4450.9580.005 **0.7710.7740.5780.1220.2040.1130.045 *
T2–CK0.9520.3270.2320.1250.0840.1200.024 *0.002 **0.000 **0.003 **
T1–T20.4100.3020.000 **0.0680.1500.3180.4750.0750.014 *0.350
*, statistically significant and p < 0.05; **, statistically highly significant and p < 0.01; CK is the control, T1 is waterlogged, and T2 is flooded.
Table 7. Significant difference analysis of Fv/Fm of apple rootstock leaves under interval water stress.
Pairwise Comparison Process Time
1 d3 d5 d7 d14 d29 d31 d33 d35 d42 d
T1–CK0.4110.8390.0200.1560.3450.0840.5320.9880.1550.908
T2–CK0.4030.3690.2100.020 *0.3620.9070.1050.9360.043 *0.820
T1–T20.1030.5910.0620.026 *0.9740.0620.4820.9480.5180.911
*, statistically significant and p < 0.05. CK is the control, T1 is waterlogged, and T2 is flooded.
Table 8. Significant difference analysis of leaf SPAD values of apple rootstocks under interval water stress.
Pairwise Comparison Process Time
1 d3 d5 d7 d14 d29 d31 d33 d35 d42 d
T1–CK0.3420.048 *0.0740.2510.8350.8410.2660.9840.3830.213
T2–CK0.1370.1370.6750.1490.2820.4150.6240.8930.028 *0.025 *
T1–T20.6620.5970.1640.013 *0.2020.5370.5300.8780.1660.288
*, statistically significant and p < 0.05; CK is the control, T1 is waterlogged, and T2 is flooded.
Table 9. Results of principal component analysis of apple rootstock leaf parameters under interval water stress.
ItemsPC1PC2PC3
Eigenvalue
Percentage of variance
Cumulative variance
2.154
26.92
26.92
1.397
17.46
44.38
1.043
13.03
57.42
Eigenvectors
LWC
r
r1
REL
Starch
Soluble sugar
Fv/Fm
SPAD
0.22
0.85
0.87
−0.30
−0.58
0.29
0.08
0.13
0.31
0.10
−0.06
0.68
−0.12
0.45
0.08
0.80
−0.41
0.08
0.01
0.05
0.30
−0.05
0.91
0.05
Publisher’s Note: MDPI stays neutral with regard to jurisdictional claims in published maps and institutional affiliations.

