Article

Interrelation of Ecophysiological and Morpho-Agronomic Parameters in Low Altitude Evaluation of Selected Ecotypes of Sweet Potato (Ipomoea batatas [L.] Lam.)

1
Corporación Colombiana de Investigación Agropecuaria—AGROSAVIA, Centro de Investigación Motilonia, Km 5 vía a Becerril, Agustín Codazzi 202050, Cesar, Colombia
2
Instituto de Investigaciones de Viandas Tropicales (INIVIT), Apartado 6, Santo Domingo CP 53 000, Villa Clara, Cuba
3
Corporación Colombiana de Investigación Agropecuaria—AGROSAVIA, Centro de Investigación Turipaná, Km 13 vía Montería, Cerete 230558, Colombia
*
Author to whom correspondence should be addressed.
Horticulturae 2020, 6(4), 99; https://doi.org/10.3390/horticulturae6040099
Submission received: 21 September 2020 / Revised: 31 October 2020 / Accepted: 2 November 2020 / Published: 10 December 2020

Abstract

:
Sweet potato is a crop with a wide capacity to adapt to adverse conditions. To study the tolerance of the sweet potato to a low-altitude environment, 34 genotypes comprising three groups from different altitude conditions ranging from 18–599, 924–1298, 1401–2555 meters above sea level were evaluated. These genotypes were evaluated through ecophysiological parameters: net photosintetic rate (Pn), stomatal conductance (GS), transpiration (E), leaf internal CO2 (ICO2), vapor pressure deficit (VPD) and leaf internal temperate (LT). sSubsequently, water use efficiency (WUE) and carboxylation efficiency index (CEI) were estimated. Simultaneously, morpho-agronomic characterization of the genotypes was conducted including descriptors and morpho-colorimetric parameters. A wide ecophysiological variability was found among genotypes from high, intermediate and low altitudes, when those were evaluated under low altitude conditions. The genotypes that presented major soil coverage efficiency and leaf size showed greater Pn, WUE and CEI, and Low VPD and E, aspects that benefited the ability to form roots the under low-altitude environment. The altitudinal origin of the genotypes influenced the ecophysiological response under low altitude conditions. The capacity of certain sweet potato genotypes to tolerate low altitude conditions were due to to different mechanisms, such as certain morphoagronomic traits that allowed them to adjust their physiological processes, especially those related to photosynthesis.

1. Introduction

Sweet potato (Ipomoea batatas (L.) Lam.) is a crop that generates edible energy in the form of storage roots with high nutritional content, mainly from carbohydrates [1]. Unlike other crops, where the development of the aerial part is important for productivity, in sweet potato, the determining morpho-physiological processes are mainly in the formation and development of storage roots that depend directly the carbohydrates translocation from the leaves to the roots [2,3,4], although in some countries the aerial part is also consumed [5].
The ontology of storage roots is determined by the process of cell division that generates an increase in cell number of this organ and by starch accumulation that represents 50–80% of the dry matter [2,6,7], possibly related to photosynthetic efficiency in the production of carbohydrates and, consequently, in the production of storage roots [4,8,9].
Different environmental factors affect photosynthetic efficiency in sweet potato, such as CO2 concentration [10] and water availability [9,11]. Sweet potato, as a C3 plant, has the advantage of responding positively to an increase of CO2 concentration in the environment, mainly due to its direct effect on photosynthesis and stomata physiology, generating in response a higher yield of storage roots [10]; however, this behavior is modulated by the availability of water.
Water deficit stress can have negative impacts on the photosynthetic efficiency of plants [12]. This process generates a decrease in the assimilation of CO2, a response that is associated with physiological parameters such as the net photosynthetic rate (Pn), stomatal conductance (Gs), transpiration (E) and intracellular CO2 (Ci) [1,9,10,11]. The roots are the first organ of the plant to perceive these signals, limiting the absorption and translocation of water from the sink to the source [2,4,9], directly affecting the mobilization of carbohydrates to the sink, causing a decrease in the formation of storage roots, and consequently, a decrease in crop yield [1,9].
The high plasticity of sweet potato plant is evidenced in its adaptation to several conditions; including adaption at different altitudes, from 0 to 3000 m above sea level (masl) [13,14]. This adaptation to contrasting environmental conditions is a trait of great interest due to its cultivation potential in various agro-ecological zones and at different ultraviolet-B radiation intensities [13,15,16,17]. The influence of altitude on the quality and quantity of radiation can affect photosynthetic efficiency [17,18], and possibly, starch storage in roots. The behavior of plants at different altitudes is conditioned by some environmental factors, such as accumulation of CO2 and ultraviolet-B radiation, which directly influence the photosynthetic process [19].
The sweet potato plant presents high rusticity and wide adaptation to adverse environmental conditions [20]. At the morphological level, a higher photosynthetic efficiency has been found in leaves with a low leaf surface area and a lower efficiency when the leaf blade increases in suze [21]. At the genetic level there is a potential for obtaining genotypes with the ability to generate favorable responses under stress conditions [6,21,22,23,24], showing that the behavior of the sweet potato cannot be generalized and will depend on the cultivar, environment and plant morphology and architecture. The objective of this research was to evaluate the tolerance of sweet potato genotypes from different altitudinal conditions to a low altitude environment. Their responses were estimated from ecophysiological, phenotypic (architecture and morphology) and agronomic parameters.

2. Materials and Methods

2.1. Plant Material

The plant material consitedof 34 sweet potato genotypes from 11 departments of Colombia, and whose collection site was between 18–2555 m above sea level (masl) (Table 1), belonging to the AGROSAVIA work collection. Genotypes that have been previously cultivated in the low altitude conditions, Agrosavia Ambarina and Aurora, were used as checks. The genotypes were grouped by three altitude intervals, High altitude (1401–2555 masl), Intermediate altitude (924–1298 masl) and Low altitude (18–599 masl).

2.2. Growth Conditions and Agronomic Management

The research was performed in an experimental field at Agustin Codazzi, Cesar, Colombia, with coordinates 10°0′7″ North and 73°14′51″ West, with an altitude of 104 masl. Climate conditions during the evaluation period are showed in Table 2.
The experimental field has a soil with a clay-silty texture, and pH 7.57. For establishment, mechanical land preparation and manual planting were done. Weed control was chemically using ammonium glyphosate, (5 L ha−1) and halosulfuron (150 g ha−1). For pest control, Fipronil (0.6 L ha−1) and Thiodicardb (1 L ha−1), Bayer, Colombia, were used. Supplementary fertilization was not used.

2.3. Experimental Design

A complete randomized design with three blocks was used, with each block corresponding to an experimental unit. The experimental units consisted of plots of 5 rows of 5 m length; and planting distance of 0.4 m between plants and 1 m between rows. For all sampling evaluations, three plants per genotype were used per block from the three central rows to avoid an edge effect.

2.4. Screening of Genotypes for Ecophysiological Parameters

Net photosynthetic rate (Pn), stomatal conductance (Gs), transpiration (E), internal leaf CO2 (ICO2), vapor pressure deficit (VPD) and internal leaf temperature (LT) were evaluated using a portable photosynthesis system (LI-COR, LI-6400XT, NE, USA) in the morning (08:00–11:00) under a fixed blue-red light-emitting diode (LED) light source. Later, the water use efficiency (WUE) was obtained through the ratioof Pn/E, and the carboxylation efficiency index (CEI) using the ratio Pn/ICO2 [25]. Three measurements were made for genotype on a fully expanded leaf, being the 4th or 5th leaf from apical meristem, at 120 days after planting (DAP). The equipment was calibrated to the evaluation conditions, through light and CO2 curves, obtaining the appropriate range of photosynthetically active radiation (PARi) of 1500 μmol of photons m−2 s−1 and a CO2 reference content of 400 μmol CO2 mol−1. These curves were optimized using the genotype Agrosavia Ambarina.

2.5. Morpho-Agronomical Characterization

Selected genotypes were characterized using 28 parameters describing plant architecture and morphology, which were evaluated 90 days after planting (DAP). For plant description, the parameters included: mature leaf color, immature leaf color, vine internode length, vine internode diameter, predominant vine color, secondary vine color, vine tip pubescence, mature leaf shape, leaf lobes type, leaf lobes number, shape of the central leaf lobe, mature leaf size, leaf width, petiole length, petiole pigmentation, abaxial leaf vein pigmentation, plant type, flowering habit and ground cover, length of the main vines, stem latex presence, petiole diameter, petiole pubescence and leaf pubescence; all the morphological parameters were characterized according to sweet potato descriptors [26]. Root production per plant (number and weight) was evaluated at 120 DAP.

2.6. Morpho-Colorimetric Measurements

RGB images from leaves were taken with a Canon EOS 600D camera configured with similar depth and sensor sensitivity settings for all genotypes. Light, exposition time and the distance between the specimen and the camera were controlled among the genotypes evaluated. Leaves from subapical shoot segment were dissected and photographed; shape descriptors such as area, perimeter, circularity, leaf roundness and leaf solidity were measured according to [27]. Color determination was carried out in a selected area (ROI) of the RGB images using a color measurement plug-in in image J (https://imagej.nih.gov/ij/).

2.7. Data Analysis

To group the genotypes according to altitude intervals, the TREE procedure of SAS software was used. To recognize the possible interaction between altitude and tuberization capacity, the genotypes were categorized in two groups, genotypes with storage roots or genotypes without storage roots. To analyze the factors (genotype, altitude and tuberization), analysis of variance was performed, with a two-way analysis with interaction effect for altitude and tuberization factors, and a one-way analysis for each factor was performed using R software. Tukey or Fisher’s LSD multiple comparison test were used for mean comparison among genotypes or groups (α = 0.05). Chi-squared tests were used for independence analysis of qualitative variables. To study the relationships between traits, linear Pearson and Spearman correlations were performed. In order to analyze simultaneously qualitative and quantitative physiological and morpho-agronomic variables, hierarchical clustering of variables was performed to reduce variable redundancy, to select and determine their correlated structure and similarity patterns though the ‘hclustvar’ function in the package ‘ClustOfVar’ compatible with the R software. A method based on the bootstrap approach was used to evaluate the stability of the partitions of variables and to determine a suitable number of clusters of variables (B = 50). Furthermore, six quantitative synthetic variables were stablished [24] and used in principal component analysis (PCA) to determine the genotype population structure based on altitude origin and tuberization capacity. PCA was performed using FactoMineR and factoextra packages of R software. R free software version 4.0.3 (R Foundation for Statistical Computing, Vienna, Austria) was used to perform all described analysis.

3. Results and Discussion

3.1. Diversity in Ecophysiological Parameters in Sweet Potato Ecotypes Evaluated under Low-Altitude Conditions

Sweet potato ecotypes collected from several altitude conditions showed a wide response in the tolerance to low altitude conditions. Genotype and altitude factors analyzed independently showed significant differences in some physiological parameters, the three intervals of altitude showed significant differences in Pn, E, VPD, WUE and CEI, while the genotype factor showed statistical differences for all ecophysiological traits (Table 3).
Through the categorization by altitudinal origin, the three groups presented a differential behavior. Genotypes from high altitude (1401–2555 masl) exhibited the lowest Pn, WUE and CEI, but the highest E and VPD compared with others altitude ranges. These values for physiological parameters, were possibly related to a minor tolerance to low altitude conditions (Table 4). Genotypes from the intermediate altitude range (924–1298 masl), exhibited intermediate values for Pn, WUE, CEI, E and VPD. Finally, the genotypes from the low altitude range (18–599 masl), showed the highest values for Pn, WUE and CEI, but conversely, they had the lowest values for E and VPD compared with the other altitude intervals. These results indicated that genotypes from this group presented a better physiological response under the low altitude conditions than the genotypes from the greater altitudes, possibly because they were from warm climate regions and had evolved mechanisms to tolerate low altitude conditions (104 masl). The broad adaptation of this species to different edaphoclimatic conditions [13], and the results obtained in this study, suggested that the species has wide variability to tolerate low altitude conditions and the physiological adaptation of low altitude genotypes indicated higher trait value in comparison with genotypes from other altitudinal ranges.
Regarding the ecophysiological diversity of the characterized genotypes, net photosynthetic rate (Pn) had a range between 21 and 33 µmol CO2 m−2 s−1. The genotypes 0715-076.CES (599 masl), 0516-357.QND (1298 masl) and Agrosavia Ambarina (18 masl) presented the highest values, with 33.04, 32.47 and 31.09 µmol CO2 m−2 s−1, respectively (Table 4), while 0816-615.STR (1426 masl) and 0516-503.CLD (1749 masl), genotypes from high altitude, presented the lowest averages (21 µmol CO2 m−2 s−1). Most of the values among genotypes were within the range reported for C3 plants [28,29]; however, the wide range in this study associated with differences between sweet potato ecotypes used in the study. Previous studies observed Pn values below 20 µmol CO2 m−2 s−1, in sweet potato genotypes subjected to water stress [9,11,30]. The values found in our study showed that the evaluation conditions guaranteed anoptimal physiological state of the evaluated ecotypes. High values of Pn in genotypes from low and intermediate altitudes may indicate a high potential of tolerance to low altitude conditions and possibly to low water availability, since these conditions cause stomatal closure, reduction of Pn and affect the translocation of assimilates to roots. The growth habit of the plant in certain genotypes alloweds it to maintain humidity in the soil, a morphological adaptation that, in turn, would allow it to improve the water status of the plant, modifying the opening and closing of stomata, transpiration and assimilation [31,32].
Stomatal conductance (Gs) is a parameter that relates the number and degree of stomatal opening [33]. A range of variation for Gs was between 0.88–1.95 mol H2O m−2 s−1. The genotypes 0316-256.STR (924 masl), 0816-620.STR (521 masl) and 0816-587A.BOY (2060 masl) presented an average higher than 1.90 mol H2O m−2 s−1, while the genotypes 0816-615.STR (1426 masl) and 0516-503.CLD (1749 masl) showed an average lower than 0.92 mol H2O m−2 s−1. The values found were similar to those exhibited in genotypes subjected to a level of humidity close to the field capacity, since less soil humidity induces the closure of stomata and the values found under these conditions are below 0.8 mol H2O m−2 s−1 [34,35]. However, certain sweet potato genotypes are capable of controlling the osmotic potential in the leaves through different mechanisms that regulate stomatal opening through an increase in proline levels, thus, avoiding a decrease in Pn and Gs [9,36] and unnecessary water loss through transpiration. Although a broad response was found in the stomatal conductance of the evaluated ecotypes, their adequate tolerance was evidenced regardless of their altitudinal origin.
The concentration of intercellular CO2 fixed by plants (ICO2) influences photosynthesis. The genotypes evaluated presented values between 271.01–312.32 μmol CO2 mol−1, some being congruent with previous studies [37], which described values between 231 and 296 μmol CO2 mol−1. The genotypes that exhibited the highest ICO2 values may indicate a greater capacity for CO2 entry, due to a greater stomatal conductance. However, this result did not generate any increase in Pn, probably because C3 species can have a saturation effect on Rubisco, decreasing its activation state and equilibrium [10,36,37].
Transpiration (E) corresponds to the flow of water, in the form of vapor, generated between the plant and the atmosphere [38,39]. There were wide differences in E among the genotypes, those from a high altitude 0816-581.BOY (1689 masl), 0316-263.STR (1650 masl) and 0516-491.CLD (1899 masl), presented the highest values (14.9, 14.8 and 14.1 mmol H2O m−2 s−1, respectively); the lowest values were around 8.74–10.52 mmol H2O m−2 s−1, in genotypes from intermediate and low altitude Agrosavia Ambarina (18 masl), 0113-660.VAL (1000masl) and 0113-668.VAL (1000 masl). Previous studies reported values between 4 and 17 mmol H2O m−2 s−1 in two varieties of sweet potato subjected to different regimes of soil moisture, the highest values with a higher soil moisture content [34]. Different humidity regimes may influence this trait [40]. The wide diversity found among evaluated genotypes was consistent with the differing responses that can be found between different genotypes [1]. However, the differential response of genotypes from high altitude showing higher values compared with the genotypes from other altitudinal intervals suggested their lower adaptation to low altitude conditions, since the adapted genotypes exhibited lower values.
Vapor pressure deficit (VPD) is high when plants close stomata to avoid excessive water loss [41], sometimes negatively affecting photosynthesis and yield, due to the increase in stomatal resistance. 0816-615.STR (1426 masl) and 0516-503.CLD (1749 masl), genotypes from a high altitude, presented the highest VPD values (1.96 and 1.92 kPa, respectively), and were the genotypes with the lowest Pn. Moreover, the genotype that presented the highest Pn (0715-076.CES, 599 masl) had an intermediate VPD value (1.35 kPa), indicating adequate adaptation of genotypes from low altitude to low altitude evaluation conditions and an ability to keep the plant water content in balance, with an intermediate conductance and transpiration.
Variable responses for leaf internal temperature (LT) was found among the genotypes, with values between 30.54–35.27 °C. Genotype 0715-076.CES (599 masl) presented the highest LT (35.27 °C), and simultaneously exhibited the highest Pn (33.04 µmol CO2 m−2 s−1). Although it has been reported that temperatures around 35 °C influence the reduction of the enzymatic capacity of Rubisco [42], the results in this investigation indicated that there was no negative effect on Pn with the increase in LT among the genotypes. This process is favorable because the plant will not invert the water reserves, under conditions of water deficit, to reduce the leaf temperature [43]. This response differs from that reported in another C3 species (cassava Manihot esculenta), in which an increase in leaf temperature reduced photosynthesis [43].
Water use efficiency (WUE) represents a characteristic of great interest in plants, allowing the use of this resource in a regulated way under conditions of soil water deficit [44]. The genotypes with the highest WUE exceeded the value of 1.5 µmol CO2/mmol H2O, which corresponded to the highest value found in sweet potato genotypes in previous reports [45], indicating more efficient water use in genotypes from intermediate and low altitudes. The genotypes with the highest WUE were Agrosavia Ambarina (18 masl), 0113-668.VAL (1000 masl) and 0113-660.VAL (1000 masl). WUE was a variable that was related to E, and among the genotypes with the best response for WUE were the same genotypes with low E values, which showed the ability of these genotypes to fix the necessary CO2, using the available water efficiently and decreasing transpiration process.
The carboxylation efficiency index (CEI) was estimated using the relationship between Pn and ICO2. The genotypes from intermediate and low altitudes 0715-076.CES (599 masl) and 0516-357.QND (1298 masl) were the most efficient according to the CEI, with values of 0.1183 and 0.1175, respectively. The least efficient genotype was a genotype from high altitude, 0516-503.CLD (1749 masl) with 0.0737. Efficiency in the carboxylation process may be associated with the ability of Rubisco to increase its affinity for CO2 fixation with respect to intracellular O2 and, thus, reduce photorespiration rates and increase Pn [25,46]. Consistently, the genotypes that presented the highest Pn reached the highest values for CEI also. This ecophysiological characterization revealed a wide variability between the sweet potato genotypes from different altitude (18 to 2555 masl). In general, the genotypes from low and intermediate altitudes showed a better physiological response, which was confirmed by their high Pn and CEI and low VPD, while only some genotypes from higher altitudes showed such responses.

3.2. Relationship among Ecophysiological Parameters in Sweet Potato

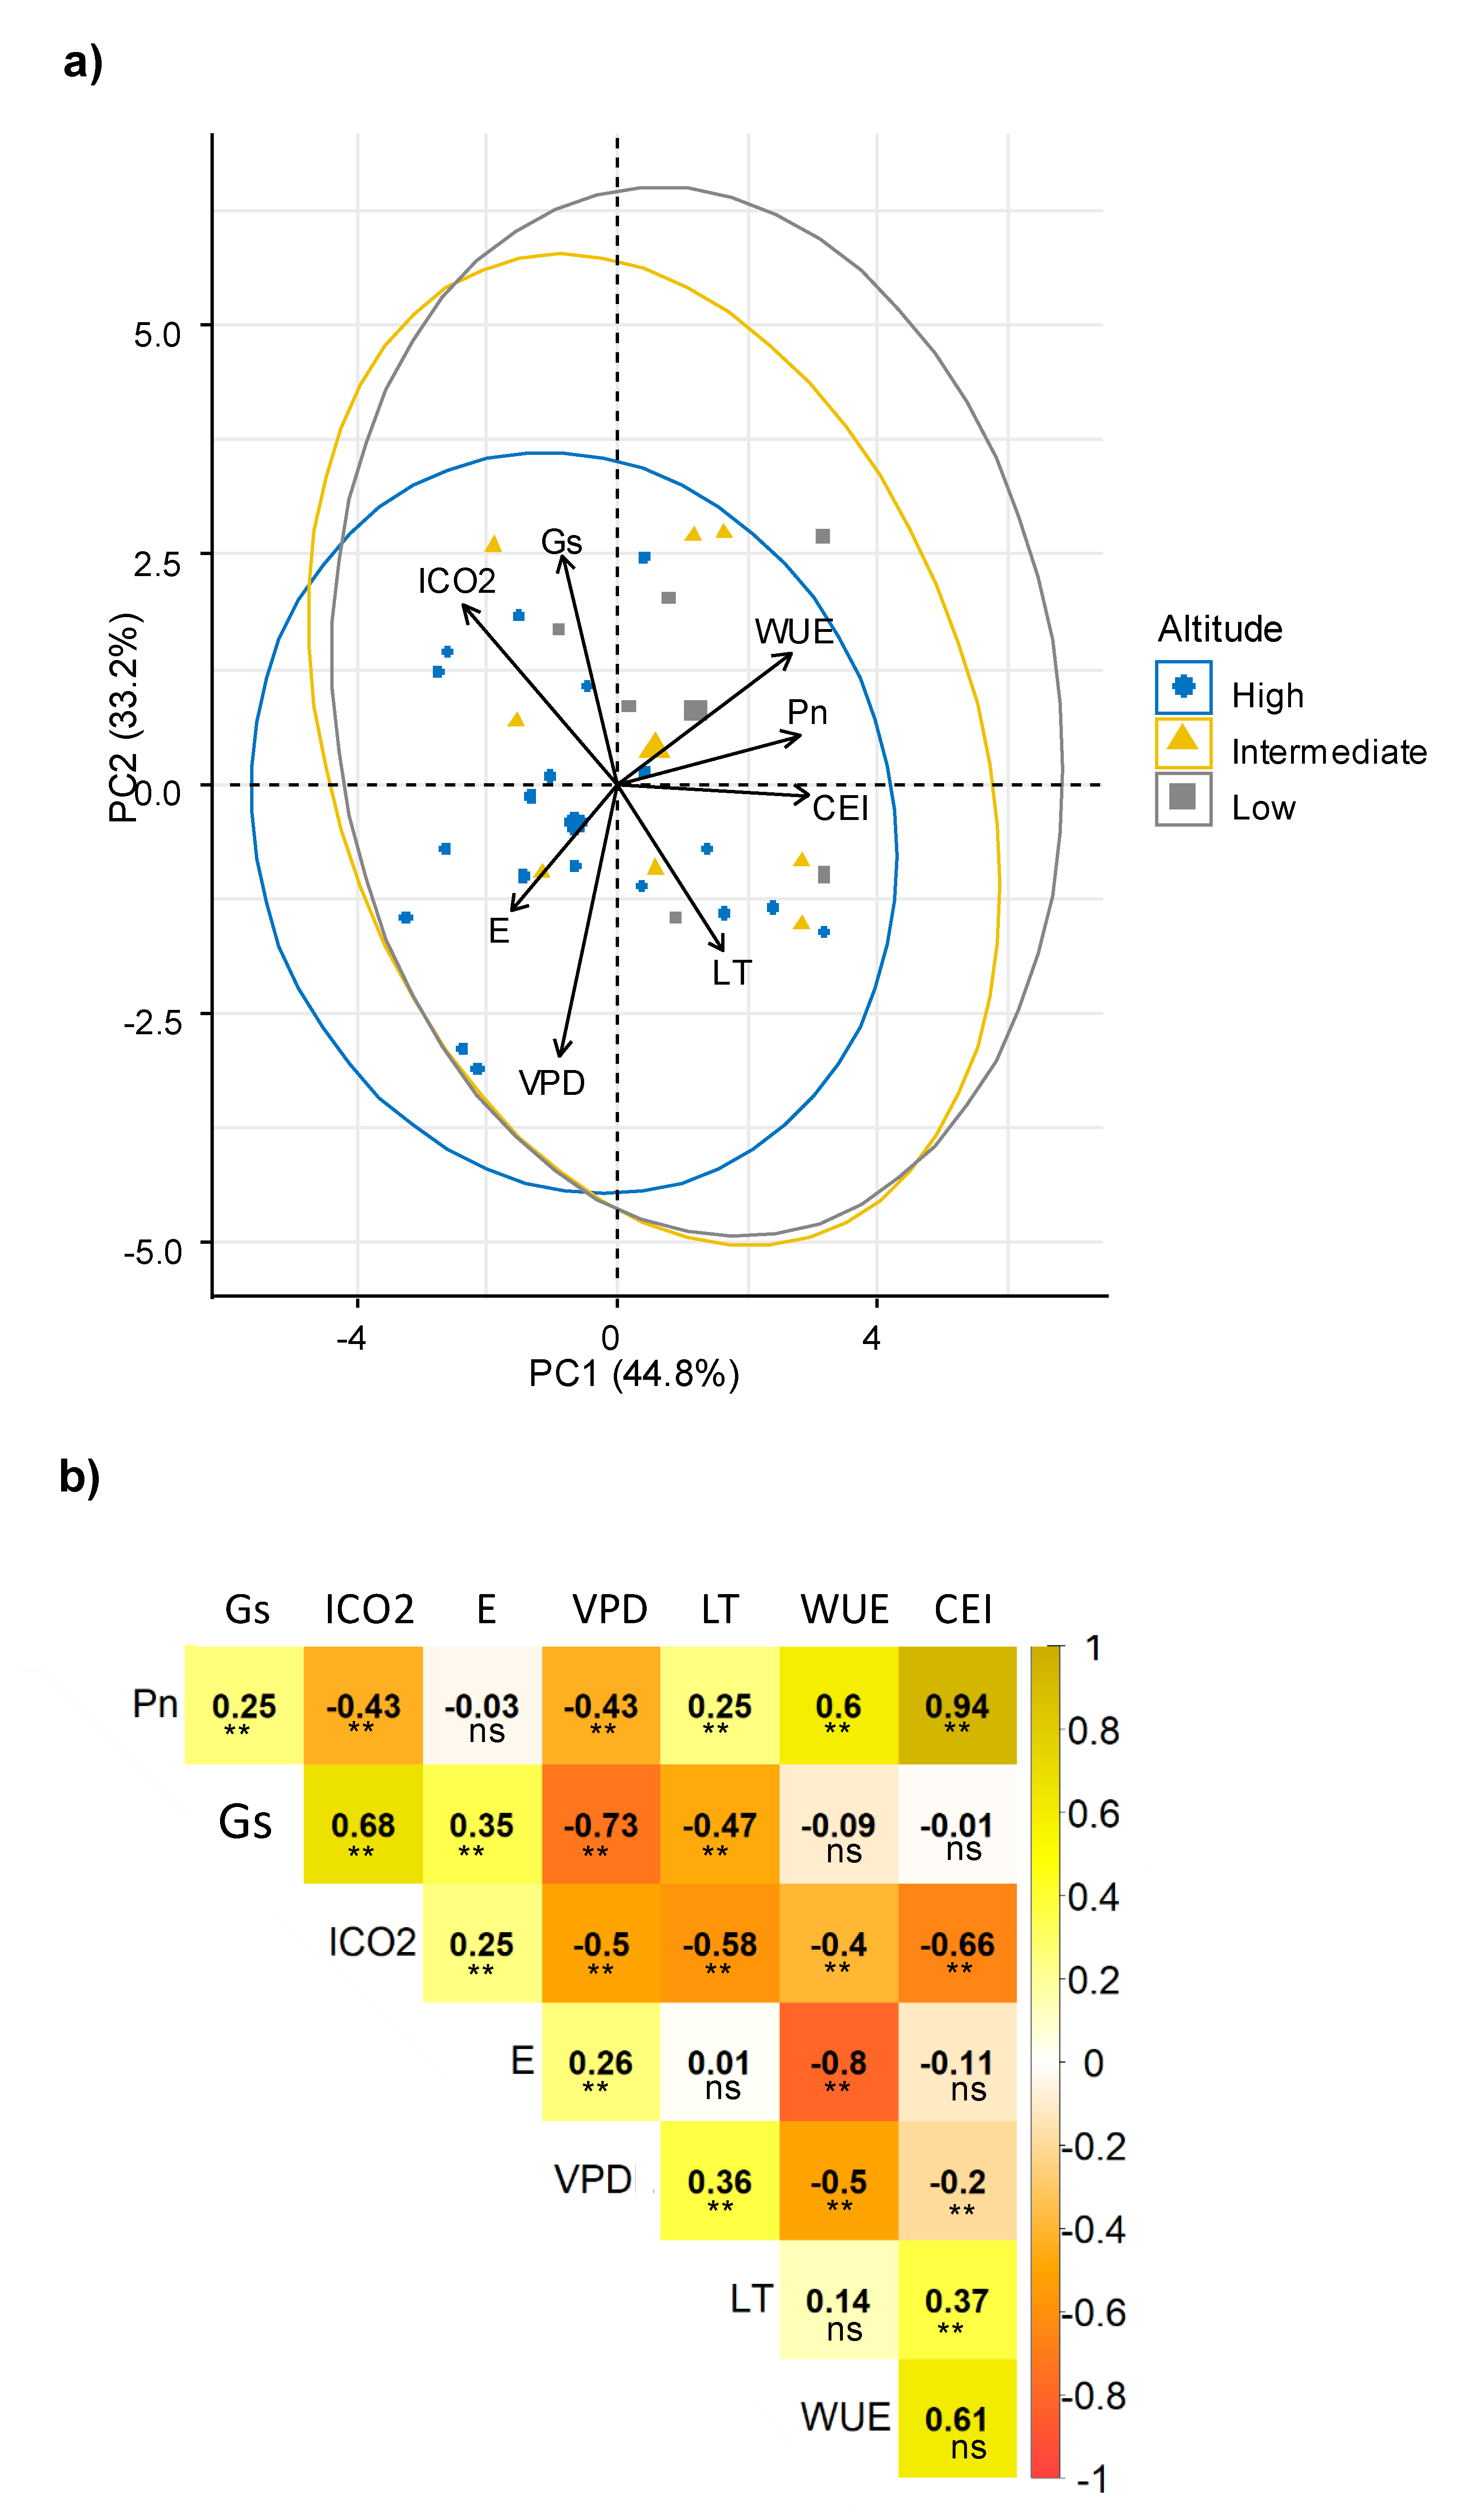
Multivariate analysis determined relationships among physiological traits that although highly variable among the genotypes, indicated two principal components (PC) explained 78% of all variation. Consistently, a relationship among WUE, Pn and CEI was observed (Figure 1a); all of these parameters were related to the efficiency of the photosynthetic process, and including a third PC (PC3 explained 15.17%), the component matrix indicated that CEI, Pn and WUE were the most important traits for PC1 (Supplementary materials Table S1). Another potential relationship was observed between Gs and ICO2, and between E and VPD.
The interrelations among physiological traits were confirmed by correlation analysis (Figure 1b). Consistently, Pn had a direct correlation with WUE. WUE is considered a key mechanism that allows a reduction in water loss and increase in CO2 assimilation. Therefore, it is a desirable trait that indicates good adaptation and greater plasticity of the genotypes [47,48]. The positive significant correlation between Gs with ICO2 confirmed the association previously described. A high content of ICO2 is a result of an increase in Gs, and, consistently with its negative correlation, can simultaneously reduce VPD [41], Pn, WUE and CEI [47,49]. A greater Gs allows an increase in the flux of CO2 into the plant and can affect transpiration rates and subsequently, the Pn process, as previously reported [10,47,49,50,51]. However, a significant reduction of ICO2 can also reduce Pn [47].
Regarding the relationship between E and VPD, the positive correlation indicated that there was an increase of E, until a maximum limit of VPD (values below 2 kpa); then, E was reduced. In fact, when the VPD increases, stomata are forced to close to protect the plant from dehydration [41]. In contrast, an inverse relation between VPD and Gs was observed; an expected response due to VPD increase, forcing the stomata to close to protect the plant from dehydration [41]. Additionally, an inverse relationship between WUE and both VPD and E was found, indicating that sweet potato plants were more efficient in the use of this resource when the Gs, E and VPD decreased due to greater stomatal resistance and lower water loss [41]. In addition, this correlation was also reported previously in related species of Ipomoea, in which a low water loss was found, caused by low Gs, along with the maintenance of good photosynthetic behavior, which represents an adequate WUE [47].
The positive correlation between Gs and E can be explained by a greater opening of the stomatacausing E to continue along with Pn [52,53]. In respect to LT, this parameter decreased with the increase of Gs because the transpiration process is favored in the plant [44,54,55], and water release promote a cooling effect in the leaf. An inverse correlation was found for ICO2 and LT, indicating that as the LT increased, the ICO2 was reduced; this may be due to the stomatal closure effect generated by heating the plant canopy, to reduce the E [56], which would have caused a reduction in CO2 availability. Similarly, the negative correlation between Pn and VPD indicated a reduction of Pn when the VPD values were high. This behavior is conditioned by the plant response, throughstomatal closure mechanism, which reduces dehydration [9,41,51,57]. In this way, it is evident that when the Gs was reduced, the diffusion of CO2 was affected, also implying an effect on Pn [25].
These associations between ecophysiological parameters demonstrated tolerance strategies in a wide variability of the sweet potato genotypes. The response of Pn, WUE and CEI in the genotypes was largely determined by the values of Gs, ICO2 and E. These parameters defined the response of the genotypes to the evaluation conditions.

3.3. Interaction between Ecophysiological and Morpho-Agronomic Parameters Involved in Sweet Potato Tolerance to Low-Altitude Conditions

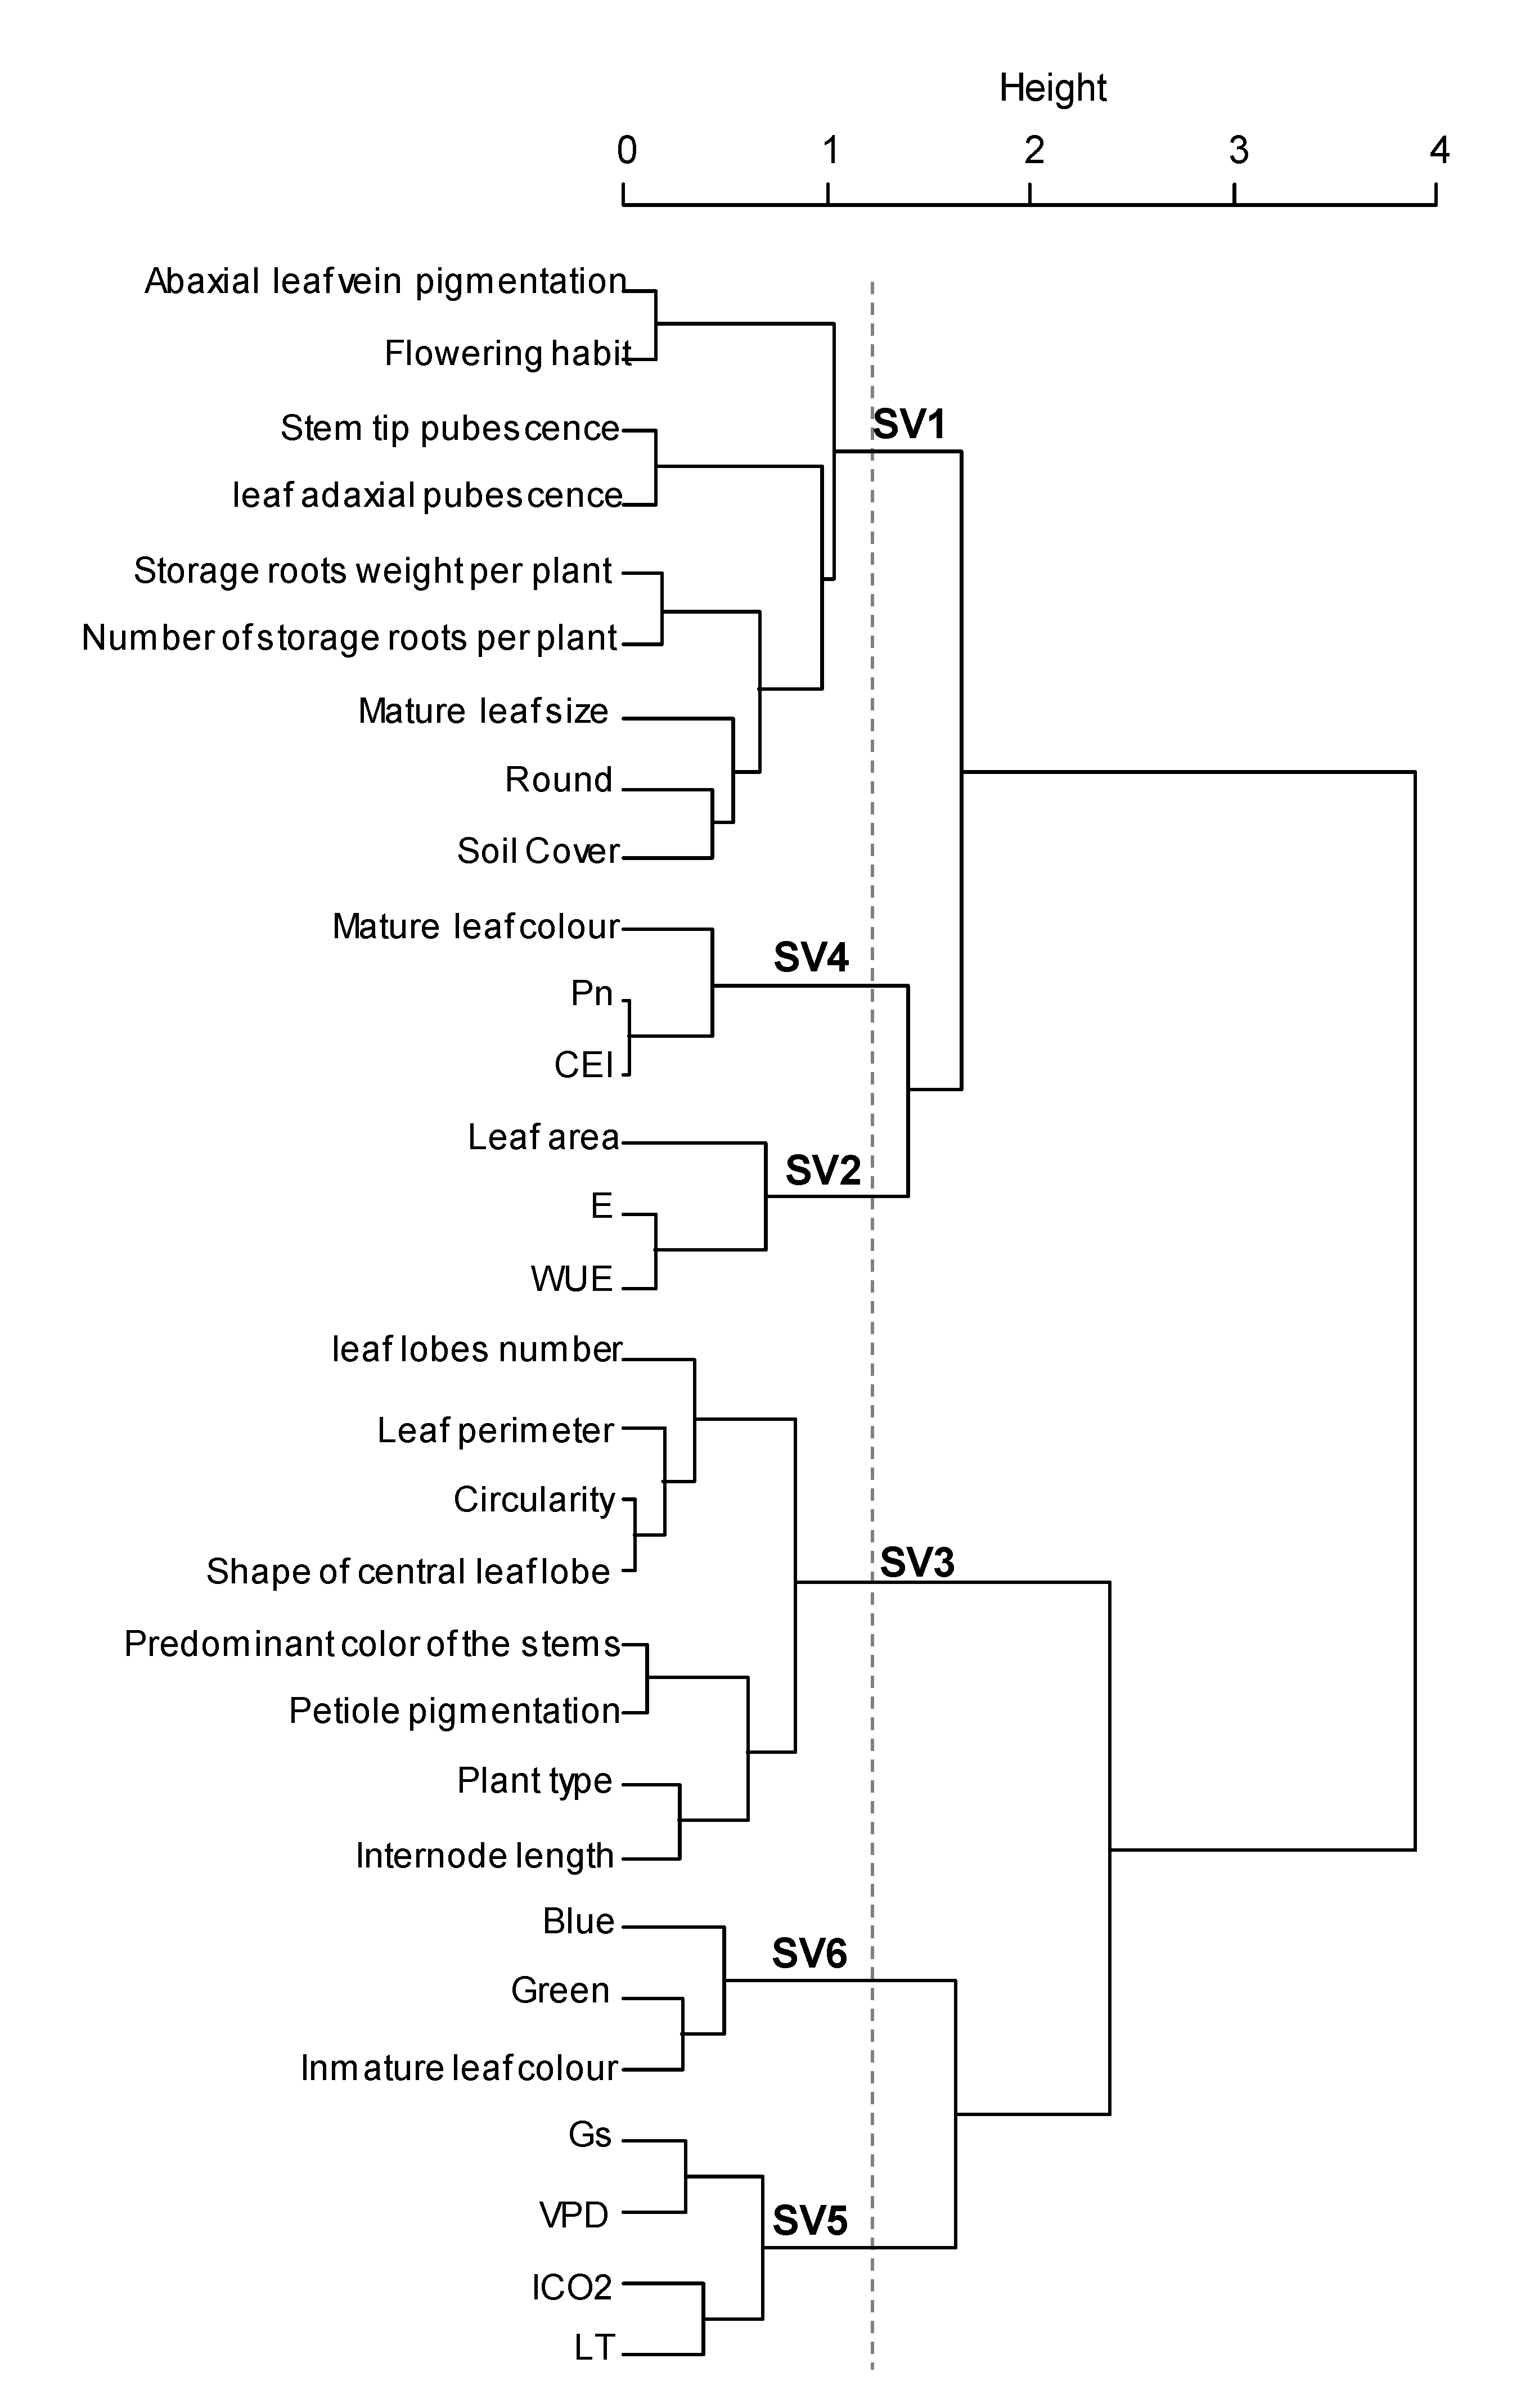
Results from morpho-agronomic and ecophysiological characterization was analyzed simultaneously to determine the interaction of these traits on the tolerance of sweet potato to low altitude conditions. Although, a wide diversity was found among genotypes, several traits were strongly related to each other, providing the same information and producing data redundancy. Therefore, to avoid this constraint, a hierarchical analysis of quantitative and qualitative variables was used for variable selection, determination of any association between them and creation of synthetic variables to improve the integral analysis of the genotypes. Thirty variables were selected, which showed higher stability of the partitions and represented several variables that were not further included, such as: secondary color of the stems, shape of the central leaf lobe, leaf solidity, red coloration, internode diameter, stem latex, petiole pubescence, mature leaf width, petiole diameter and general outline of the leaf. Six general groups were produced from the analyzed variables and were defined as synthetic variables SV1, SV2, SV3, SV4, SV5 and SV6 (Figure 2). SV1 mainly involved parameters related to the plant type, pubescence, tuberous root formation, ground cover, leaf size and leaf roundness; SV2 grouped characteristics of WUE, E and leaf area; SV3 grouped traits related to leaf shape and pigmentation; SV4 represented Pn, CEI and mature leaf color; SV5 only represented physiological attributes such as Gs, VPD, ICO2 and LT; finally, SV6 grouped leaf color attributes (Figure 2, Supplementary Materials Table S2). This data analysis was performed in line with previous studies which have shown that phenotypic descriptions may contain redundant variables and that variable aggregation can be used to select an optimal set of explanatory variables for an appropriate statistical model by removing multi-collinearity [58], an aspect generated by the similarity among some groups of variables that bring the same information [24].
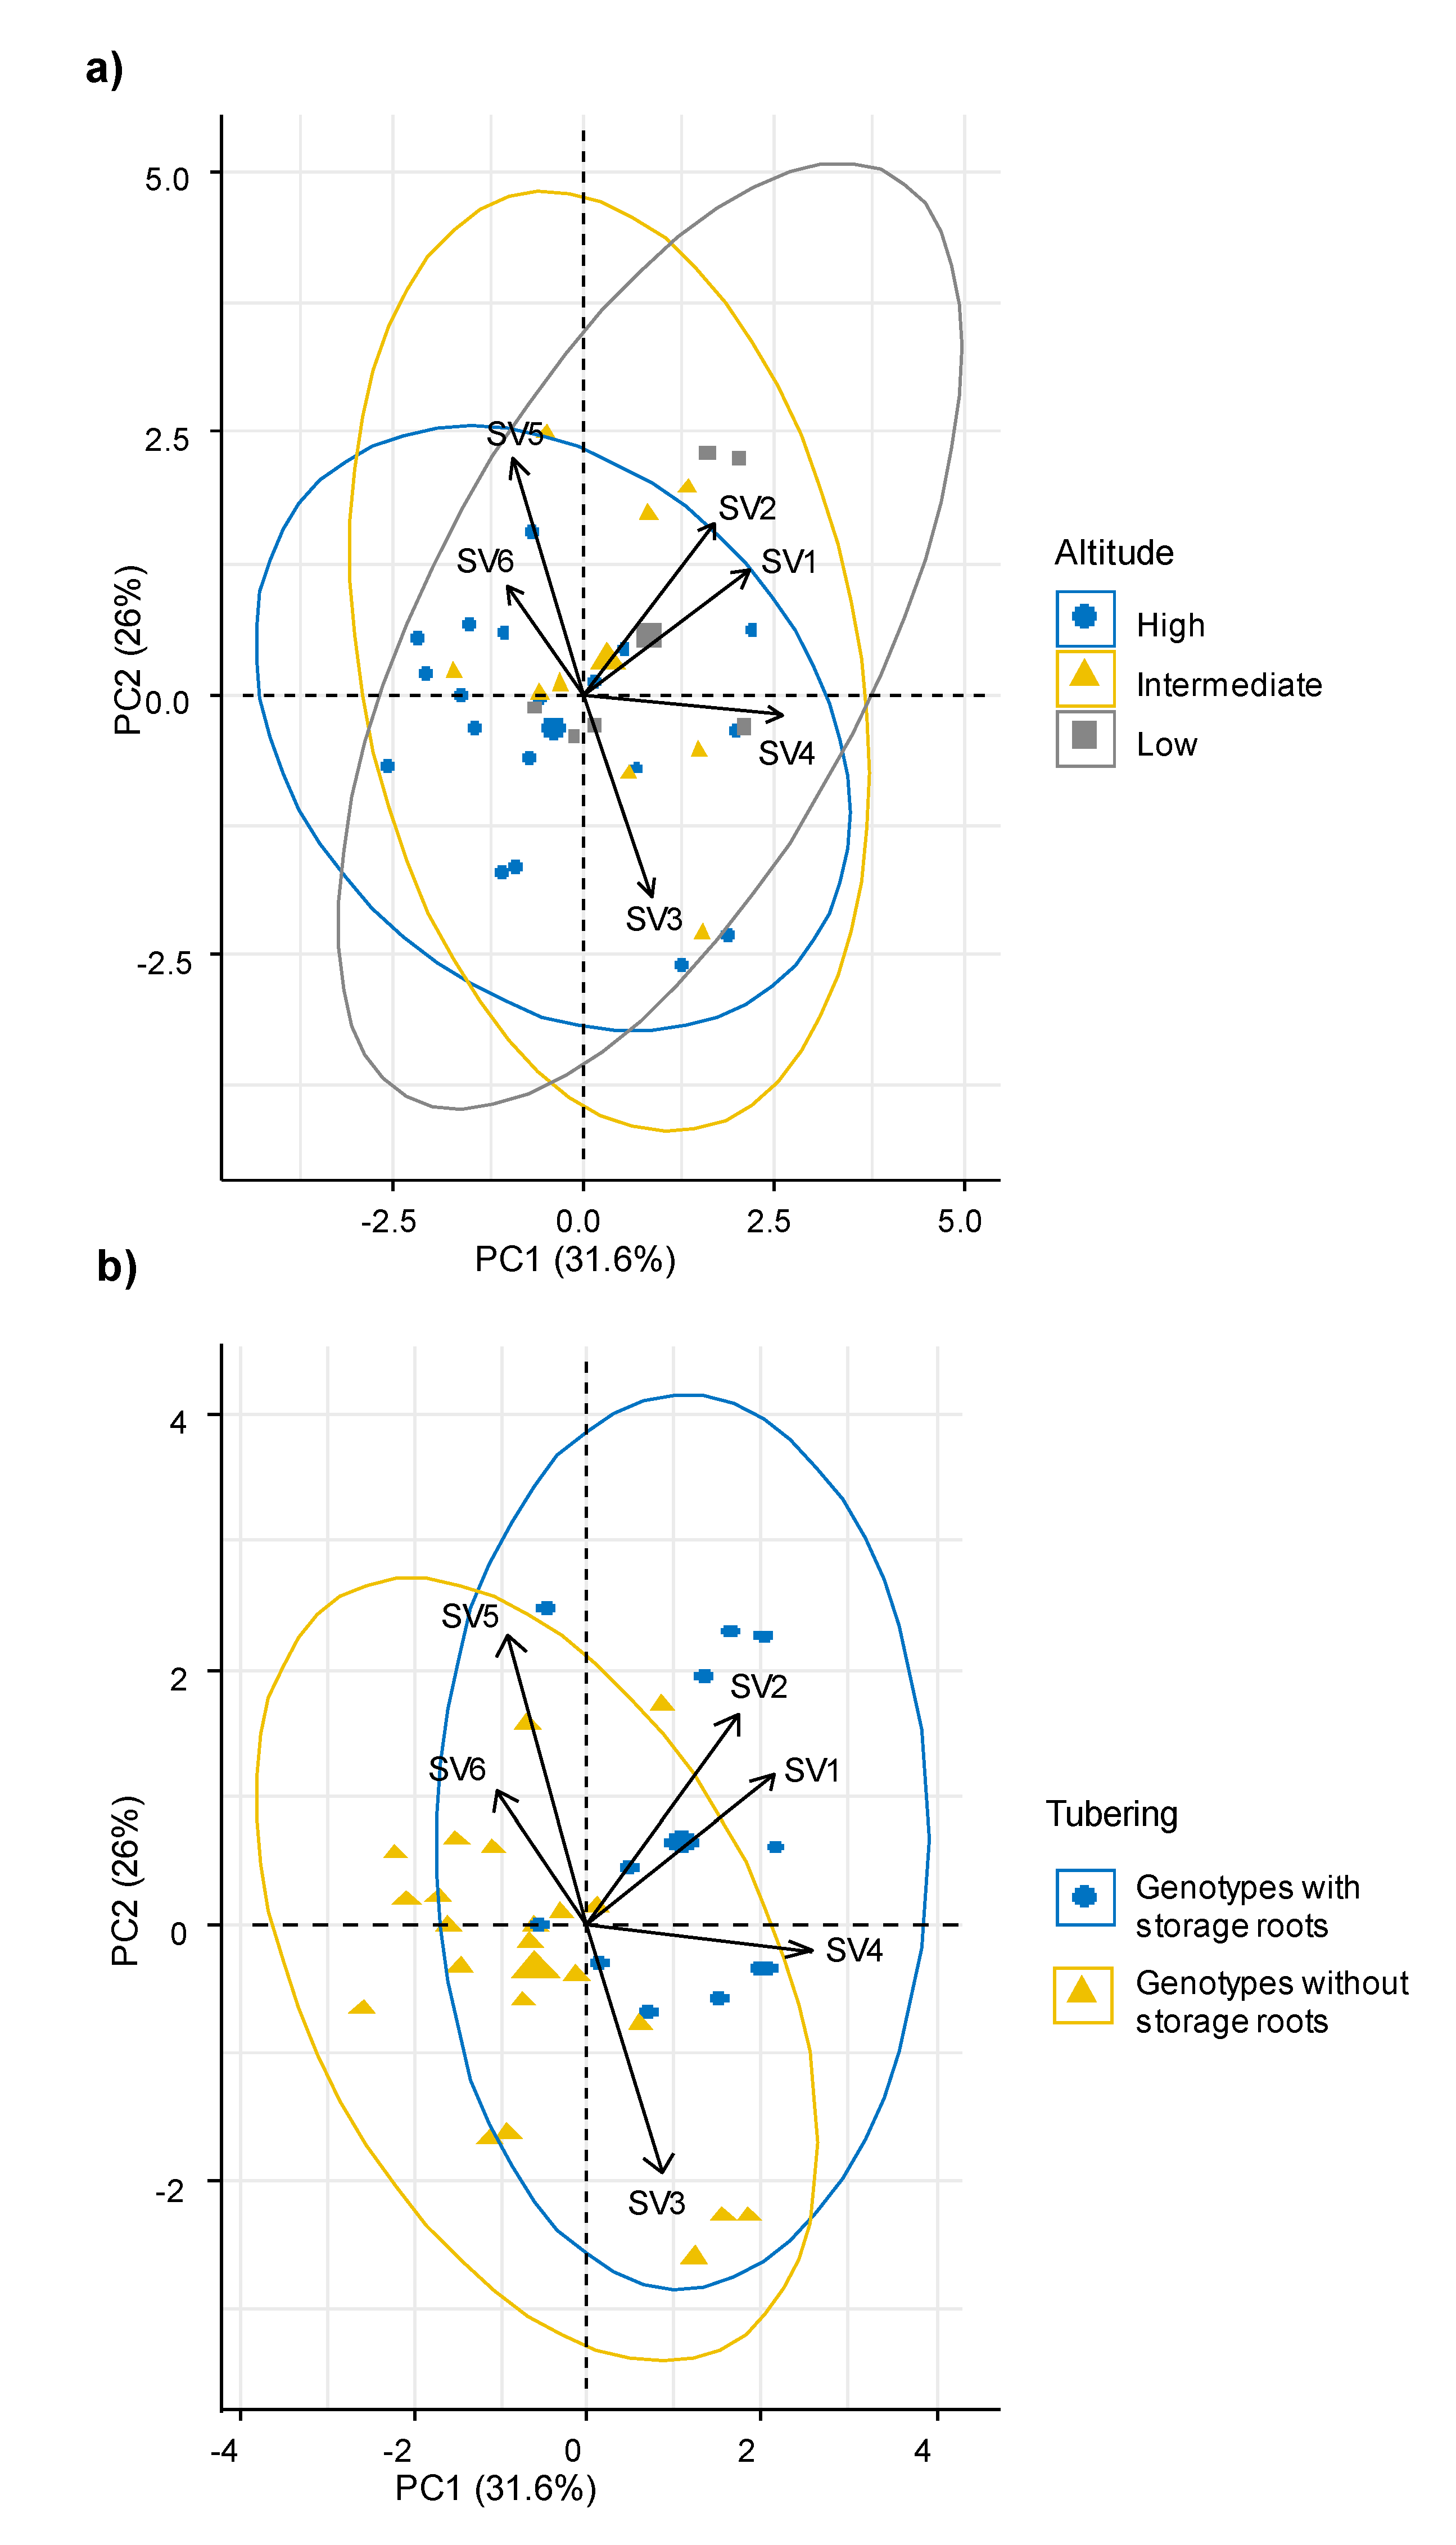
Using these synthetic variables, the behavior of the genotypes from different altitude intervals and with differential tuberization capacity was analyzed. The multivariate analysis showed that the ecophysiological response, the morphological characteristics and the ability to produce storage roots were independent of the altitudinal origin of the sweet potato genotypes (Figure 3a). Meanwhile, genotypes with capacity to produce storage roots were associated with the synthetic variables SV2, SV4 and SV1, which grouped mainly gas exchange parameters such as Pn, WUE, E and CEI; plant type, soil cover, leaf area, leaf roundness, flowering habit and productive parameters (Figure 3b).
The results of the correlation analysis confirmed the relationship among different phenotypic characteristics (morphology and color), physiological parameters and with storage root production previously determined by cluster analysis (Supplementary materials Table S3). From a cluster that grouped the synthetic variables SV1, SV4 and SV2, ground cover, mature leaf size, and flowering habit, a positive correlation with Pn, CEI and WUE, was observed. However, abaxial leaf vein pigments, mature leaf color and leaf adaxial pubescence presented negative correlation with these physiological parameters. A cluster that grouped the synthetic variables SV3, SV6 and SV5, showed a positive correlation with leaf perimeter and Pn, as with circularity with Gs and ICO2, and internode length was negatively correlated with Pn, ICO2, E, VPD and WUE.
These results may be associated with the direct effect of leaf size, leaf maturation and amount of biomass, which correspond to parameters associated with the main photosynthetic structures, and is related to Pn, WUE and water loss by transpiration [59,60]. However, when leaves reach their maximum maturity and senescence begins, the photosynthetic capacity is reduced [61]. These morphological traits also were related to LT, CEI and WUE; however, most of the traits that were positively related to Pn were negatively associated to VPD. Flowering habit depends on cultivar and growing conditions, but there was no evidence of any relationship with photosynthetic process. Negative correlation of ecophysiological parameters (Pn, ICO2, E, VPD and WUE) with variables associated with leaf shape, presence of pigments in plant organs and plant architecture were found. Some plants have structural and pigmentation modifications in the leaves as protective barriers to environmental factors, which reduce their absorption of radiation, avoiding saturation of plant, but exposing the photosynthetic structures to an imbalance [62]. Furthermore, this type of barrier can reduce the absorption of photosynthetic wavelengths and affect Pn by photoinhibition [62]. On the other hand, the presence of pubescence may contribute to reduced transpiration [63], which related to stomatal closure and may imply a negative effect on Pn [64]. Adaptation to the conditions of genotype origin is given by the physiological characteristics that allow them to adapt to the environment in which they develop and stimulate the acquisition of water, light and other components for growth [65].
The characterized population presented a wide phenotypic and ecophysiological variability between and within groups categorized by different altitudinal intervals (high, intermediate and low altitude), and tuberization capacity (genotypes with storage roots and genotypes without storage roots). Variance analysis integrating altitude and tuberization factors and their interaction showed that for altitude intervals, only Pn and WUE presented statistically significant differences. Regarding tuberization the parameters Pn, WUE, CEI, root number, root weight, leaf circularity, leaf roundness and leaf solidity were statistically different, while the interaction was not statistically significant for any variable (Table 5).
The genotypes presented a wide variability in morphometric and agronomic parameters within each altitudinal interval; however, between groups no significant differences were detected (Table 6). Most of the genotypes that tuberized were collected in places of low altitude, and only some genotypes of high altitude showed the ability to adapt to the evaluation conditions. The evaluated genotypes were grouped with respect to their capacity to produce storage roots, in order to determine the characteristics that allowed to guarantee better tolerance to low altitude conditions, and to be comparable to the Aurora and Ambarina varieties. Genotypes 0715-076.CES, 0316-251.STR, 0316-256.STR, 0316-283A.STR, 0316-299.STR, 0316-300.STR, 0516-352-HUI, 0816-600.BOY, 0816-618.STR and 0113-668.VAL produced storage roots at 120 DAP. The genotype 0316-299.STR presented the highest yield per plant, with 1.326 gr/plant, being comparable with the Ambarina variety (Table 6).
The group that had the ability to produce storage roots presented higher Pn, WUE and CEI, compared to the group that did not have the ability to produce storage roots (Table 7). This observation was consistent with reports in which the positive relationship between photosynthesis and root production is indicated [4,9]; this condition is also attributed to other C3 species such as cassava [28], guarantying a major amount of photo-assimilates that can be translocated to reserve organs, in this case the roots [30]. This group had a higher WUE and CEI compared to the group without storage roots, indicating that these genotypes made efficient use of the water resource [66], an aspect also corroborated by the low E found in this group. This group also presented the lowest VPD, which could be related to its adequate Pn behavior, since it has been reported that high VPD values indicate negative effects on Pn, due to high stomatal closure [41].
Regarding the morphometric characteristics of the leaves, the group that tuberized presented a larger leaf area, circularity, leaf roundness and leaf solidity, and lower perimeter, indicating the presence of lobed or more complex leaves [27], compared to the group without storage roots. These results indicated that in the group with capacity to produce storage roots, most of the genotypes had leaves with a major leaf area available for the capture of sunlight, an aspect that could favor the assimilation of CO2 by having a larger reception area for photosynthetically active radiation (PAR). Furthermore, the best photosynthetic efficiency favors the production of carbohydrates and, consequently, the production of storage roots [4,8,9].
In the qualitative parameters, dependence analysis showed association of tuberization capacity with soil cover efficiency, mature leaf size and latex production in the stems (Table 8). The genotypes that produced storage roots had a higher soil cover and mature leaf size, and lower latex production, compared to the group without storage roots. These results were consistently confirmed by quantitative variables in which it was shown that the genotypes with capacity to store starches in the roots presented a major leaf area and complete leaf lamina (less lobed). Although, the physiological and agronomic response of the genotypes was not totally related to their altitudinal origin, most of the genotypes that tuberized originated from altitudes between 18 and 1160 m above sea level, with the exception of four genotypes, whose origin was between 1481 and 1901 masl (Figure 4). In general, tolerance to low altitude conditions, considered as the ability to survive and produce storage roots, involved a high Pn in certain genotypes that together with the controls, Aurora and Ambarina, had the ability produce storage roots. These results showed the phenotypic plasticity of the genotypes, since even some genotypes from high altitudes were able to produce storage roots in conditions contrasting to those of their origin, and others that, despite having been evaluated in comparable conditions, showed a low productive performance. The genotypes from high altitude that showed low Pn values had small leaves with major complexity (more lobed) and did not have the ability to produce storage roots.
These results suggested a wide variability in phenotypic and ecophysiological response in the sweet potato genotypes. Leaf size (large) and complexity (less lobed), together with soil cover efficiency, can influence the microclimate conditions and ensure major photosynthetic efficiency that favors the production and accumulation of carbohydrates [4,8,9]. In the evaluated sweet potato genotypes, these parameters played a key role in guaranteeing their tolerance to low altitude conditions. Additionally, factorial analysis showed that some ecophysiological parameters, morphological traits and the tuberization capacity were related to the altitudinal origin of the genotypes. Consistently, discrimination of genotypes according to tuberization capacity was found through parameters grouped in the synthetic variables SV2 (WUE, E and leaf area), SV4 (Pn, CEI and Mature leaf color) and SV1 (plant type, pubescence, tuberous roots formation, ground cover, leaf size and leaf roundness, among others), suggesting the key role of these traits for tolerance to low altitude condition.

4. Conclusions

Characteristics of high Pn, CEI and low VPD were decisive in the tolerance of ecotypes to low altitude conditions. Genotypes from lower altitudes showed a better physiological response, and only some genotypes from higher altitudes showed such tolerance.
The response of the Pn, WUE and CEI in evaluated genotypes was largely determined by Gs, ICO2 and E. Changes in Gs directly affected the diffusion of CO2, which led to modifications of the flux of CO2 into the leaf, causing changes in E and Pn, which was translated as changes of water use efficiency.
Genotypes that exhibited leaves with larger size and less complexity (less lobed), together with more soil cover efficiency, showed major photosynthetic efficiency that favored the production and accumulation of carbohydrates in storage roots, and were key to guaranteeing tolerance to low altitude conditions.
Tuberization capacity was related to parameters such as WUE, E Pn, CEI, leaf area, mature leaf color, plant type, pubescence, ground cover, leaf size and leaf roundness, among others, suggesting the key role of these traits for tolerance to low altitude conditions

Supplementary Materials

The following are available online at https://www.mdpi.com/2311-7524/6/4/99/s1, Table S1: Matrix of principal component analysis for physiological parameters, Table S2: Synthetic variables created with Hierarchical clustering of physiological and morpho-agronomic variables (qualitative and quantitative), Table S3: Pearson and Spearman correlation among ecophysiological parameters and quantitative and qualitative traits of morpho-agronomic description.

Author Contributions

C.C. and I.P. designed the experiment; A.M., E.B.-E., C.C., I.P., L.E., E.G. and L.L. performed the experiment; E.B.-E. and A.R. analyzed the data; E.B.-E., A.R., J.P. and C.C. wrote the manuscript. All authors have read and agreed to the published version of the manuscript.

Funding

This study was funded by the Ministerio de Agricultura y Desarrollo Rural (MADR) of Colombia [Agreement No. 000023-2015 (TV16)]. The funding agency had no role in the study design, data collection and analysis, interpretation of results and in the decision to publish or prepare the manuscript.

Acknowledgments

This work was carried out in AGROSAVIA in the execution of project N° 424. We thank José Emiro Liñan for his technical support.

Conflicts of Interest

The authors declare no conflict of interest.

Abbreviations

PnNet photosynthetic rate
GsStomatal conductance
ICO2Internal CO2
ETranspiration
VPDVapor pressure deficit
LTLeaf internal temperature
WUE Water use efficiency
CEICarboxylation efficiency index
DAPDays after planting
SVSynthetic variable

References

  1. Yooyongwech, S.; Samphumphuang, T.; Theerawitaya, C.; Cha-um, S. Physio-morphological responses of sweet potato [Ipomoea batatas (L.) Lam.] genotypes to water-deficit stress. Plant Omics. 2014, 7, 361–368. [Google Scholar]
  2. Ravi, V.; Saravanan, R. Crop physiology of sweetpotato. Hortic. Rev. (Am. Soc. Hortic. Sci.) 2012, 23, 277–338. [Google Scholar]
  3. Firon, N.; Labonte, D.; Villordon, A. Transcriptional profiling of sweetpotato (Ipomoea batatas) roots indicates down-regulation of lignin biosynthesis and up-regulation of starch biosynthesis at an early stage of storage root formation. BMC Genom. 2013, 14, 460. [Google Scholar] [CrossRef] [PubMed] [Green Version]
  4. Li, C.; Yao, W.; Wang, J.; Wang, J.; Ai, Y.; Ma, H.; Zhang, Y. A novel effect of glycine on the growth and starch biosynthesis of storage root in sweetpotato (Ipomoea batatas Lam.). Plant Physiol. Biochem. 2019, 144, 395–403. [Google Scholar] [CrossRef]
  5. Islam, S. Antimutagenicity of the Water Extracts, Radical Scavenging Activity, and Phenolic Acids in the Tops of Diverse Ipomoea batatas (L.) Lam. Adv. Med. Sci. 2019, 4, 46–51. [Google Scholar]
  6. Ravi, V.; Chakrabarti, S.K.; Makeshkumar, T.; Saravanan, R. Molecular regulation of storage root formation and development in sweet potato. Hortic. Rev. 2014, 42, 157–206. [Google Scholar]
  7. Lai, Y.C.; Wang, S.Y.; Gao, H.Y.; Nguyen, K.M.; Nguyen, C.H.; Shih, M.C.; Lin, K.H. Physicochemical properties of starches and expression and activity of starch biosynthesis-related genes in sweet potatoes. Food Chem. 2016, 199, 556–564. [Google Scholar] [CrossRef]
  8. Katoh, A.; Ashida, H.; Kasajima, I.; Shigeru, S.; Akiho, Y. Potato yield enhancement through intensification of sink and source performances. Breed. Sci. 2015, 65, 77–84. [Google Scholar] [CrossRef] [Green Version]
  9. Yooyongwech, S.T.; Samphumphuang, R.; Tisarum, C.; Theerawitaya, C.; Cha-um, S. Water-deficit tolerance for water deficiency in sweet potatoes (Ipomoea batatas [L.] Lam.) By foliar application of paclobutrazol: The role of soluble sugar and free proline. Front. Plant Sci. 2017, 8, 1–13. [Google Scholar] [CrossRef] [Green Version]
  10. Ravi, V.; Saravanan, R.; Byju, G.; Pallavi, N.; James, G. Photosynthetic response of sweet potato (Ipomoea batatas) to photon flux density and elevated carbon dioxide. Indian J. Agric. Sci. 2017, 87, 1231–1237. [Google Scholar]
  11. Van Heerden, P.D.R.; Laurie, R. Effects of prolonged restriction in water supply on photosynthesis, shoot development and storage root yield in sweet potato. Physiol. Plant 2008, 134, 99–109. [Google Scholar] [CrossRef] [PubMed]
  12. Urban, L.; Aarrouf, J.; Bidel, L.P. Assessing the effects of water deficit on photosynthesis using parameters derived from measurements of leaf gas exchange and of chlorophyll a fluorescence. Front. Plant Sci. 2017, 8, 2068. [Google Scholar] [CrossRef] [PubMed] [Green Version]
  13. Lebot, V. Sweet potato. In Root and Tuber Crops; Springer: New York, NY, USA, 2010; pp. 97–125. [Google Scholar]
  14. Sulistiani, R.; Siregar, L.A.M.; Harahap, F. Differences in morphology and sugar content of purple sweet potato (Ipomoea batatas L.) with potassium treatment at several altitudes. EES 2018, 122, 012050. [Google Scholar]
  15. Helsper, J.P.; deVos, C.H.; Maas, F.M.; Jonker, H.H.; VandenBroeck, H.C.; Jordi Schapendonk, A.H. Response of selected antioxidants and pigments in tissues of Rosahybrida and Fuchsia hybrida to supplemental UV-A exposure. J. Physiol. Plant 2003, 117, 171–178. [Google Scholar] [CrossRef]
  16. Adebola, P.O.; Shegro, A.; Laurie, S.M.; Zulu, L.N.; Pillay, M. Genotype x environment interaction and yield stability estimate of some sweet potato [Ipomoea batatas (L.) Lam] breeding lines in South Africa. J. Plant Breed. Crop Sci. 2013, 5, 182–186. [Google Scholar]
  17. Tamrat Alemu, S.; Roro, A.G. Ultraviolet-B, end of day light and exclusion effect on photosynthetic efficiency of sweet potato (Ipomoea batatas L.) based on altitude. J. Hortic. Postharvest Res. 2020, 3, 1–10. [Google Scholar]
  18. Costa, H.; Gallego, S.M.; Tomaro, M.L. Effect of UV-B radiation on antioxidant defense system in sunflower cotyledons. J. Plant Sci. 2002, 162, 939–945. [Google Scholar] [CrossRef]
  19. Zhao, D.; Reddy, K.R.; Kakani, V.G.; Read, J.J.; Sullivan, J.H. Growth and physiological responses of cotton (Gossypium hirsutum L.) to elevated carbon dioxide and ultraviolet-B radiation under controlled environmental conditions. Plant Cell Environ. 2003, 26, 771–782. [Google Scholar] [CrossRef] [Green Version]
  20. Bradshaw, J.E. Root and tuber crops. In Handbook of Plant Breeding; Springer Science + Business Media: New York, NY, USA, 2010; pp. 97–126. [Google Scholar]
  21. Krochmal-Marczak, B.; Sawicka, B.; Michałek, W. Photosynthetic Efficiency in Sweet Potato (Ipomoea batatas) under Different Nitrogen Fertilization Regimes. Int. J. Agric. Biol. 2019, 22, 627–632. [Google Scholar]
  22. Mukhopadhyay, S.K.; Chattopadhyay, A.; Chakraborty, I. Crops that feed the world 5. Sweetpotato. Sweetpotatoes for income and food security. Food Sec. 2011, 3, 283–305. [Google Scholar] [CrossRef]
  23. Glato, K.; Aidam, A.; Kane, N.A.; Bassirou, D.; Couderc, M.; Zekraoui, L.; Vigouroux, Y. Structure of sweet potato (Ipomoea batatas) diversity in West Africa covaries with a climatic gradient. PLoS ONE 2017, 12, e0177697. [Google Scholar] [CrossRef] [PubMed]
  24. Chavent, M.; Kuentz, V.; Liquet, B.; Saracco, J. ClustOfVar: An R package for the clustering of variables. J. Stat. Softw. 2012, 50, 1–16. [Google Scholar] [CrossRef] [Green Version]
  25. Borba, M.E.A.; Maciel, G.M.; Júnior, E.F.; Júnior, C.M.; Marquez, G.R.; Silva, I.G.; Almeida, R.S. Gas exchanges and water use efficiency in the selection of tomato genotypes tolerant to water stress. Genet. Mol. Res. 2017, 16, 16. [Google Scholar] [CrossRef] [PubMed]
  26. CIP. Descriptors for sweet potato. Descripteurs pour la patete douce. In Descriptores de la Batata (No. C027. 041); International Board for Plant Genetic Resources (IBPGR): Rome, Italy, 1991; pp. 3–52. [Google Scholar]
  27. Rosero, A.; Pérez, J.L.; Rosero, D.; Burgos-Paz, W.; Martínez, R.; Morelo, J.; Pastrana, I.; Burbano, E.; Morales, A. Morphometric and colourimetric tools to dissect morphological diversity: An application in sweet potato [Ipomoea batatas (L.) Lam.]. Genet. Resour. Crop. Evol. 2019, 66, 1257–1278. [Google Scholar] [CrossRef] [Green Version]
  28. El-Sharkawy, M.A.; Cock, J.H. C3-C4 intermediate photosynthetic characteristics of cassava (Manihot esculenta Crantz). 1. Gas exchange. Photosynth. Res. 1987, 12, 219–235. [Google Scholar] [CrossRef]
  29. Jones, H.G. Plants and microclimate. In A Quantitative Approach to Environmental Plant Physiology; Cambridge University Press: Cambridge, UK, 1992; pp. 277–407. [Google Scholar]
  30. Mundree, S.G.; Baker, B.; Mowla, S.; Peters, S.; Marais, S.; Vander Willigen, C.; Thomson, J.A. Physiological and molecular insights into drought tolerance. Afr. J. Biotechnol. 2002, 1, 28–38. [Google Scholar]
  31. Steduto, P.; Hsiao, T.C.; Fereres, E. On the conservative behavior of biomass water productivity. Irrig. Sci. 2007, 25, 189–207. [Google Scholar] [CrossRef] [Green Version]
  32. Laurie, R.N.; Laurie, S.M.; Du Plooy, C.P.; Finnie, J.F.; Van Staden, J. Yield of drought-stressed sweet potato in relation to canopy cover, stem length and stomatal conductance. J. Agric. Sci. 2015, 7, 201–214. [Google Scholar] [CrossRef]
  33. Wehr, R.; Commane, R.; Munger, J.W.; McManus, J.B.; Nelson, D.D.; Zahniser, M.S.; Saleska, S.R.; Wofsy, S.C. Dynamics of canopy stomatal conductance, transpiration, and evaporation in a temperate deciduous forest, validated by carbonyl sulfide uptake. Biogeosciences 2017, 14, 389–401. [Google Scholar] [CrossRef] [Green Version]
  34. Gajanayake, B.; Raja, R.; Shankleb, M.; Arancibiaba, R. Growth, developmental, and physiological responses of two sweetpotato (Ipomoea batatas L. [Lam]) cultivars to early season soilmoisture deficit. Sci Hortic. 2014, 168, 218–228. [Google Scholar] [CrossRef]
  35. Egilla, J.N.; Davies, J.F.T.; Boutton, T.W. Drought stress influences leaf water content, photosynthesis, and water-use efficiency of Hibiscus rosa-sinensis at three potassium concentrations. Photosynthetica 2005, 43, 135–140. [Google Scholar] [CrossRef]
  36. Santos, C.M.; Verissimo, V.; Lins, H.C.; Ferreira, V.M. Comparative effects of deficit irrigation and alternate partial root-zone irrigation on xylem pH, ABA and ionic concentrations in tomatões. Ind. Crops Prod. 2013, 41, 203–213. [Google Scholar]
  37. Keutgen, N.; Mukminah, F.; Roeb, G.W. Sink strength and photosynthetic capacity influence tuber development in sweet potato. J. Hortic. Sci. Biotechnol. 2002, 77, 106–115. [Google Scholar] [CrossRef]
  38. Caird, M.A.; Richards, J.H.; Donovan, L.A. Nighttime stomatal conductance and transpiration in C3 and C4 plants. Plant Physiol. 2007, 143, 4–10. [Google Scholar] [CrossRef] [Green Version]
  39. Dawson, T.E.; Burgess, S.S.; Tu, K.P.; Oliveira, R.S.; Santiago, L.S.; Fisher, J.B.; Ambrose, A.R. Nighttime transpiration in woody plants from contrasting ecosystems. Tree Physiol. 2007, 27, 561–575. [Google Scholar] [CrossRef] [PubMed] [Green Version]
  40. Siddique, M.R.B.; Hamid, A.; Islam, M.S. Drought stress effects on water relations of wheat. Bot. Bull. Acad. Sin. 2001, 41, 35–39. [Google Scholar]
  41. McAdam, S.A.; Brodribb, T.J. The evolution of mechanisms driving the stomatal response to vapour pressure deficit. Plant Physiol. 2015, 167, 833–843. [Google Scholar] [CrossRef] [Green Version]
  42. Crafts-Brandner, S.J.; Salvucci, M.E. Rubisco activase constrains the photosynthetic potential of leaves at high temperature and CO2. Proc. Natl. Acad. Sci. USA 2000, 97, 13430–13435. [Google Scholar] [CrossRef] [Green Version]
  43. El-Sharkawy, M.A. Stress-tolerant cassava: The role of integrative ecophysiology-breeding research in crop improvement. Open J. Soil. Sci. 2012, 2, 162–186. [Google Scholar] [CrossRef] [Green Version]
  44. Delazari, F.T.; Assis, I.R.; Cabrera, D.F.; Ferreira, M.G.; Dias, L.E.; Rueda, A.; Silva, D.J. Morpho-physiological characteristics by sweet potato cultivars as function of irrigation depth. An. Acad. Bras. Ciênc. 2018, 90, 3541–3549. [Google Scholar] [CrossRef]
  45. Kelm, M.; Brück, H.; Hermann, M.; Sattelmacher, B. Plant Productivity and Water Use Efficiency of Sweetpotato (Ipomoea Batatas) as Affected by Nitrogen Supply; CIP Program Report; International Potato Center: Lima, Perú, 2000; pp. 273–279. [Google Scholar]
  46. Zhu, P.; Zhuang, Q.; Ciais, P.; Welp, L.; Li, W.; Xin, Q. Elevated atmospheric CO2 negatively impacts photosynthesis through radiative forcing and physiology-mediated climate feedback. Geophys. Res. Lett. 2017, 44, 1956–1963. [Google Scholar] [CrossRef] [Green Version]
  47. Sucre, B.; Suárez, N. Effect of salinity and PEG-induced water stress on water status, gas exchange, solute accumulation, and leaf growth in Ipomoea pes-caprae. Environ. Exp. Bot. 2011, 70, 192–203. [Google Scholar] [CrossRef]
  48. Pazzagli, P.T.; Weiner, J.; Liu, F. Effects of CO2 elevation and irrigation regimes on leaf gas exchange, plant water relations, and water use efficiency of two tomato cultivars. Agric. Water Manag. 2016, 169, 26–33. [Google Scholar] [CrossRef]
  49. Flexas, J.; Bota, J.; Loreto, F.; Cornic, G.; Sharkey, T.D. Diffusive and metabolic limitations to photosynthesis under drought and salinity in C3 plants. Plant Biol. 2004, 6, 269–279. [Google Scholar] [CrossRef]
  50. Farquhar, G.D.; Sharkey, T.D. Stomatal conductance and photosynthesis. Annu. Rev. Plant Physiol. 1982, 33, 317–345. [Google Scholar] [CrossRef]
  51. Chaves, M.M.; Flexas, J.; Pinheiro, C. Photosynthesis under drought and salt stress: Regulation mechanisms from whole plant to cell. Ann. Bot. 2009, 103, 551–560. [Google Scholar] [CrossRef] [Green Version]
  52. Ainsworth, E.A.; Rogers, A. The response of photosynthesis and stomatal conductance to rising [CO2]: Mechanisms and environmental interactions. Plant Cell Environ. 2007, 30, 258–270. [Google Scholar] [CrossRef]
  53. Haworth, M.; Marino, G.; Centritto, M. An introductory guide to gas exchange analysis of photosynthesis and its application to plant phenotyping and precision irrigation to enhance water use efficiency. J. Water Clim. Chang. 2018, 9, 786–808. [Google Scholar] [CrossRef] [Green Version]
  54. Blonquist, J.M., Jr.; Norman, J.M.; Bugbee, B. Automated measurement of canopy stomatal conductance based on infrared temperature. Agric. For. Meteorol. 2009, 149, 1931–1945. [Google Scholar] [CrossRef]
  55. Sermons, S.M.; Seversike, T.M.; Sinclair, T.R.; Fiscus, E.L.; Rufty, T.W. Temperature influences the ability of tall fescue to control transpiration in response to atmospheric vapour pressure deficit. Funct. Plant Biol. 2012, 39, 979–986. [Google Scholar] [CrossRef]
  56. Morison, J.I.L.; Lawlor, D.W. Interactions between increasing CO2 concentration and temperature on plant growth. Plant Cell Environ. 1999, 22, 659–682. [Google Scholar] [CrossRef] [Green Version]
  57. Motsa, N.M.; Modi, A.T.; Mabhaudhi, T. Sweet potato (Ipomoea batatas L.) as a drought tolerant and food security crop. S. Afr. J. Sci. 2015, 111, 1–8. [Google Scholar] [CrossRef] [Green Version]
  58. Legland, D.; Beaugrand, J. Automated clustering of lignocellulosic fibres based on morphometric features and using clustering of variables. Ind. Crops Prod. 2013, 45, 253–261. [Google Scholar] [CrossRef]
  59. Wright, I.J.; Reich, P.B.; Westoby, M.; Ackerly, D.D.; Baruch, Z.; Bongers, F.; Flexas, J. The worldwide leaf economics spectrum. Nature 2004, 428, 821–827. [Google Scholar] [CrossRef] [PubMed]
  60. Marchi, S.; Tognetti, R.; Minnocci, A.; Borghi, M.; Sebastiani, L. Variation in mesophyll anatomy and photosynthetic capacity during leaf development in a deciduous mesophyte fruit tree (Prunus persica) and an evergreen sclerophyllous Mediterranean shrub (Olea europaea). Trees 2008, 22, 559. [Google Scholar] [CrossRef]
  61. Hikosaka, K. Effects of leaf age, nitrogen nutrition and photon flux density on the organization of the photosynthetic apparatus in leaves of a vine (Ipomoea tricolor Cav.) grown horizontally to avoid mutual shading of leaves. Planta 1996, 198, 144–150. [Google Scholar] [CrossRef]
  62. Steyn, W.J.; Wand, S.J.E.; Holcroft, D.M.; Jacobs, G. Anthocyanins in vegetative tissues: A proposed unified function in photoprotection. New Phytol. 2002, 155, 349–361. [Google Scholar] [CrossRef]
  63. Savé, R.; Biel, C.; De Herralde, F. Leaf pubescence, water relations and chlorophyll fluorescence in two subspecies of Lotus creticus L. Biol. Plant 2000, 43, 239–244. [Google Scholar] [CrossRef]
  64. Holmes, M.G.; Keiller, D.R. Effects of pubescence and waxes on the reflectance of leaves in the ultraviolet and photosynthetic wavebands: A comparison of a range of species. Plant Cell Environ. 2002, 25, 85–93. [Google Scholar] [CrossRef]
  65. Alemu, S.T.; Roro, A.G. Effect of solar Ultraviolet-B plus end of day light and its exclusion on growth performance and dry weight accumulation of two sweet potato cultivars (Ipomoea batatas L.) on different altitudes. Int. J. Hortic. Sci. 2020, 7, 1–11. [Google Scholar]
  66. Dladla, L.N.T.; Modi, A.T.; Mabhaudhi, T.; Chibarabada, T.P. Yield, water use, and water use efficiency of sweet potato under different environments. In Proceedings of the XXX International Horticultural Congress IHC2018: International Symposium on Water and Nutrient Relations and Management of 1253, Istanbul, Turkey, 12 August 2018; pp. 287–294. [Google Scholar]
Figure 1. Relationship among physiological characteristics evaluated in sweet potato. (a) Principal component analysis (PCA) among physiological parameters; (b) Pearson’s linear correlations among physiological parameters. Pn: Net photosynthetic rate, Gs: Stomatal conductance, ICO2: Internal CO2, E: Transpiration, VPD: vapor pressure deficit, LT: Leaf internal temperature, WUE: Water use efficiency, CEI: Carboxylation efficiency index. Each value represents the coefficient of correlation. Significance: ** p < 0.01; ns: no significance.
Horticulturae 06 00099 g001
Figure 2. Estimation of synthetic variables from ecophysiological, morphological, morphometrical and productive parameters. Pn: Photosynthesis, Gs: Stomatal conductance, ICO2: Internal CO2, E: Transpiration, VPD: vapor pressure deficit, LT: Leaf internal temperature, WUE: Water use efficiency, CEI: Carboxylation efficiency index.
Horticulturae 06 00099 g002
Figure 3. Principal component analysis (PCA) among synthetic variables. (a) Comparison among altitudinal intervals (high, intermediate, and low), (b) comparison among groups of genotypes with storage roots and without roots. Pn: Photosynthesis, Gs: Stomatal conductance, ICO2: Internal CO2, E: Transpiration, VPD: vapor pressure deficit, LT: Leaf internal temperature, WUE: Water use efficiency, CEI: Carboxylation efficiency index.
Horticulturae 06 00099 g003
Figure 4. Relationship between genotypes with storage roots and without storage roots according to Pn and altitude. Pn: Net photosynthetic rate; masl: meters above sea level.
Horticulturae 06 00099 g004
Table 1. Ecotypes of sweet potato and description of site of origin.
Collection CodeDepartmentAltitude (masl z) LatitudeLongitude
High altitude (1401–2555 masl):
0216-243.NARNariño25551°34′52.278″77°00′00.786″
0816-610.BOYBoyacá21915°37.205′73°32.051′
0316-286.STRSantander207306°46′27.6″072°41′37.2″
0816-587A.BOYBoyacá20605°51.331′73°32.437′
0816-600.BOYBoyacá19015°49.330′73°35.775′
0516-491.CLDCaldas18995°14.257′75°09.589′
0516-515.CLDCaldas18835°23.326′75°06.526′
0316-299.STRSantander185306°57′03.6″072°54′53.7″
0516-503.CLDCaldas17495°19.991′75°07.207′
0816-595.BOYBoyacá17185°50.926′73°34.815′
0816-596.BOYBoyacá17175°50.935′73°34.825′
0816-582.BOYBoyacá16905°52.386′73°34.365′
0816-581.BOYBoyacá16895°52.385′73°34.365′
0316-263.STRSantander165006°31′23.1″073°03′16.4″
0316-251.STRSantander164906°44′44.3″073°00′21.6″
0316-261.STRSantander156206°32′10.0″073°06′31.2″
0316-283A.STRSantander148106°39′48.3″072°42′18.7″
0816-615.STRSantander14266°10.193′73°42.642′
0316-257.STRSantander140106°32′38.3″073°19′05.1″
Intermediate altitude (924–1298 masl):
0516-357.QNDQuindío12984°28′56.952″75°43′41.682″
0715-096.NSNorte de Santander120708°16′06.6″073°21′57.6″
0715-099.NSNorte de Santander118708°14′12.4″073°21′17.1″
0816-618.STRSantander11606°13.600′73°47.308′
0715-086.CESCesar112210°25′06.1″073°35′12.6″
0316-300.STRSantander111906°56′22.1″073°01′16.4″
0113-660.VALValle del Cauca10003°30′7″76°21′22″
0113-668.VALValle del Cauca10003°30′7″76°21′22″
0316-256.STRSantander92406°32′21.4″073°17′33.4″
Low altitude (18–599 masl):
0715-076.CESCesar59910°42′15.1″073°19′26.4″
0516-352-HUIHuila5252°41′12″75°19′32″
0816-620.STRSantander5216°13.592′73°51.154′
0715-105.CESCesar22408°14′06.9″073°29′55.3″
Ambarina (check)Valle del Cauca183°30′7″76°21′22″
Aurora (check)Córdoba188°45′35″75°53′08″
z masl: meters above sea level.
Table 2. Rainfall, temperature and relative humidity of the study environment.
MonthAccumulated Rainfall (mm)Mean Temperature (°C)Mean relative Humidity (%)
May290.228.569.1
June206.428.767.9
July231.429.166.8
August221.928.367.9
September187.028.072.8
Table 3. Analysis of variance results for altitude and genotype factor.
Source zAltitudeGenotype
DF233
Pn83.68 ** y23.94 ***
Gs0.0250.22 ***
ICO2224.58349.05 ***
E13.92 **6.52 ***
VPD0.4 ***0.19 ***
LT2.194.83 ***
WUE2.46 ***0.57 ***
CEI0.0012 ***0.0004 ***
z DF: Degree freedom in ANOVA; Pn: Photosynthesis; Gs: Stomatal conductance; ICO2: Internal CO2; E: Transpiration; VPD: vapor pressure deficit; LT: Leaf internal temperature; WUE: Water use efficiency; CEI: Instantaneous carboxylation efficiency index. y Each value represents the mean square. Significance, *** p < 0.001; ** p < 0.01.
Table 4. Means comparison among eco-physiological parameters of several genotypes of sweet potato.
zPnGsICO2EVPDLTWUECEI
High altitude (1401–2555 masl)
Genotype
0216-243.NAR25.45cdefghij y1.39abcde304.05abcd13.44abcd1.42abcde34.96abcd1.89ijkl0.0840fghijklm
0816-610.BOY25.17cdefghij1.63abcde310.06ab12.84abcdef1.25bcde30.54r1.96hijkl0.0810hijklm
0316-286.STR30.12abcde1.25abcde285.11abcde12.61abcdefg1.45abcde35.06abc2.39cdefghij0.1053abcdefg
0816-587A.BOY27.34abcdefghi1.91abc308.55abc12.91abcdef1.14de32.08jklmnopqr2.12efghijkl0.0883defghijklm
0816-600.BOY28.03abcdefghi1.27abcde293.00abcde12.58abcdefg1.43abcde34.74abcde2.23efghijkl0.0953abcdefghijklm
0516-491.CLD22.74ghij1.30abcde307.27abcd14.09abc1.64abcd33.35efghij1.61l0.0740klm
0516-515.CLD25.20cdefghij1.67abcde311.26ab13.35abcdef1.28bcde30.91pqr1.90ijkl0.0810hijklm
0316-299.STR30.03abcde1.32abcde288.67abcde12.41abcdefg1.36abcde34.37abcdef2.42cdefghij0.1040abcdefgh
0516-503.CLD21.59ij0.92cde294.77abcde12.33abcdefg1.92abc33.65cdefghi1.78jkl0.0737lm
0816-595.BOY25.88bcdefghij1.48abcde309.46ab8.74g0.89e33.68cdefghi2.96abcd0.0840fghijklm
0816-596.BOY27.01abcdefghij1.45abcde300.19abcde12.93abcdef1.36abcde32.45hijklmnop2.09efghijkl0.0900cdefghijklm
0816-582.BOY27.64abcdefghi1.13abcde291.73abcde10.95bcdefg1.35abcde31.67klmnopqr2.52bcdefghi0.0950abcdefghijklm
0816-581.BOY28.96abcdefgh1.59abcde294.71abcde14.92a1.51abcde33.48defghij1.94hijkl0.0980abcdefghijk
0316-263.STR25.02defghij1.54abcde306.88abcd14.83ab1.49abcde33.29efghij1.69kl0.0813ghijklm
0316-251.STR27.54abcdefghi1.44abcde300.78abcde11.67abcdefg1.22cde31.61lmnopqr2.36cdefghijk0.0917bcdefghijklm
0316-261.STR25.56cdefghij1.25abcde301.19abcde12.14abcdefg1.40abcde32.18ijklmnopq2.11efghijkl0.0850fghijklm
0316-283A.STR30.83abcd1.18abcde281.88abcde12.04abcdefg1.42abcde35.08abc2.56bcdefghi0.1097abcde
0816-615.STR21.71ij0.88de291.78abcde12.10abcdefg1.96ab33.67cdefghi1.82jkl0.0743jklm
0316-257.STR30.98abcd1.08abcde271.01e11.29abcdefg1.52abcde34.18abcdefg2.77bcde0.1147ab
Group mean26.77c1.35297.4912.53a1.42a33.202.16b2.16b
Intermediate altitude (924–1298 masl)
0516-357.QND32.47ab1.17abcde276.08de12.03abcdefg1.44abcde32.91fghijklmn2.70bcdef0.1175a
0715-096.NS26.72abcdefghij1.71abcd307.03abcd13.37abcde1.25bcde33.21efghijk2.00ghijkl0.0870efghijklm
0715-099.NS28.73abcdefgh1.34abcde293.28abcde12.80abcdef1.38abcde34.96abcd2.24efghijkl0.0980abcdefghijk
0816-618.STR27.88abcdefghi1.20abcde288.94abcde12.43abcdefg1.44abcde33.74bcdefgh2.45bcdefghij0.0963abcdefghijklm
0715-086.CES23.54efghij1.00abcde293.11abcde10.52cdefg1.61abcd32.08jklmnopqr2.23efghijkl0.0800hijklm
0316-300.STR30.81abcd1.06abcde276.97cde11.45abcdefg1.46abcde34.69abcde2.69bcdef0.1113abcd
0113-660.VAL28.67abcdefgh1.57abcde304.08abcd9.45fg0.89e32.84fghijklmn3.04abc0.0943abcdefghijklm
0113-668.VAL29.61abcde1.59abcde301.74abcde9.48efg0.89e32.82ghijklmn3.12ab0.0983abcdefghij
0316-256.STR26.49abcdefghij1.95a312.32a12.24abcdefg1.06de31.26opqr2.17efghijkl0.0850fghijklm
Group mean28.32b1.39294.8311.53b1.26ab33.162.51a2.51a
Low altitude (18–599 masl)
0715-076.CES33.04a1.34abcde279.65bcde12.50abcdefg1.35abcde35.27ab2.65bcdefg0.1183a
0516-352-HUI29.56abcdef1.69abcd299.22abcde12.82abcdef1.20cde33.24efghij2.31defghijk0.0990abcdefghi
0816-620.STR28.80abcdefgh1.95ab303.61abcd13.27abcdef1.18de32.01jklmnopqr2.17efghijkl0.0950abcdefghijklm
0715-105.CES28.53abcdefgh1.17abcde286.38abcde12.39abcdefg1.51abcde34.30abcdefg2.31defghijk0.0997abcdefgh
Ambarina31.10abcd1.46abcde294.78abcde8.74g0.86e33.10fghijkl3.56a0.1057abcdef
Aurora29.26abcdefgh1.60abcde301.74abcde10.73cdefg1.00de32.75ghijklmno2.72bcdef0.0970abcdefghijkl
Group mean30.04a1.53294.2311.74b1.18b33.442.62a2.62a
z Pn: Photosynthesis, Gs: Stomatal conductance; ICO2: Internal CO2; E: Transpiration; VPD: vapor pressure deficit; LT: Leaf internal temperature; WUE: Water use efficiency; CEI: instantaneous carboxylation efficiency index. y Each value represents the mean. Different letters represent significant differences between genotypes at p ≤ 0.05 (Tukey’s test) and significant differences between groups at p ≤ 0.05 (LSD test).
Table 5. Combined analysis of variance for altitude and tuberization capacity factors for eco-physiological, morphological and productive parameters.
Source zAltitude (A)Tuberization (T)A * T
DF y212
Pn32.61 * x67.25 **13.51
Gs0.020.000.19
ICO277.5230.2280.9
E7.435.760.85
VPD0.190.250.12
LT0.902.704.09
WUE1.14 **1.37 **0.12
CEI0.00040.0012 **0.0003
Root number2.56142.85 ***4.42
Root weight 219,952.322,664,236.85 ***227,622.92
Leaf area1276.23204.2384.5
Leaf perimeter259.62622.58296.13
Leaf circularity0.020.14 *0.06
Leaf roundness0.00040.02 *0.0079
Leaf solidity0.020.11 *0.03
z Pn: Photosynthesis; Gs: Stomatal conductance; ICO2: Internal CO2; E: Transpiration; VPD: vapor pressure deficit; LT: Leaf internal temperature; WUE: Water use efficiency; CEI: Carboxylation efficiency index. y DF: Degree freedom. x Each value represents the mean square. Significance: *** p < 0.001; ** p < 0.01; * p < 0.05.
Table 6. Means comparison of morphometric and agronomic parameters in several ecotypes of sweet potato.
GenotypesNumber of Storage Roots per PlantStorage Roots Weight per PlantLeaf AreaLeaf PerimeterCircularitySoil Cover zMature Leaf Size y
High altitude (1401–2555 masl)
0216-243.NAR0.00e x0.00h48.39jkl31.59m0.59abcd35
0816-610.BOY0.00e0.00h91.95defgh44.43hijklm0.59abcde35
0316-286.STR0.00e0.00h45.41jkl107.46a0.05k35
0816-587A.BOY0.00e0.00h75.73efghij39.13klm0.62ab35
0816-600.BOY5.33bc889.00c53.49ijkl56.82efghij0.21ij55
0516-491.CLD0.00e0.00h66.22fghijkl40.41ijklm0.51cdefg33
0516-515.CLD0.00e0.00h64.20ghijkl42.91ijklm0.44fgh33
0316-299.STR10.33a1326.00b121.40bcd51.46ghijkl0.58abcde75
0516-503.CLD0.00e0.00h94.36defgh53.86fghijkl0.41gh33
0816-595.BOY0.00e0.00h102.10cdef48.53ghijklm0.55abcde35
0816-596.BOY0.00e0.00h133.26bc52.50ghijkl0.61abc35
0816-582.BOY0.00e0.00h102.99cdef49.20ghijklm0.54abcde33
0816-581.BOY0.00e0.00h77.88efghij43.39ijklm0.52bcdef33
0316-263.STR0.00e0.00h58.18hijkl37.83lm0.51cdef33
0316-251.STR1.33de211.00fg118.32bcd54.96efghijkl0.49efgh55
0316-261.STR0.00e0.00h57.60hijkl42.11ijklm0.41h33
0316-283A.STR6.33b670.00d97.68cdefg47.50ghijklm0.54abcde55
0816-615.STR0.00e0.00h92.99defgh64.29defg0.28i35
0316-257.STR0.00e0.00h32.90kl87.59bc0.05k35
Group mean1.22162.980.7952.410.44
Intermediate altitude (924–1298 masl)
0516-357.QND0.00e0.00h28.81l88.72b0.05k35
0715-096.NS0.00e0.00h85.88defghi70.79cdef0.22ij55
0715-099.NS0.00e0.00h72.46efghij76.28bcd0.16j55
0816-618.STR1.33de56.00gh69.03fghijk41.51ijklm0.50defgh35
0715-086.CES0.00e0.00h92.65defgh45.79hijklm0.53bcdef33
0316-300.STR5.67bc415.33e73.28efghij39.36jklm0.59abcd35
0113-660.VAL0.00e0.00h152.99b57.63efghi0.58abcde75
0113-668.VAL4.67c160.00fgh191.66a61.41defgh0.64a55
0316-256.STR2.33d430.67e146.61b54.99efghijkl0.60abc77
Group mean1.55118101.4959.600.43
Low altitude (18–599 masl)
0715-076.CES2.67d322.00ef94.05defgh45.12hijklm0.58abcde55
0516-352-HUI2.67d162.00fgh53.49ijkl49.97ghijkl0.27i55
0816-620.STR0.00e0.00h58.54hijkl56.39efghijk0.23ij33
0715-105.CES0.00e0.00h99.21cdefg72.47bcde0.24ij35
Ambarina2.33d1226.67b113.07bcde52.75fghijkl0.50defgh37
Aurora6.67b1874.33a67.81fghijkl36.24lm0.65a77
Group mean2.39597.581.0352.150.41
z Soil cover, 3: low < 50%, 5: medium 50–74%, 7: high >75%; y Mature leaf size, 3: small < 3 cm, 5: medium 8–15 cm, 7: large 16–25 cm. Different letters represent significant differences between genotypes at p ≤ 0.05 (Tukey’s test for genotypes and LSD’s test for altitude groups).
Table 7. Means comparison between groups of genotypes with storage roots and without storage roots according to ecophysiological, morphometric and agronomic parameters.
TraitsUnitsGenotypes with Storage RootsGenotypes without Storage Roots
Ecophysiological parameters
Pn zµmol CO2 m−2 s−129.55a y26.78b
Gsmol H2O m−2 s−11.41a1.38a
ICO2μmol CO2 mol−1292.54a297.93a
Emmol H2O m−2 s−111.66b12.46a
VPDkPa1.24b1.39a
LT°C33.59a33.08a
WUEµmol CO2/mmol H2O2.58a2.19b
CEI--0.102a0.09b
Morphometric parameters
Leaf areacm2102.03a78.54b
Leaf perimetercm49.56b57.12a
Circularity--0.51a0.39b
Round--0.89a0.83b
Solidity--0.84a0.73b
Number of storage roots per plantStorage roots/plant4.310
Storage roots weight per plantg/planta645.250
z Pn: Net photosynthesis rate; Gs: Stomatal conductance; ICO2: Internal CO2; E: Transpiration; VPD: vapor pressure deficit; LT: Leaf internal temperature; WUE: Water use efficiency; CEI: Carboxylation efficiency index. y Each value represents the mean. Different letters represent significant differences between genotypes at p ≤ 0.05 (LSD’s test).
Table 8. Comparison between qualitative characteristics using Chi2 square test between groups of genotypes with storage roots and without storage roots.
ParameterScaleGenotypes without Storage Roots (%)Genotypes with Storage Roots (%)Totaldfb zChi2
Soil coverLow (<50%)52.9411.7664.71210.61 *** y
Medium (50–74%)5.8817.6523.53
High (75–90%)2.948.8211.76
Total61.7638.24100
Mature leaf sizeSmall (<8 cm)23.532.9426.4727.71 *
Medium (8–15 cm)38.2426.4764.71
Large (16–25 cm)08.828.82
Total61.7638.24100
Latex productionNone52.942.9455.88220.21 ***
Little8.8229.4138.24
Abundant05.885.88
Total61.7638.24100
z df: degree freedom. y Significance *** p < 0.0001, * p < 0.05.
Publisher’s Note: MDPI stays neutral with regard to jurisdictional claims in published maps and institutional affiliations.

