Article

A Novel Method for Estimating Nitrogen Stress in Plants Using Smartphones

Department of Horticulture and Landscape Architecture, Purdue University, West Lafayette, IN 47907, USA
*
Author to whom correspondence should be addressed.
Horticulturae 2020, 6(4), 74; https://doi.org/10.3390/horticulturae6040074
Submission received: 1 October 2020 / Revised: 22 October 2020 / Accepted: 26 October 2020 / Published: 29 October 2020

Abstract

:
For profits in crop production, it is important to ensure that plants are not subjected to nitrogen stress (NS). Methods to detect NS in plants are either time-consuming (e.g., laboratory analysis) or require expensive equipment (e.g., a chlorophyll meter). In this study, a smartphone-based index was developed for detecting NS in plants. The index can be measured in real time by capturing images and processing them on a smartphone with network connectivity. The index is calculated as the ratio of blue reflectance to the combined reflectance of blue, green, and red wavelengths. Our results indicated that the index was specific to NS and decreased with increasing stress exposure in plants. Further, the index was related to photosynthesis based on the path analysis of several physiological traits. Our results further indicate that index decreased in the NS treatment due to increase in reflectance of red and green (or yellow) wavelengths, thus it is likely related to loss of chlorophyll in plants. The index response was further validated in strawberry and hydrangea plants, with contrasting plant architecture and N requirement than petunia.

Graphical Abstract

1. Introduction

Nitrogen (N) is one of the major elements essential for plant growth, development, and quality. Maintaining optimal N concentration in the plant tissue is essential for increasing productivity and profitability in controlled environment agriculture (CEA). In spite of supplying plants with optimal fertilizer solution concentration, plant N uptake can vary from pot to pot due to differences in substrate pH, leaching, water content, and crop growth. Therefore, monitoring N concentration of the plant tissue is more useful than measuring N concentration supplied to plants or present in the substrate, to ensure that plants are not exposed to N stress in CEA.
Nitrogen concentration in the tissue can be measured in a laboratory. However, plant sample analysis in a laboratory can be both expensive and time-consuming. Sensors recommended for indirect measurement of plant N status in CEA systems are expensive (e.g., chlorophyll meter, Soil Plant Analysis Development (SPAD), Normalized Deviation Vegetation Index (NDVI) sensor). Moreover, some sensor measurements (e.g., NDVI) can be potentially confounded by the signal from the background when the canopy is not fully closed [1], leading to errors. Other sensors for measuring crop N status including Cropscan, Greenseeker, Yara N-sensor and Fieldspec-Spectroradiometer [2] are more suitable for conventional agriculture and not CEA. Therefore, regularly monitoring plant N status in CEA can be challenging with available techniques.
Plant N status can be assessed using plant images. Chlorophyll pigment in the leaves absorb red, blue, and a small proportion of green wavelengths incident on plants [3]. Because tissue N concentration affects chlorophyll synthesis in plants [4,5], a deficiency of N in the tissue can decrease the concentration of chlorophyll and increase reflectance of red, blue, and green wavelengths from plants. Therefore, an indirect assessment of N stress experienced by plants can be made by measuring the reflectance of red, blue, and green wavelengths from a canopy [2,6,7,8]. Images are comprised of pixels that store information on the intensity of reflected light from an object. Reflectance from plants can be measured to estimate N status of plants by processing images using image analysis software [9].
Using this technique, hyper-spectral and multi-spectral imaging platforms are being developed for N stress assessments in plants [10,11,12]. Several indices for N stress have been developed using reflectance in the red, blue, green, red-edge, and near infrared regions of the light spectrum [12,13,14,15,16,17,18,19]. Although these platforms and indices are available, they are not widely used in academic research and industry. Some of the reasons for this include high equipment cost, complicated hardware and software, and the selective nature of developed applications. Smartphones can capture high quality images of plants. Color images captured by a smartphone can be separated into blue, green, and red channels. Thus, the images captured by smartphones can be processed to measure reflectance in the blue, green, and red wavebands. From this, it is possible to develop indices for N stress in plants. With advancements in cloud computing, software can be developed and made accessible on smartphones with network connectivity. The images can be captured, processed, and N stress index measured in real-time using smartphones, similar to other remote sensing platforms. Nitrogen stress assessments made using smartphones can be highly valuable as these devices are universally available and simple to use. However, there is limited research that has tested or developed smartphone- based applications for assessing N stress in plants.
It is well known that carotenoids in addition to chlorophyll affect blue light absorption [20,21,22], while mainly chlorophyll absorbs red light [20,21,23]. Furthermore, the xanthophyll (a carotenoid) pool can increase in response to N stress in plants [24,25]. Therefore, it is possible that the reflectance of blue light is relatively less (or absorption is relatively more) than other wavelengths under N stress, as blue light can be absorbed by carotenoids in addition to chlorophyll. Based on this, we hypothesized that the ratio of blue light reflectance to that of the combined blue, green, and red wavebands will decrease under N stress in plants. The objectives of this research were to (i) test the hypothesis that the ratio of blue light reflectance to that of combined reflectance in the visible band can be used as an index for N stress, (ii) study the association between the N stress index and the physiological pathways in plants, and (iii) develop a smartphone application to measure the N stress index in species with differences in plant architecture.

2. Materials and Methods

The study comprised of “proof-of-concept” and “product development” experiments. Hypothesis testing, associating index with physiological pathways, and testing index specificity to N stress were conducted in the proof-of-concept experiment using a multispectral image station with tight control on incident light intensity, spectrum, and distance between object and camera. The purpose of the product development experiment was to test a smartphone application for measuring the N stress index in two different species with contrasting plant architecture under real-world conditions in a greenhouse. Incident light intensity, spectral composition, and distance between the plant and camera were similar but not tightly controlled in the product development experiment.

2.1. Proof-of-Concept Experiment

The experiment was conducted during July and August of 2017 in a temperature-controlled glass greenhouse at Purdue University, West Lafayette, IN using petunia (Petunia × hybrida L. var. “Easy Wave Red Velour”). It is well known that growth rate and nutrient requirements of petunia is higher than other herbaceous greenhouse crops [26]. Therefore, large effects can be observed in N stress index among treatments (see below) using petunia. Seeds were purchased from Ball Seed Company (West Chicago, IL, USA) and germinated in plug flats (72-cell, Landmark Plastics, Akron, OH, USA) filled with a propagation mix (Fafard®, germination mix, Sungro Horticulture, Agawam, MA, USA). The trays were placed in a mist until germination, after which, seedlings were transplanted into 0.45 L containers (Hummert International, Earth City, MO, USA) filled with a peat-based soilless substrate (Sunshine mix #8, Sungro Horticulture) containing 75% peat, 20% perlite, and 5% vermiculite. Plants were fertilized with a solution made by mixing 15N-2.2P-12.5K and 21N-2.2P-16.6K commercial fertilizers (Peters Excel, ICL specialty fertilizer, UK) in a 3:1 ratio every alternate day. The electrical conductivity (EC) of the fertilizer solution (a measure of total fertilizer ions dissolved in the solution) was 2.0 dS·m−1 and contained an N concentration of 198 mg N·L−1, except in the nitrogen stress treatment (see Treatments section below). The pH of the substrate was maintained between 6.0 to 6.5 during the study. Greenhouse was maintained at a day/night temperature of 26/20 ± 2.4/1.1 °C, daily light integral of 20 to 25 mol·m−2·d−1, and relative humidity close to 50% during the study.
Plants were grown under optimal conditions for two weeks after transplanting. After this, plants were subjected to three treatments including optimal or control (C), drought stress (DS), and nitrogen stress (NS). Drought stress was applied by maintaining a low substrate volumetric water content (θ) of 0.15 m3·m−3 and supplying a fertilizer solution with EC of 2.0 dS·m−1. Nitrogen stress was provided by supplying a fertilizer solution with an EC of 0.75 dS·m−1 and maintaining a θ level of 0.48 m3·m−3. Plants in the optimal treatment were grown at an θ level of 0.47 m3·m−3 using a fertilizer solution with an EC of 2.0 dS·m−1. Plants were grown under different treatments for five weeks.
Solution EC, substrate EC (ECs), and θ were measured weekly using a dielectric sensor (ECHO 5TE, Meter Group, Pullman, WA, USA). A line quantum sensor (SQ-326-SS, Apogee instruments, Logan, UT, USA) was used to measure photosynthetic photon flux density (PPFD) at the canopy level during the middle of the day.
A custom measuring station with three quantum sensors (LI190, LI-COR Biosciences, Lincoln, NE, USA) was used to measure the light absorption fraction (Iabs) of plants. A group of four plants in a tray was moved from the main experiment to the station for measurement of incident, transmitted and reflected light intensity (PPFDi, PPFDt and PPFDr, respectively) in different treatments. We measured PPFDi by placing a quantum sensor horizontally on a flat surface at approximately canopy height. A second quantum sensor was placed at the bottom of the canopy to measure PPFDt. In addition, a third quantum sensor was placed upside down at an angle of 45° towards the canopy and 0.3 m above the plants was used to measure PPFDr. The intensity of light absorbed by the plants (PPFDa) was calculated as described by [27]:
P P F D a = P P F D i ( P P F D r + P P F D t )
Fraction of incident light absorbed by plants was calculated as follows:
I a b s = P P F D a P P F D i
Leaf photosynthetic rate (A) and quantum efficiency in light (ɸPSII) were measured according to the procedure described by [28] using a leaf chamber fluorometer with an LED light source attached to an open-flow leaf gas exchange system (LI-COR-6400XT, LI-COR Biosciences). Measurements were taken on three separate leaves belonging to different plants within each treatment at midday prior to harvest. Fully expanded new leaves were clamped and exposed to a reference CO2 concentration of 400 µmol·mol−1 and a light intensity of 400 µmol·m−2·s−1 inside the chamber. The proportion of red and blue light was 90 and 10%, respectively. Relative humidity and temperature inside the leaf chamber were maintained at 40–70% and 25 °C, respectively.
Canopy area (CA) and reflectance at 450 (blue), 521 (green), and 660 (red) nm were measured on the 4th, 8th, 16th, 22nd, 27th, and 34th day after imposing treatments using a multi-spectral image station (TopView, Aris, Eindhoven, The Netherlands). A group of four plants from each treatment were placed inside the image station and sequentially exposed to 450, 521, 625, and 660 nm of light using strobe light-emitting diodes (OSLON SSL80, Osram, Munich, Germany). A monochromatic camera (acA3800; Basler Ace, 10 MP with MT9J003 CMOS sensor, 8-bits resolution, ON Semiconductor, AZ, USA) inside the image station captured grayscale images (Figure 1) for each light exposure. The images were automatically stored with unique file names.
Captured images were processed automatically using built-in MultiSpec software V2.0 (Aris, The Netherlands). Image processing involved developing a mask of plant, separating plant pixels from the background by super-imposing a mask on the image, counting plant pixels, and measuring average gray value of plant pixels from each image exposed to 450, 521, and 660 nm wavelengths. The average gray value of a grayscale image is related to average reflectance of light from the objects (i.e., plants) captured in the image. As plants absorb more blue and red wavelengths in photosynthesis, images from blue (450 nm) and red (660 nm) exposures are less bright (lower gray value) than those from green (521 nm) exposure as relatively more green light is reflected by plants (Figure 1). From the gray values, N stress index (R) was calculated as the ratio of average gray value of 450 nm image to combined gray value of 450, 521, and 660 nm images.
R = G r a y   V a l u e 450 G r a y   V a l u e ( 450 + 521 + 660 )
Image-processing software automatically measured CA by counting the number of plant pixels, and multiplying the pixel number by the individual pixel area and magnification factor (specific to the camera inside the image station). Plants were harvested after five weeks of exposure to different treatments. Shoot material was dried in a forced oven maintained at 70 °C for one week. The dried samples were weighed to measure shoot dry weight (SDW).

2.2. Product Development Experiment

The experiment used strawberry (Fragaria × ananassa var. “Quinault”) and hydrangea (Hydrangea paniculate var. “Bobo”). These species were selected due to their differences in leaf shape, growth rate, N requirement, and architecture to petunia. Strawberry runners were separated from stock plants available with researchers. Hydrangea plants were purchased from Spring Meadow Nursery Inc. (MI, USA). Strawberry runners were transplanted in plastic containers (10 cm diameter, 0.45 L, Hummert International, Earth City, MO, USA) and hydrangea plants were transplanted in nursery containers (16 cm diameter, 3.78 L, Greenhouse Megastore, Danville, IL, USA). Containers for both strawberry and hydrangea plants were filled with the same media used in the proof-of-concept experiment. A fertilizer solution containing EC of 1.0 dS·m−1 was supplied to strawberry plants during the establishment stage. After two weeks, strawberry plants were exposed to C and NS treatments. Plants in the C and NS treatments received fertilizer solutions containing an EC of 2.0 and 0.75 dS·m−1, respectively twice a week. The hydrangea plants were grown in four N fertilizer treatments containing 9, 15, 21 and 30 g·pot−1 of 21N-2.2P-16.6K commercial fertilizer (Peters Excel, ICL specialty fertilizer, UK), respectively. The substrate water content and environmental conditions were similar to the proof-of-concept experiment.
Smartphone images of strawberry plants and hydrangea branches were captured after three and five weeks of exposure to treatments, respectively. In addition, hydrangea branches were imaged inside the multi-spectral image station used in the proof-of-concept experiment. This was done to compare the N stress indices measured by the smartphone (Rsp) and multi-spectral image station (R). Prior to capturing images, strawberry plants were placed on the greenhouse floor. The images of whole strawberry plants were captured by placing the smartphone approximately 60 cm above plants (Figure 2). A black plastic sheet (0.45 m × 0.45 m) was used as the background for hydrangea branches. Each branch, while attached to the mother plant, was inserted through a slit in the middle of the plastic sheet. The smartphone was placed approximately 30 cm above the plastic sheet for capturing images. After capturing smartphone images, the branch was cut and placed inside the image station. The images of hydrangea branches were captured inside the multispectral image station as described above for petunia plants in the proof-of-concept experiment. The time between cutting the branch from the mother plant and imaging the branch inside the image station was less than a minute.
The image-processing software for analyzing images of strawberry plants and hydrangea branches collected by the smartphone was developed using Matlab (R2017B, MathWorks, Natic, MA, USA). The image processing method used was similar to that described in other published works [19,29]. The developed software was loaded to an online drive (Matlab Drive, MathWorks) and accessed on the smartphone using an app (Matlab Mobile, MathWorks). The software controls the camera of the smartphone and displays a video of the plant on the screen to enable users to capture images from a preferred height. The software on the Matlab Drive automatically processed images after capture. Image processing involved separating the color image into red, green, and blue channels, enhancing green color and developing a mask, segmenting plant pixels by superimposing the mask on red, green, and blue channels, and measuring the average gray value of plant pixels in each channel (Figure 2). From the average gray values, software automatically calculated Rsp and stored the results of the analysis as a Microsoft excel file:
R s p = G r a y   V a l u e b l u e G r a y   V a l u e ( b l u e + g r e e n + r e d )
Equation (4) is similar to, but slightly different from Equation (3) used to measure R from images captured by the multi-spectral image station. Plants were exposed to narrow wavebands of 450, 521, and 660 nm in the multi-spectral image station using strobed LED lights. Such exposure to narrow wave bands is not possible using a smartphone. The images captured by the smartphone are based on the broadband blue (400 to 499 nm), green (500 to 599 nm) and red (600 to 700 nm) wavelengths in the natural light. Therefore, average gray values of images captured by the multi-spectral image station and smartphone were based on narrow and broadband wavelengths, respectively.

2.3. Experimental Design and Data Analyses

A randomized complete block design with four replications was used in both the proof-of-concept and product development experiments. Data were analyzed using a linear mixed model (Proc Mixed) procedure of statistical analysis software (SAS, SAS Institute, Cary, NC, USA) with repeated measures as needed. Tukey’s honestly significant difference procedure was used to separate least square means. Path analyses in the main experiment was conducted using the “Proc Calis” procedure of SAS. For all analyses, a p ≤ 0.05 was considered statistically significant.

3. Results and Discussion

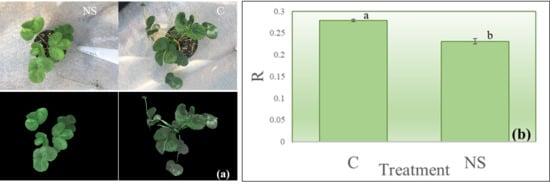
3.1. Proof-of-Concept Experiment

Statistical analyses indicated that the environmental conditions were significantly different in the NS and DS compared to C treatment (Table 1). Photosynthetic photon flux density incident on plants was not significantly different among the treatments and averaged 417 µmol·m−2·s−1 (Table 1). However, θ was significantly lower in the DS compared to the other two treatments. A θ value of 0.15 m3·m−3 was maintained in the DS treatment based on a previous work [30] that showed a decline in the growth of bedding plants including petunia at this level. Substrate EC was significantly lower in both the NS and the DS compared to the C treatment. In addition, ECs was significantly lower in the DS compared to the NS treatment. The ECH2O-5TE sensor used in our experiment measures electrical resistance to calculate EC. Electrical resistance increases or conductivity decreases when the current flow through the solution decreases. The current flow can decrease significantly when θ is low, as in the DS treatment. In addition, the sensor measures bulk EC (influenced by dielectric permittivity of water, dissolved ions, substrate particles, and air), therefore the values are lower than other commonly used sensors measuring pore–water conductivity. In previous research, pore–water EC was 1.8 times higher than bulk water EC measurements for the substrate used in this experiment [31]. Based on this, the equivalent pore–water ECs in the C and NS treatments can be estimated as 1.3 and 0.6 dS·m−1, respectively.
Statistical analyses indicated that SDW was higher in the C compared to the other treatments. Furthermore, SDW was significantly higher in the NS than DS treatment (Table 2). This confirms that the stress treatments in our experiment decreased plant growth compared to C treatment. A significant decrease in CA, Iabs and A were observed in the DS whereas only A was significantly lower in the NS compared to the control (Table 2). This may suggest that nitrogen stress mainly affects plant growth by reducing A. Photosynthesis is affected by light absorption, generation of energy in the light-dependent reactions and utilization of energy in the Calvin cycle [32,33]. Nitrogen stress can reduce both light absorption (by decreasing chlorophyll concentration) [4,34] and utilization of energy in the Calvin cycle (due to decreased enzymatic activity) [35,36] in plants. There were no differences in ɸPSII among the treatments, although a numerically lower value was observed in the NS treatment. Lack of significance could be due to small effect size and/or large variability in the ɸPSII measurements. A similar decline ɸPSII (without statistical significance) of wheat plants under N stress was previously reported [37].
Nitrogen stress index was significantly lower in the NS than C, but not different between the DS and C treatments (Table 2). Reflectance-based measurements are mostly affected by chlorophyll concentration [3,38]. Nitrogen stress can significantly reduce the chlorophyll concentration [4,34], while DS may have a relatively smaller effect on chlorophyll in plants [39]. This may be the reason for the observed R differences in the NS than the DS compared to C treatment in our experiment (Table 2). Furthermore, the result supports our hypothesis that the ratio of blue light reflectance to that of combined reflectance in the visible band can be used as an index for N stress. In addition, the index was specific to NS and was not affected by DS. Analyses of changes in R with time indicated no significant differences on any day between the DS and C treatments (Figure 3). However, a gradual decrease in R was observed with stress progression in the NS treatment. There were no differences in R on the 4th, 8th, 16th and 22nd day after imposing treatments, but the differences became gradually larger. By the 27th and 34th day of stress exposure, the decrease in R was large to significant in the NS compared to C. A significantly lower R was associated with a significantly lower A and a numerically lower ɸPSII in the NS compared to the C treatment (Table 2 and Figure 3). This may suggest that R measurements are related to photosynthetic pathways in plants.
The path analysis tested the model where SDW was considered as a primary response affected by several lower-order responses including Iabs, A, CA, ɸPSII and R. When the data were pooled from the C, NS and DS treatments, path analyses indicated that R, ɸPSII and CA were exogenous (not affected by other variables) and A, Iabs and SDW were endogenous (affected by other variables) in nature (Figure 4). Furthermore, the model indicated that SDW was dependent on both A and CA and the reliability of the effects on SDW was high (error was 0.32; Figure 3). Both CA and A are known to influence biomass production in plants [40,41,42]. This supports that A and CA are secondary responses affecting SDW. Furthermore, CA affected Iabs. Light absorption is proportional to light interception by the canopy, which in turn is proportional to CA [43,44]. The model also indicated that ɸPSII directly affected A, which is expected. Interestingly, the model indicated that R inversely affected A. This supports our finding that R measurements are related to the photosynthetic pathway, however the effects observed in the model are opposite to those observed between R and A in the NS treatment. This could be because the model included data from the DS and C treatments in addition to the NS treatment. Furthermore, the effects of A on SDW and that of R and ɸPSII on A were not significant when NS data were removed from the model. This may suggest that NS effects on plants are primarily due to the reduction in A. In addition, the model supports that R is related to photosynthesis pathways. Both R and ɸPSII showed covariance with CA, but there were no causal relationships among them. Based on the model, R and ɸPSII can be considered as independent tertiary responses affecting A.

3.2. Product Development Experiment

Image analysis software effectively segmented strawberry plants from the background in the images captured by the smartphone (Figure 2). In spite of broadband wavelengths used in the smartphone method, Rsp of strawberry plants in the NS treatment was significantly lower than that of plants in the C treatment (Figure 5), similar to responses observed for petunia in the proof-of-concept experiment. This indicates that the broadband wavelengths used in the Rsp estimation were equally effective as narrowband wavelengths used in the proof-of-concept experiment.
The decrease in R or Rsp in the NS treatment was related to an increase in the gray value (or reflectance) of combined blue, green and red wavelengths as opposed to decreases in the gray value of blue wavelength in both petunia and strawberry (Table 3). This indicates that N stress effects were more pronounced on the reflectance of red and green wavelengths than the blue wavelength. As described before, carotenoids and xanthophylls in addition to chlorophyll can absorb blue light [20,21,22]. While chlorophyll synthesis is affected by N stress, the xanthophyll (a carotenoid) pool can increase in response to N stress in plants [24,25]. Thus, reflectance (or gray value) of blue wavelengths is relatively less affected than green or red wavelengths under N stress. In addition, decrease in chlorophyll can expose xanthophyll pigments, which are yellow in color [25]. As yellow is a combination of red and green colors, an increase in yellow color on the leaf surface may result in increased gray values for red and green channels. Given this, the decrease in R-value in the NS treatment is likely due to a loss of chlorophyll or increased xanthophyll absorption (appearance of yellow coloration on the leaf).
There was a linear relationship between N stress indices measured using smartphone and multi-spectral image stations in hydrangea (Figure 6). This indicates that the N stress index estimated using a smartphone is comparable to the values estimated using a multi-spectral image station. Interestingly, Rsp value changed approximately by 1.7-folds for one-fold change in R-value. Furthermore, statistical analysis (data not shown) indicated that Rsp values of hydrangea plants grown at the two highest N fertilizer treatments (30 and 21 g·pot−1) were significantly higher than those in the two lowest N fertilizer treatments (3 and 9 g·pot−1), whereas R-values trended lower in the two lowest N fertilizer treatments compared to those in the two higher N fertilizer treatments. This may suggest that Rsp is more sensitive than R in the detection of differences between the treatments. One possible reason for this could be due to the broadband wavelengths used in measuring Rsp. The difference can be larger when multiple wavelengths are included in the estimation of an index, especially if the effects are spread across the broadband.

4. Conclusions

In this study, we tested an index for N stress based on the images of plants. The index was calculated as the ratio of reflectance of blue relative to the reflectance of combined wavelengths in the visible band. The index value decreased when plants were exposed to NS relative to optimal conditions. Furthermore, the index value decreased gradually with increasing N stress in plants. Therefore, the continuous measurement of index can aid in the timely detection of N stress in plants. The index can be estimated using images captured by smartphones and image processing software loaded on network drives. The smartphone-based approach can be attractive to users in academia and industry. It is possible to make image-processing software available to users on a webserver. Using the network connectivity on smartphones, users can connect to the webserver, capture images using a smartphone, and process images on the webserver in real time to estimate N stress index.

Author Contributions

R.A. conducted experiments, analyzed data, and helped in the drafting of an early version of the manuscript; K.N. was responsible for overall project management, provided resources and helped in data interpretation and the final draft of the manuscript. All authors have read and agreed to the published version of the manuscript.

Funding

This research received funding from Fred Gloeckner Foundation, American Floral Endowment and Horticultural Research Institute.

Acknowledgments

We thank Jacob Brasseur for helping with capturing images of plants.

Conflicts of Interest

The authors declare no conflict of interest.

References

  1. Xue, J.; Su, B. Significant remote sensing vegetation indices: A review of developments and applications. J. Sens. 2017. [Google Scholar] [CrossRef] [Green Version]
  2. Muñoz-Huerta, R.F.; Guevara-Gonzalez, R.G.; Contreras-Medina, L.M.; Torres-Pacheco, I.; Prado-Olivarez, J.; Ocampo-Velazquez, R.V. A review of methods for sensing the nitrogen status in plants: Advantages, disadvantages and recent advances. Sensors 2013, 13, 10823–10843. [Google Scholar] [CrossRef] [PubMed]
  3. Sims, D.A.; Gamon, J.A. Estimation of vegetation water content and photosynthetic tissue area from spectral reflectance: A comparison of indices based on liquid water and chlorophyll absorption features. Remote Sens. Environ. 2003, 84, 526–537. [Google Scholar] [CrossRef]
  4. Evans, J.R. Photosynthesis and nitrogen relationships in leaves of C 3 plants. Oecologia 1989, 78, 9–19. [Google Scholar] [CrossRef] [PubMed]
  5. Xue, L.; Cao, W.; Luo, W.; Dai, T.; Zhu, Y. Monitoring leaf nitrogen status in rice with canopy spectral reflectance. Agron. J. 2004, 96, 135–142. [Google Scholar] [CrossRef]
  6. Thomas, J.R.; Oerther, G.F. Estimating nitrogen content of sweet pepper leaves by reflectance measurements1. Agron. J. 1972, 64, 11–13. [Google Scholar] [CrossRef]
  7. Meyer, G.E.; Troyer, W.W.; Fitzgerald, J.B.; Paparozzi, E.T. Leaf nitrogen analysis of poinsettia (Euphorbia pulcherrima Will D.) using spectral properties in natural and controlled lighting. Appl. Eng. Agric. 1992, 8, 715–722. [Google Scholar] [CrossRef]
  8. Erdle, K.; Mistele, B.; Schmidhalter, U. Comparison of active and passive spectral sensors in discriminating biomass parameters and nitrogen status in wheat cultivars. Field Crop. Res. 2011, 124, 74–84. [Google Scholar] [CrossRef]
  9. Tewari, V.K.; Arudra, A.K.; Kumar, S.P.; Pandey, V.; Chandel, N.S. Estimation of plant nitrogen content using digital image processing. Agric. Eng. Int. CIGR J. 2013, 15, 78–86. [Google Scholar]
  10. Kim, Y.; Reid, J.F. Modeling and calibration of a multi-spectral imaging sensor for in-field crop nitrogen assessment. Appl. Eng. Agric. 2006, 22, 935–941. [Google Scholar] [CrossRef] [Green Version]
  11. Noh, H.; Zhang, Q.; Shin, B.; Han, S.; Feng, L. A neural network model of maize crop nitrogen stress assessment for a multi-spectral imaging sensor. Biosyst. Eng. 2006, 94, 477–485. [Google Scholar] [CrossRef]
  12. Leemans, V.; Marlier, G.; Destain, M.F.; Dumont, B.; Mercatoris, B. Estimation of leaf nitrogen concentration on winter wheat by multispectral imaging. In Hyperspectral Imaging Sensors: Innovative Applications and Sensor Standards; International Society for Optics and Photonics: Bellingham, WA, USA, 2017; Volume 10213, p. 102130I. [Google Scholar]
  13. Peñuelas, J.; Filella, I. Visible and near-infrared reflectance techniques for diagnosing plant physiological status. Trends Plant Sci. 1998, 3, 151–156. [Google Scholar] [CrossRef]
  14. Ma, B.L.; Morrison, M.J.; Dwyer, L.M. Canopy light reflectance and field greenness to access nitrogen fertilization and yield of maize. Agric. J. 1996, 88, 915–920. [Google Scholar]
  15. Baret, F.; Fourty, T. Radiometric estimates of nitrogen status of leaves and canopies. In Diagnosis of the Nitrogen Status in Crops; Springer: Berlin/Heidelberg, Germany, 1997; pp. 201–227. [Google Scholar]
  16. Zhu, Y.; Yao, X.; Tian, Y.; Liu, X.; Cao, W. Analysis of common canopy vegetation indices for indicating leaf nitrogen accumulations in wheat and rice. Int. J. Appl. Earth Obs. Geoinf. 2008, 10, 1–10. [Google Scholar] [CrossRef]
  17. Tremblay, N.; Wang, Z.; Ma, B.L.; Belec, C.; Vigneault, P.A. Comparison of crop data measured by two commercial sensors for variable-rate nitrogen application. Precis. Agric. 2009, 10, 145. [Google Scholar] [CrossRef]
  18. Corti, M.; Gallina, P.M.; Cavalli, D.; Cabassi, G. Hyperspectral imaging of spinach canopy under combined water and nitrogen stress to estimate biomass, water, and nitrogen content. Biosyst. Eng. 2017, 158, 38–50. [Google Scholar] [CrossRef]
  19. Adhikari, R.; Li, C.; Kalbaugh, K.; Nemali, K. A low-cost smartphone- controlled sensor based on image analysis for estimating whole-plant tissue nitrogen (N) content in floriculture crops. Comput. Electron. Agric. 2020, 169, 105173. [Google Scholar] [CrossRef]
  20. Sims, D.A.; Gamon, J.A. Relationships between leaf pigment content and spectral reflectance across a wide range of species, leaf structures and developmental stages. Remote Sens. Environ. 2002, 81, 337–354. [Google Scholar] [CrossRef]
  21. Croft, H.; Chen, J.M. Leaf pigment content. In Reference Module in Earth Systems and Environmental Sciences; Elsevier Inc.: Oxford, UK, 2017; pp. 1–22. [Google Scholar]
  22. Bartley, G.E.; Scolnik, P.A. Plant carotenoids: Pigments for photoprotection, visual attraction, and human health. Plant Cell 1995, 7, 1027. [Google Scholar]
  23. Gates, D.M.; Keegan, H.J.; Schleter, J.C.; Weidner, V.R. Spectral properties of plants. Appl. Opt. 1965, 4, 11–20. [Google Scholar] [CrossRef]
  24. Tóth, V.R.; Mészáros, I.; Veres, S.; Nagy, J. Effects of the available nitrogen on the photosynthetic activity and xanthophyll cycle pool of maize in field. J. Plant Physiol. 2002, 159, 627–634. [Google Scholar] [CrossRef]
  25. Verhoeven, A.S.; Demmig-Adams, B.; Adams, W.W., III. Enhanced employment of the xanthophyll cycle and thermal energy dissipation in spinach exposed to high light and N stress. Plant Physiol. 1997, 113, 817–824. [Google Scholar] [CrossRef] [Green Version]
  26. Nemali, K.; van Iersel, M.W. Light intensity and fertilizer concentration: II. Optimal fertilizer solution concentration for species differing in light requirement and growth rate. HortScience 2004, 39, 1293–1297. [Google Scholar] [CrossRef] [Green Version]
  27. Olascoaga, B.; Mac Arthur, A.; Atherton, J.; Porcar-Castell, A. A comparison of methods to estimate photosynthetic light absorption in leaves with contrasting morphology. Tree Physiol. 2016, 36, 368–379. [Google Scholar] [CrossRef] [PubMed] [Green Version]
  28. Long, S.P.; Bernacchi, C.J. Gas exchange measurements, what can they tell us about the underlying limitations to photosynthesis? Procedures and sources of error. J. Exp. Bot. 2003, 54, 2393–2401. [Google Scholar] [CrossRef] [Green Version]
  29. Li, C.; Adhikari, R.; Yao, Y.; Miller, A.G.; Kalbaugha, K.; Li, D.; Nemali, K. Measuring plant growth characteristics using smartphone based image analysis technique in controlled environment agriculture. Comput. Electron. Agric. 2020. [Google Scholar] [CrossRef]
  30. Nemali, K.S.; van Iersel, M.W. An automated system for controlling drought stress and irrigation in potted plants. Sci. Hortic. 2006, 110, 292–297. [Google Scholar] [CrossRef]
  31. Adhikari, R.; Nemali, K. Substrate versus Fertilizer-based Electrical Conductivity Measurements; HO-322-W; The Education Store; Purdue Extension; Purdue University: West Lafayette, IN, USA, 2020. [Google Scholar]
  32. Haehnel, W. Photosynthetic electron transport in higher plants. Ann. Rev. Plant Physiol. 1984, 35, 659–693. [Google Scholar] [CrossRef]
  33. Osborne, B.A.; Raven, J.A. Light absorption by plants and its implications for photosynthesis. Biol. Rev. 1986, 61, 1–6. [Google Scholar] [CrossRef]
  34. Ding, L.; Wang, K.J.; Jiang, G.M.; Biswas, D.K.; Xu, H.; Li, L.F.; Li, Y.H. Effects of nitrogen deficiency on photosynthetic traits of maize hybrids released in different years. Ann. Bot. 2005, 96, 925–930. [Google Scholar] [CrossRef] [Green Version]
  35. Evans, J.R.; Terashima, I. Effects of nitrogen nutrition on electron transport components and photosynthesis in spinach. Funct. Plant Biol. 1987, 14, 59–68. [Google Scholar] [CrossRef]
  36. Fredeen, A.L.; Gamon, J.A.; Field, C.B. Responses of photosynthesis and carbohydrate-partitioning to limitations in nitrogen and water availability in field-grown sunflower. Plant Cell Environ. 1991, 14, 963–970. [Google Scholar] [CrossRef]
  37. Feng, W.; He, L.; Zhang, H.Y.; Guo, B.B.; Zhu, Y.J.; Wang, C.Y.; Guo, T.C. Assessment of plant nitrogen status using chlorophyll fluorescence parameters of the upper leaves in winter wheat. Eur. J. Agron. 2015, 64, 78–87. [Google Scholar] [CrossRef]
  38. Buschmann, C.; Nagel, E. In vivo spectroscopy and internal optics of leaves as basis for remote sensing of vegetation. Int. J. Remote Sens. 1993, 14, 711–722. [Google Scholar] [CrossRef]
  39. Mohanty, P.; Boyer, J.S. Chloroplast Response to Low Leaf Water Potentials: IV. Quantum Yield Is Reduced. Plant Physiol. 1976, 57, 704–709. [Google Scholar] [CrossRef] [Green Version]
  40. Beadle, C.L.; Long, S.P. Photosynthesis—Is it limiting to biomass production? Biomass 1985, 8, 119–168. [Google Scholar] [CrossRef]
  41. Marcelis, L.F.; Heuvelink, E.; Goudriaan, J. Modelling biomass production and yield of horticultural crops: A review. Sci. Hortic. 1998, 74, 83–111. [Google Scholar] [CrossRef]
  42. Peng, S.; Krieg, D.R.; Girma, F.S. Leaf photosynthetic rate is correlated with biomass and grain production in grain sorghum lines. Photosynth. Res. 1991, 28, 1–7. [Google Scholar] [CrossRef]
  43. Wilson, J.W. Analysis of light interception by single plants. Ann. Bot. 1981, 48, 501–505. [Google Scholar] [CrossRef]
  44. Rosati, A.; Badeck, F.W.; Dejong, T.M. Estimating canopy light interception and absorption using leaf mass per unit leaf area in Solanum melongena. Ann. Bot. 2001, 88, 101–109. [Google Scholar] [CrossRef]
Figure 1. Procedure for estimating canopy area and N stress index (R) of petunia plants using multi-spectral image station. Original image, mask, and grayscale images captured by a monochromatic camera after sequentially exposing plants to 450 nm, 521 nm and 660 nm.
Horticulturae 06 00074 g001
Figure 2. Procedure for the estimation of N stress index by a smartphone (Rsp). Strawberry plant images are shown in the illustration. The green channel of the original image was enhanced to make mask, blue, green, and red channels were separated, and the mask was used to segment plants in three channels. Average gray values were calculated for each segmented channel to estimate Rsp.
Horticulturae 06 00074 g002
Figure 3. Reflectance index (R) of petunia plants measured on different days after exposure to optimal (C), nitrogen stress (NS) and drought stress (DS) treatments in the main experiment. The R-value was measured based on images of petunia plants captured inside a multi-spectral image station. A. * denotes statistical significance (p ≤ 0.05) between NS and C treatments on a given day.
Horticulturae 06 00074 g003
Figure 4. Path analyses of physiological measurements associated with shoot dry weight (SDW). Other variables include leaf photosynthesis (A), canopy area (CA), light absorption (Iabs), reflectance index (R) and quantum efficiency in light (ΦPSII). Beta (or linear coefficient) and error values are shown for different effects. The model used terms that showed statistical significance (p ≤ 0.05).
Horticulturae 06 00074 g004
Figure 5. Nitrogen stress index (R) assessment using a smartphone. Strawberry plants were exposed to nitrogen stress (NS) and optimal (C) treatments. Letters ‘a’ and ‘b’ indicate that the means are statistically different. Error bars represent standard error of the mean.
Horticulturae 06 00074 g005
Figure 6. Linear relationship between N stress indices measured by smartphone (Rsp) and multi-spectral image station (R) in hydrangea.
Horticulturae 06 00074 g006
Table 1. Photosynthetic photon flux density (PPFD), substrate electrical conductivity (ECs) and volumetric water content (θ) maintained in the control (C), nitrogen stress (NS), and drought stress (DS) treatments in the main experiment. Treatment means followed by the same letter are not statistically different (p ≤ 0.05). Values in parenthesis indicate standard error of mean.
TreatmentPPFDECsΘ
µmol·m−2·s−1dS·m−1m3·m−3
C415 (13.4) a0.72 (0.027) a0.47 (0.016) a
NS417 (31.0) a0.32 (0.017) b0.48 (0.013) a
DS419 (18.8) a0.08 (0.014) c0.15 (0.01) b
Table 2. Shoot dry weight (SDW), canopy area (CA), leaf photosynthesis (A), light absorption fraction (Iabs), N stress index (R) and quantum efficiency in light (ɸPSII) of petunia at harvest stage in the control (C), nitrogen stress (NS) and drought stress (DS) treatments. Treatment means followed by the same letter are not statistically different (p ≤ 0.05). Values in parenthesis indicate standard error of mean.
TreatmentSDWCAAIabsRɸPSII
g·plant−1m2µmol·m−2·s−1
C12.2 (0.47) a0.20 (0.002) a5.2 (0.26) a0.95 (0.008) a0.296 (0.008) b0.31 (0.018) a
NS10.0 (0.69) b0.19 (0.002) a3.8 (0.56) b0.95 (0.013) a0.271 (0.021) a0.26 (0.005) a
DS6.0 (0.78) c0.14 (0.008) b1.8 (0.27) c0.92 (0.003) b0.292 (0.006) b0.28 (0.022) a
Table 3. Average gray values of blue and combined wavelengths in petunia (proof-of-concept experiment) and strawberry (product development experiment) under control (C) and nitrogen stress (NS) treatments. Treatment means followed by the same letter are not statistically different (p ≤ 0.05). Values in parenthesis indicate standard error of mean.
TreatmentGray Value (0 to 255 Scale)
PetuniaStrawberry
450 nm(450 + 521 + 660) nmblue(blue + green + red)
C74.2 (1.18) a253.3 (3.87) b77.4 (3.90) a277.1 (12.26) b
NS76.4 (1.22) a267.6 (3.94) a73.2 (1.68) a317.0 (5.83) a
Publisher’s Note: MDPI stays neutral with regard to jurisdictional claims in published maps and institutional affiliations.

