Next Article in Journal
Simulation of the Number of Strawberry Transplants Produced by an Autotrophic Transplant Production Method in a Plant Factory with Artificial Lighting
Previous Article in Journal
The Agriculture–Nutrition–Income Nexus in Tonga: Is Postharvest Loss Undermining Horticulture Market Efficiency in Tonga?
 
 
Correction published on 31 March 2022, see Horticulturae 2022, 8(4), 298.
Article

Impact of Different Growing Substrates on Growth, Yield and Cannabinoid Content of Two Cannabis sativa L. Genotypes in a Pot Culture

1
Department of Agronomy, Institute of Crop Science, Cropping Systems and Modelling, University of Hohenheim, 70599 Stuttgart, Germany
2
Department of Agronomy, Institute of Crop Science, Biostatistics, University of Hohenheim, 70599 Stuttgart, Germany
*
Author to whom correspondence should be addressed.
Horticulturae 2020, 6(4), 62; https://doi.org/10.3390/horticulturae6040062
Submission received: 10 September 2020 / Revised: 25 September 2020 / Accepted: 29 September 2020 / Published: 1 October 2020 / Corrected: 31 March 2022
(This article belongs to the Section Protected Culture)

Abstract

:
The impacts of different growing substrate compositions, consisting of peat (PM), peat substituted with 30% green fibre (G30) and coco coir fibre (CC) growth media, were investigated in regard to the plant height, biomass and floral yield, biomass nitrogen (N) content, root growth, and cannabidiol content (CBD/A) of two phytocannabinoid-rich cannabis genotypes in an indoor pot cultivation system. Genotypes and substrate treatment combinations were randomly allocated to 36 plants according to a Latin square design. The results showed a higher total plant height for PM (39.96 cm), followed by G30 (35.28 cm), and the lowest in CC (31.54 cm). The N content of leaves indicated the highest values for plants grown in G30 (52.24 g kg DW−1), followed by PM (46.75 g kg DW−1) and a significantly lower content for CC (37.00 g kg DW−1). Root length density (RLD) increased by 40% (PM) and 50% (G30), compared to CC treatments, with no significant differences in root dry weight. Both genotypes, Kanada (KAN) and 0.2x, reacted in a genotype-specific manner. KAN indicated a reduced floral yield of plants grown in G30 (4.94 g plant−1) and CC (3.84 g plant−1) compared to PM (8.56 g plant−1). 0.2x indicated stable high floral yields of 9.19 g plant−1 (G30) to 7.90 g plant−1 (CC). Leaf DW increased in PM (5.78 g plant−1) and G30 (5.66 g plant−1) compared to CC (3.30 g plant−1), while CBD/A content remained constant. Due to a higher biomass yield, the CBD/A yield of flowers (549.66 mg plant−1) and leaves (224.16 mg plant−1) revealed 0.2x as an interesting genotype for indoor pot cultivation in a peat-based substrate substituted with 30% green fibres. Overall, the demand for organic green fibres to partly replace fractionated peat showed a genotype-specific option for a homogeneous plant development, with comparable high biomass yields and stable cannabinoid contents compared to a peat containing standard substrate.

1. Introduction

Cannabis sativa L. is the golden example of a multifunctional plant with a high potential in various industries (e.g., food, pharma, cosmetics, animal products, etc.). Five chemotypes of cannabis have been classified based on their cannabinoid profile and concentration: Chemotype I with a ∆9-tetrahydrocannabinol/cannabidiol (THC/CBD) ratio > 1; Chemotype II with an intermediate THC/CBD ratio (≈ 1); fibre-type plants with a THC/CBD ratio < 1 are defined as Chemotype III; Chemotype IV containing cannabigerolic acid (CBGA) as their main cannabinoid [1], and finally Chemotype V containing almost no cannabinoids [2,3,4,5]. Cultivation of C. sativa L. was banned in many states due to its psychoactive drug component ∆9-THC [6]. Industrial hemp genotypes, which meet the 0.2% THC limit mandated by the European Union (EU) legislation, can be cultivated without restrictions by farmers within the EU [7]. Breeding efforts on CBD-amplified chemotypes, called phytocannabinoid-rich cannabis genotypes, are aimed at contents of > 10% CBD and less than 0.2% THC. In many EU countries, phytocannabinoid-rich cannabis with a high content of non-psychoactive phytocannabinoids and THC < 0.2% may be legally grown as industrial hemp, whereas genotypes with a THC content above this limit require a cultivation license for medicinal cannabis in many EU countries. A clear differentiation between chemotypes is necessary, as the different legal framework in the cultivation of medicinal and phytocannabinoid-rich cannabis is expected to result in significant differences in market potential for companies operating in this sector.
For an optimised flower yield with appropriate quality, the choice of genotypes and the cultivation system is crucial, since the content of individual cannabinoids can be influenced by the cultivation method and possible environmental interactions [8]. For the isolation of the pure substance or extract preparation, outdoor cultivation seems to be economically feasible [9]. Indoor cultivation has advantages in terms of quality assurance, as well as hygienic standards as regards avoiding potential contaminations and producing homogeneous cannabis batches under controlled conditions [10]. Soilless growth media have been commonly utilised in greenhouse plant production, and can be formulated by mixing organic components such as peat moss and inorganic components such as vermiculite, perlite and sand [11,12]. Choosing proper substrate components is critical for providing suitable physical and chemical properties required for a specific plant species and its optimum growing conditions [11,13]. Sphagnum peat moss is one of the major components in soilless substrates for the production of greenhouse pot plants because of its wide availability and relative cost-effectiveness, with desirable physical and chemical properties [12,14]. Growing environmental concerns regarding extraction processes and increasing transportation costs have led to a strong need for the exploration of alternative substrates as a partial or total substitution of peat [15,16]. A problem for peat suppliers is the increasing prices of the sods, and together with a growing public concern about peat harvesting for horticultural purposes, experience and knowledge of alternative mixtures and their potential to replace peat are needed [17].
Soilless plant production systems present two challenges for a healthy root growth. First, unlike a normal soil profile, a pot environment provides a shallow layer of substrate, reaching the point of saturation quickly during irrigation. Second, a small pot size provides a limited volume capacity for water storage between irrigation cycles [11]. An effective growing media needs a physical structure with a favourable balance between water storage and air [18]. A balanced mixture of water and oxygen in the medium is required throughout the life cycle at the roots to allow the cannabis plants to grow. This balance at small volumes is a key factor in the development of substrate compositions for soilless plant production systems. These growing media have been a pivotal innovation, allowing the control of water, air and nutrient supplies [19]. In addition, a change in societal attitude is well exemplified by the goal of reducing the reliance on peat-based growing media [20]. In terms of economic considerations as well as performance, including excellent physical, chemical and biological properties [16,21,22], peat is an economically effective component of soilless substrates [23]. It guarantees a high water capacity with simultaneously high air capacity [21], making it challenging to find comparable replacements [23].
By-products have been extensively investigated over the past few decades to replace peat, which include coconut coir dust [24], wood fibre [25] and others. Green fibres, especially different compositions of wood fibres, can improve the physical properties of peat due to their high porosity and water holding capacity [23,26]. There is a lack of linkage between the physical properties of the substrate and their effects on the plant growth and performance of a specific species. Especially in an indoor plant production system, such information is critical as a limited volume of substrate confirms root growth, which in turn makes the plant more vulnerable to suboptimal water and nutrient environments. Further, alternative substrate components should possess similar characteristics to peat in maintaining biomass yield and quality. As the importance of soilless crop production is likely to increase in the coming years, it is crucial that researchers work with growing media manufacturers to find new materials that are ecologically sustainable and commercially viable, and deliver excellence, as well as those that will replace them [23].
The aim of this study was to evaluate the growth performance, such as the plant height, biomass yield, root growth and cannabinoid content, of cannabis plants grown in different substrates, substituted with peat alternatives in an indoor pot cultivation system.

2. Materials and Methods

2.1. Experimental Setup

A greenhouse experiment was set up to test the impacts of substrate composition on the growth parameters, biomass yield, biomass nitrogen (N) content and cannabidiol (CBD/A) content of two phytocannabinoid-rich Cannabis sativa L. genotypes, namely Kanada (KAN) and 0.2x (AI FAME, Wald-Schönengrund, Switzerland). The experiment was conducted at the University of Hohenheim, Germany, from April 3, 2019, until September 4, 2019. Both genotypes were cultivated on the following substrate compositions: (a) peat-mix (PM) growth media, (b) peat-mix substituted with 30% green fibre (G30) growth media, and (c) pure coco coir fibre (CC) growth media (Table 1). The green fibres used consisted of coniferous wood and wood chips from pine and spruce wood. The genotypes and substrate treatment combinations were randomly allocated to 36 plants according to a Latin square design, established with six rows and six columns. Thus, six replicates existed.

2.2. Plant Material

The experimental plants were produced by vegetative propagation by cutting off only the apical tips of standardised mother plants. Cuttings were cultivated in 25 mm x 25 mm Eazy Plug® seed cubes, EC: 1.0, pH: 5.8 (Goirle, The Netherlands). A rooting hormone (0.25% 4-(3-indolyl)-butyric acid) was used for the fast and homogeneous root development of the cuttings. The clones were covered with a hood and sprayed with water at regular intervals to reach a relative humidity > 90%. After roots emerged, 24 (12 of genotype KAN and 12 of genotype 0.2x) cuttings were transplanted into 70% milled peat, 15% sod cut peat fraction 1 and 15% perlite, in round pots with a 9 cm diameter (Table 1). A group (6 plants of each genotype) was also transplanted into 100% CC fibre for 35 days. A standardised pruning technique was performed. Therefore, the shoot apex was removed to eight internodes for both genotypes.
At 35 days after planting (DAP), both genotypes, six replicates each, were transplanted into PM growth media, G30 growth media and pure CC growth media, all in round pots with a diameter of 12 cm (Table 1). At 70 DAP, genotypes were transplanted into the final substrate composition, a peat-mix substituted with 30% green fibre containing potting substrate (55% sod cut peat fraction 3, 15% milled peat, 30% green fibre), or again into pure CC growth media, all in round pots with a 15 cm diameter (Table 1). Substrate compositions were kindly provided by the company Klasmann-Deilmann, Geeste, Germany. Under an indoor vegetative life cycle of 18 h, sunlight was supplemented with artificial lightning using Gavita HPS (high-pressure sodium) lamps, E-Series DE FLEX EU Lamp (750 W, 400 V, 1500 µmol s−1), Aalsmeer, Netherlands. During the vegetative growth cycle, plants were irrigated by a drip system and fertilised five days a week with 2 g L−1, 3 DAP to 19 DAP and 3 g L−1, 20 DAP to 61 DAP with Plantaactiv 18-12-18 Type A (Hauert, Grossaffoltern, Switzerland). During the generative growth cycle, 62 DAP to 154 DAP, plants were fertilised with 2 g L−1 of Plantaactive 10-20-30 Type B (Hauert, Grossaffoltern, Switzerland) every seventh day. The temperature during vegetative growth varied from 18.8 °C to 30.5 °C. Relative humidity varied between 24.6% and 68.8%. At 83 DAP, experimental plants were moved into a climate chamber with a 12 h photoperiod to initiate floral development. The temperature during the generative growth cycle varied from 22.9 °C to 26.5 °C. Relative humidity varied between 40.8% and 75.4%.
The substrates used had a predefined pH value of 5.5. Substrate pH was determined during the vegetative stage at 25 DAP, using the VDLUFA method (VDLUFA, 1999). Substrate samples (9 g) from each pot were mixed with 22.5 mL of 0.01 M CaCl2 solution and homogenised for 4 h. The pH value was measured using a pH electrode (LE 409, Mettler Toledo®, Columbus, OH, USA).

2.3. Measurements

Measurements took place weekly for each plant for a total period of 136 days. Plants were measured for their total height and SPAD values were measured on the youngest fully developed leaf (average of three measurements leaf−1) using SPAD 502 Plus (Konica Minolta, Chiyoda, Japan). SPAD values represent chlorophyll concentrations, which positively correlate with leaf N content [27].

2.4. Plant Samples

The appropriate harvest time of the genotypes was scheduled when 70% of pistils had darkened. Prior to harvest, when cannabinoid levels reach their maximum, the gland head trichome colour changes from clear or slight amber to cloudy. The state of the trichomes was evaluated by a microscope. Harvest took place 154 DAP (4 September 2019). Flowers and leaves from each plant were frozen with liquid nitrogen (−196 °C) to prevent further chemical reactions and finally freeze-dried to determine dry weight (DW) in gram per single plant and cannabinoid content of flowers and leaves. The dried plant material of each sample was ground with an ultra-centrifugal mill (Retsch, Type ZM 200, Haan, Germany) to acquire a homogeneous powder (particle size of 1 mm). The powder was stored in a dark and dry place until use for further analysis. The residual moisture was measured with a moisture analyser (DBS 60-3 of Kern & Sohn GmbH, Balingen, Germany).
The roots of each plant were washed using a 0.5 mm mesh sieve. Every root sample was cleaned of organic debris by hand and put into small laboratory plastic flasks filled with a 50% (v/v) ethanol solution to prevent mould growth. Root development was studied measuring root length density (RLD, cm cm−3) for the total RLD per pot volume (0.0015 m−3) by using images of root samples. The roots were spread over a thin layer of distilled water inside a plexiglas box. Images were acquired using a normal scanner device (Perfection V800 Photo, Epson) with a resolution of 400 DPI. Photo scans were analysed using WinRhizo Pro V. 2019 (Regent Instruments Inc., Québec, QC, Canada). Root DW was measured after drying root samples at 110 °C for 24 h.

2.5. Extraction and Quantification of Cannabinoids by HPLC Analysis

The cannabinoid extraction was performed according to Burgel et al. [28]. Quantitative analysis of cannabinoids, particularly cannabidiol (CBD), cannabidiolic acid (CBDA), ∆9-tetrahydrocannabinol (THC) and tetrahydrocannabinolic acid (THCA), was performed, according to the HPLC methods of Lehmann and Brenneisen [29] with slight modifications after Burgel et al. [30].
The data were processed using ChemStation Software for LC Rev. B.04.03-SP2 (Agilent, Santa Clara, CA, USA). The retention time of a respective chromatographic target peak was compared with the main chromatographic peak of a reference to carry out a quantitative analysis. The UV spectra was used to preliminarily allocate the chromatographic peaks to the reference spectra visually. The identity of a cannabinoid was established if the deviation of the retention time of the chromatographic peak was ≤ 0.5 min from the reference and the optical spectra comparison did not show any difference.
Indices were defined for the j-th genotype in the h-th row, the i-th column and the k-th treatment, thus a calculation was done for each plant. For the respective cannabinoid content C T S h i j k   in mass percent [ % m / m ] of the extract of each sample hijk, equation [1] was used. A T S is defined as peak area of the standard analyst and B T S h i j k as the peak area of the sample analyst in µV × s. V is defined as the volume of the volumetric flask, E W T S h i j k as the weight portion of the sample in mg, and finally F h i j k   as the residual moisture of the product in %.
C T S h i j k   % m / m = A T S   µ V   ×   s B T S h i j k   µ V   ×   s   /   100   µ L   m L 1 × V   m L E W T S h i j k   m g × 100 × F h i j k   % m / m

2.6. Statistical Analysis

A mixed model approach was used to analyse all traits, which were determined by the measurements from single plants. Thus, the DW of leaves, flowers and roots, as well as the biomass N content, RLD and cannabinoids present in dried leaf and flower material, were analysed by:
y h i j k =   µ + r h   +   c i   +   ρ j +   δ k +   δ ρ j k +   e h i j k
where y h i j k is the observation of the j-th genotype in the h-th row and the i-th column of the k-th treatment, µ is the intercept, ρ j is the fixed effect of the j-th genotype, δ k is the fixed effect of the k-th treatment and δ ρ j k is the fixed interaction effect of the corresponding main effects. e h i j k is the error associated with observation y h i j k . r h   and c i   are the random row and column effects. Note that a classical Latin square model would fit six treatment effects here. We reparametrized the six treatments as combinations of the two factors genotype and substrate, which also resulted in six combinations. Normal distribution and homogenous variance were checked graphically via residual plots. For the traits RLD and flower DW, a genotype-specific error variance resulted in better model fits measured via AIC [31]. Transformation of the data was not needed.
The total plant height was measured weekly for 19 weeks, and leaf SPAD value was measured weekly for 17 weeks. Thus, repeated measures were taken and a model [2] was extended by the factor measurement with 19 or 17 levels, as follows:
y h i j k m = µ   +   t m   +   r h m +   c i m   +   ρ j + ρ t j m + δ k   + δ t k m + δ ρ j k + δ ρ t j k m + e h i j k m
where   t m   is the effect of the m-th measurement, and all other effects are defined as analogous to the model [2]. Repeated measurements were taken from each row, column and plant. For all three effects, a first order autoregressive variance–covariance structure with heterogeneous variance was assumed. This allows for a serial correlation between observations taken from the same row, column or plant. Additionally, for plant height a logarithmic transformation of the data was not needed to fulfil model pre-requirements. Additionally, a logistic function using days as influencing variable was fitted:
f d a y = m a x 1 + e s d a y d a y 0
where d a y 0 is the value of the sigmoid’s midpoint, max is the curve’s maximum value, and s is the logistic growth rate or steepness of the curve. To do so, the parameters of the logistic function were fitted for the data of each plot. Afterwards, the parameter estimates were checked for differences between genotypes and substrates using the model [2]. After finding significant differences via a global F-test, a Tukey test was performed for multiple comparison. The results of the multiple comparison were presented via letter display [32]. Statistical analysis was conducted by using the statistical software SAS version 9.4 (The SAS Institute, Cary, NC, USA).

3. Results

The height of treated plants showed significant interactions between treatments and measurements over time. Plants treated with PM and G30 grew 35 days in a basic medium mixture + 15% Perlite during the early plant stage till they were potted into PM and G30 growth media, while plants were in 100% CC fibre over the experimental period of 136 days.
Data on plant height indicated that the height of PM- and G30-treated plants was significantly greater compared to plants grown in CC, during vegetative growth at 59 DAP. Between 35 DAP and 70 DAP, when PM and G30 treatments were implemented, the treatments resulted in significantly taller plants compared to CC. At the end of generative growth at 136 DAP, PM-treated plants were significantly taller at 39.96 ± 1.81 cm, whereas G30 (35.28 ± 1.52 cm) and CC (31.54 ± 1.61 cm) showed significant shorter plants (Figure 1; Table 2).
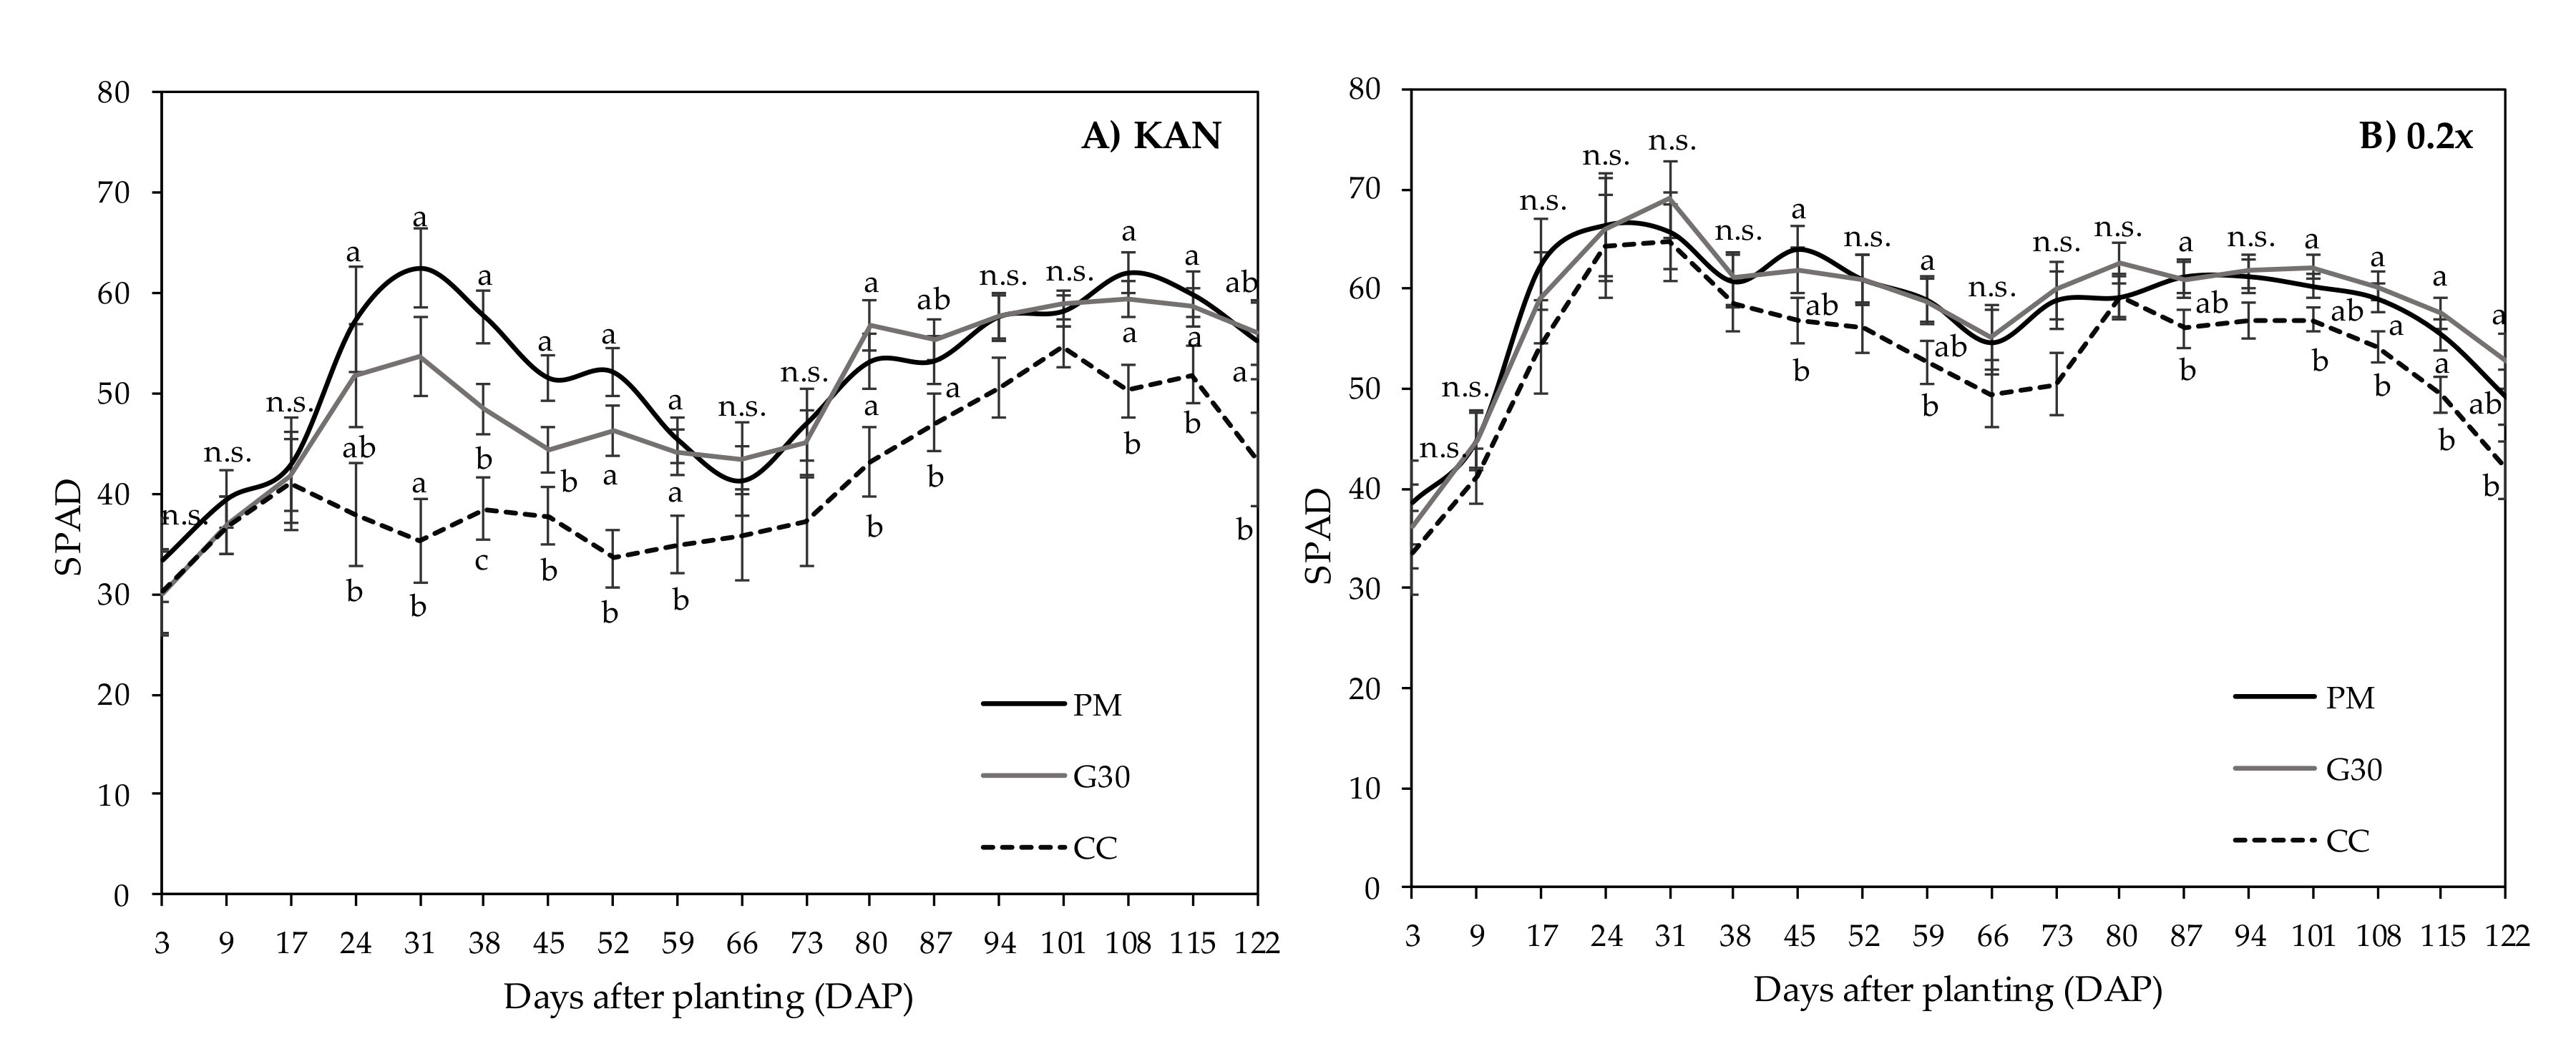
Mean SPAD values measured weekly on the youngest fully developed leaf, representing chlorophyll concentration through 122 DAP, showed a significant three-way interaction between the substrate treatment means, genotype and day of measurement. KAN plants grown in PM (55.30) and G30 (56.10) had significantly higher SPAD values through 122 DAP, compared to CC plants (43.47) (Figure 2). 0.2x plants grown in G30 (52.77) had significantly higher SPAD values through 122 DAP, followed by plants grown in PM (49.17), whereas the SPAD values of plants grown in CC (41.83) were the lowest (Figure 2).
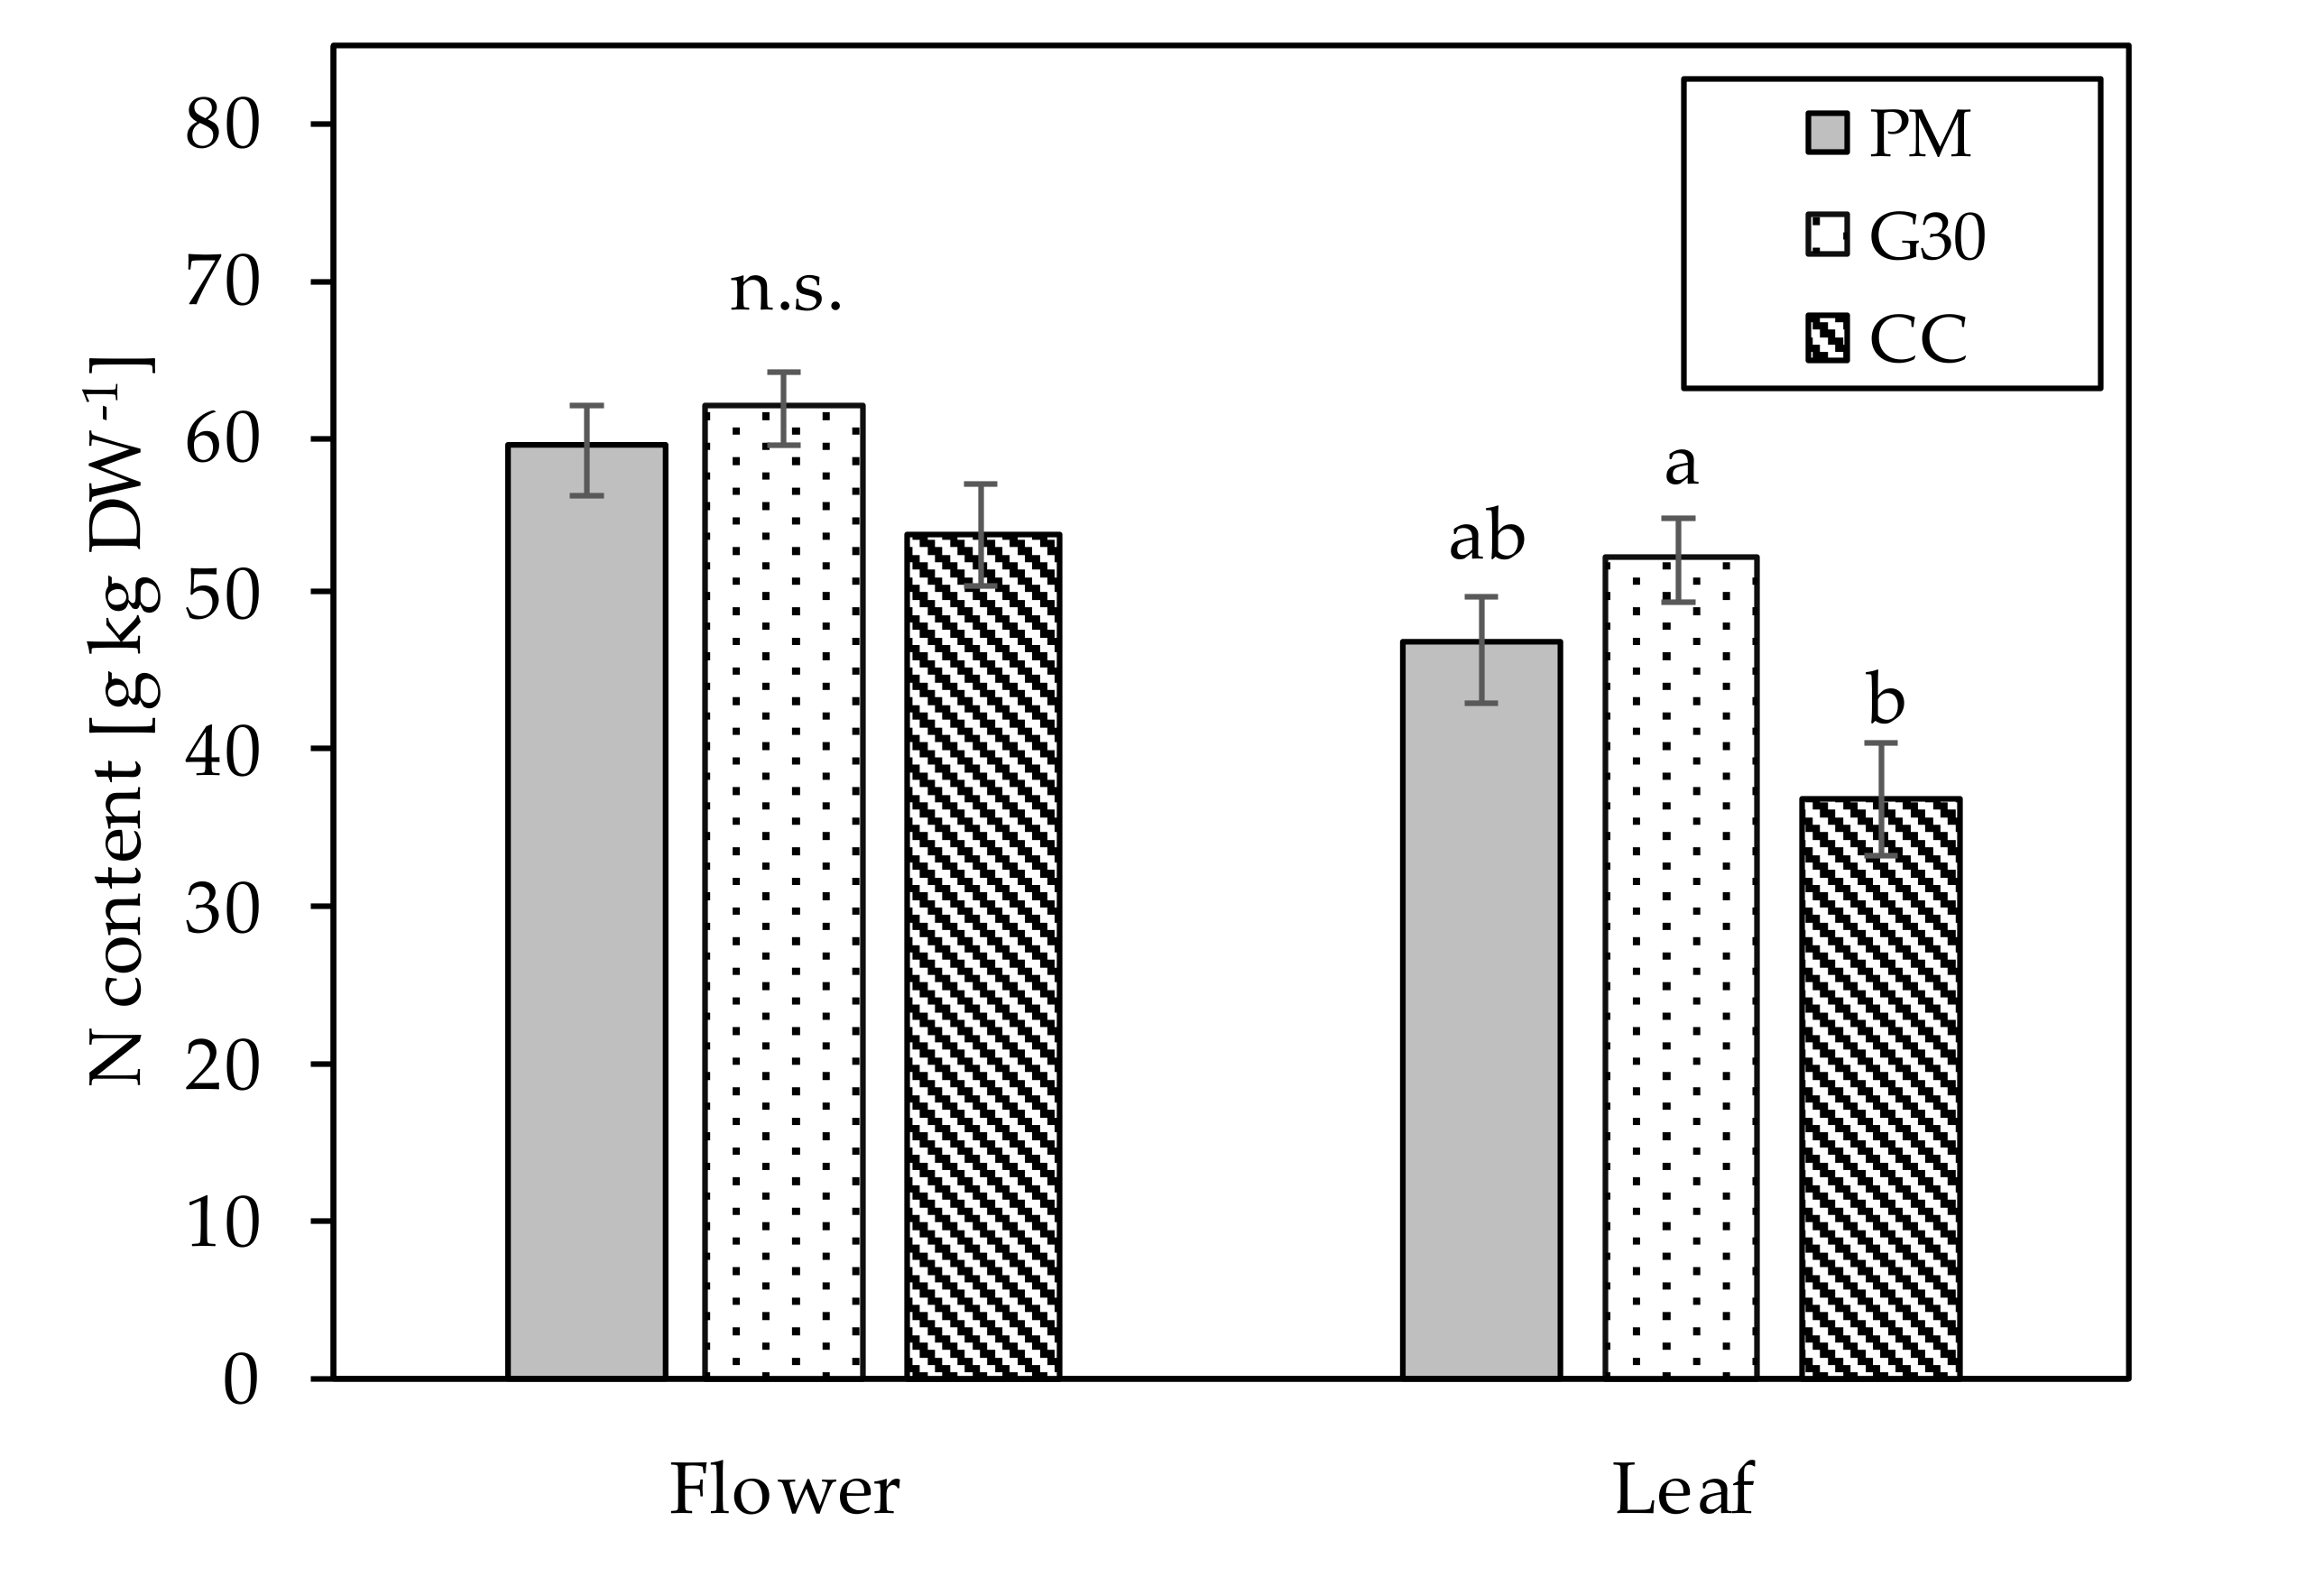
The nitrogen (N) content per plant of leaves and flowers showed a significant difference among substrates. The N content of the leaves of plants grown in G30 was 52.24 g kg DW−1, the highest value, followed by plants grown in PM (46.75 g kg DW−1). Plants grown in CC fibre had 37.00 g kg DW−1, a significantly lower N content compared to G30. No significant differences in the N contents of the flowers between the different substrates were found. The values ranged between 61.87 g kg DW−1 (G30) and 53.77 g kg DW−1 (CC; Figure 3).
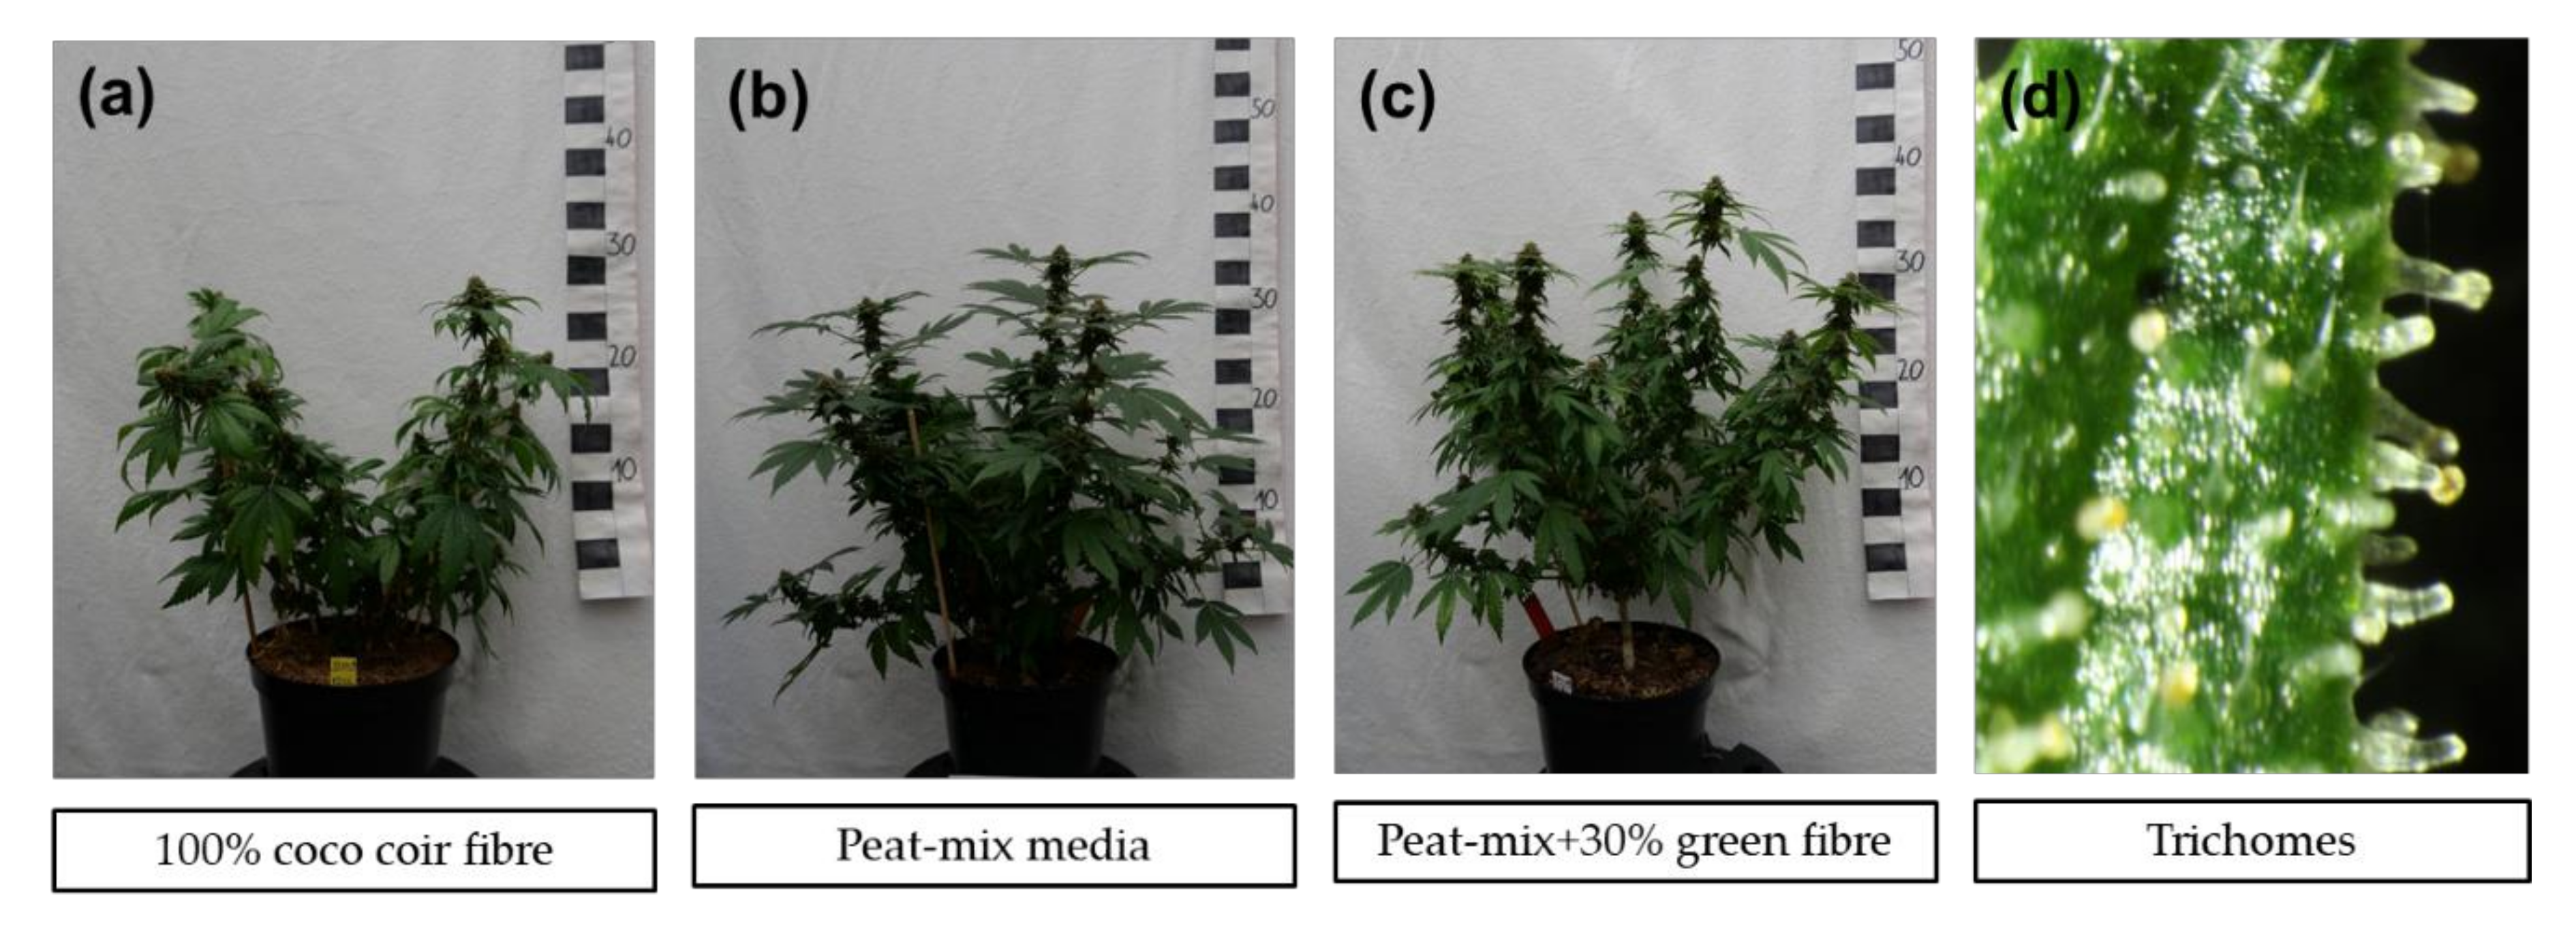
The effects of growth media on flower DW showed genotype-specific differences. The genotype KAN cultivated in PM growth media reached 8.56 g DW plant−1, the significantly highest yield of flowers compared to G30 (4.94 g plant−1) and CC (3.84 g plant−1) (Table 3). The genotype 0.2x ranged between 7.90 g DW plant−1 and 9.19 g DW plant−1 and showed no significant differences in flower DW between treatments (Table 3). The genotype KAN of the plants grown in G30 and CC fibre had lower DW yields of flowers compared to 0.2x, whereas PM treatments showed no genotype-specific growth differences (Table 3; Figure 4).
Significant differences between substrate treatments were found for the DW yield of leaves per plant. Plants grown in PM and G30 reached 5.78 and 5.66 g plant−1, respectively, a higher DW yield than plants grown in CC fibre at 3.30 g plant−1 (Table 4).
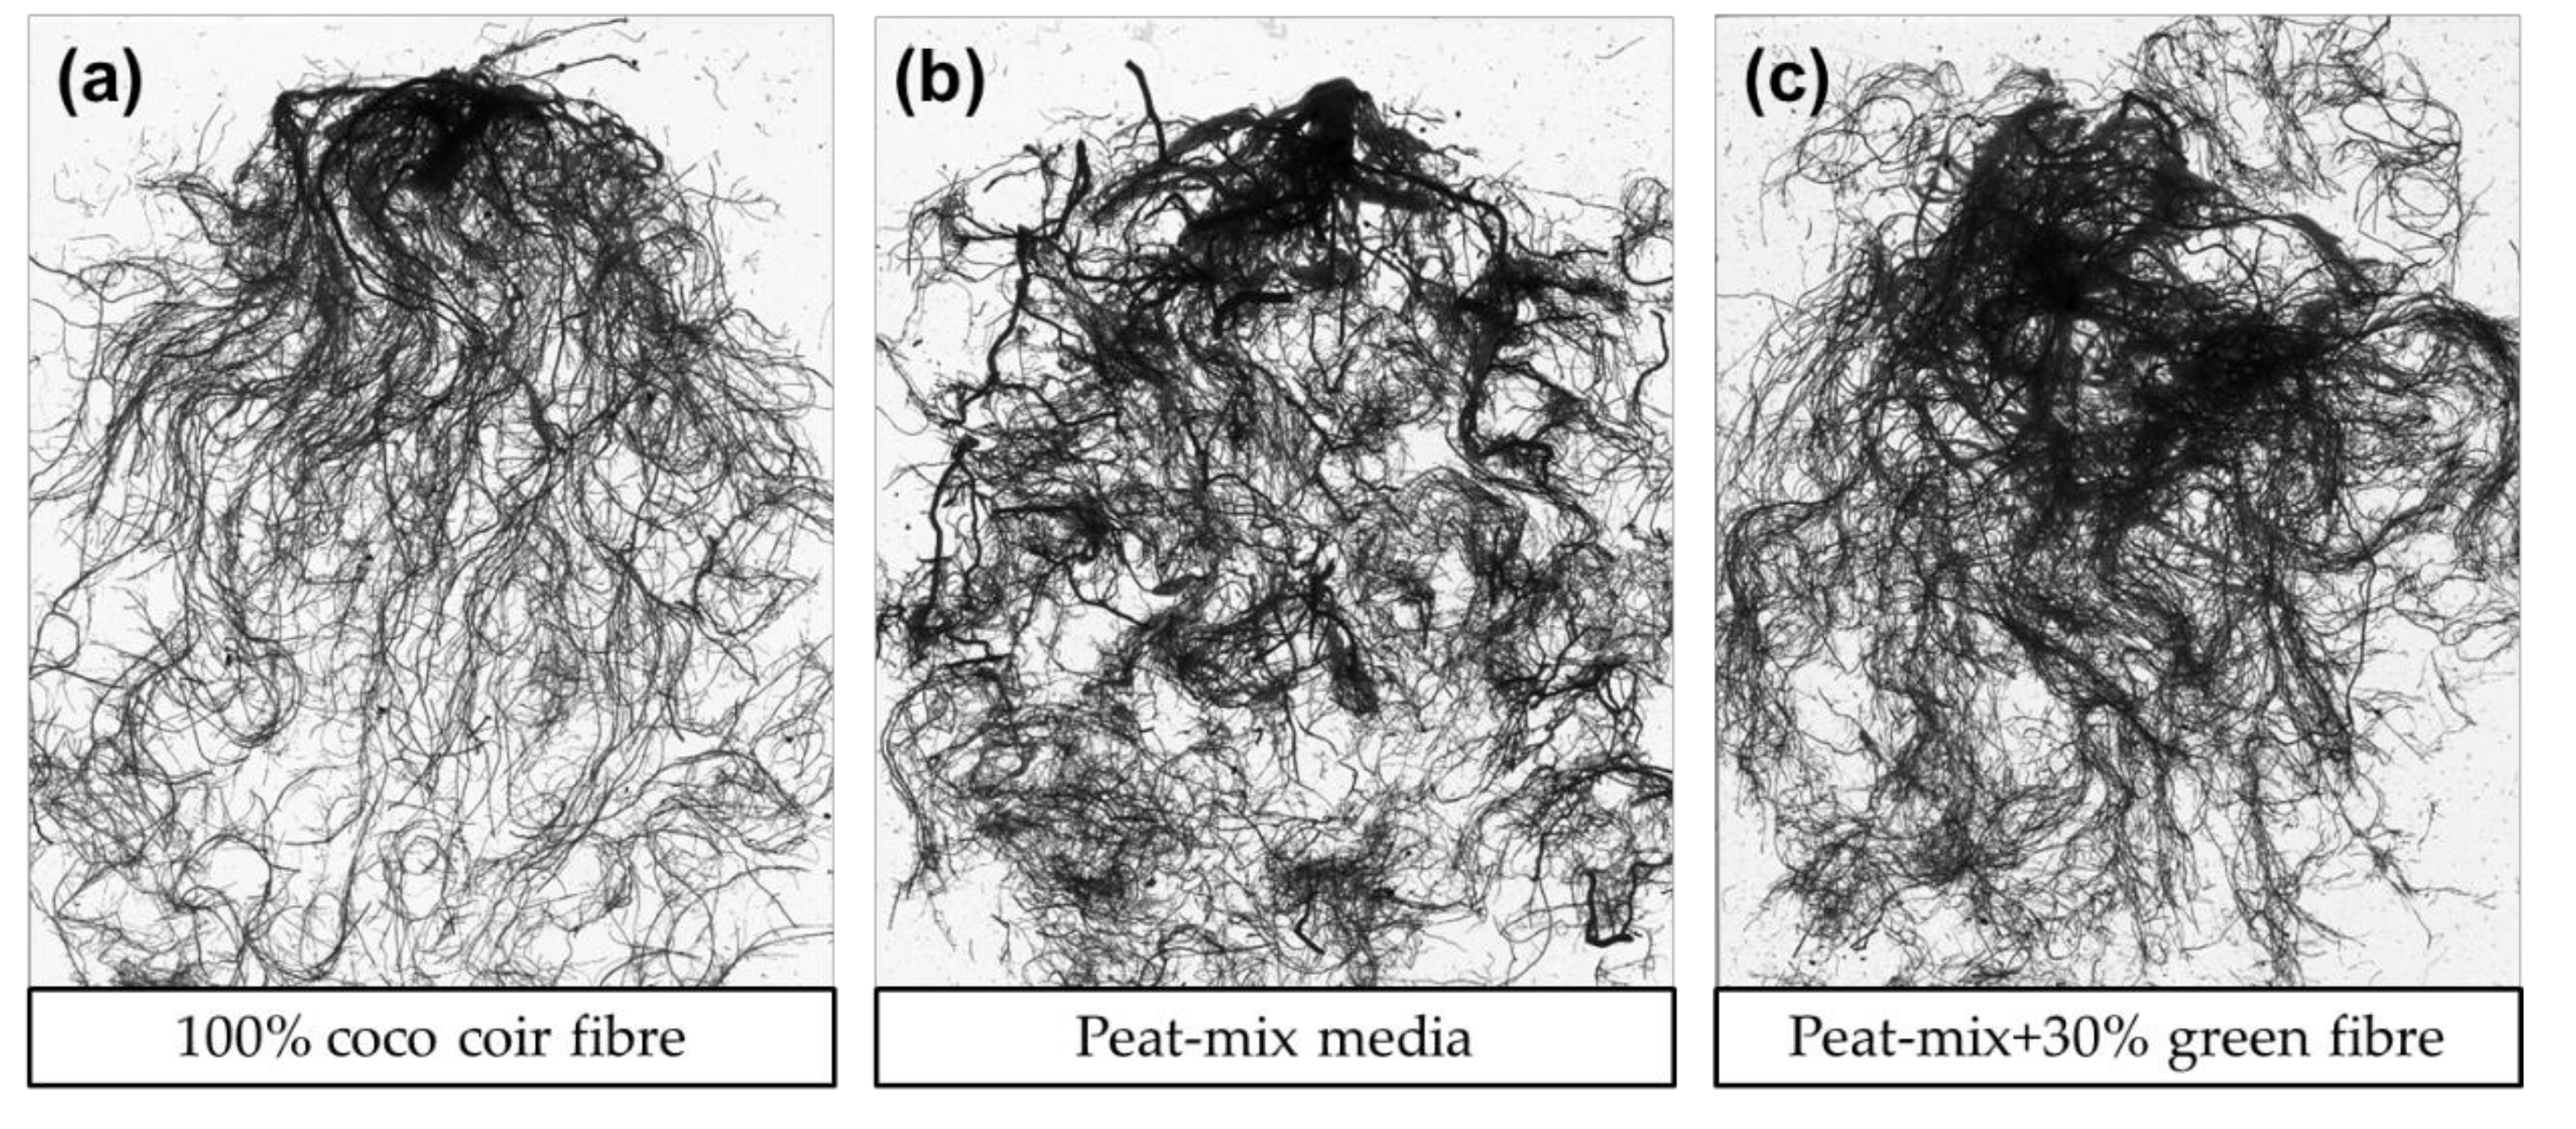
Root length density (RLD) was significantly affected by the different growth media treatments and genotypes. Plants grown in G30 media had 4.63 cm cm−3, the significantly highest RLD, followed by PM (4.32 cm cm−3) and the CC plants with a RLD of 3.09 cm cm−3 (Table 4; Figure 5). Genotype 0.2x (6.26 cm cm−3) had a significantly higher RLD compared with KAN (1.77 cm cm−3).
Genotype-specific differences were found for the DW yield of roots per plant. Plants of genotype 0.2x reached 1.52 g DW plant−1, a higher value than genotype KAN (0.55 g plant−1). Substrate treatments did not affect the root DW of either genotype (Table 5).
The cannabidiol (CBD/A) content of the flowers and leaves of plants grown in PM, G30 and CC did not show any statistical differences. The CBD/A content of flowers ranged between 5.9706%m/m (G30) and 6.2166%m/m (CC) for genotype KAN and between 6.6950%m/m (G30) and 6.7076%m/m (CC) for genotype 0.2x (Figure 6). The CBD/A content of leaves ranged between 3.8393%m/m (G30) and 4.5549%m/m (CC) for genotype KAN and between 3.8586%m/m (G30) and 4.0775%m/m (CC) for genotype 0.2x (Figure 6). The CBD/A yield per plant differed significantly between genotypes. KAN indicated a lower CBD/A yield in flowers (335.28 mg plant−1) and leaves (135.91 mg plant−1) compared to 0.2x, with 549.66 mg plant−1 in the flowers and 224.16 mg plant−1 in the leaves (Table 5).

4. Discussion

The cultivation of C. sativa genotypes in different substrate compositions showed an impact on plant height, biomass yield, root development and biomass N content of the plants in our experiment. Our results indicated that the G30 substrate was suitable for the production of containerised cannabis in comparison to a standard PM-based substrate or pure CC substrate. These results are reflected in the comparable final plant heights of plants grown in PM (40.02 cm) and G30 (36.45 cm). This means an increase of the total plant height of 20% and 12% compared to plants grown in CC fibres (32.03 cm), respectively. Plants grown in PM (54.76) and G30 (53.85) indicated a higher leaf SPAD chlorophyll index compared to plants grown in CC (47.08). Further, these results were substantiated by a higher N content in the leaves of plants cultivated in G30 (52.24 g kg DW−1) and PM (46.75 g kg DW−1) compared to plants grown in CC (37.00 g kg DW−1). No significant differences in flower N content between the substrate treatments were observed. The range between 53.77 g kg DW−1 (CC) and 61.87 g kg DW−1 (G30) was comparable with the results of Bernstein et al. [33], where flower N contents of 40 to 50 g kg DW−1 for cannabis were measured. Bernstein et al. [33] investigated the partitioning of mineral nutrients, e.g., N content, between plant organs, typical uptake and translocation within the plant tissue of C. sativa, and showed slightly lower N contents in the leaves of C. sativa. The results for N contents ranged between 20 and 30 g kg DW−1 and were in line with the results of plants cultivated in CC in the present study, with 37.00 g kg DW−1. The N contents of plants grown in PM and G30 showed higher values, ranging between 46.75 g kg DW−1 (PM) and 52.24 g kg DW−1 (G30).
The different uptake of N between PM or G30 and CC could have depended on, amongst other things, an adequate air supply and water-holding capacity of the soil. Although CC is a material which rehydrates easily and fast compared to peat, other physical properties of CC, such as water supply and availability, as well as aeration and relative hydraulic conductivity, highly depend on particle size distribution. CC exhibits a higher air content, depending on particle size, but low easily available and total water-holding capacity [34]. Abad et al. [34] reported that CC fibres with a particle size distribution similar to peat showed comparatively higher aeration, and therefore a lower capacity to hold total and easily available water. The described physical differences between CC and peat may have led to this difference in growth performance. Therefore, an irrigation schedule adjusted to the substrate composition, on a crop-by-crop basis, is recommended.
Green fibre is characterised by a high porosity and air-holding capacity [26]. Because of its insufficient plant available water and its tendency to become compressed, it is not recommended as a stand-alone growing media component [35,36]. It can be used to optimise the physical properties of other substrate components, e.g., peat, to increase air space, reduce bulk density and improve re-wetting capacity [23]. Therefore, green fibre may be an ideal component with which peat can be replaced to improve the properties of peat as media.
These positive characteristics of green fibre were also reflected in the present study, in which plants grown in a standard PM media compared to a media where 30% peat was replaced by green fibres (G30) not only provided comparable results in terms of N uptake, but also had comparable positive effects on root growth compared to plants cultivated in CC fibre. The roots of plants grown in PM and G30 had 40% and 50% higher RLDs compared to plants grown in CC, respectively. No significant differences between substrates were observed for root DW. Only a genotype-specific differences were observed. KAN had a lower root DW (0.55 g plant−1) compared to 0.2x (1.52 g plant−1). Increased root growth in PM and G30 may be attributed to the positive properties of peat and the advantages of green fibres as substitutes. Peat guarantees a high water capacity, whereas air capacity is dependent on the degree of composting [21]. Green fibres are fibrous in structure, elastic, loose and porous, which allows a very high air capacity (good drainability), with a low water capacity in contrast to peat. Due to the low shrinkage properties, green fibres can reduce the shrinkage of peat in pots and improve their value, with very good re-wettability. By contrast, CC fibres have an extremely high air capacity, but a lower water capacity [21].
Above all, the flower yields of genotypes are decisive, since a higher content of cannabinoids in flowers than in leaves is expected [37]. Therefore, a healthy root system is the key factor for high biomass yields, which is essential for optimising cannabinoid yield. The phytocannabinoid-rich cannabis genotypes used in the present study showed a genotype-specific reaction to the different substrate compositions. KAN had the highest floral yield of plants grown in PM (8.56 g plant−1), whereas G30 (4.94 g plant−1) and CC (3.84 g plant−1) were lower by 42% and 55%, respectively. 0.2x indicated no significant difference among the substrates. Floral yield ranged between 7.90 g plant−1 (CC) and 9.19 g plant−1 (G30). The standard PM-based substrate showed no significant difference between genotypes. KAN had 47% and 51% reduced floral yields when grown in G30 and CC, respectively, compared to PM. In contrast, Caplan et al. [38] documented no significant differences between two coir-based organic substrates and a commercially available peat-based substrate. Floral yield ranged between 34 and 40 g plant −1. The differences in flower yield can be explained by the use of a different genotype (‘OG Kush × Grizzly’) and the different lengths of the vegetative and generative phases in the experiments of Caplan et al. [38] compared to the current study. Leaves, on the other hand, showed the highest yields for PM and G30 plants, whereas plants grown in CC had in comparison reduced leaf DW yields of 43% and 42%, respectively. No impact on cannabidiol (CBD/A) content between the different substrate treatments was observed. The values of KAN and 0.2x ranged between 5.97%m/m and 5.97%m/m (G30), and 6.22%m/m and 6.70%m/m (CC), in floral dry matter (DM), respectively, whereas the leaves of KAN and 0.2x were between 3.84%m/m and 3.86%m/m (G30), and 4.55%m/m and 4.08%m/m (CC), respectively. The higher CBD/A content in female flowers compared to leaf tissue was in line with Stout et al. [37].
In addition, considering the presence of cannabinoids in the aerial parts of the plant, correlated with their number of glandular trichomes, especially on flowers and upper leaves [24], the biomass yield of flowers and leaves plays a key role in maximising CBD/A yield. In this regard, flower and leaf yield are far more important to overall yield than a slight difference in CBD/A percentage between genotypes, as indicated by Calzolari et al. [39]. This supports 0.2x, with a higher CBD/A yield of flowers (549.66 mg plant−1) and leaves (224.16 mg plant−1), as an interesting genotype for indoor CBD/A production.
Considering that the production of cannabinoids as herbal medicinal products is aimed at, standardisation through compliance with GACP (Good Agricultural and Collection Practice) and GMP (Good Manufacturing Practice), and clear guidelines at the level of cultivation, are essential. Adequate pharmaceutical quality depends not only on the selection of genotypes, but also on external environmental factors that influence plant growth [9]. In addition to lighting, CO2 concentration, temperature, humidity, water and nutrient supply, the substrate composition of the growing media is also important in order to cultivate cannabis flowers in fully air-conditioned greenhouses, which generate cannabinoids in a narrow range of contents from batch to batch. Since no significant impact of the treatments on CBD/A content, either in the flowers or in the leaves of both genotypes, could be found, it may be beneficial to replace the most frequently used peat substrate with at least 30% green fibre. However, while coco coir fibres could also be considered with respect to CBD/A content, cultivation in CC did not have a beneficial effect on the biomass production of the two genotypes evaluated in this study. A proportionate mixture of coco coir fibres with peat compounds should be tested in the future.

5. Conclusions

The results of this study showed that different substrate compositions, namely coco coir fibres (CC), standard peat-based media (PM) and peat substituted with 30% of green fibres (G30), had significant impacts on the growth, biomass yields, root development and nitrogen (N) tissue content of C. sativa after harvest. The use of CC as a growing media indicated a reduction in total plant height, leaf N content, leaf DW yields and root length density (RLD) compared to PM and G30 growing media. Both phytocannabinoid-rich cannabis genotypes reacted in a genotype-specific manner on flower yields. Whereas KAN had the highest floral yield when grown in PM, 0.2x showed no significant differences, with higher yields grown in G30 and CC compared to KAN. A limiting effect on the CBD/A content enacted by the different substrates could not be confirmed. The impact of different substrate compositions on the growth, development and cannabinoid content of C. sativa is a major issue when considering cannabis’ use as a botanical therapeutic, ideally with a fixed dosage of active compound, with a small range of variation. It can be concluded that the use of organic green fibres to partly replace the fractionated peat showed a genotype-specific option for constant plant development, a comparable high biomass yield and a stable cannabinoid content, compared to a peat containing standard substrate.

Author Contributions

Conceptualisation, L.B. and S.G.-H.; methodology, L.B. and S.G.-H; software, L.B. and J.H.; validation, L.B. and J.H.; formal analysis, L.B. and J.H.; investigation, L.B.; resources, L.B.; data curation, L.B.; writing—original draft preparation, L.B.; writing—review and editing, S.G.-H. and J.H.; visualisation, L.B.; supervision, S.G.-H.; project administration, S.G.-H.; funding acquisition, S.G.-H. All authors have read and agreed to the published version of the manuscript.

Funding

This research was funded by the German Federal Ministry for Economic Affairs and Energy within the Central Innovation Program for SMEs (16KN050543).

Acknowledgments

Many thanks for the provided cannabis genotypes and the great cooperation with Daniele Schibano, the owner of the company AI FAME, Switzerland. Many thanks for the provided substrate compositions of the company Klasmann- Deilmann GmbH. The authors would like to thank T. Thiel for her assistance during the lab analyses. Thanks to the greenhouse service of the University of Hohenheim for the support during plant growth.

Conflicts of Interest

The authors declare no conflict of interest. The funders had no role in the design of the study; in the collection, analyses, or interpretation of data; in the writing of the manuscript, or in the decision to publish the results.

References

  1. Fournier, G.; Richez-Dumanois, C.; Duvezin, J.; Mathieu, J.-P.; Paris, M. Identification of a New Chemotype in Cannabis sativa: Cannabigerol—Dominant Plants, Biogenetic and Agronomic Prospects. Planta Med. 1987, 53, 277–280. [Google Scholar] [CrossRef] [PubMed]
  2. de Meijer, E. The Chemical Phenotypes (Chemotypes) of Cannabis. In Handbook of Cannabis; Oxford University Press: Oxford, UK, 2014; pp. 89–110. [Google Scholar]
  3. ElSohly, M.A.; Radwan, M.M.; Gul, W.; Chandra, S.; Galal, A. Phytochemistry of Cannabis sativa L. In Phytocannabinoids. Progress in the Chemestry of Organic Natural Products; Kinghorn, A., Falk, H., Gibbson, S., Kobayashi, J., Eds.; Springer: Berlin/Heidelberg, Germany, 2017; Volume 103, pp. 1–36. [Google Scholar]
  4. Mandolino, G.; Carboni, A. Potential of marker-assisted selection in hemp genetic improvement. Euphytica 2004, 140, 107–120. [Google Scholar] [CrossRef]
  5. Pacifico, D.; Miselli, F.; Carboni, A.; Moschella, A.; Mandolino, G. Time course of cannabinoid accumulation and chemotype development during the growth of Cannabis sativa L. Euphytica 2008, 160, 231–240. [Google Scholar] [CrossRef]
  6. Glivar, T.; Eržen, J.; Kreft, S.; Zagožen, M.; Čerenak, A.; Čeh, B.; Tavčar Benković, E. Cannabinoid content in industrial hemp (Cannabis sativa L.) varieties grown in Slovenia. Ind. Crops Prod. 2020, 145, 112082. [Google Scholar] [CrossRef]
  7. Campiglia, E.; Radicetti, E.; Mancinelli, R. Plant density and nitrogen fertilization affect agronomic performance of industrial hemp (Cannabis sativa L.) in Mediterranean environment. Ind. Crops Prod. 2017, 100, 246–254. [Google Scholar] [CrossRef]
  8. Campbell, B.J.; Berrada, A.F.; Hudalla, C.; Amaducci, S.; McKay, J.K. Genotype × Environment Interactions of Industrial Hemp Cultivars Highlight Diverse Responses to Environmental Factors. Agrosyst. Geosci. Environ. 2019, 2, 1–11. [Google Scholar] [CrossRef] [Green Version]
  9. Laginha, A.M. High-Tech-Anbau von Cannabis. Dtsch. Apoth. Ztg. 2018, 158, 36–43. [Google Scholar]
  10. Magagnini, G.; Grassi, G.; Kotiranta, S. The Effect of Light Spectrum on the Morphology and Cannabinoid Content of Cannabis sativa L. Med. Cannabis Cannabinoids 2018, 1, 19–27. [Google Scholar] [CrossRef]
  11. Bunt, A.C. Media and Mixes for Container-Growth Plants; Unwin Hyman: London, UK, 1988. [Google Scholar]
  12. Nelson, P.V. Greenhouse Operation & Mangement; Prentice Hall: Upper Saddle River, NJ, USA, 2003. [Google Scholar]
  13. Evans, M.R.; Gachukia, M. Fresh Parboiled Rice Hulls Serve as an Alternative to Perlite in Greenhouse Crop Substrates. HortScience 2004, 39, 232–235. [Google Scholar] [CrossRef]
  14. Raviv, M.; Chen, Y.; Inbar, Y. The use of peat and composts as growth media for container-grown plants. In The Role of Organic Matter in Modern Agriculture; Chen, Y., Avnimelech, Y., Eds.; Martinus Nijhoff Publishers: Dordrecht, Germany, 1986; pp. 257–287. [Google Scholar]
  15. Barkham, J.P. For peat’s sake: Conservation or exploitation? Biodivers. Conserv. 1993, 2, 556–566. [Google Scholar] [CrossRef]
  16. Robertson, R.A. Peat, horticulture and environment. Biodivers. Conserv. 1993, 2, 541–547. [Google Scholar] [CrossRef]
  17. Blok, C.; Verhagen, J.B.G.M. Trends in rooting media in dutch horticulture during the period 2001–2005: The new growing media project. Acta Hortic. 2009, 819, 47–58. [Google Scholar] [CrossRef] [Green Version]
  18. Fonteno, W.C. Problems & considerations in determining physical properties of horticultural substrates. In International Symposium on Horticultural Substrates Other than Soil In Situ; Acta Horticulturae: Leuven, Belgium, 1993; Volume 342, pp. 197–204. [Google Scholar] [CrossRef]
  19. Raviv, M.; Wallach, R.; Silber, A.; Bar-Tal, A. Substrates and their Analysis. In Hydroponic Prod. Veg. Ornam; Sawas, D., Passam, H., Eds.; Embryo Publications: Athens, Greece, 2002; pp. 25–105. [Google Scholar]
  20. Ritz, K.; Corstanje, R.; Deeks, L. Final Report; Department for Environment, Food and Rural Affairs: London, UK, 2010. [Google Scholar]
  21. Schmilewski, G. The role of peat in assuring the quality of growing media. Mires Peat 2008, 3, 1–8. [Google Scholar]
  22. Krucker, M.; Hummel, R.L.; Cogger, C. Chrysanthemum production in composted and noncomposted organic waste substrates fertilized with nitrogen at two rates using surface and subirrigation. HortScience 2010, 45, 1695–1701. [Google Scholar] [CrossRef]
  23. Barrett, G.E.; Alexander, P.D.; Robinson, J.S.; Bragg, N.C. Achieving environmentally sustainable growing media for soilless plant cultivation systems—A review. Sci. Hortic. 2016, 212, 220–234. [Google Scholar] [CrossRef] [Green Version]
  24. Evans, M.; Stamps, R. Growth of bedding plants in sphagnum peat and coir dust-based substrates. J. Environ. Hortic. 1996, 14, 187–190. [Google Scholar] [CrossRef]
  25. Gruda, N.; Schnitzler, W.H. Holzfasersubstrate als eine torfalternative für die gemüseproduktion. Holz Roh Werkst. 2006, 64, 347–350. [Google Scholar] [CrossRef]
  26. Maher, M.; Prasad, M.; Raviv, M. Organic soilless media components. In Soilless Culture; Elsevier: Amsterdam, The Netherlands, 2008; pp. 459–504. [Google Scholar]
  27. Rodriguez, I.R.; Miller, G.L. Using a chlorophyll meter to determine the chlorophyll concentration, nitrogen concentration, and visual quality of St. Augustinegrass. HortScience 2000, 35, 751–754. [Google Scholar] [CrossRef] [Green Version]
  28. Burgel, L.; Hartung, J.; Schibano, D.; Graeff-Hönninger, S. Impact of Different Phytohormones on Morphology, Yield and Cannabinoid Content of Cannabis sativa L. Plants 2020, 9, 725. [Google Scholar] [CrossRef]
  29. Lehmann, T.; Brenneisen, R. High Performance Liquid Chromatographic Profiling of Cannabis Products. J. Liq. Chromatogr. 1995, 18, 689–700. [Google Scholar] [CrossRef]
  30. Burgel, L.; Hartung, J.; Pflugfelder, A.; Graeff-Hönninger, S. Impact of growth stage and biomass fractions on cannabinoid content and yield of different hemp (Cannabis sativa L.) genotypes. Agronomy 2020, 10, 372. [Google Scholar] [CrossRef] [Green Version]
  31. Wolfinger, R. Covariance structure selection in general mixed models. Commun. Stat. Simul. Comput. 1993, 22, 1079–1106. [Google Scholar] [CrossRef]
  32. Piepho, H.P. An algorithm for a letter-based representation of all-pairwise comparisons. J. Comput. Graph. Stat. 2004, 13, 456–466. [Google Scholar] [CrossRef]
  33. Bernstein, N.; Gorelick, J.; Koch, S. Interplay between chemistry and morphology in medical cannabis (Cannabis sativa L.). Ind. Crops Prod. 2019, 129, 185–194. [Google Scholar] [CrossRef]
  34. Abad, M.; Fornes, F.; Carrión, C.; Noguera, V.; Noguera, P.; Maquieira, Á.; Puchades, R. Physical properties of various coconut coir dusts compared to peat. HortScience 2005, 40, 2138–2144. [Google Scholar] [CrossRef] [Green Version]
  35. Gruda, N.; Schnitzler, W.H. Suitability of wood fiber substrate for production of vegetable transplants: I. Physical properties of wood fiber substrates. Sci. Hortic. 2004, 100, 309–322. [Google Scholar] [CrossRef]
  36. Domeño, I.; Irigoyen, I.; Muro, J. New wood fibre substrates characterization and evaluation in hydroponic tomato culture. Eur. J. Hortic. Sci. 2010, 75, 89–94. [Google Scholar]
  37. Stout, J.M.; Boubakir, Z.; Ambrose, S.J.; Purves, R.W.; Page, J.E. The hexanoyl-CoA precursor for cannabinoid biosynthesis is formed by an acyl-activating enzyme in Cannabis sativa trichomes. Plant J. 2012, 71, 353–365. [Google Scholar] [CrossRef] [Green Version]
  38. Caplan, D.; Dixon, M.; Zheng, Y. Coir-based growing substrates for indoor cannabis production. Acta Hortic. 2019, 1266, 55–61. [Google Scholar] [CrossRef]
  39. Calzolari, D.; Magagnini, G.; Lucini, L.; Grassi, G.; Appendino, G.B.; Amaducci, S. High added-value compounds from Cannabis threshing residues. Ind. Crops Prod. 2017, 108, 558–563. [Google Scholar] [CrossRef]
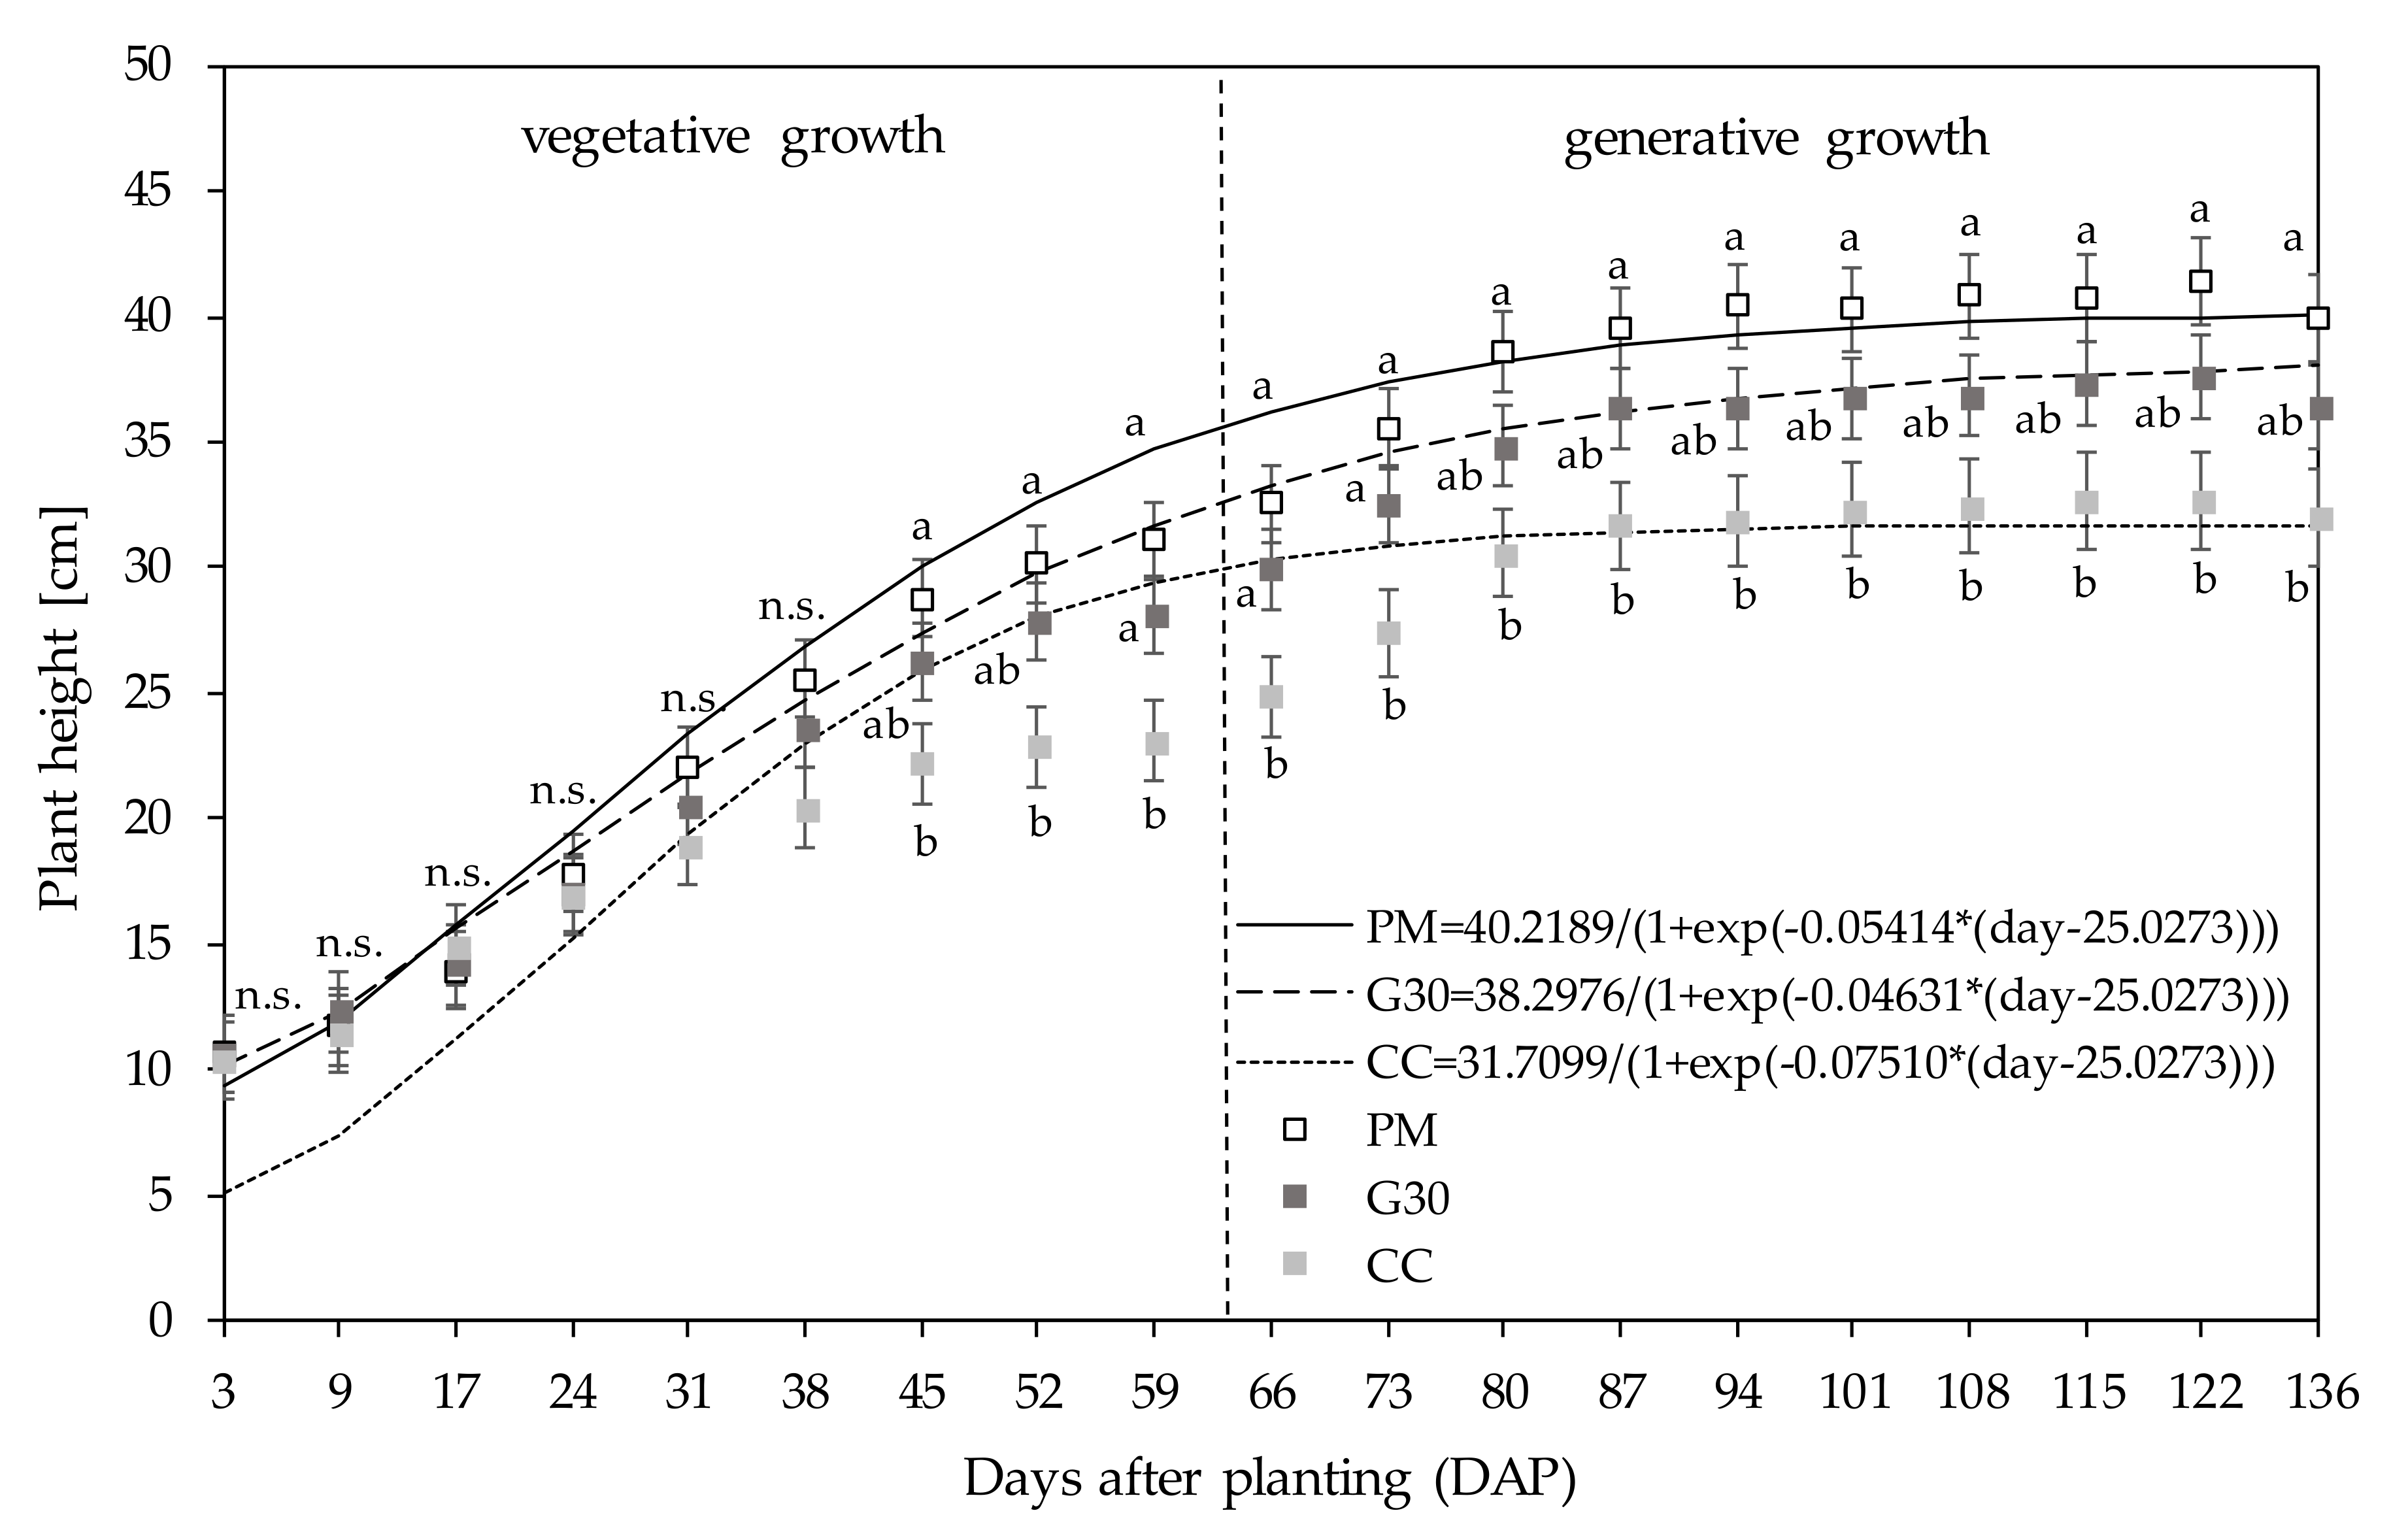
Figure 1. Mean plant height of genotypes treated with peat-mix media (PM), peat-mix + 30% green fibre (G30) compared to those grown in 100% coco coir fibre (CC) through 136 days after planting (DAP). Means with at least one identical lowercase letter did not differ significantly at α = 0.05.
Horticulturae 06 00062 g001
Figure 2. Mean SPAD value of genotype (A) KAN and (B) 0.2x, grown on peat-mix (PM), peat-mix + 30% green fibre (G30) and 100% coco coir (CC) fibre substrates over a time period of 122 days after planting (DAP). Means with at least one identical lowercase letter did not differ significantly at α = 0.05; n.s. = not significant.
Horticulturae 06 00062 g002
Figure 3. Mean nitrogen (N) content of flower and leaf tissues of genotypes treated with peat-mix media (PM), peat-mix + 30% green fibre (G30) and 100% coco coir fibre (CC). Means with at least one identical lowercase letter did not differ significantly at α = 0.05; n.s. = not significant.
Horticulturae 06 00062 g003
Figure 4. Plants of genotype 0.2x grown on (a) 100% coco coir fibre, (b) peat-mix media, (c) peat-mix + 30% green fibre media and (d) binocular imagine of a leaflet top of 0.2x 136 days after planting (DAP).
Horticulturae 06 00062 g004
Figure 5. Root scan imagines of plants grown in (a) 100% coco coir fibre (CC), (b) peat-mix media (PM) and (c) peat-mix + 30% green fibre media (G30) of genotype 0.2x.
Horticulturae 06 00062 g005
Figure 6. Mean content in (A) flower and (B) leaf of CBD/A in mass percent [%m/m] of genotypes KAN and 0.2x treated with a peat-mix growth media (PM), peat-mix substituted with 30% green fibre (G30) and 100% coco coir fibre (CC).
Horticulturae 06 00062 g006
Table 1. Substrate composition of peat-mix (PM) growth media, peat-mix substituted with 30% green fibre (G30) growth media, pure coco coir fibre (CC) growth media and pot size during the experimental time from 03.04.2019 until 04.09.2019. Days after planting (DAP).
DAP
(Pot Size in cm)
PMG30CC
1-35 (9)70% milled peat
15% sod cut peat fraction 1
15% perlite
70% milled peat
15% sod cut peat fraction 1
15% perlite
100% coco coir fibre
36-70 (12)45% sod cut peat fraction 2
40% milled peat medium
15% peat fibre
45% sod cut peat fraction 2
25% milled peat medium
30% green fibre
100% coco coir fibre
71-154 (15)55% sod cut peat fraction 3
15% milled peat
30% green fibre
55% sod cut peat fraction 3
15% milled peat
30% green fibre
100% coco coir fibre
Table 2. The p-values correspond to global F tests for differences between the parameters of the logistic function f d a y = m a x 1 + e s d a y d a y 0 using days as influencing variables of the measured plant height data.
p-ValuesParameter sParameter maxParameter day0
Genotype [G]0.02800.18020.0002
Substrate [S]0.02090.02940.5794
G × S Interaction0.11550.23820.4690
Table 3. Mean flower dry weight (DW) in g plant−1 of genotypes KAN and 0.2x, grown on peat-mix (PM), peat-mix + 30% green fibre (G30) and 100% coco coir fibre (CC) substrate. Results are presented as mean values ± standard error (Mean ± SE). Letters compare the mean DW yield of flowers. Means in a column followed by at least one identical lower-case letter and means in one row followed by at least one identical upper-case letter are not significantly different as indicated by the Tukey test (α = 0.05). The p-values correspond to global F tests for differences between the levels of the mentioned genotypes, substrates or their interactions.
TraitSubstrateGenotype
KAN0.2x
Flower DW
[g plant−1]
PM8.56 ± 0.74 aA8.68 ± 0.94 aA
G304.94 ± 0.66 bB9.19 ± 0.94 aA
CC3.84 ± 0.74 bB7.90 ± 0.94 aA
p-values
Genotype [G] 0.0002
Substrate [S] 0.0081
G × S Interaction 0.0251
Table 4. Mean leaf dry weight (DW) in g plant−1 and root length density (RLD) in cm cm−3 of genotypes KAN and 0.2x, grown on peat-mix (PM), peat-mix + 30% green fibre (G30) and 100% coco coir fibre (CC) substrate. Results are presented as mean values ± standard error (Mean ± SE). Letters compare the mean DW yield of leaves and mean RLD. Means in one column followed by at least one identical lower-case letter do not differ significantly as indicated by Tukey’s test (α = 0.05). The p-values correspond to global F tests for differences between the levels of the mentioned genotypes or substrates.
TraitSubstrateGenotype
Leaf DW
[g plant−1]
PM5.78 ± 0.47 a
G305.66 ± 0.44 a
CC3.30 ± 0.47 b
RLD
[cm cm−3]
PM4.32 ± 0.48 ab
G304.63 ± 0.46 a
CC3.09 ± 0.48 b
p-values Leaf
Genotype [G]0.0002
Substrate [S]0.0010
G × S Interaction0.2994
p-values RLD
Genotype [G]<0.0001
Substrate [S]0.0279
G × S Interaction0.4819
Table 5. Mean root DW in g plant−1 and mean CBD/A yields in mg plant−1 of genotypes KAN and 0.2x, grown on peat-mix (PM), peat-mix + 30% green fibre (G30) and 100% coco coir fibre (CC) substrates. Results are presented as mean values ± standard error (Mean ± SE). Letters compare the mean DW yield of root and CBD/A yields of flower and leaf. Means in one row followed by at least one identical lower-case letter are not significantly different as indicated by Tukey’s test (α = 0.05). The p-values correspond to global F tests for the difference between the levels of the mentioned genotypes, substrates or their interactions.
TraitGenotype
KAN0.2x
Root DW [g plant−1]0.55 ± 0.10 b1.52 ± 0.09 a
Flower CBD/A [mg plant−1]335.28 ± 98.67 b549.66 ± 79.25 a
Leaves CBD/A [mg plant−1]135.91 ± 24.02 b224.16 ± 18.63 a
p-values Root
Genotype [G]<0.0001
Substrate [S]0.1479
G × S Interaction0.2398
p-values Flower
Genotype [G]0.0412
Substrate [S]0.7144
G × S Interaction0.0937
p-values Leaves
Genotype [G]0.005
Substrate [S]0.057
G × S Interaction0.3947