Article

Greenhouse Gas Budget Assessment of Production of Kentucky Bluegrass (Poa pratensis) Sod and Three Herbaceous Landscape Plants

1
Center for Environment, Health and Field Sciences, Chiba University, 6-2-1, Kashiwa-no-ha, Kashiwa-city, Chiba 277-0882, Japan
2
Graduate School of Horticulture, Chiba University, 648 Matsudo, Matsudo-city, Chiba 271-8510, Japan
3
Innovative Research Excellence, Power Unit & Energy, Advanced Energy Research & Development Division, Honda R&D Co., Ltd., 4630 Shimotakanezawa, Haga-machi, Hagagun, Tochigi 321-3393, Japan
*
Author to whom correspondence should be addressed.
Horticulturae 2025, 11(9), 1132; https://doi.org/10.3390/horticulturae11091132
Submission received: 11 August 2025 / Revised: 7 September 2025 / Accepted: 13 September 2025 / Published: 17 September 2025
(This article belongs to the Section Protected Culture)

Abstract

To mitigate climate change, achieving net-zero carbon dioxide (CO2) emissions across all sectors is essential. In the floricultural and landscaping industries, a key concern is whether the production and use of landscape plants contribute to CO2 reduction. However, few studies have assessed the greenhouse gas (GHG) budgets of landscape plant production. This study quantified all major components of GHG budgets to determine whether herbaceous plant production acts as a GHG sink or source. Kentucky bluegrass sod and three herbaceous plants (Hedera canariensis, Liriope muscari, and Tagetes patula) were investigated for their GHG (CO2, CH4, and N2O) budgets. For Kentucky bluegrass sod production, the total GHG budget was calculated as −17.764 t-CO2e ha−1 year−1, comprising carbon sequestration (23.014 t-CO2/ha), GHG fluxes (0.049 t-CO2e/ha), and GHG emissions from energy and resource consumption (5.201 t-CO2e/ha). These results indicate that Kentucky bluegrass sod production functions as a GHG sink. In contrast, the total GHG budgets for potting production of the three herbaceous plants were positive, primarily due to higher GHG emissions from the use of potting soil and granular pesticides. To reduce net CO2 emissions in herbaceous plant production, using biochar as a growth medium and minimizing granular pesticides is an effective approach.

1. Introduction

Climate change is a major global challenge. To mitigate its impacts and associated risks, all sectors must aim to achieve net-zero carbon dioxide (CO2) [1]. In the horticultural industry, climate change, particularly high temperatures, adversely affects production and related activities [2,3,4]. Our industry must also achieve net-zero CO2 emissions to ensure its sustainable development [5] and promote technological innovation for climate adaptation [6,7].
In floriculture and landscape sectors, it is important to evaluate whether the production and use of plants contribute to CO2 reduction [8]. Life cycle assessment (LCA) methodologies provide insights into the greenhouse gas (GHG) emissions associated with horticultural production. Many studies have quantified GHG emissions from energy and resource use, emphasizing the need to reduce environmental impacts [9,10,11]. However, to determine whether landscape plant production serves as a GHG sink or source, all major components of the GHG budget must be quantified (Figure 1). Ingram [12,13] and Hall [14,15] identified three key components of the GHG budget for horticultural plant production, demonstrating that tree and shrub production and use can function as GHG sinks. There are also comparative studies on plant carbon fixation and soil fluxes in woody plant production [16,17,18]. Kuronuma et al. [19] further suggested that turf production fields may act as sinks for approximately 20–30 t-CO2e (CO2 equivalents)/ha. Nonetheless, comprehensive assessments of GHG emissions based on actual measurements are limited. Thus, it remains unclear whether landscape plant production is a GHG sink or source.
To address these knowledge gaps, this study quantified all major components of the GHG budget (Figure 1) for herbaceous plant production, an area for which data is particularly scarce. This study also determined whether these herbaceous plant production systems act as GHG sinks or sources and identified effective strategies for reducing GHG emissions during the production process.

2. Materials and Methods

This study focused on the production of Kentucky bluegrass (Poa pratensis L.) sod and three herbaceous plants (Hedera canariensis Willd., Liriope muscari (Decne.) L.H. Bailey, and Tagetes patula L.). CO2, methane (CH4), and nitrous oxide (N2O) were quantified. Based on the 20-year global warming potential (GWP-20) from the IPCC sixth assessment report [1], the GWP of CH4 and N2O was set at 82.5 and 273 times that of CO2, respectively, and converted into CO2 equivalents (CO2e). While the 100-year global warming potential (GWP-100) is generally used, herbaceous plants typically have life spans shorter than 100 years. Therefore, GWP-20 was adopted in this study to improve the accuracy of GHG budget assessment using the LCA methodology.
All experiments and cultivation management were conducted in an open field, and greenhouses were not used, except for gas samplings during rainy weather. During the experiment, we did not relocate plants to different facilities according to their growth stages.

2.1. Experiment 1: GHG Budget Assessment of Kentucky Bluegrass Sod Production

System boundaries in Experiments 1 and 2 are shown in Figure S1. A previous study [19] documented the production methods for Kentucky bluegrass sod through farmer interviews. In the present experiment, carbon sequestration and GHGs fluxes were directly measured using replicated production methods. GHG emissions from energy and resource consumption were quantified by converting the previous data to GWP-20 values.
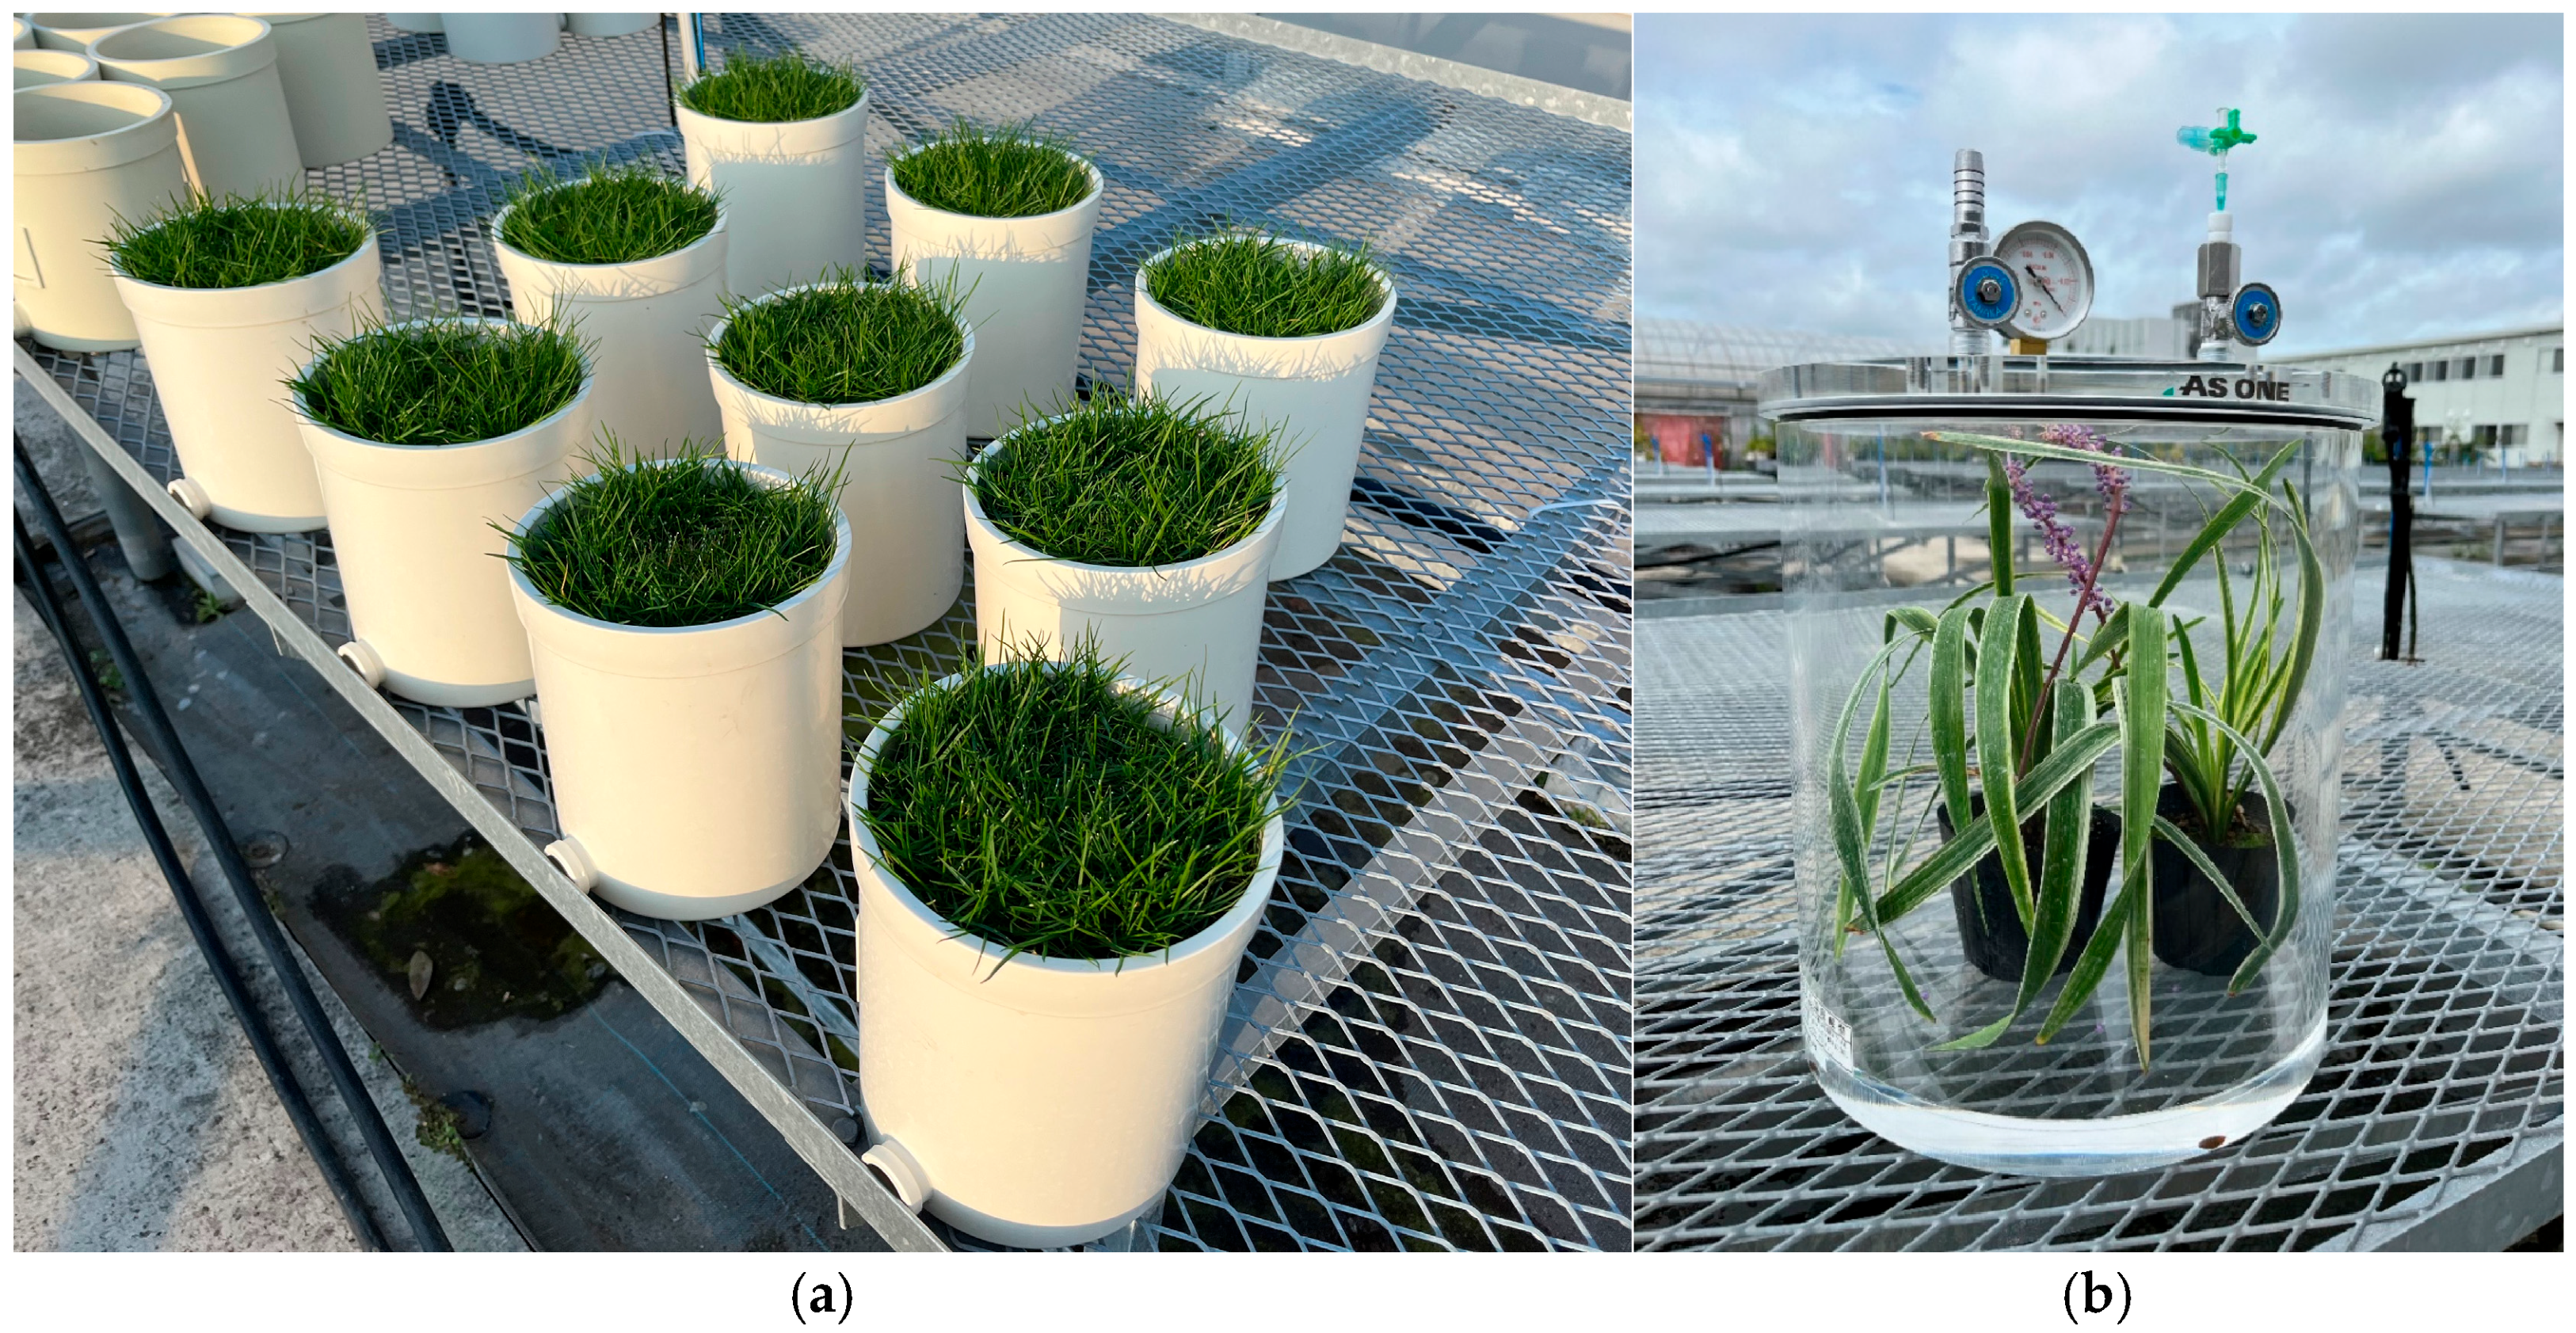
On 6 October 2023, to replicate the general soil cultivation method, 0.3 g of Kentucky bluegrass ‘Moonlight SLT’ (TAKII & Co., Ltd (Kyoto-city, Japan)) seed was sown in a Wagener pot (φ159 × 190 mm, 0.02 m2), filled with 2 L of soil (1.7 L andosol and 0.3 L compost) (Table S1). A total of 10 pots were prepared and maintained in open fields (Kashiwa, Chiba, Japan) (Figure 2a). On 26 May 2024, the cultivation was terminated, and six pots were randomly selected for harvest. Turf was cut with 20 mm-thick soil layers and separated into plant and soil components. Harvested plant material was dried at 80 °C for 72 h and weighed. Carbon concentrations in the seeds and harvested plants were analyzed using a 2400 Series II CHNS/O analyzer (PerkinElmer, USA) (n = 6). Carbon sequestration from turfgrass growth (via photosynthesis) was calculated by subtracting the carbon content of the seeds per pot from that of the harvested plants. Results were converted to CO2e (carbon sequestration multiplied by 44 and divided by 12) and scaled to a per-hectare basis. Grass was mowed when its height exceeded 60 mm.
GHG fluxes were monitored approximately every two weeks during the cultivation period (6 October 2023, to 26 May 2024) using a closed-chamber method [20]. Gas samples were collected from three pots per sampling period between 8:00 and 15:00. Sampling occurred at 0, 10, and 20 min intervals, and the CO2, CH4, and N2O concentrations were analyzed using a gas chromatograph (GC-2014, Shimadzu, Kyoto, Japan). GHG fluxes and CH4 and N2O emissions during the experimental period were calculated according to closed-chamber guidelines [20]. CO2 fluxes over the experimental period were not calculated because gas sampling was limited to daylight hours, and CO2 sequestration was evaluated by converting the carbon sequestration of plant biomass.
This study also quantified annual GHG fluxes and carbon sequestration from grass clippings handled on site (leaving them as is). This is because a large amount of grass clippings is generated in the production of sod, and it is generally disposed of by leaving it as is. To assess the overall GHG budget in the production field more accurately, it is necessary to include the GHG flux during the disposal phase of grass clippings. On 6 October 2023, 50 g dry weight (DW) of Kentucky bluegrass clippings was placed in a Wagener pot (φ159 × 190 mm) filled with 1 L of andosol. A control treatment using only 1 L of soil was also prepared. Five replicates were used per treatment for each experiment. All pots were kept outdoors in open fields (Kashiwa, Chiba, Japan). GHG fluxes were monitored every two weeks for one year using the same closed-chamber method (n = 3). Gas sampling and analysis followed the procedure described above. Annual emissions of CO2, CH4, and N2O were calculated by subtracting emissions from the control from those in the grass clipping treatment. Carbon content in the grass clippings was measured at the beginning (6 October 2023) and end of the experiment (7 October 2024) using the 2400 Series II CHNS/O Analyzer (PerkinElmer, USA) (n = 5).

2.2. Experiment 2: GHG Budget Assessments of Potting Production of Three Herbaceous Plants

Hedera canariensis and Liriope muscari are evergreen perennials widely used for landscaping in Japan, while Tagetes patula is an annual plant commonly grown for spring and summer flowering. In this study, H. canariensis and L. muscari were propagated via division, and T. patula by direct seeding.
On 27 April 2024, divided plantlets of H. canariensis and L. muscari were planted in polypropylene pots (φ105 × 88 mm). Six seeds of T. patula ‘Hot Pak™ Orange’ were sown per pot. After germination, seedlings were thinned to three per pot. A potting mixture of Kanuma soil, compost, and perlite in a 4:4:2 ratio was used (Table S1). The pots were maintained in an open field (Kashiwa, Chiba, Japan). The potting mixture used in this experiment and open-field production of these herbaceous plants are common methods in Japan. The production period for H. canariensis and L. muscari pots was from 27 April to 12 September, and the production period for T. patula pots was from 27 April to 8 June.
Carbon sequestration by plant growth (photosynthesis) was calculated as the difference in carbon content between divided plantlets or seeds and the harvested plants per pot (n = 10). GHG flux sampling and calculation followed the procedure described in Experiment 1 (n = 3) (Figure 2b). Energy and resource use were recorded throughout the potting production. CO2, CH4, and N2O emission factors for each energy and resource were determined using MiLCA 2.3, a life cycle assessment software developed by the Japan Environmental Management Association for Industry. Where data were unavailable in the software, results of previous studies and reports were used. Water use emissions were based on electricity required for groundwater pumping (0.42 kWh/t) [21]. Emission factors for Kanuma soil [22] and perlite [23] were also used. The same factor was applied for granular and water-soluble pesticides. Emissions of the three gases were calculated by multiplying the corresponding factor by the amount used.

3. Results

3.1. Experiment 1: GHG Budget Assessment of Kentucky Bluegrass Sod Production

3.1.1. Carbon Sequestration During Sod Production

The carbon concentration, dry weight, and carbon content of the Kentucky bluegrass seeds and harvested plants per pot are listed in Table 1. The dry weight and carbon content increased during the cultivation period, although there were no notable differences between the carbon concentrations of the seeds and harvested plants. Based on these results, CO2 sequestration during sod production was calculated to be 23.014 t-CO2/ha.

3.1.2. GHG Fluxes During Sod Production

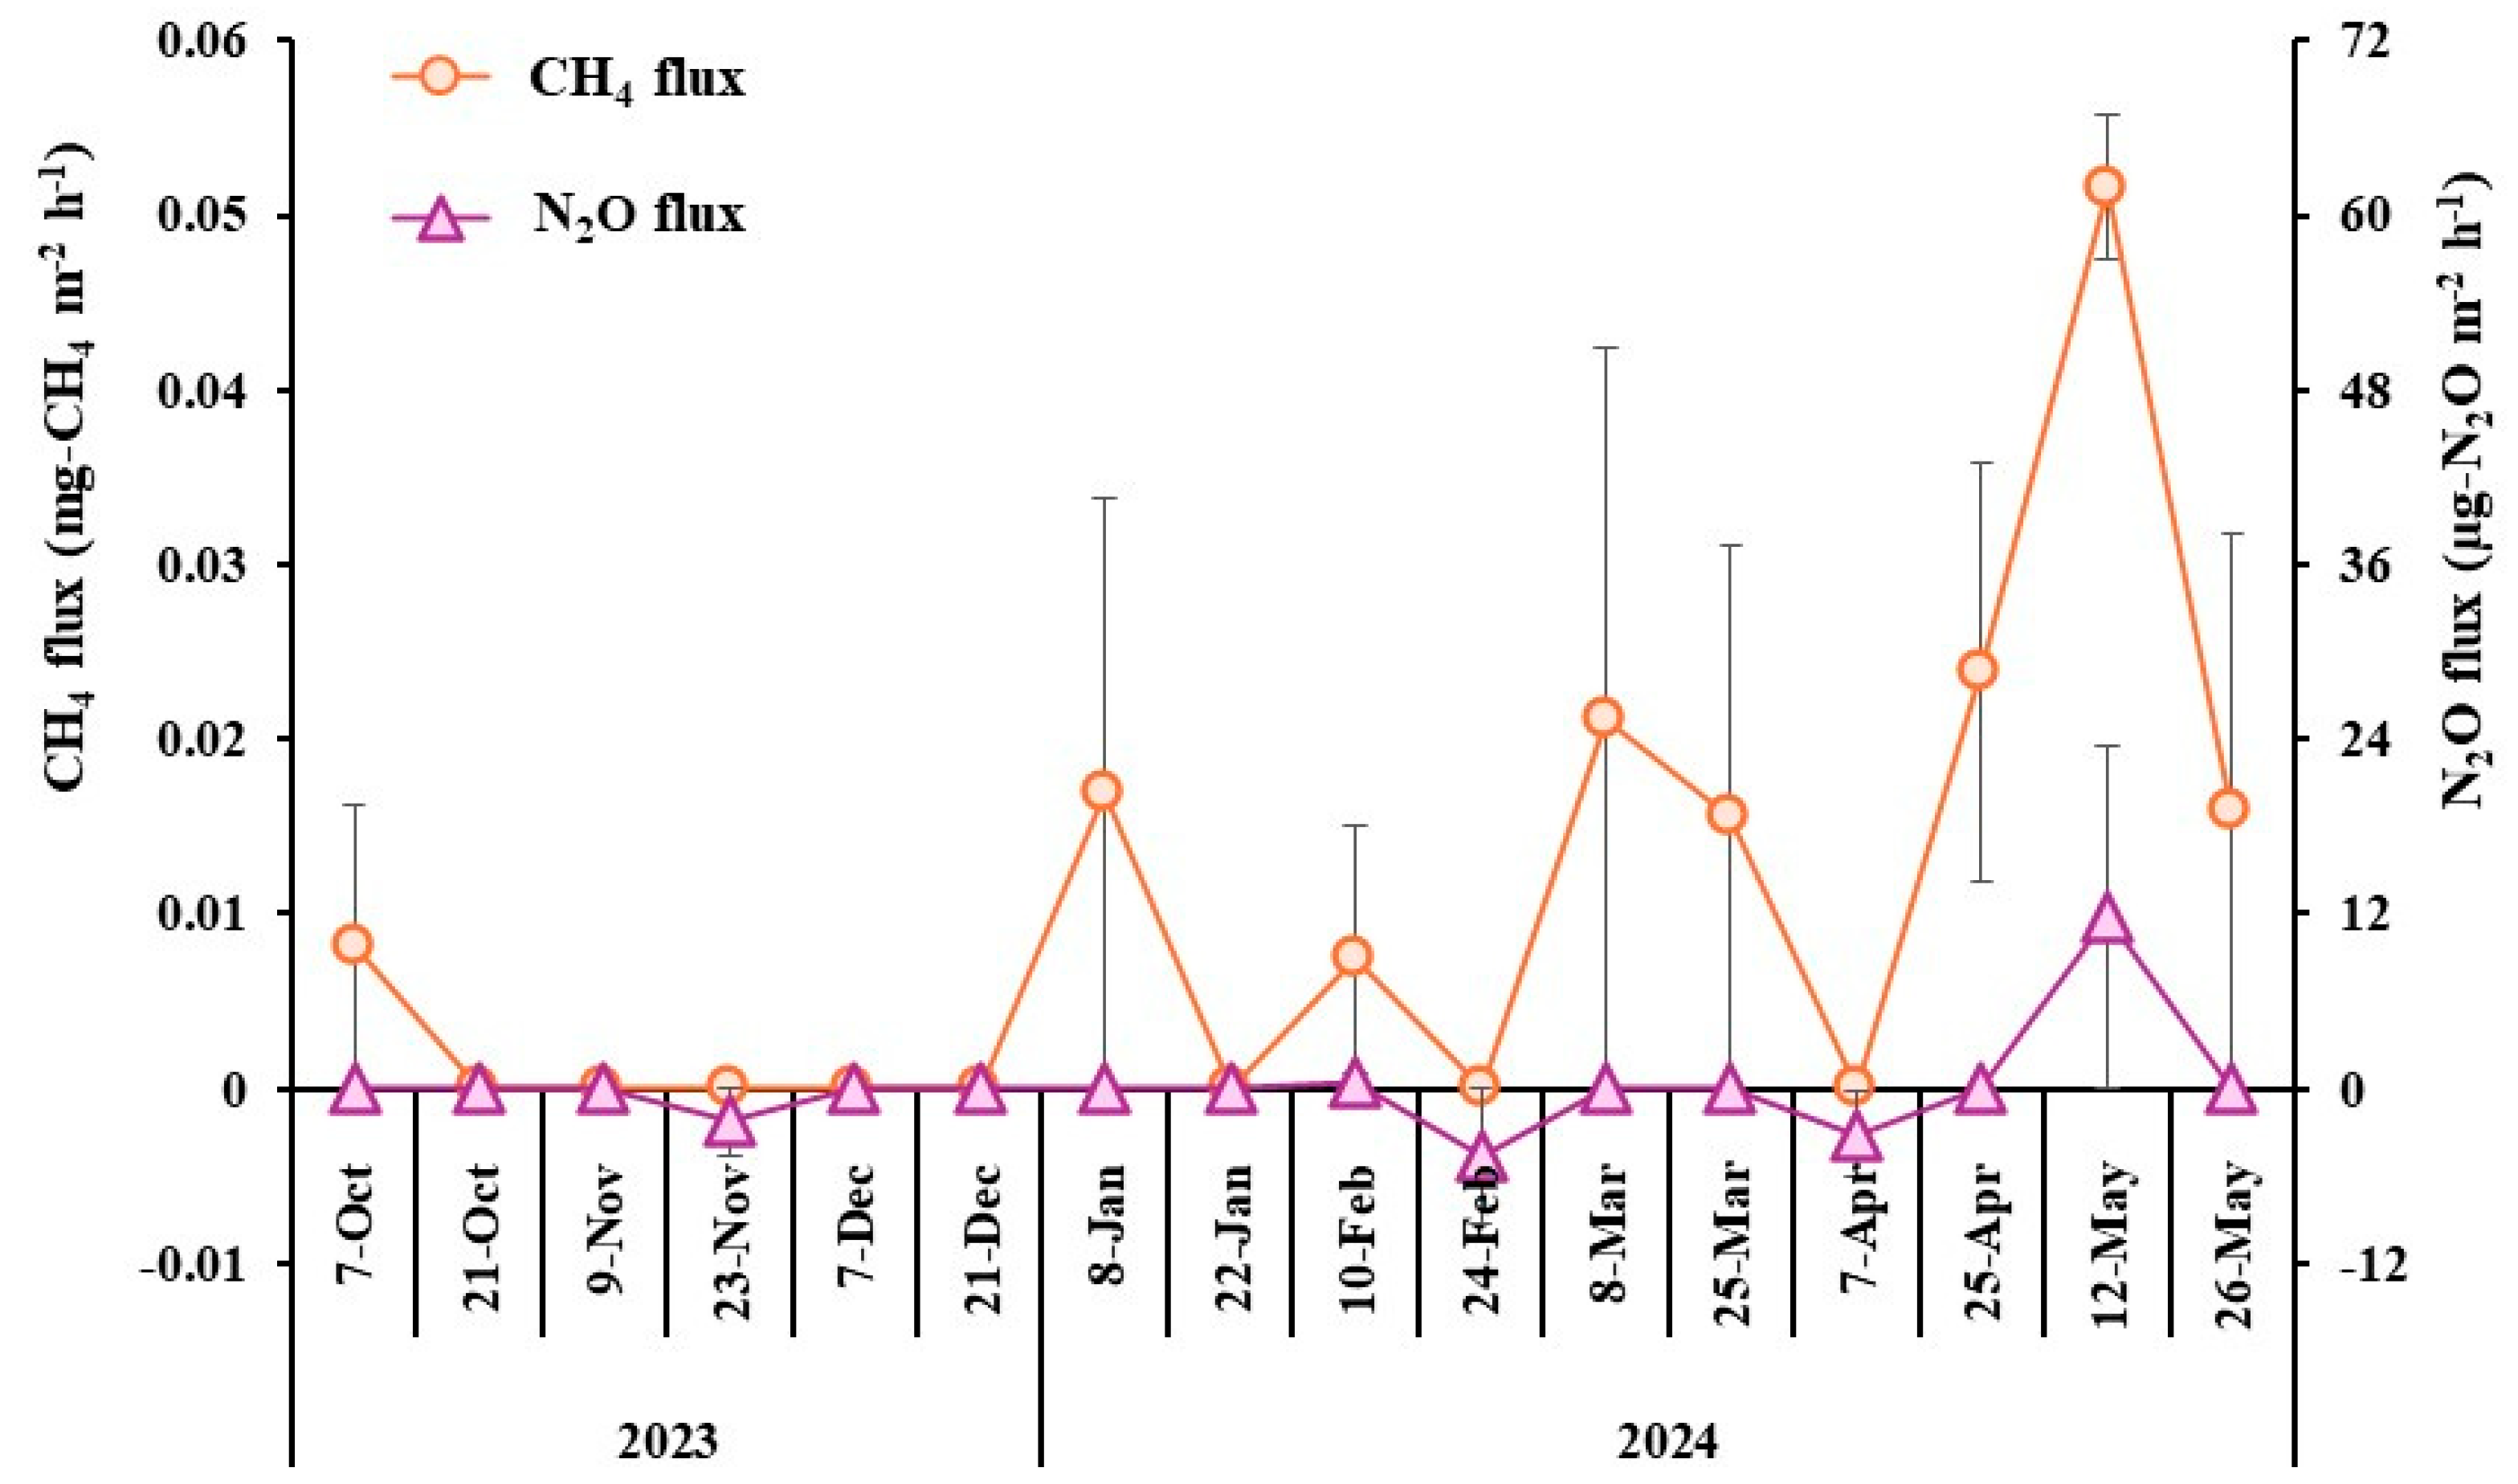
The CH4 and N2O fluxes during the cultivation period are shown in Figure 3. The highest CH4 flux was observed on 12 May during the experimental period. Positive N2O fluxes were detected only on 12 May during the experimental period. For CO2 fluxes, all values except those on 7 October 2023, and 25 March 2024, were negative, indicating that Kentucky bluegrass underwent photosynthesis during the light period (Figure S2). Cumulative CH4 and N2O emissions during the cultivation period were calculated to be 0.561 kg-CH4/ha (46.283 kg-CO2e/ha) and 11.658 g-N2O/ha (3.183 kg-CO2e/ha), respectively.

3.1.3. GHG Emissions from Energy and Resource Consumption During Sod Production

GHG emissions from energy and resource consumption, quantified by converting previous results [19] to GWP-20, are shown in Table S2. GHG emissions from gasoline and diesel fuel use include GHG emissions from their manufacturing and combustion processes. GHG emissions from fertilizer, compost, insecticide and fungicide, and herbicide use represent the results of their manufacturing processes. GHG emission from water use results from electricity consumption for groundwater pumping.
Total GHG emissions from energy and resource use were calculated at 5.201 t-CO2e ha−1 year−1. Compost use contributed the highest emissions, accounting for approximately 45% of total GHG emissions, due to its large application rate (Table S2).
From these results, GHG budget assessment during Kentucky bluegrass sod production were calculated at −17.764 t-CO2e ha−1 year−1 (Table 2 and Figure S3).

3.1.4. GHG Flux and Carbon Sequestration from Grass Clippings Left As Is

The dry weight, carbon and nitrogen concentrations, and carbon content of the grass clippings at the beginning and end of the experiment are listed in Table 3. While carbon and nitrogen concentrations showed little change, the dry weight of grass clippings between the start and end of the experiment decreased significantly. At the beginning of the experiment, grass clippings had sequestrated 76.7 g-CO2 per pot. One year later, the CO2 sequestration had decreased to 11.8 g-CO2 per pot, suggesting that 65.0 g-CO2 per pot were re-emitted to the atmosphere (Table 3).
The CO2, CH4, and N2O fluxes of the control and grass-clipping treatments are shown in Figure 4. CO2 and N2O emissions from grass clippings were clearly observed, while CH4 fluxes showed no significant differences between treatments. Cumulative CO2 emissions from grass clippings over one year were calculated at 62.6 g-CO2/pot, closely aligning with the estimated CO2 re-emissions from decomposition of grass clippings for one year (Table 3). Cumulative CH4 and N2O emissions from grass clippings for one year were −0.0015 g-CH4/pot (−0.013 g-CO2e/pot) and 0.033 g-N2O/pot (9.1 g-CO2e/pot), respectively. The cumulative N2O emissions remained lower than the amount of CO2 sequestrated in the clippings at the end of the experiment (11.8 g-CO2e/pot), indicating that the disposal phase of grass clippings when they were left as is did not act as a net GHG source.

3.2. Experiment 2: GHG Budget Assessments of Potting Production of Three Herbaceous Plants

3.2.1. Carbon Sequestration in Three Herbaceous Plant Potting Productions

The dry weight, carbon concentration, and carbon content of the three herbaceous plants per pot at the start (divided plantlets or seeds) and end of the experiment (harvested plants) are shown in Table 4. Both dry weight and carbon content increased during the cultivation period. Accordingly, CO2 sequestration by plant growth (photosynthesis) was calculated at 8.11 g-CO2/pot (Hedera canariensis), 11.01 g-CO2/pot (Liriope muscari), and 3.74 g-CO2/pot (Tagetes patula) (Table 4).

3.2.2. GHG Fluxes During Potting Production

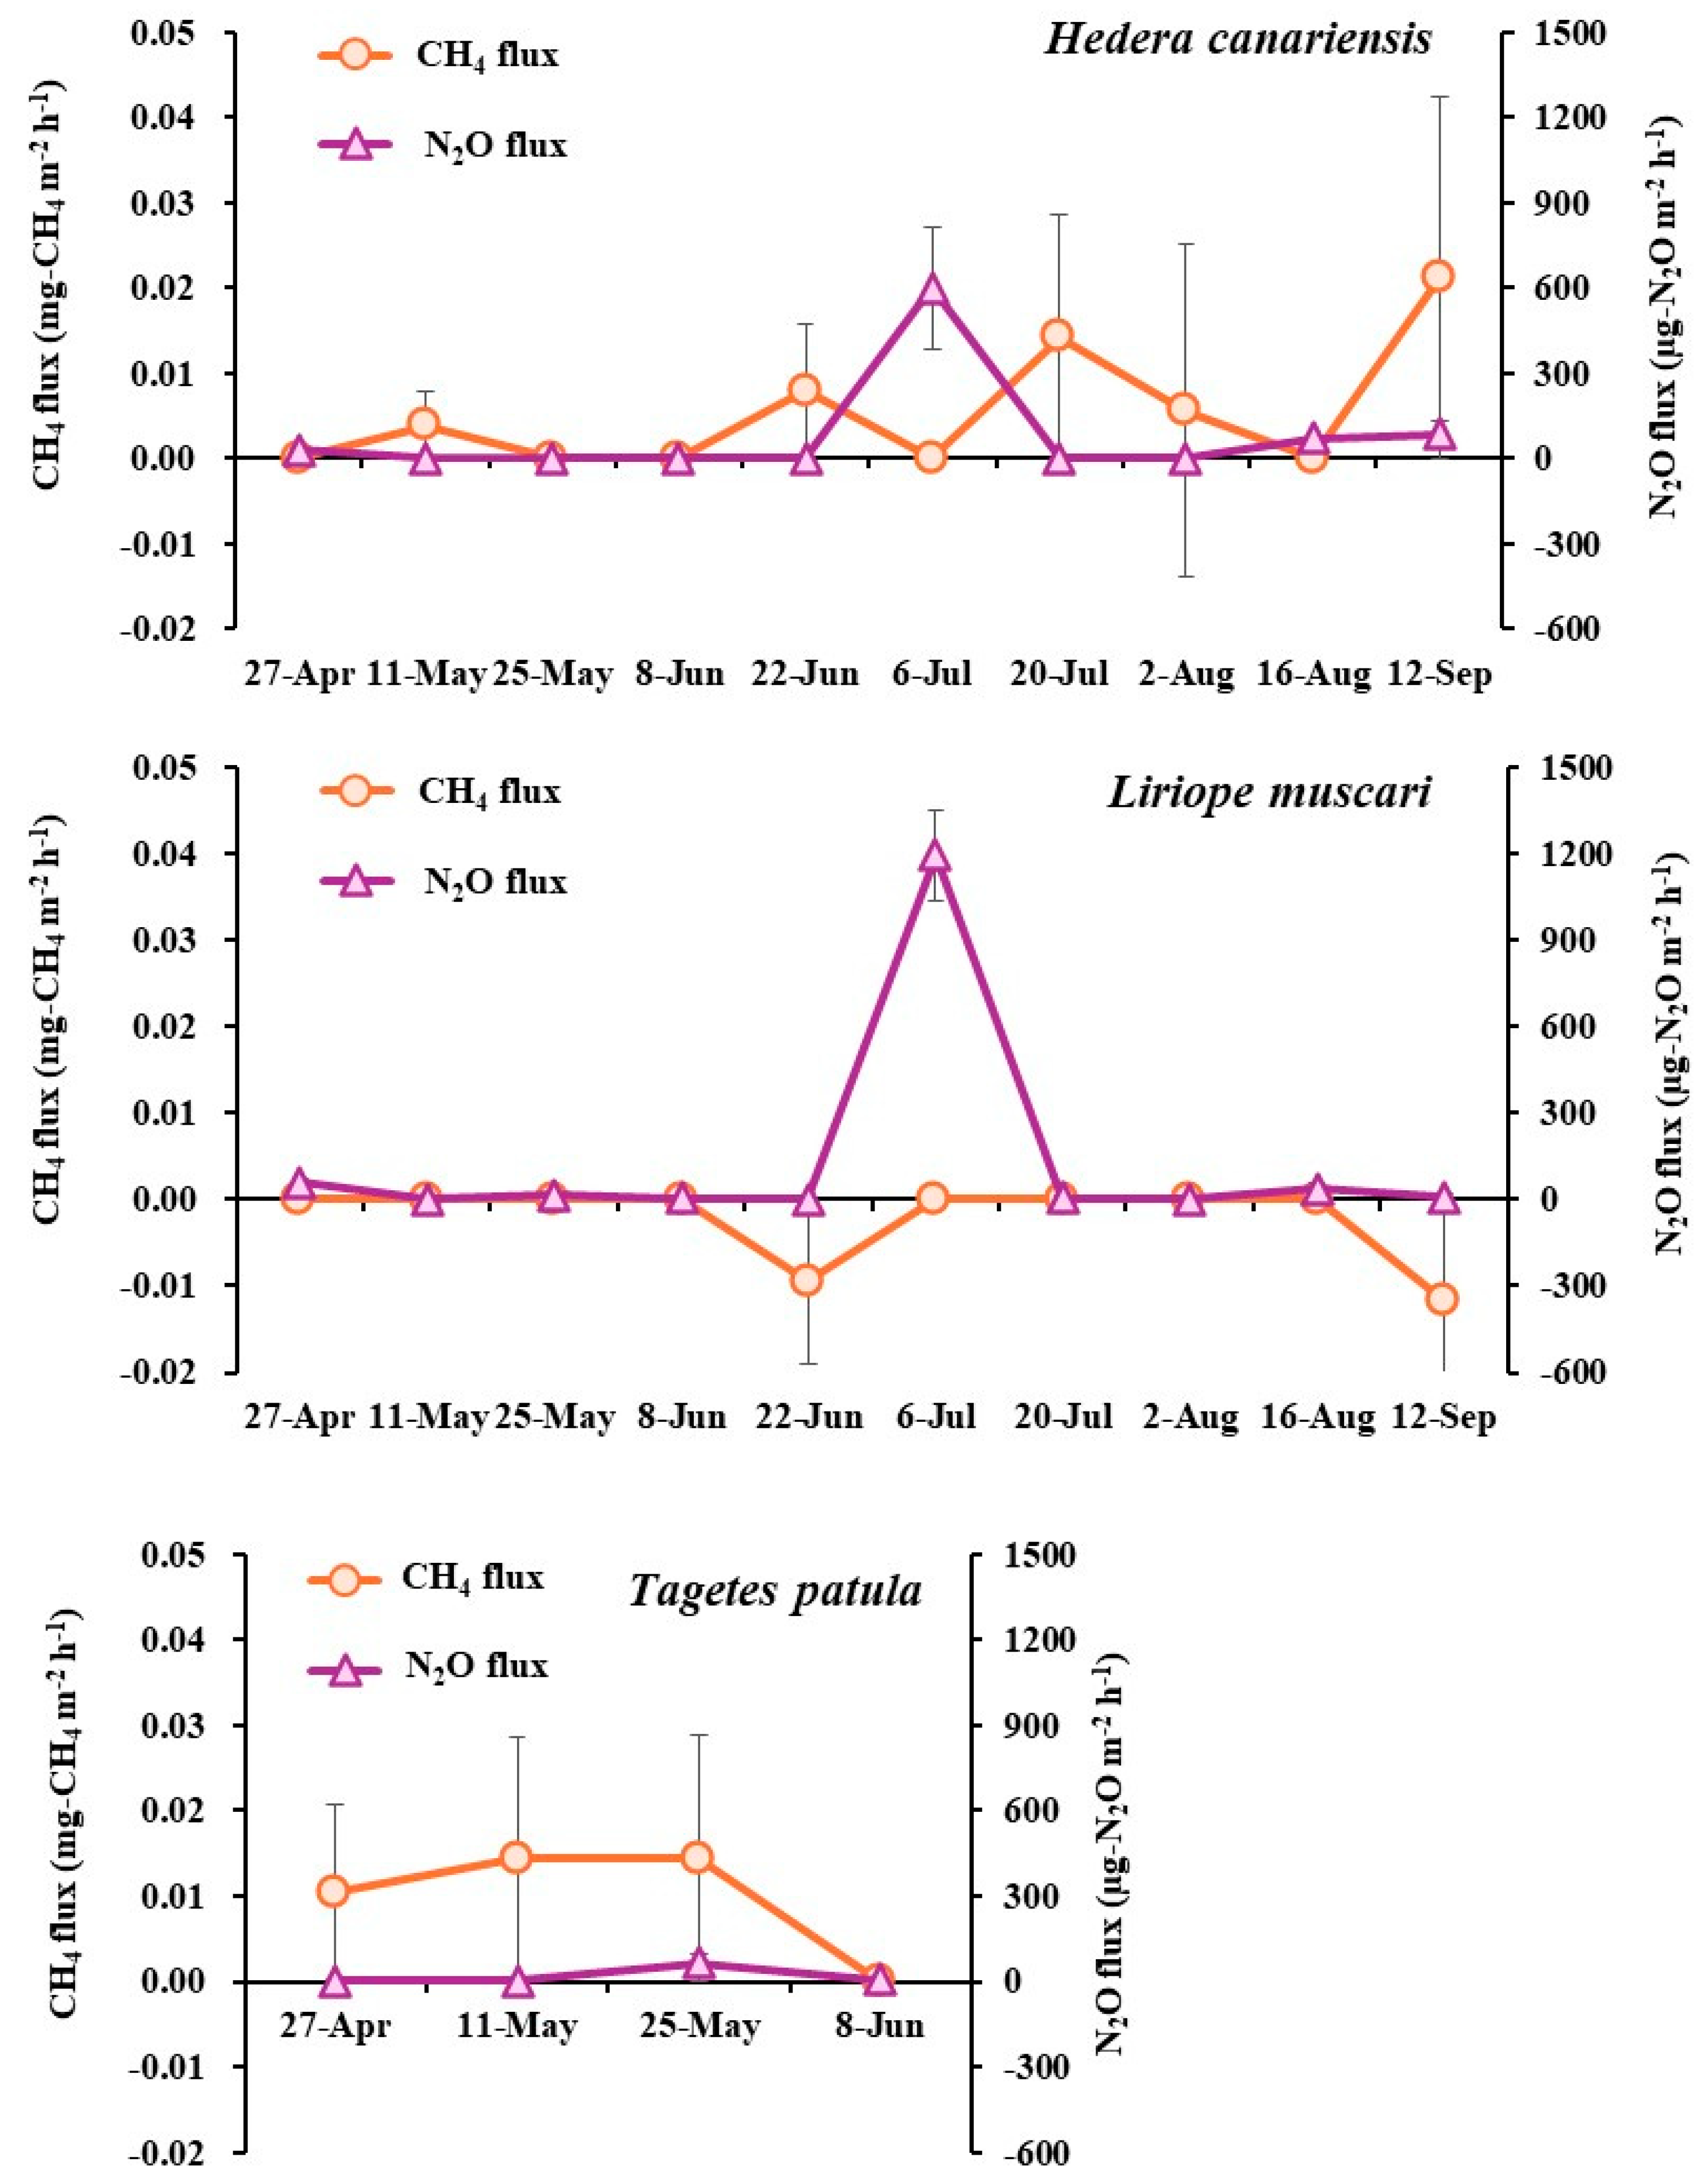
The CH4 and N2O fluxes during cultivation period are shown in Figure 5. For CH4, positive fluxes were observed in Hedera canariensis and Tagetes patula production, whereas CH4 fluxes in Liriope muscari production were either not detected or negative. Positive N2O fluxes occurred only on 6 July for Herera canariensis and Liriope muscari.
Cumulative CH4 emissions were calculated as 0.155 mg-CH4/pot (0.013 g-CO2e/pot) for Hedera canariensis, −0.063 mg-CH4/pot (−0.0052 g-CO2e/pot) for Liriope muscari, and 0.103 mg-CH4/pot (0.0085 g-CO2e/pot) for Tagetes patula. Cumulative N2O emissions were 2.413 mg-N2O/pot (0.66 g-CO2e/pot) for Hedera canariensis, 3.984 mg-N2O/pot (1.09 g-CO2e/pot) for Liriope muscari, and 0.227 mg-N2O/pot (0.062 g-CO2e/pot) for Tagetes patula.

3.2.3. GHG Emissions from Energy and Resource Consumption During Potting Production

The amounts of energy and resource use and their GHG emission factors are shown in Table 5. For Hedera canariensis and Liriope muscari, total GHG emissions from energy and resource consumption were 25.1 g-CO2e/pot, with compost and polypropylene pot use accounting for 30.3% of emissions. For Tagetes patula, total emissions were 41.3 g-CO2e/pot, which was approximately double that of the other species. The higher GHG emissions during Tagetes patula potting production were attributed to the use of granular pesticides, whose GHG emissions were the highest (16.577 g-CO2e/pot) and accounted for 40.2% of the total emissions (Table 5).

3.2.4. GHG Budget Assessments of Three Herbaceous Plant Potting Productions

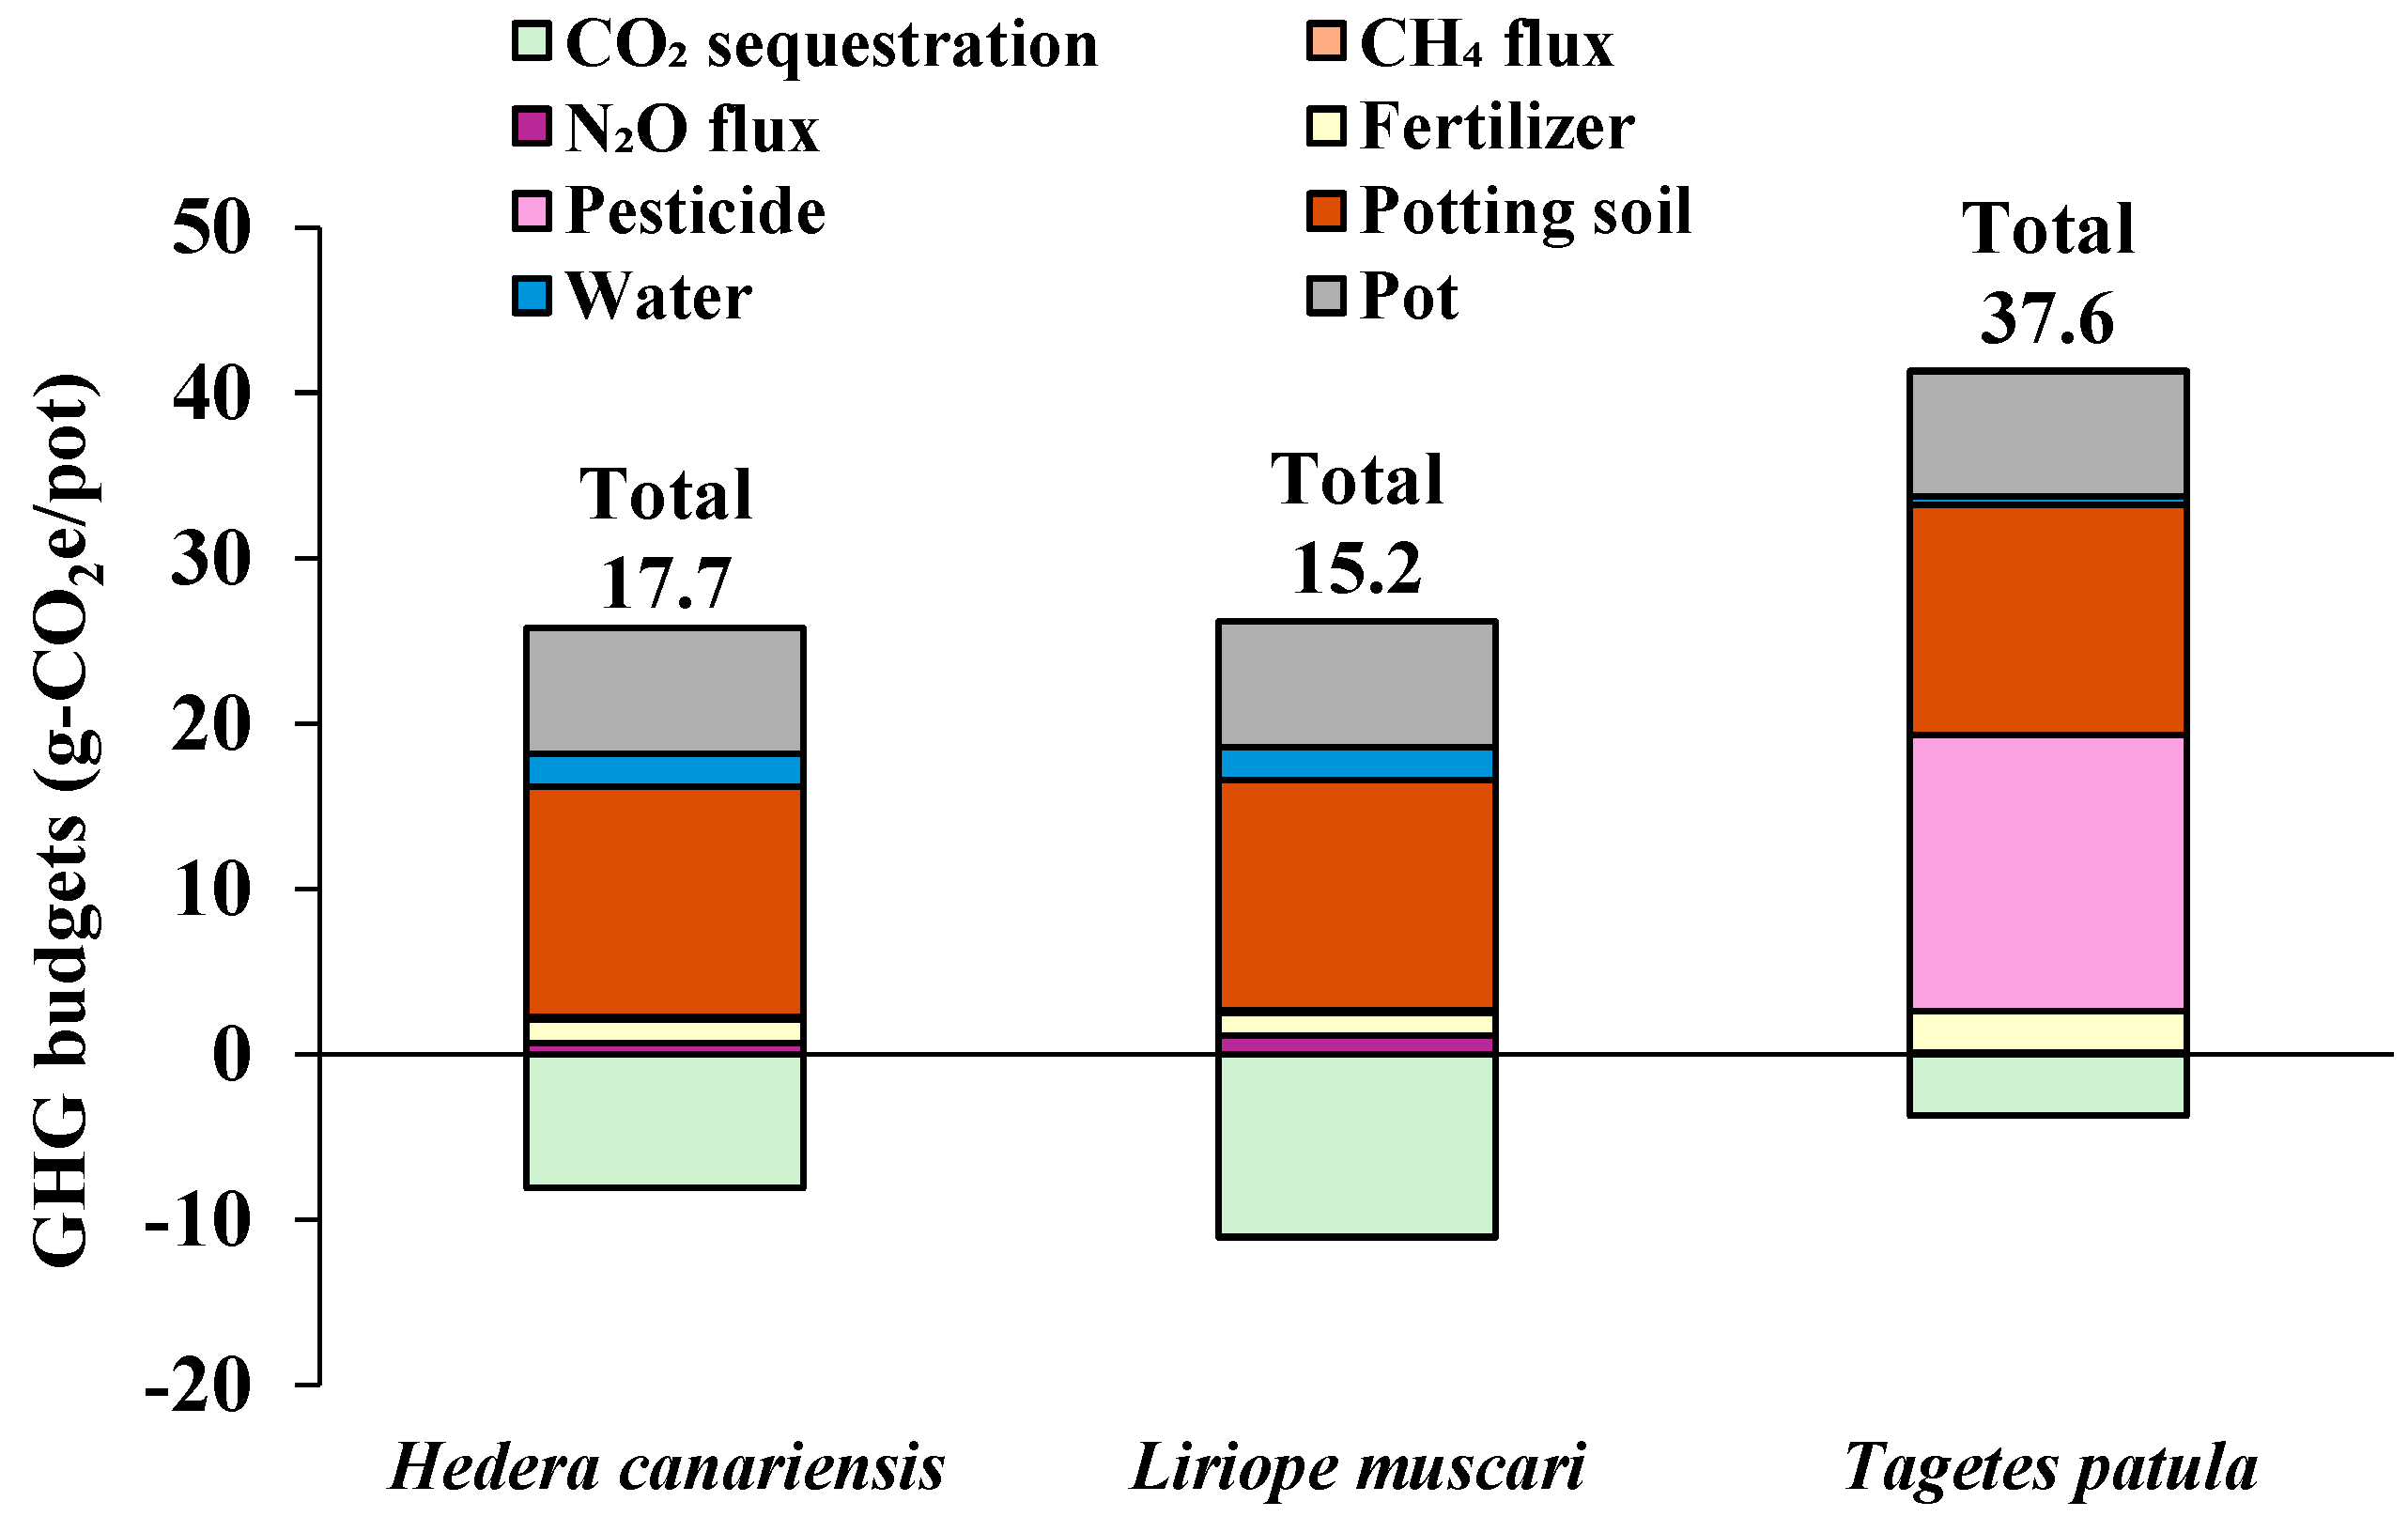
The GHG budgets and their components are summarized in Figure 6. Total GHG budgets were 17.7 g-CO2e/pot for Hedera canariensis, 15.2 g-CO2e/pot for Liriope muscari, and 37.6 g-CO2e/pot for Tagetes patula. These results indicate that the potting production of all three herbaceous plants was a net GHG source. Among the GHG budget components, soil fluxes (CH4 and N2O fluxes) and GHG emissions from the use of fertilizer and water had a minor impact on total values (Figure 6). In contrast, GHG emissions from the use of granular pesticides, potting soil, and polypropylene pots were major contributors (Figure 6 and Table 5).

4. Discussion

4.1. GHG Budgets of Kentucky Bluegrass Sod Production

The GHG budget of Kentucky bluegrass sod production was −17.764 t-CO2e ha−1 year−1, which aligns closely with our previous estimation [19] and is comparable to the carbon sequestration capacity of forests and urban trees [24,25,26,27,28,29,30,31,32]. Additionally, the disposal phase of grass clippings left as is was not found to be a GHG source, as its GHG budget was calculated to be −2.7 g-CO2e/pot. Therefore, our study demonstrates that Kentucky bluegrass sod production fields act as a GHG sink.
In recent years, the area of shipped sod in Japan has been approximately 3500 ha, and the total GHG reduction from turf production fields was estimated to be at least 62,000 t-CO2e. To date, little research or discussion has addressed the GHG budgets of herbaceous plants such as turf, largely due to them having short lifespans compared to woody plants. However, this study highlights the importance of quantifying the GHG reduction potential of herbaceous green spaces and agricultural lands to achieve a GHG-neutral society. Furthermore, the adoption of GWP-20 allowed for a more accurate assessment of the GHG budget during turf and herbaceous plant production. Broad application of these methods will support proper GHG assessments and reductions in the horticultural sector.
Reducing compost use was identified to be an effective strategy for lowering GHG emissions from Kentucky bluegrass sod production (Table S2). Kuronuma et al. [19] estimated that the biochar yield from 1 t-FW of grass clippings contributes to the absorption of 0.201 t-CO2e. Therefore, carbonizing grass clippings and returning them to turf production fields may further enhance GHG absorption.

4.2. GHG Budgets of Three Herbaceous Plant Potting Productions

In this study, the GHG budgets of the three herbaceous plant potting productions were positive, even when CO2 sequestration by plant growth (photosynthesis) was included (Figure 6). This was mainly due to GHG emissions from the use of potting soil and granular pesticides (Figure 6 and Table 5). Merble et al. [33] emphasized the importance of using unused biomass resources (e.g., pine bark) as growing media in ornamental horticulture, granting carbon sequestration contributions in plant production. In this study, the GHG budgets for a hypothetical replacement of perlite with biochar yield from grass clippings [19] were estimated and shown in Figure 7. The biochar properties used in the estimation were based on our previous study (specific gravity: 0.1 g/cm3, carbon content: 59.3%, carbon remaining after 100 years: 89%) [19]. GHG emissions from potting soil were calculated at −7.476 g-CO2e/pot, and the total GHG budgets for Hedera canariensis and Liriope muscari potting production were estimated to become negative. These results suggest that herbaceous plant potting could serve as a GHG sink through the incorporation of biochar and other practices.
During carbonization, the plant material used as feedstock for biochar re-releases much of the CO2 it had previously fixed. This re-released amount has no net impact, positive or negative, on GHG budget. Conversely, the carbon fixed as biochar can be quantified as a carbon sequestration contribution. Furthermore, it has been confirmed that the biochar production process considered here uses almost no fuel [19]. The manufacture of carbonization furnaces is expected to generate significant GHG emissions. However, this study excluded the manufacture of carbonization furnaces from the system boundary. This is because the impact varies considerably depending on factors such as the utilization rate of the carbonization furnaces. In this experiment, we did not conduct cultivation tests using biochar because we were unable to secure a sufficient quantity of biochar for the trials. However, future experiments are necessary, including testing whether biochar can be used as a substitute for perlite. Furthermore, assessments of GHG budgets and plant growth performance will be necessary when biochar and other methods are used. Additionally, some studies [33,34] have reported that unused biomass resources, including compost, can also have carbon sequestration effects. Thus, further discussion of GHG emission factors of compost is warranted.
For Tagetes patula, the total GHG budget was presented as a reference value due to the plant’s annual lifecycle. Because of its short lifespan, GHG budgets during the disposal phase must be carefully investigated. Nonetheless, our results suggest that reducing the use of granular pesticides is an effective approach for reducing GHG emissions (Figure 6 and Table 5).

4.3. Toward More Accurate Quantification of GHG Budgets in Horticultural Plant Production

In this study, the same GHG emission factor was adopted for granular and water-soluble pesticides due to the lack of available data. In general, data on products and services used in horticultural production are significantly scarcer than in other industries. To quantify GHG budgets for horticultural plant production more accurately, carbon footprint data for many products and services should be compiled and made publicly available. In addition, a GHG budget assessment using our method should be conducted for a wide variety of cultivation systems and plant species to develop essential guidelines for achieving net-zero CO2 emissions in the horticultural industry.

Supplementary Materials

The following supporting information can be downloaded at: https://www.mdpi.com/article/10.3390/horticulturae11091132/s1, Figure S1: System boundaries in this study. Dotted line indicates area outside the system boundary; Figure S2: CO2 fluxes during Kentucky bluegrass sod production throughout the cultivation period; Figure S3: Total GHG budgets and their components in Kentucky bluegrass sod production; Table S1: The basic properties of the experimental medium; Table S2: Amount of annual energy and resources used for Kentucky bluegrass sod production and resulting GHG emissions.

Author Contributions

Conceptualization, T.K. and H.W.; methodology, T.K.; validation, T.K.; formal analysis, T.K.; investigation, T.K.; resources, H.W., S.M. and T.M.; data curation, T.K.; writing—original draft preparation, T.K.; writing—review and editing, H.W., S.M. and T.M.; visualization, T.K.; supervision, H.W.; project administration, T.K.; funding acquisition, T.K., S.M. and T.M. All authors have read and agreed to the published version of the manuscript.

Funding

This research was funded by JSPS KAKENHI, grant number JP23K13975.

Data Availability Statement

The original contributions presented in this study are included in the article/Supplementary Material. Further inquiries can be directed to the corresponding author.

Conflicts of Interest

Shohei Masuda and Takuya Mito were employed by Honda R&D Co., Ltd. The remaining authors declare that the research was conducted in the absence of any commercial or financial relationships that could be construed as a potential conflict of interest.

References

  1. The Intergovernmental Panel on Climate Change (IPCC). Synthesis Report of the IPCC sixth Assessment Report (AR6). 2023. Available online: https://www.ipcc.ch/report/sixth-assessment-report-cycle/ (accessed on 10 August 2025).
  2. Bisbis, M.B.; Gruda, N.S.; Blanke, M.M. Securing horticulture in a changing climate—A mini review. Horticulturae 2019, 5, 56. [Google Scholar] [CrossRef]
  3. Gruda, N.; Bisbis, M.; Tanny, J. Influence of climate change on protected cultivation: Impacts and sustainable adaptation strategies-A review. J. Clean. Prod. 2019, 225, 481–495. [Google Scholar] [CrossRef]
  4. Lee, S.G.; Kim, S.K.; Lee, H.J.; Choi, C.S.; Park, S.T. Impacts of climate change on the growth, morphological and physiological responses, and yield of Kimchi cabbage leaves. Hortic. Environ. Biotech. 2016, 57, 470–477. [Google Scholar] [CrossRef]
  5. Xu, X. Major challenges facing the commercial horticulture. Frontiers Hortic. 2022, 1, 980159. [Google Scholar] [CrossRef]
  6. Sangiorgio, D.; Cellini, A.; Donati, I.; Pastore, C.; Onofrietti, C.; Spinelli, F. Facing climate change: Application of microbial biostimulants to mitigate stress in horticultural crops. Agronomy 2020, 10, 794. [Google Scholar] [CrossRef]
  7. Jain, S.; Lamo, K.; Walling, S.; Imchen, A.; Tirkey, J.F.; Singh, A. Climate-resilient horticulture: Adapting to climate change through innovative practices and technologies. Int. J. Environ. Climate Change 2024, 14, 219–233. [Google Scholar] [CrossRef]
  8. Gush, M.B.; Blanuša, T.; Chalmin-Pui, L.S.; Griffiths, A.; Larsen, E.K.; Prasad, R.; Redmile-Gordon, M.; Sutcliffe, C. Environmental horticulture for domestic and community gardens—An integrated and applied research approach. Plants People Planet 2024, 6, 254–270. [Google Scholar] [CrossRef]
  9. Soode, E.; Lampert, P.; Weber-Blaschke, G.; Richter, K. Carbon footprints of the horticultural products strawberries, asparagus, roses and orchids in Germany. J. Clean. Prod. 2015, 87, 168–179. [Google Scholar] [CrossRef]
  10. Ntinas, G.K.; Neumair, M.; Tsadilas, C.D.; Meyer, J. Carbon footprint and cumulative energy demand of greenhouse and open-field tomato cultivation systems under Southern and Central European climatic conditions. J. Clean. Prod. 2017, 142, 3617–3626. [Google Scholar] [CrossRef]
  11. Pérez-Neira, D.; Grollmus-Venegas, A. Life-cycle energy assessment and carbon footprint of peri-urban horticulture. A comparative case study of local food systems in Spain. Landsc. Urban Plan. 2018, 172, 60–68. [Google Scholar] [CrossRef]
  12. Ingram, D.L. Life cycle assessment of a field-grown red maple tree to estimate its carbon footprint components. Int. J. Life Cycle Assess. 2012, 17, 453–462. [Google Scholar] [CrossRef]
  13. Ingram, D.L. Life cycle assessment to study the carbon footprint of system components for Colorado blue spruce field production and use. J. Ame. Soc. Hortic. Sci. 2013, 138, 3–11. [Google Scholar] [CrossRef]
  14. Ingram, D.L.; Hall, C.R. Carbon footprint and related production costs of system components of a field-grown Cercis canadensis L.‘Forest Pansy’using life cycle assessment. J. Environ. Hortic. 2013, 31, 169–176. [Google Scholar] [CrossRef]
  15. Hall, C.R.; Ingram, D.L. Carbon footprint and production costs associated with varying the intensity of production practices during field-grown shrub production. HortScience 2015, 50, 402–407. [Google Scholar] [CrossRef]
  16. Marble, S.C.; Prior, S.A.; Runion, G.B.; Torbert, H.A.; Gilliam, C.H.; Fain, G.B.; Sibley, J.L.; Knight, P.R. Determining trace gas efflux from container production of woody nursery crops. J. Environ. Hortic. 2012, 30, 118–124. [Google Scholar] [CrossRef]
  17. Marble, S.C.; Prior, S.A.; Runion, G.B.; Torbert, H.A.; Gilliam, C.H.; Fain, G.B.; Sibley, J.L.; Knight, P.R. Effects of fertilizer placement on trace gas emissions from nursery container production. HortScience 2012, 47, 1056–1062. [Google Scholar] [CrossRef]
  18. Marble, S.C.; Prior, S.A.; Runion, G.B.; Torbert, H.A.; Gilliam, C.H.; Fain, G.B.; Sibley, J.L.; Knight, P.R. Species and media effects on soil carbon dynamics in the landscape. Sci. Rep. 2016, 6, 25210. [Google Scholar] [CrossRef] [PubMed]
  19. Kuronuma, T.; Masuda, S.; Mito, T.; Watanabe, H. Inclusive greenhouse gas budget assessment in turfs: From turf production to disposal of grass clippings. J. Environ. Manag. 2023, 346, 118919. [Google Scholar] [CrossRef]
  20. Minamikawa, K.; Tokida, T.; Sudo, S.; Padre, A.; Yagi, K. Guidelines for Measuring CH4 and N2O Emissions from Rice Paddies by a Manually Operated Closed Chamber Method; National Institute for Agro-Environmental Sciences: Tsukuba, Japan, 2015; Available online: https://www.naro.affrc.go.jp/archive/niaes/techdoc/mirsa_guidelines.pdf (accessed on 10 August 2025).
  21. Matsumoto, Y.; Yoshida, S.; Nishida, K. Huge Power Consumption by Groundwater Irrigation in Paddy Fields of Volcanic Ash Soils. J. Jpn. Soc. Irrig. Drain. Rural Eng. 2016, 84, 847–850. (In Japanese) [Google Scholar] [CrossRef]
  22. Seo, Y.; Suzuki, M.; Takagi, T.; Dowaki, K. Life-cycle assessment of adsorbents for biohydrogen production. Resources 2019, 8, 52. [Google Scholar] [CrossRef]
  23. United States Environmental Protection Agency (USEPA). Emission factor documentation for AP-42 Section 8.17: Perlite processing. Perlite processing. In AP-42, Compilation of Air Pollutant Emission Factors, 5th ed.; Chapter 11: Mineral products industry; USEPA: Washington, DC, USA, 1995; Volume I, 22p. Available online: https://www.epa.gov/sites/default/files/2020-10/documents/b11s30.pdf (accessed on 21 July 2025).
  24. Barford, C.C.; Wofsy, S.C.; Goulden, M.L.; Munger, J.W.; Pyle, E.H.; Urbanski, S.P.; Hutyra, L.; Saleska, S.R.; Fitzjarrald, D.; Moore, K. Factors controlling long-and short-term sequestration of atmospheric CO2 in a mid-latitude forest. Science 2001, 294, 1688–1691. [Google Scholar] [CrossRef]
  25. Black, T.A.; Chen, W.J.; Barr, A.G.; Arain, M.A.; Chen, Z.; Nesic, Z.; Hogg, E.H.; Neumann, H.H.; Yang, P.C. Increased carbon sequestration by a boreal deciduous forest in years with a warm spring. Geophys. Res. Lett. 2000, 27, 1271–1274. [Google Scholar] [CrossRef]
  26. De Vries, W.I.M.; Reinds, G.J.; Gundersen, P.E.R.; Sterba, H. The impact of nitrogen deposition on carbon sequestration in European forests and forest soils. Glob. Change Biol. 2006, 12, 1151–1173. [Google Scholar] [CrossRef]
  27. Dewar, R.C.; Cannell, M.G. Carbon sequestration in the trees, products and soils of forest plantations: An analysis using UK examples. Tree Physiol. 1992, 11, 49–71. [Google Scholar] [CrossRef] [PubMed]
  28. Fearnside, P.M.; Guimarães, W.M. Carbon uptake by secondary forests in Brazilian Amazonia. Forest Ecol. Manag. 1996, 80, 35–46. [Google Scholar] [CrossRef]
  29. Grünzweig, J.M.; Lin, T.; Rotenberg, E.; Schwartz, A.; Yakir, D. Carbon sequestration in arid-land forest. Glob. Change Biol. 2003, 9, 791–799. [Google Scholar] [CrossRef]
  30. Luyssaert, S.; Schulze, E.D.; Börner, A.; Knohl, A.; Hessenmöller, D.; Law, B.E.; Ciais, P.; Grace, J. Old-growth forests as global carbon sinks. Nature 2008, 455, 213–215. [Google Scholar] [CrossRef]
  31. Montagnini, F.; Nair, P.K.R. Carbon sequestration: An underexploited environmental benefit of agroforestry systems. Agrofor. Syst. 2004, 61, 281–295. [Google Scholar] [CrossRef]
  32. Nowak, D.J.; Crane, D.E. Carbon storage and sequestration by urban trees in the USA. Environ. Pollut. 2002, 116, 381–389. [Google Scholar] [CrossRef]
  33. Marble, S.C.; Prior, S.A.; Runion, G.B.; Torbert, H.A.; Gilliam, C.H.; Fain, G.B. The importance of determining carbon sequestration and greenhouse gas mitigation potential in ornamental horticulture. HortScience 2011, 46, 240–244. [Google Scholar] [CrossRef]
  34. Favoino, E.; Hogg, D. The potential role of compost in reducing greenhouse gases. Waste Manag. Res. 2008, 26, 61–69. [Google Scholar] [CrossRef]
Figure 1. Main components involved in GHG budgets in the horticultural industry.
Horticulturae 11 01132 g001
Figure 2. State of Kentucky bluegrass sod production in Experiment 1 (a) and gas sampling Liriope muscari potting production in Experiment 2 (b).
Horticulturae 11 01132 g002
Figure 3. CH4 and N2O fluxes from the Kentucky bluegrass sod production during the cultivation period.
Horticulturae 11 01132 g003
Figure 4. CO2, CH4, and N2O fluxes from control and grass clipping treatments over one year.
Horticulturae 11 01132 g004
Figure 5. CH4 and N2O fluxes from the potting production of the three herbaceous plants during the cultivation period.
Horticulturae 11 01132 g005
Figure 6. Total GHG budgets and their components for each herbaceous plant potting production.
Horticulturae 11 01132 g006
Figure 7. Hypothetical GHG budgets and their components when perlite is converted to biochar derived from grass clippings in each herbaceous plant potting production.
Horticulturae 11 01132 g007
Table 1. Carbon concentrations, dry weights, carbon contents, and CO2 contents of Kentucky bluegrass seed (6 October 2023) and harvested plants (26 May 2024). Data are means ± SE.
MaterialCarbon
Concentration (%)
Dry Weight
(g/pot)
Carbon Content (g/pot)CO2 Content
(t-CO2/ha)
Seed39.1 ± 0.10.30.1 ± 0.00.215 ± 0.001
Harvested plants34.8 ± 1.536.6 ± 1.012.7 ± 0.323.229 ± 0.534
CO2 sequestration during sod production 23.014t/CO2/ha
Table 2. GHG budgets and their components in Kentucky bluegrass sod production.
Three Main Components of the GHG Budgets
in Horticulture Plant Production
Values
(t-CO2e ha−1 year−1)
Photosynthesis−23.014
Soil fluxesCH4 flux0.046
N2O flux0.003
GHG emissions from energy and resources use5.201
Total−17.764
Table 3. Dry weights, carbon and nitrogen concentrations, carbon contents, and CO2 contents of grass clippings at the start and end of the experiment. Data are means ± SE.
MaterialDry Weight (g/pot)Carbon Concentration (%)Nitrogen Concentration (%)Carbon Content (g/pot)CO2 Content
(g-CO2/pot)
Grass clippings at the start of the experiment (6 October 2023)50.041.9 ± 0.13.5 ± 0.120.9 ± 0.076.7 ± 0.2
Grass clippings at the end of the experiment (7 October 2024)7.4 ± 0.943.1 ± 0.64.2 ± 0.23.2 ± 0.411.8 ± 1.4
Estimated CO2 re-emission from decomposition of grass clippings65.0g-CO2/pot
Table 4. Dry weights, carbon concentrations, carbon contents, and CO2 contents of the three herbaceous plants at the start of the experiment and end of the experiment. Data are means ± SE.
PlantsDry Weight
(g/pot)
Carbon Concentration (%)Carbon Content (g/pot)CO2 Content
(g-CO2/pot)
Hedera canariensisDivided plantlets (27 April 2024)0.89 ± 0.0844.2 ± 0.40.40 ± 0.041.45 ± 0.14
Harvested plants (12 September 2024)6.31 ± 0.4441.3 ± 0.32.61 ± 0.189.56 ± 0.66
CO2 sequestration during the potting production8.11g-CO2/pot
Liriope muscariDivided plantlets (27 April 2024)3.10 ± 0.2342.9 ± 0.31.33 ± 0.104.88 ± 0.37
Harvested plants (12 September 2024)11.71 ± 0.9337.3 ± 0.74.33 ± 0.2915.89 ± 1.07
CO2 sequestration during the potting production11.01g-CO2/pot
Tagetes patulaSeeds (27 April 2024)0.02 ± 0.0048.8 ± 0.20.01 ± 0.000.03 ± 0.00
Harvested plants (8 June 2024)2.82 ± 0.0736.4 ± 0.81.03 ± 0.033.77 ± 0.12
CO2 sequestration during the potting production3.74g-CO2/pot
Table 5. Amount of resources used for the potting production of the three herbaceous plants and the resulting GHG emissions.
PlantsMaterialsUse
(g/pot)
Emission Factor
(g-CO2e/g)
Emission
(g-CO2e/pot)
Total
Emission
(g-CO2e/pot)
Percentages of Each Emission to Total
Hedera
canariensis
FertilizerSolid fertilizer-1.140-25.1-
Water-soluble products for liquid fertilizer0.8751.6491.4435.7
PesticideGranules-16.577--
Water-soluble products for spraying0.010.1660.7
Potting soilKanuma soil103.50.0040.4141.6
Perlite13.40.4395.90023.5
Compost98.20.0777.59330.3
WaterIrrigation65000.000271.9827.9
Dilution water for liquid fertilizer875
Dilution water for pesticide spraying10
PotPolypropylene3.22.3757.60130.3
Liriope
muscari
FertilizerSolid fertilizer-1.140-25.1-
Water-soluble products for liquid fertilizer0.8751.6491.4435.7
PesticideGranules-16.577--
Water-soluble products for spraying0.010.1660.7
Potting soilKanuma soil103.50.0040.4141.6
Perlite13.40.4395.90023.5
Compost98.20.0777.59330.3
WaterIrrigation65000.000271.9827.9
Dilution water for liquid fertilizer875
Dilution water for pesticide spraying10
PotPolypropylene3.22.3757.60130.3
Tagetes
patula
FertilizerSolid fertilizer1.51.1401.70941.34.1
Water-soluble products for liquid fertilizer0.51.6490.8252.0
PesticideGranules116.57716.57740.2
Water-soluble products for spraying0.010.1660.4
Potting soilKanuma soil103.50.0040.4141.0
Perlite13.40.4395.90014.3
Compost98.20.0777.59318.4
WaterIrrigation12500.000270.4721.1
Dilution water for liquid fertilizer500
Dilution water for pesticide spraying10
PotPolypropylene3.22.3757.60118.4
Disclaimer/Publisher’s Note: The statements, opinions and data contained in all publications are solely those of the individual author(s) and contributor(s) and not of MDPI and/or the editor(s). MDPI and/or the editor(s) disclaim responsibility for any injury to people or property resulting from any ideas, methods, instructions or products referred to in the content.