Article

Study on the Motion Behavior of Charged Droplets near Plant Leaves

1
School of Agricultural Engineering, Jiangsu University, Zhenjiang 212013, China
2
Key Laboratory of Plant Protection Engineering, Ministry of Agriculture and Rural Affairs, Jiangsu University, Zhenjiang 212013, China
3
School of Mechanical Engineering, Zhejiang University of Water Resources and Electric Power, Hangzhou 310018, China
*
Author to whom correspondence should be addressed.
Horticulturae 2025, 11(9), 1117; https://doi.org/10.3390/horticulturae11091117
Submission received: 10 August 2025 / Revised: 9 September 2025 / Accepted: 12 September 2025 / Published: 15 September 2025
(This article belongs to the Section Vegetable Production Systems)

Abstract

Conventional spraying often results in poor deposition on the abaxial (lower) leaf surface and within the middle-to-lower canopy, where pest and disease pressures are typically highest. In this study, we evaluated the performance of electrostatic spraying using basil (Ocimum basilicum), cucumber (Cucumis sativus), and chili pepper (Capsicum annuum) leaves as target surfaces. A high-speed imaging system was employed to map droplet distributions on the abaxial surface, while a neighborhood-matching algorithm combined with droplet tracking was used to quantify the motion of individual droplets near the leaf. At the steady-state stage (frame 4500, 2.25 s), the number of charged droplets detected beneath the abaxial surface increased by 112% (basil), 132% (cucumber), and 213% (chili pepper) compared with non-electrostatic spraying. Smaller charged droplets exhibited higher horizontal velocities and smaller deflection angles in their trajectories near the leaf, indicating a stronger tendency to migrate toward the target surface and into the canopy interior. These findings demonstrate that electrostatic forces substantially enhance abaxial deposition and provide practical guidance for optimizing parameters for electrostatic spraying, such as droplet size, to improve spray efficiency in agricultural applications.

1. Introduction

Electrostatic spraying has emerged as an efficient method for pesticide application in modern agriculture [1,2]. Traditional spraying often fails to achieve effective deposition on abaxial (lower) leaf surfaces and within the mid-lower-canopy sites where diseases and pests frequently occur [3]. In contrast, electrostatic spraying charges droplets, enabling their attachment to plant surfaces, including to the abaxial leaves, through coulombic forces [4]. Additionally, like-charge repulsion among droplets promotes a more uniform spatial distribution on the target and enhances penetration into concealed regions, such as the abaxial surface and the mid-to-lower canopy [5,6]. For example, Zhao et al. (2008) reported that electrostatic spraying enhanced deposition efficiency via the space charge effect, reducing pesticide use by up to 50% [7]. In practical agricultural applications, electrostatic spraying systems have shown considerable potential to improve pesticide coverage on plant surfaces, enhance pest and disease control, and ultimately increase crop yields [8]. However, progress in this field has been limited by the challenges associated with observing and quantifying the dynamics of charged droplets near leaves at varying inclinations.
Previous studies have shown that electrostatic spraying significantly enhances deposition on abaxial (lower) leaf surfaces, achieving a two- to seven-fold increase compared with traditional non-electrostatic methods [9,10,11]. For example, in cotton-field trials, electrostatic aerial spraying resulted in a twofold increase in deposition on the adaxial (upper) surface and a threefold increase in deposition on the abaxial surface compared with an equal-volume uncharged spray [12]. Similarly, in trellised vineyards, electrostatic spraying achieved substantially higher deposition on abaxial surfaces, which are seldom reached with conventional spraying techniques [13]. These findings highlight the strong potential of electrostatic spraying for the precise and efficient application of agricultural chemicals [14,15].
Understanding the motion behavior of charged droplets is essential for optimizing electrostatic spraying systems. Because droplet motion is strongly influenced by the intensity of the electric field (E-field), numerous studies have investigated high-voltage charging schemes in electrostatic spray systems [16]. For instance, Kim et al. (2020) visualized droplet trajectories under corona charging conditions [17], and Liu et al. (2023) numerically analyzed the motion behavior of charged droplets [18]. Moreover, the design of electrostatic nozzles and innovations in this area play a critical role in determining droplet trajectories, particularly affecting parameters such as droplet velocity and kinetic energy [19,20]. Variations in nozzle aperture can produce droplets of different sizes, which in turn influences their drift behavior during flight [21,22].
Previous research has largely focused on simulations and overall deposition outcomes, rather than the local, time-resolved behavior of charged droplets near inclined leaves. This study addresses this critical gap by selecting three crop species with distinct leaf inclination angles—basil (Ocimum basilicum), cucumber (Cucumis sativus), and chili pepper (Capsicum annuum)—as experimental subjects. Using a high-speed imaging system combined with a neighborhood-matching algorithm and droplet-tracking technology, we 1. quantitatively analyzed the deposition distribution of charged droplets beneath leaves at different inclination angles; 2. characterized droplet trajectories near the leaf; 3. further analyzed the effect of droplet size on the deviation of motion trajectories. These findings provide theoretical and technical support for optimizing electrostatic spraying technology in precision agriculture.

2. Materials and Methods

2.1. Crops

This study selected three single-stem crops suitable for seasonal planting and exhibiting healthy growth—basil (Ocimum basilicum), cucumber (Cucumis sativus), and chili pepper (Capsicum annuum)—as experimental subjects. Three plants per species were used. Plants were grown in plastic pots (20 cm diameter × 18 cm height) filled with clay soil rich in organic matter. The experimental temperature was maintained at 12–18 °C. To avoid leaf overlap and ensure unobstructed high-speed imaging, a representative leaf with minimal occlusion was selected from each plant as the target leaf for droplet observation. Figure 1 shows the experimental crops.

2.2. Physical Parameters of Target Leaf

During the experiment, the target leaf was treated as a rigid body and leaf deformation was not considered. The angle between the main vein and the horizontal direction was used to approximate the angle between the leaf surface and the horizontal plane, hereinafter referred to as the leaf inclination angle [23,24]. The leaf inclination angles of basil, cucumber, and chili pepper were −10°, 30°, and 45°, respectively, with corresponding main vein lengths of 74.0 mm, 76.0 mm, and 72.0 mm. Figure 2 shows the imaging of these three target leaves in the camera field of view and their respective inclination angles. For clarity, it should be noted that under field conditions, leaves are flexible and can move in the wind, which may alter droplet trajectories. Therefore, the present results should be interpreted within the context of controlled laboratory conditions in which the leaves were treated as rigid.

2.3. Droplet-Capture System

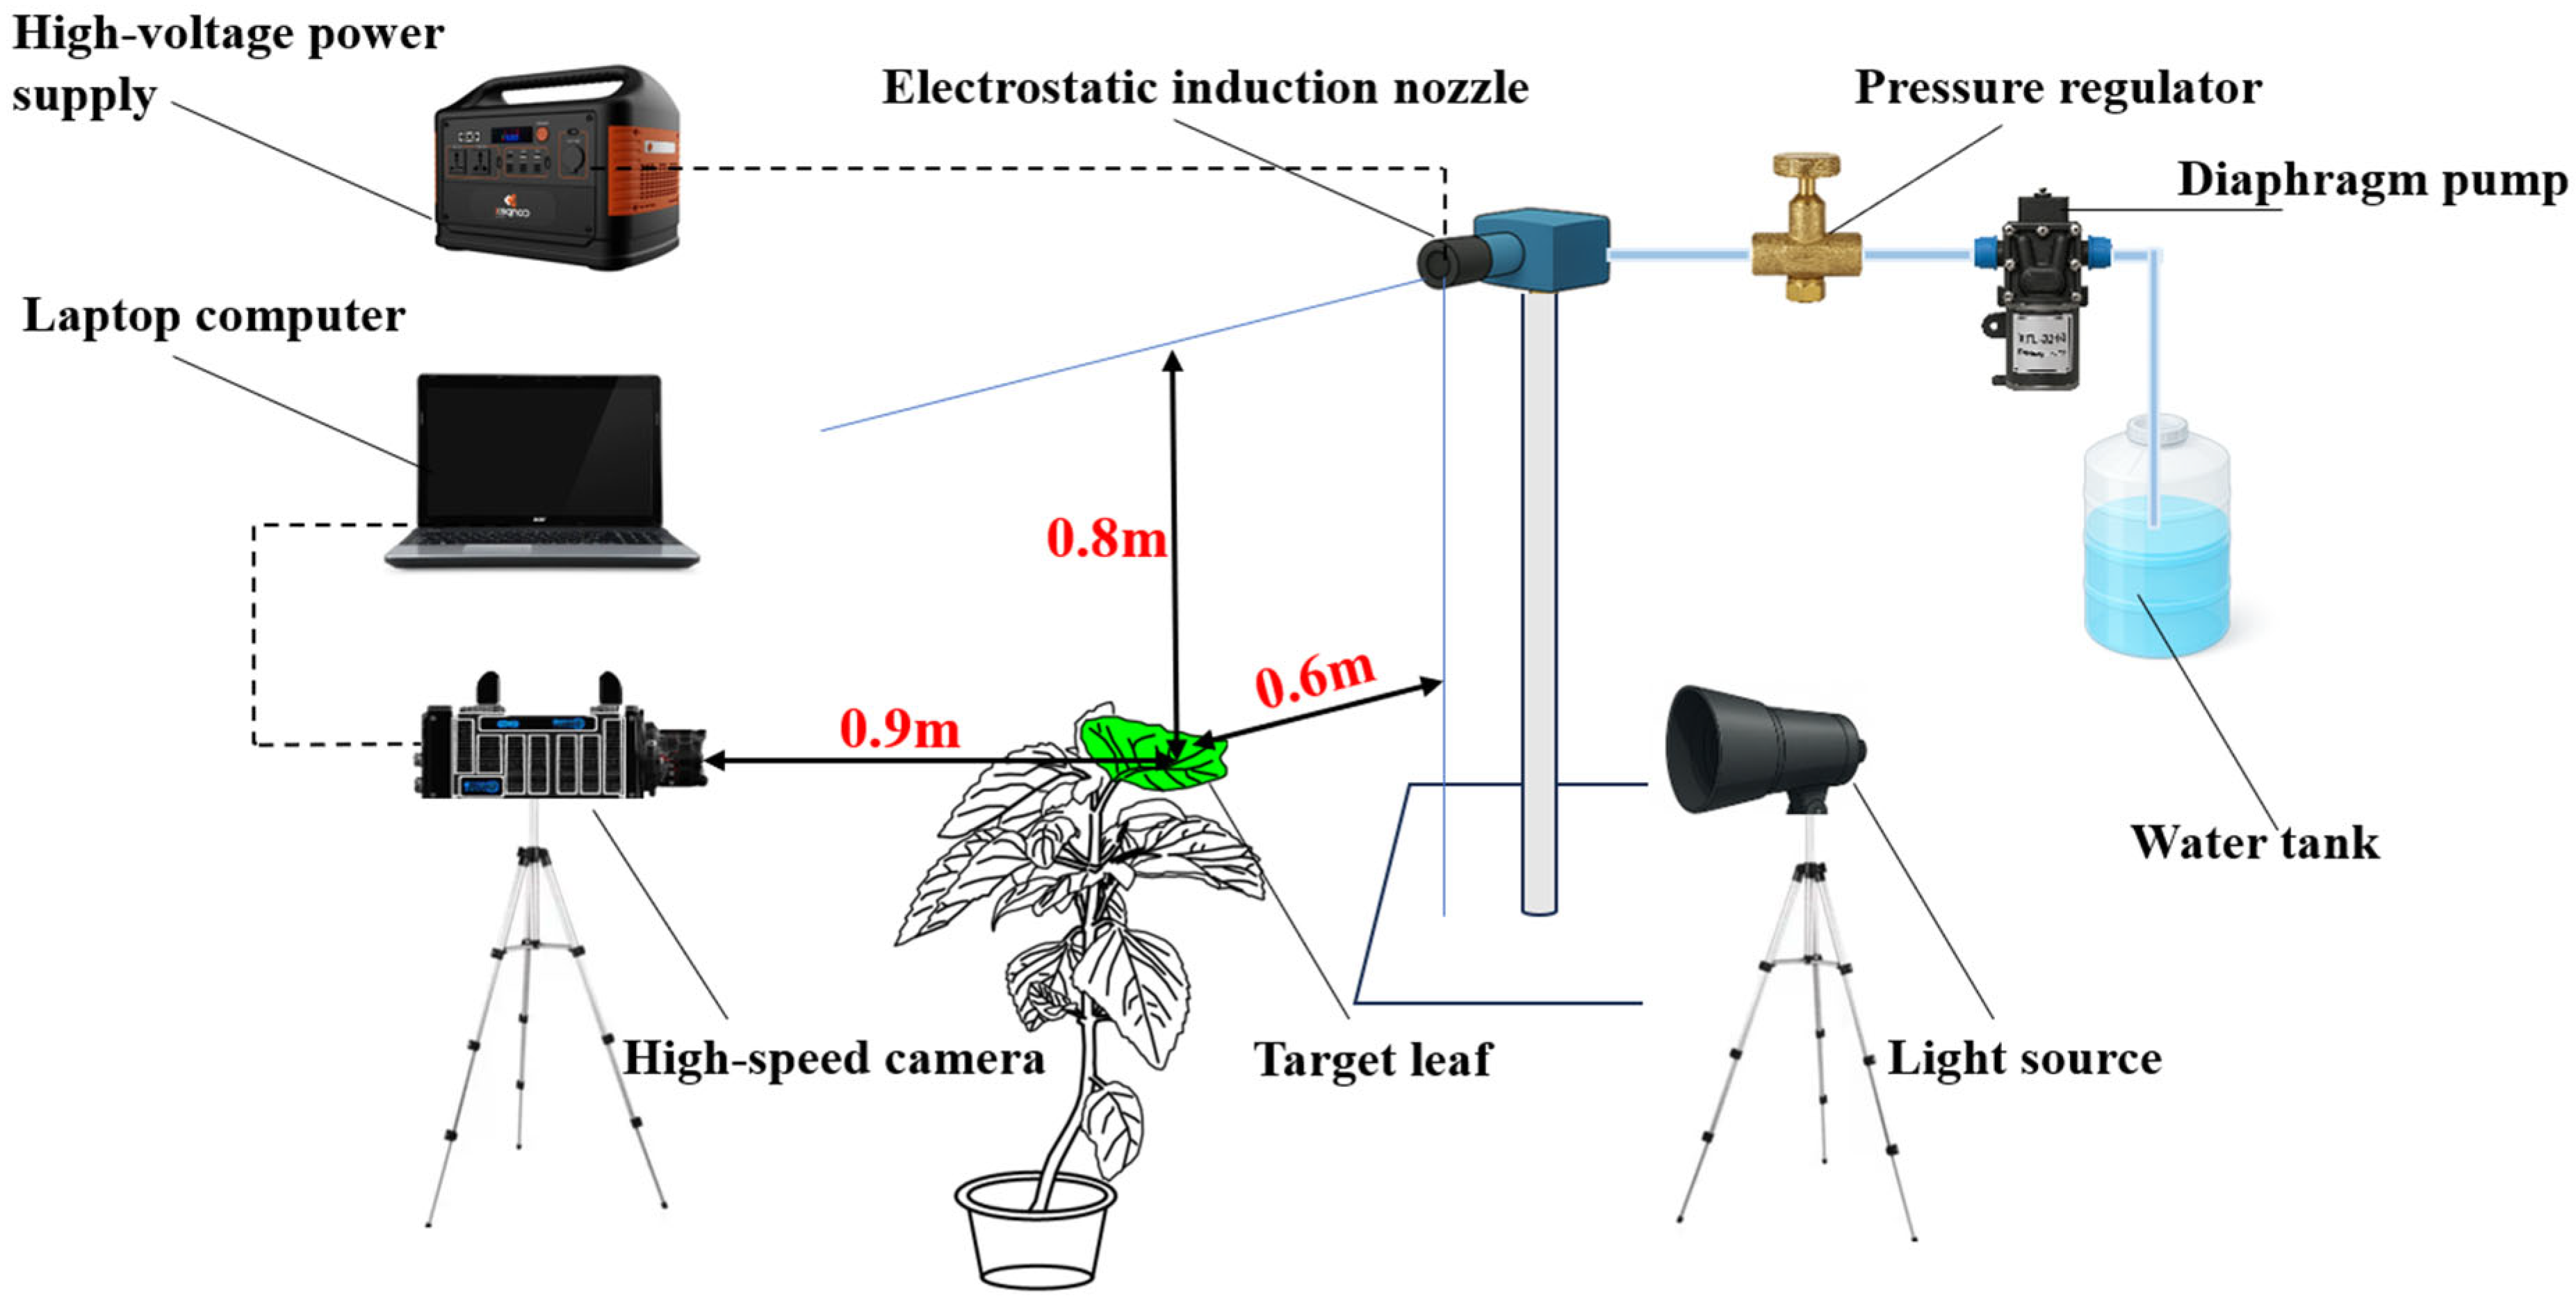
To capture droplet motion, a droplet-imaging system was established that consisted of an electrostatic spraying setup and an image-acquisition system. The specific experimental equipment and the corresponding models are listed in Table 1.
Considering the phenomenon of charge-decay in charged droplets [25] and their variation in horizontal velocity, the nozzle was mounted horizontally and the horizontal distance between the nozzle and the target leaf was set to 0.6 m. Because nozzle height influences droplet drift [26,27], the vertical distance between the nozzle and the target leaf was set to 0.8 m. The high-speed camera and target leaf were positioned on the same horizontal plane, with a lens-to-leaf distance of 0.9 m. For backlit imaging, the light source was placed opposite the camera to illuminate the target leaf and droplets. The relative arrangement of the experimental equipment is shown in Figure 3.
Nozzle flow rate and spray pressure are key factors influencing droplet uniformity [28,29]. In this study, the spray pressure was set to 0.5 MPa and the charging voltage to 10 kV. The high-voltage power supply was operated in positive-polarity mode. These parameter settings were determined based on preliminary experiments, which indicated that they yielded the highest charge-to-mass ratio for the droplets and optimal charging performance. For the control treatment, non-electrostatic conditions were obtained by switching off the high-voltage power supply to generate uncharged droplets. During all experiments, the ambient temperature was maintained at 25 °C, with wind speed at 0 m/s.

2.4. Calibration of the High-Speed Imaging System

The high-speed imaging system was used to investigate the motion behavior of charged droplets near the leaf. In this study, the high-speed camera was calibrated using the Zhang Zhengyou method [30]. Prior to calibration, droplet positions recorded by the camera were represented solely in the pixel coordinate system. After calibration, a geometric imaging model was established to relate pixel coordinates to the world coordinate system (Supplementary File S1: Coordinate conversion of the high-speed imaging system), thereby enabling determination of the true spatial positions of droplets. The root mean square (RMS) error of camera calibration in this experiment was 0.0326 mm, which corresponds to only 0.044% of the average main vein length (74 mm) and thus exerts a negligible effect on trajectory geometry and displacement measurements.

2.5. Statistical Method for Droplet Distribution on the Abaxial Leaf Surface

In this experiment, the relative positions of the high-speed camera, the designated target leaf, and the electrostatic nozzle were kept constant, and all other experimental settings were maintained consistently. Preliminary tests indicated that approximately 3 s after the diaphragm pump was activated, droplet motion toward the target leaf reached a quasi-steady state. However, during this steady phase, the high droplet density around the leaf impeded reliable discrimination and quantitative analysis of individual droplet trajectories. Therefore, to ensure the accuracy and representativeness of the quantitative results, we analyzed droplet distribution in the region beneath the abaxial (lower) side of the target leaf during the initial transient stage (0–3 s), prior to the establishment of the steady state.
The time at which a droplet first appeared in the image sequence was defined as the initial time point (frame 0, 0.00 s). Using a sampling interval of 1500 frames, frames 0, 1500, 3000, and 4500 (corresponding to 0.00, 0.75, 1.50, and 2.25 s) were selected as representative frames to characterize four typical stages of droplet motion toward the target leaf.
A fixed region of interest (ROI) was delineated beneath the abaxial (lower) side of the target leaf for droplet-count statistics. Through recording of droplet counts at successive time points as droplets traversed this ROI, the cumulative accumulation beneath the abaxial side was estimated. This approach enabled a direct comparison of droplet distributions in the abaxial region under electrostatic and non-electrostatic spraying conditions.
Droplet-distribution images were processed semi-automatically using ImageJ (v1.8.0) [31,32]. For each image, a region of interest (ROI) was defined to exclude the background, and the image was converted to eight-bit grayscale. A global threshold was applied to binarize the image, with the threshold level manually adjusted within ±3% to account for minor variations in image brightness. Droplet counts within the ROI were then quantified using ImageJ’s (v1.8.0) Analyze Particles routine. The resulting data were exported to Microsoft Excel for curation and subsequent statistical analysis.

2.6. Selection and Characterization of Trackable Charged Droplets

2.6.1. Matching, Selection, and Labeling of Trackable Charged Droplets

Analyzing the deposition behavior of a single charged droplet was challenging because each droplet’s position changed only slightly between consecutive frames. To address this, a neighborhood-matching method was applied to the acquired images to identify trackable charged droplets, which were subsequently tracked and analyzed. Trackable charged droplets were selected from those appearing in the camera’s field of view during the initial transient stage (0–3 s) after the diaphragm pump had been activated. To ensure analytical reliability, trackable droplets were required to meet the following criteria: (1) they remained within the camera’s field of view throughout the entire observation period; (2) their motion trajectories were continuously clear and recognizable; (3) the number of neighboring droplets was minimal; and (4) the trajectory exhibited independence and did not interfere with other droplets. A charged droplet that could be consistently followed across 50 consecutive frames was considered trackable and retained for subsequent analysis of deposition behavior. The area surrounding the target leaf was divided into three regions—upper, middle, and lower. In each region, three charged droplets meeting the predefined criteria were initially selected, and among these, the droplet that best satisfied the selection conditions was chosen for subsequent trajectory tracking.
After selection of the trackable charged droplets, the recorded image sequence was reviewed frame by frame; the corresponding droplets were manually annotated in each frame. Trajectories were then extracted by matching and tracking droplets across consecutive frames. For each type of target leaf, three trackable charged droplets were selected for analysis. In the first neighborhood frame (i = 1), the three matched droplets were labeled A1, B1, and C1, ordered from left to right and then from top to bottom. In subsequent neighborhood frames, the corresponding matched droplets were labeled Ai, Bi, and Ci, where i denotes the index of the neighborhood frame.

2.6.2. Acquisition of Position Information for Trackable Charged Droplets

Through image acquisition and the tracking and matching of charged droplets, their positional information within the image frames was obtained. Because charged droplets in the captured images do not appear as single convergent coordinate points, their centroid positions were used to represent their coordinates. During the droplet-selection process, droplets that did not meet the predefined criteria—such as those with blurred contours, irregular morphologies, or pixel clustering—were excluded to minimize potential sources of error. The centroid of each droplet was determined using the first-order-moment method. Let the acquired image have dimensions of m   × n , and denote the tracked droplet as i. The number of pixels corresponding to droplet i at displacement x is denoted as A i x and that at displacement y as A i y . For discrete digital images, the centroid coordinates of droplet i were calculated using Equations (1) and (2) [33], as follows:
x i = 1 m n x   = 1 m y   = 1 n x A i x
y i = 1 m n x = 1 m y = 1 n y A i y
In the equation, m and n represent the pixel width and height of the entire image, respectively; x i , y i denote the centroid coordinates of droplet i within the image.
The acquired images had a resolution of 1280 × 1040 pixels. A two-dimensional coordinate system was established by taking the top-left pixel of the image, with coordinates (0, 0), as the origin. The pixel coordinates of the matched charged-droplet centroids were used to represent the instantaneous positions of the droplets within the image.

2.6.3. Calculation of Two-Dimensional Velocity of Trackable Charged Droplets

After the coordinates of a charged droplet in consecutive neighborhood frames had been obtained, its mean velocities in the horizontal and vertical directions were computed from interframe differences in position. Let ( x i j , y i j ) denote the real-world coordinates of droplet i in frame j. The average velocities of the droplet in the horizontal ( v ¯ i x , v ¯ i y ) directions could then be calculated using Equations (3) and (4), as follows:
v ¯ i x = x i n x i l ( n l ) t
v ¯ i y = y i n y i l ( n l ) t
In the equation, t represents the time interval between two consecutive image frames (in seconds); v ¯ i x , v ¯ i y denote the average velocities of droplet i in the horizontal and vertical directions, respectively, at frame n (in mm/s); n is the frame number at the end of sampling; and l is the frame number at the beginning of sampling (Supplementary File S2: Calculation Example).

2.6.4. Determination of Trajectory Deflection Angle

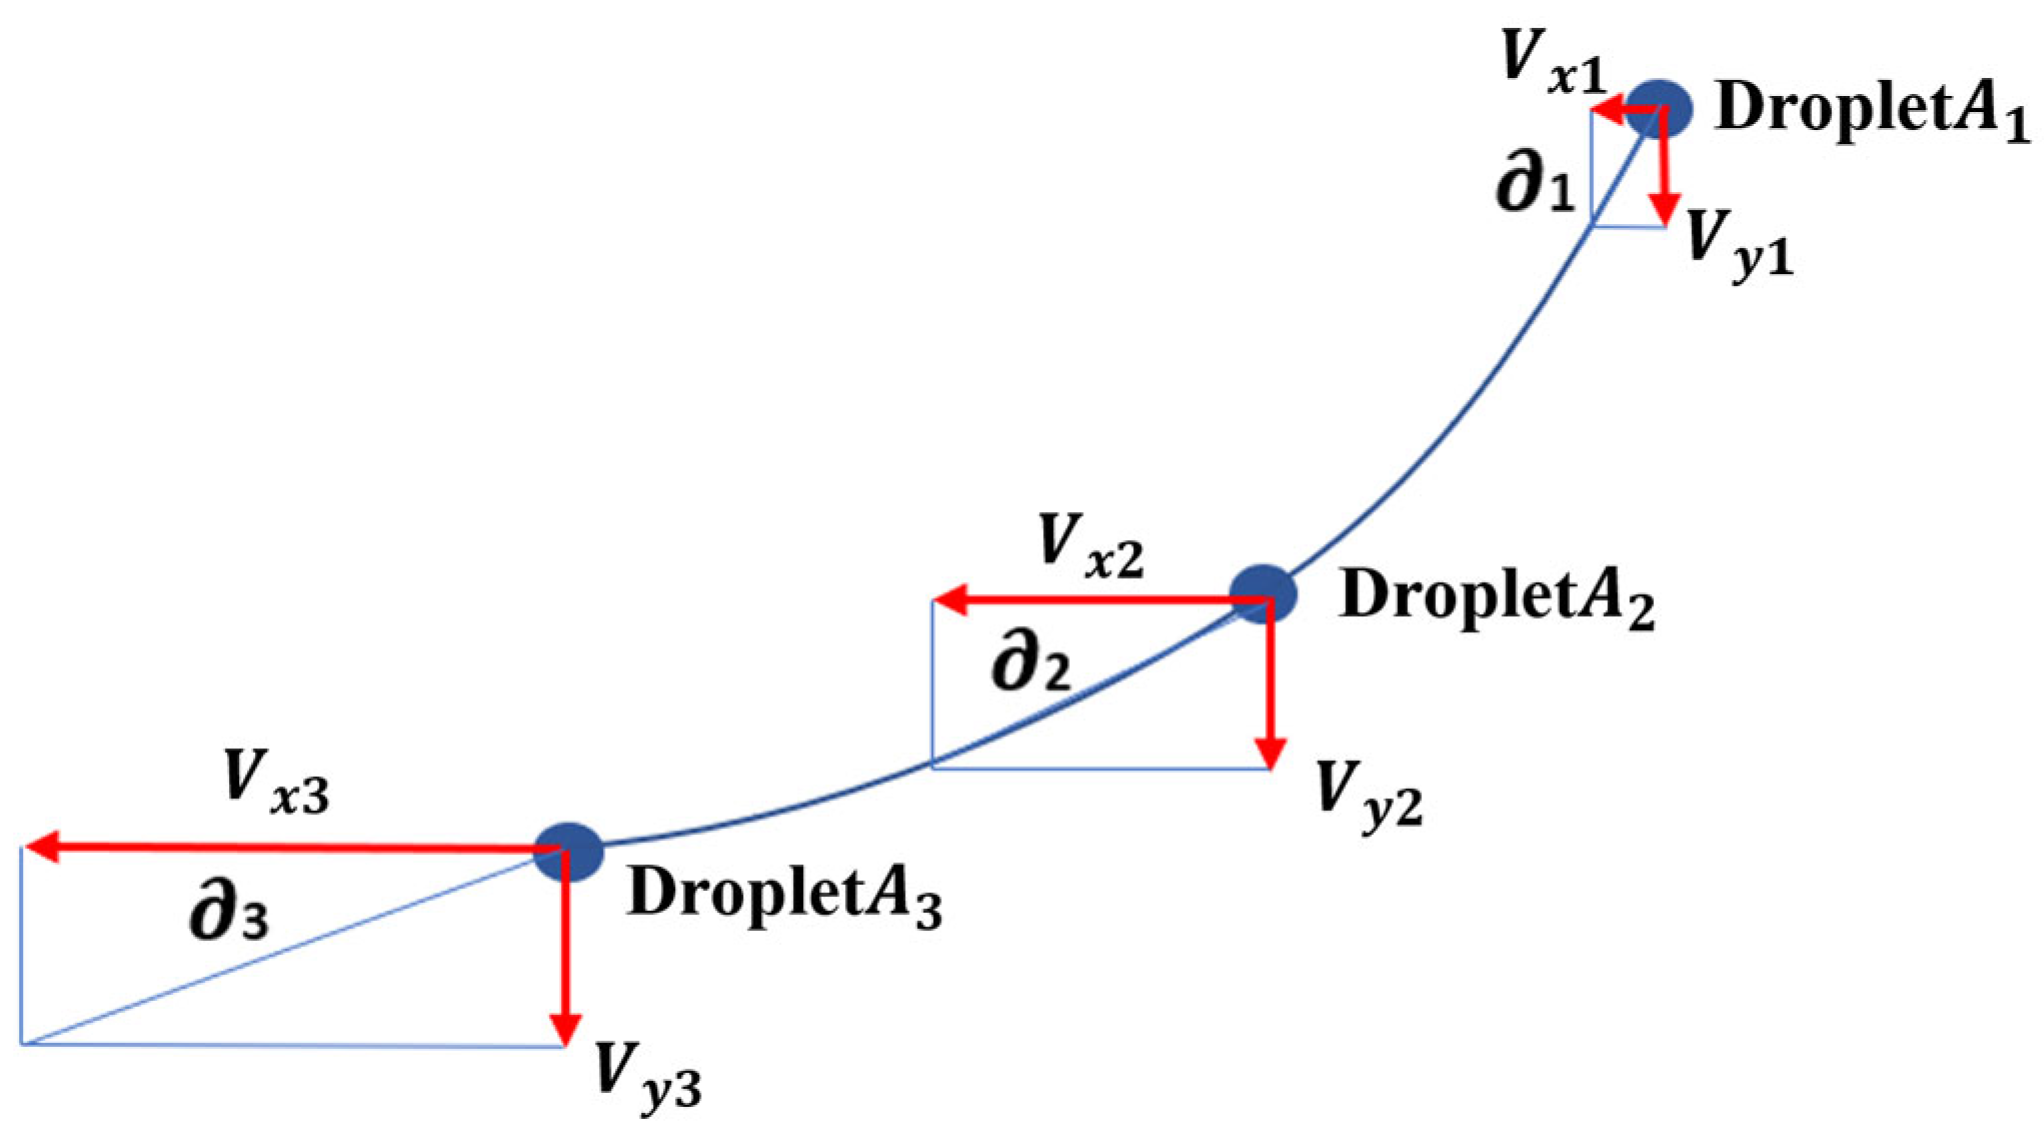
After the average horizontal and vertical velocities of the trackable droplets had been obtained, their deflection angles were calculated. Figure 4 illustrates the schematic representation of droplet motion. For a given charged droplet, the instantaneous velocities in the horizontal and vertical directions in the i-th neighborhood are denoted as v x i and v y i , respectively. The velocity deflection angle in the i-th neighborhood was then calculated as in Equation (5):
i = a r c t a n v y i v x i

3. Results and Discussion

3.1. Droplet-Cluster Distribution on the Abaxial Leaf Surface

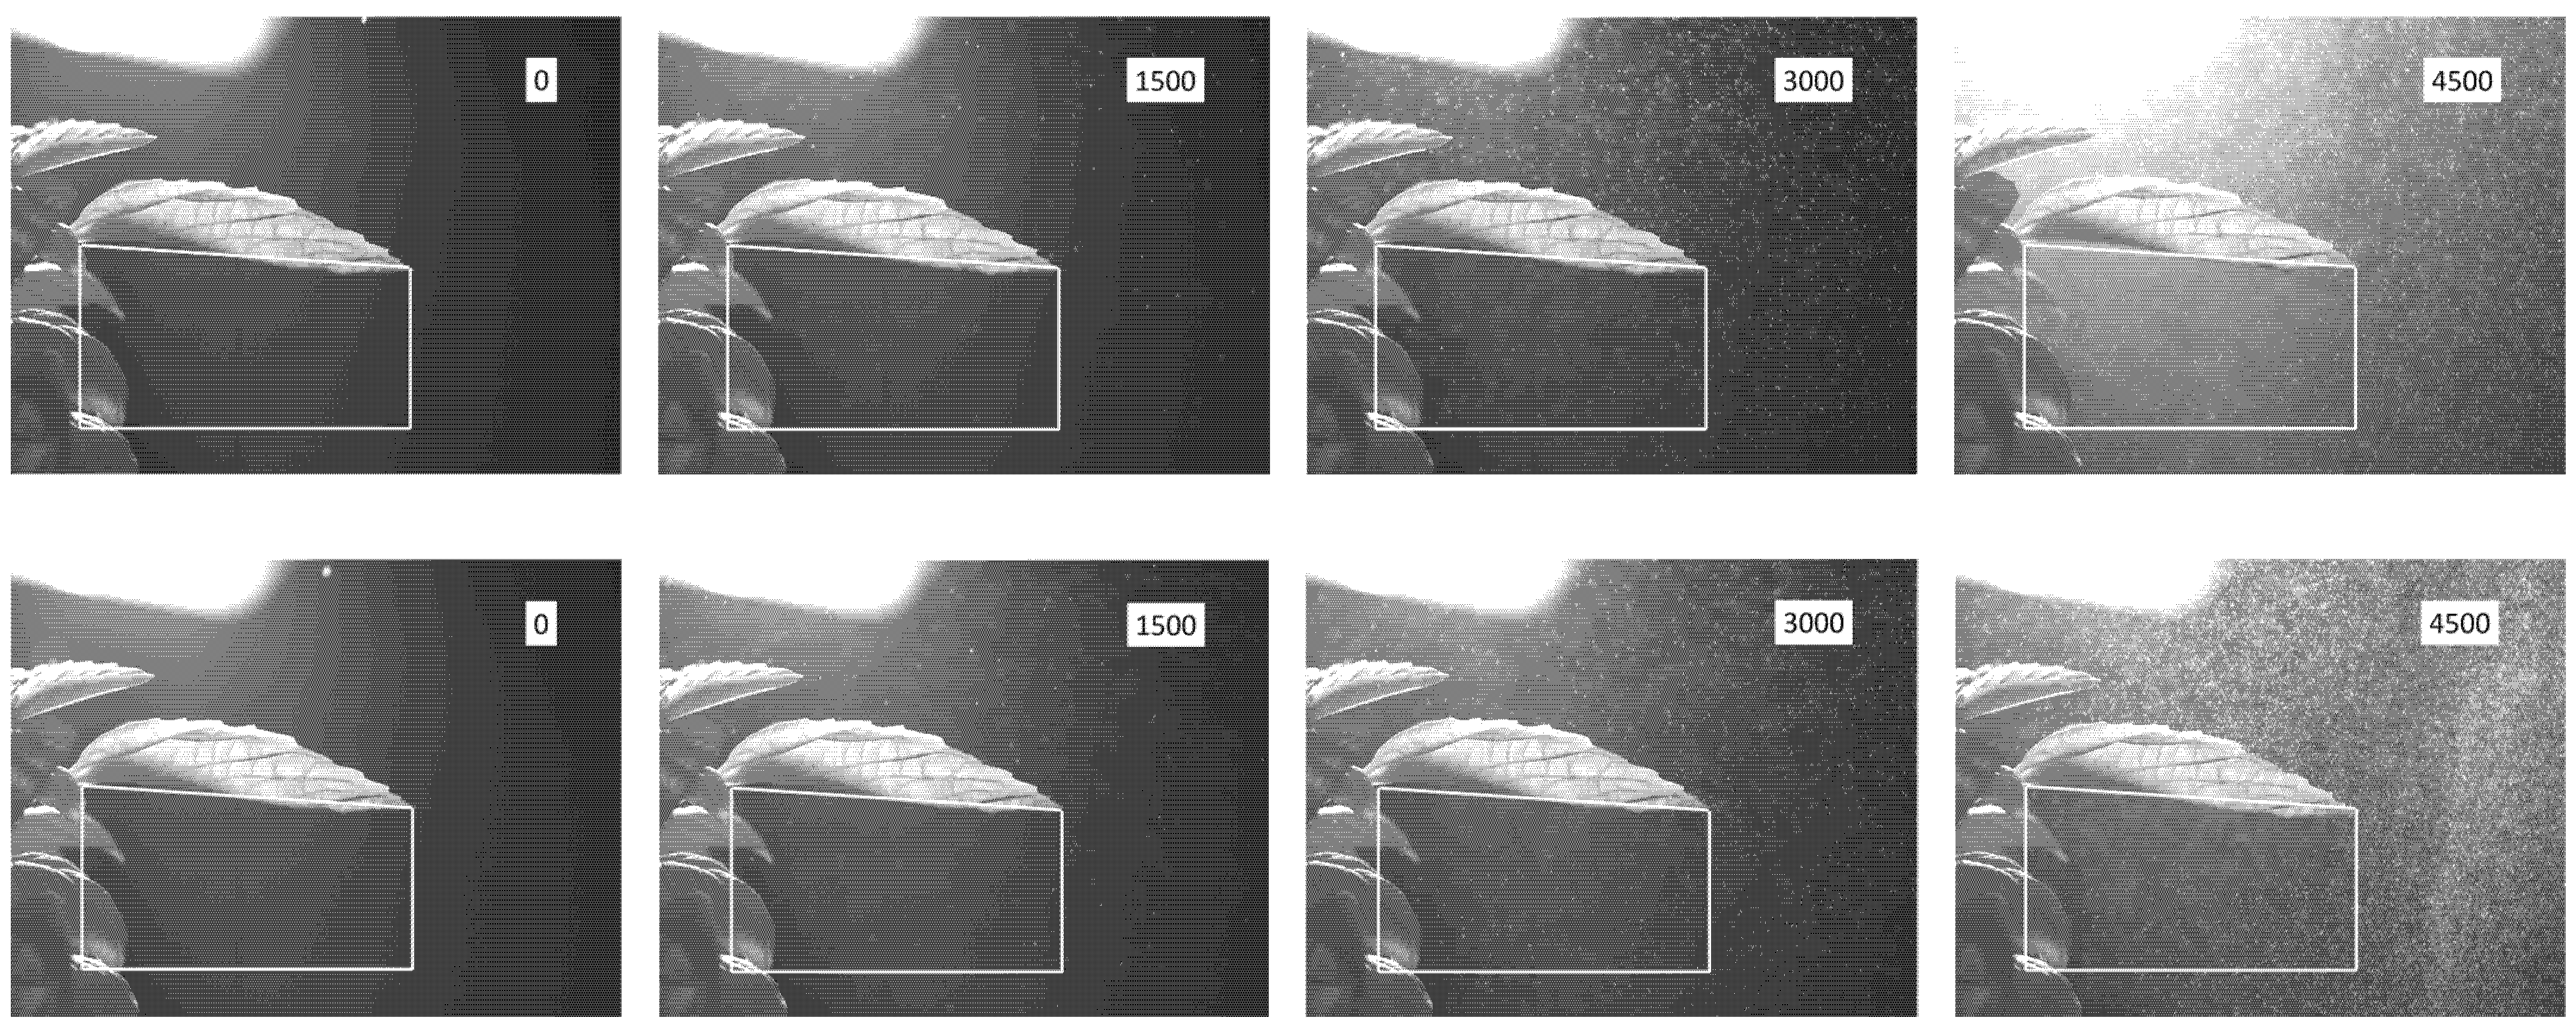
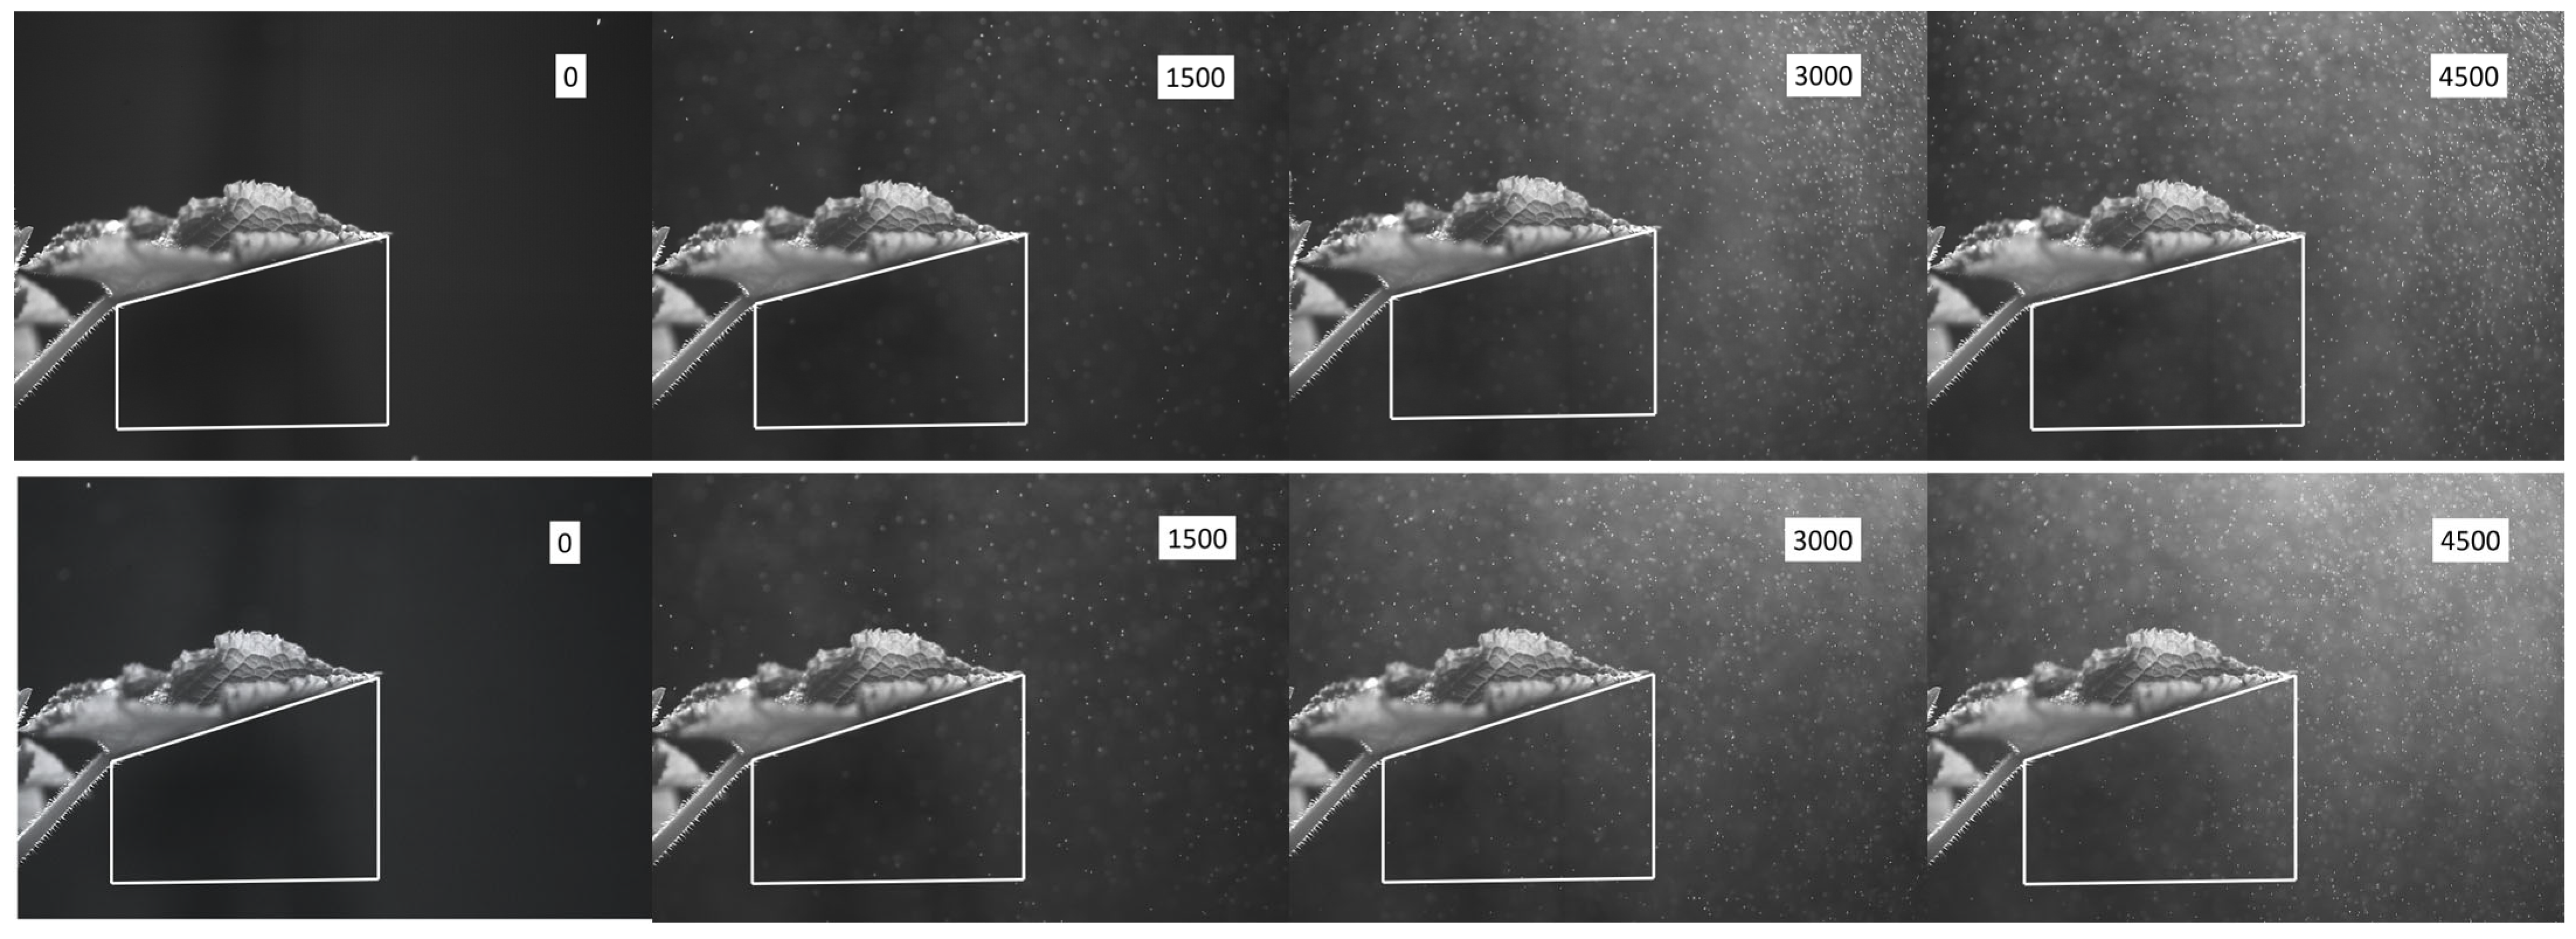
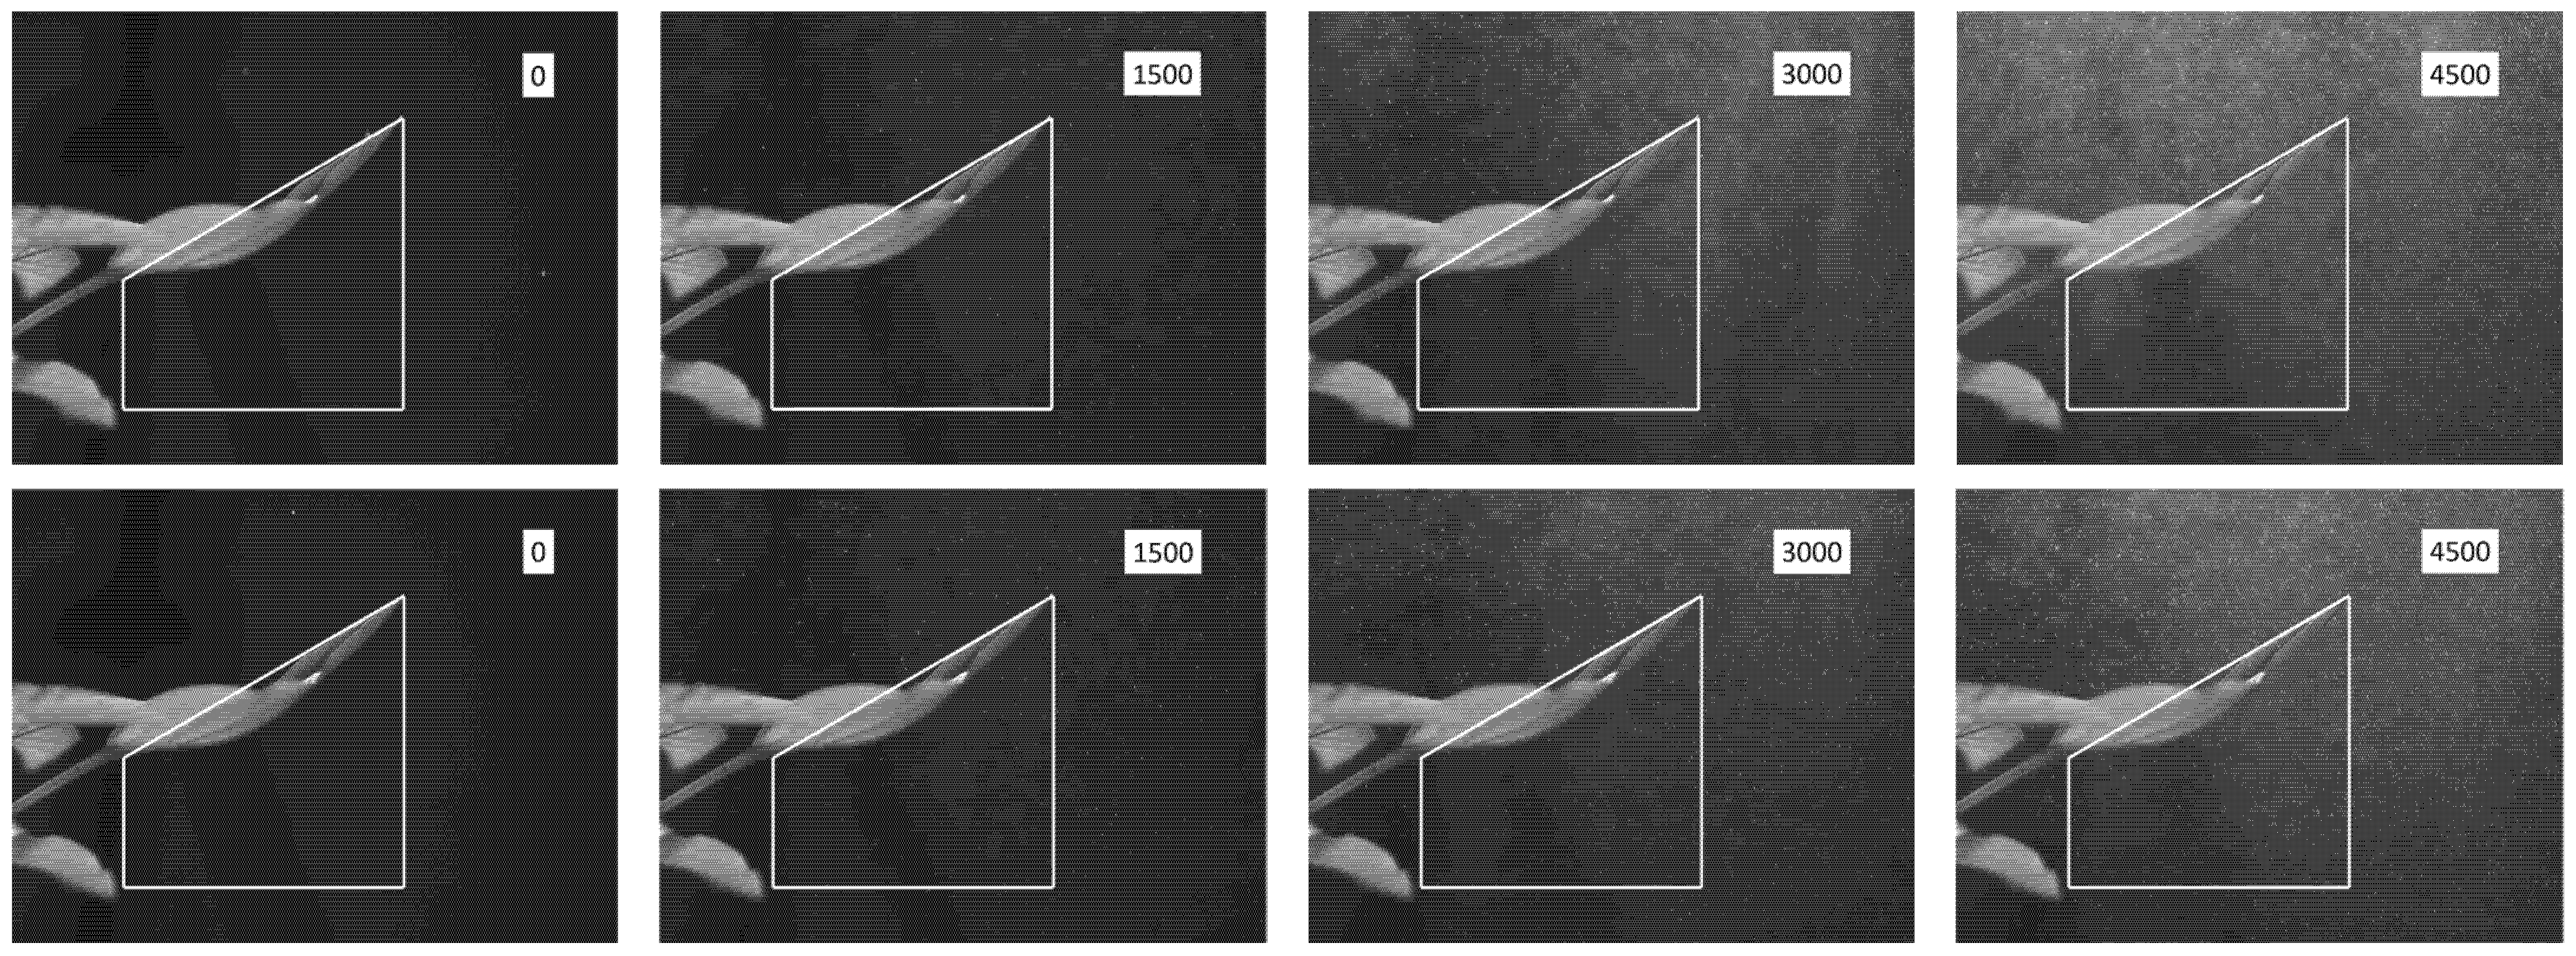
The image-acquisition results for droplet deposition beneath the abaxial side of the leaf at different time points for different target leaves are shown in Figure 5, Figure 6 and Figure 7 (Top row: non-electrostatic spraying. Bottom row: electrostatic spraying).
As shown in Figure 5, Figure 6 and Figure 7, at frame 0 (0.00 s), no droplets were observed within the region beneath the abaxial (lower) side of the leaf under either non-electrostatic (NES) or electrostatic spraying (ES) conditions. By frame 1500 (0.75 s), a small number of droplets had appeared, and after frame 3000 (1.50 s), droplet counts had increased markedly. This pattern indicates progressive accumulation over time, reflecting the 0–3 s transient period following start-up of the diaphragm pump during image acquisition. Comparative analysis showed that at frame 3000 (1.50 s), droplet counts were significantly higher under ES than under NES, indicating that the electrostatic effect substantially enhances deposition beneath the abaxial side of the leaf.
A statistical analysis was conducted on the number of droplets within a fixed region beneath the abaxial side of the leaves, as shown in Figure 5, Figure 6 and Figure 7. This enabled comparison of droplet distribution in the same region at different time points across the three types of target leaves. The results indicate that, for the selected basil, cucumber, and pepper leaves, electrostatic spraying consistently increased the number of droplets within the corresponding region beneath the abaxial side at each stage of the deposition process.
This phenomenon can be attributed to the combined effects of electrostatic attraction and gravity on charged droplets during deposition [4]. As a droplet approaches the target leaf, these forces deflect its trajectory toward the leaf, promoting deposition. Even when a droplet does not initially deposit on the adaxial (upper) side, the deflection brings it closer to the leaf; at short range, the electrostatic force continues to act, further guiding migration toward the abaxial (lower) side and substantially increasing the probability of attachment to the leaf.
Figure 8 illustrates the temporal variation in the number of droplets within the region of interest beneath the abaxial sides of the three target leaves. The number of charged droplets deposited on the target leaves was analyzed using a generalized linear mixed-effects model (GLMM) with a Poisson distribution, treating species as a fixed effect and plant as a random effect to account for variability among plants. Pairwise comparisons among species were performed using Tukey’s HSD post hoc test (α = 0.05). All statistical analyses were conducted using IBM SPSS Statistics, version 29.0 (IBM Corp., Armonk, NY, USA). At frame 4500 (2.25 s), when droplet movement toward the leaf approached a steady state, electrostatic spraying, compared to non-electrostatic spraying, resulted in significant increases in droplet counts in the region of interest beneath the leaf: a 112% increase for basil (leaf inclination angle: −10°), a 132% increase for cucumber (30°), and a 213% increase for pepper (45°). These results confirm that under electrostatic forces, charged droplet clusters are more likely to be deflected toward and deposited in the region beneath the abaxial side of the leaf.
Due to the differing inclination angles of the three target leaves, leaf orientation was observed to influence the movement of droplets toward the region beneath the abaxial side. The results indicated that the greater the upward angle of the leaf, the more easily charged droplets, after falling vertically from above, moved toward the lower portion of the abaxial side and were further deflected into the middle and lower parts of the canopy.
In naturally grown crops, leaf posture is random and cannot be controlled manually. Consequently, in practical plant-protection operations, adjusting leaf orientation to improve droplet deposition is not feasible. Nevertheless, optimizing the spray angle can enhance droplet deposition on the plant surface, thereby improving application efficiency. It should be noted that the results presented here were obtained under controlled experimental conditions; in field settings, environmental factors such as wind and leaf movement may further influence droplet deposition [34].

3.2. Near-Leaf Trajectories of Trackable Charged Droplets

Using a 50-frame neighborhood interval, the pixel coordinates of the trackable charged droplets were labeled. The results are shown in Figure 9, Figure 10, and Figure 11, respectively.
Based on the pixel coordinates of charged droplets at four representative moments as they approached the target leaf, spline curves were used to fit their motion trajectories, and the resulting droplet paths are shown in Figure 12. The trajectories of charged droplets exhibit clear directional changes: as they descend, they gradually deflect from vertical and move toward the abaxial side of the leaves and the middle and lower parts of the crop canopy, reflecting the directional migration induced by the electric field.
In contrast, when the high-voltage power supply was set to 0 kV, while all other operating parameters remained the same as in the electrostatic spraying tests, droplets behaved as inertia-drag-dominated particles without coulomb forces. High-speed imaging at 2000 fps revealed that these droplets followed predominantly straight trajectories along the nozzle–leaf centerline, with only minor random deviations due to local airflow. Under non-electrostatic spraying, droplets were governed solely by gravity and aerodynamic drag, following parabolic or airflow-perturbed paths, and did not actively converge toward the leaf in the absence of an electric field [35].
Based on the coordinates of trackable droplets listed in Table 2, the horizontal displacement of individual droplets can be analyzed. An analysis of the spatial relationship between the charged droplets and the basil leaf showed the following. Droplet A was closer to the leaf in neighborhood frames 2 and 3; in the subsequent neighborhood frame, it shifted 50 pixels horizontally. Droplet B was closer in neighborhood frame 1; in the next neighborhood frame, it shifted 208 pixels horizontally. Droplet C was also closer in neighborhood frame 1; in the following neighborhood frame, its horizontal displacement was 130 pixels.
An analysis of the spatial relationship between the charged droplets and the cucumber leaf showed the following. Droplet A was closer to the leaf in neighborhood frames 2 and 3; in the subsequent neighborhood frame, it shifted 80 pixels horizontally. Droplet B was closer in neighborhood frames 1 and 2; in the next neighborhood frame, it shifted 79 pixels horizontally. Droplet C was closer in neighborhood frame 1; in the following neighborhood frame, its horizontal displacement was 31 pixels.
An analysis of the spatial relationship between the charged droplets and the chili pepper leaf showed the following. Droplet A was closer to the leaf in neighborhood frames 2 and 3; in the subsequent neighborhood frame, it shifted 77 pixels horizontally. Droplet B was also closer in neighborhood frames 2 and 3; in the next neighborhood frame, it shifted 47 pixels horizontally. Droplet C was closer in neighborhood frame 1; in the following neighborhood frame, its horizontal displacement was 52 pixels.
Based on pixel-coordinate and relative-position analyses of nine charged droplets over time, droplets closer to the target leaf exhibited greater horizontal displacement in the subsequent neighborhood frame. This behavior can be attributed to stronger short-range electrostatic attraction, which induces larger horizontal motion over the same time interval. However, this pattern does not fully explain the behavior of droplet C near the cucumber leaves. Given its relative position at the time of selection, droplet C was likely farther from the leaf, resulting in weaker electrostatic attraction. Consequently, gravity became the dominant force, leading to a progressive decrease in trajectory deflection.

3.3. Velocity and Deflection of Trackable Charged Droplets near the Leaf Surface

Compared with basil and cucumber leaves, pepper leaves exhibit a more expanded and open morphology. Previous studies have indicated that surface undulations of plant leaves can alter the surrounding electric-field distribution [36]. To minimize the influence of leaf structural features on droplet motion velocity, a new pepper leaf was selected for this experiment. This leaf had a primary vein length of 72.0 mm and a leaf inclination angle of −50°. The positions of the trackable charged droplets near the leaf surface in four consecutive neighborhood frames are shown in Figure 13.
Through matching and tracking of the trackable charged droplets, their pixel coordinates near the chili pepper leaf were obtained at multiple time points across neighborhood frames. Using the camera calibration, these pixel coordinates were transformed into spatial coordinates in the world frame. After each droplet’s position had been determined in the world frame, its motion behavior was further analyzed. The two-dimensional world-frame coordinates of the charged droplets at the sampled time points are presented in Table 3.
Based on the world-frame coordinate positions of the charged droplets in Table 3 and Equations (3) and (4), the average velocities of the droplets in different neighborhoods as they approached the pepper leaf were calculated. The results, expressed in mm/s, are presented in Table 4.
To analyze the variations in the velocities of individual charged droplets, the horizontal and vertical velocities of single droplets were examined, as shown in Table 4. These velocities exhibit only slight variations across different neighborhoods. This behavior can be attributed to the fact that droplet motion near the target leaf is primarily governed by the combined actions of electrostatic force and gravity [37]. Around the same target leaf, both the space-induced electric field and the gravitational field remain essentially stable. Moreover, within the observation time range, the charge and mass of a single droplet do not change significantly, resulting in relatively constant electrostatic and gravitational forces. Under these consistent force conditions, individual droplets display relatively stable velocities across neighborhood stages. Small fluctuations in velocity observed for a given droplet reflect minor variations in local airflow and interactions with neighboring droplets.
When approaching the same target leaf, different charged droplets exhibited variations in their average horizontal and vertical velocities. For the chili pepper leaf, the overall average velocities of the representative charged droplets are summarized in Table 5. As shown, droplet A exhibited relatively higher velocities in both directions compared to the other droplets.
In the collected images, charged droplets typically appear as irregular shapes composed of pixel clusters. To characterize droplet size, the number of pixels occupied by each droplet was used as a measurement index. First, the original images were binarized such that droplets appeared white and the background black, with droplet pixels assigned a value of 0 and background pixels a value of 1. The image regions containing the target droplets were then extracted, and the number of pixels occupied by each droplet was calculated using OpenCV (v4.7). In this study, the projected areas of droplets in back-illuminated images were measured via pixel counts and converted to equivalent diameters using a geometric calibration (µm per pixel) determined by imaging a calibration reticle. This image-based sizing technique has been widely applied in droplet and spray studies and has been validated against phase-Doppler and interferometric methods within its resolvable size range [38]. The results of this analysis are presented in Table 6.
As shown in Table 4, the mean velocities of the charged droplets were obtained across successive neighborhood frames. The deflection angle for each neighborhood was then calculated using Equation (5). For the droplets approaching the pepper leaf, the velocity deflection angles in three neighborhoods are listed in Table 7.
As is shown in Table 5, Table 6 and Table 7, for three trackable droplets, the average velocity deflection angles of the three neighborhoods are as follows: Droplet B (7.5988°) > Droplet C (6.7055°) > Droplet A (6.4605°); the relative sizes of the droplets, as estimated from pixel count, followed the order Droplet B > Droplet C > Droplet A. These results indicate that smaller charged droplets tend to exhibit smaller mean deflection angles, reflecting a stronger tendency to move directly toward the target leaf.
Our results demonstrate that the size of a the size of charged dropletshas a significant influence on motion dynamics, with smaller charged droplets exhibiting more pronounced variations in velocity during flight. These fine charged droplets are more readily affected by electrostatic forces and airflow, which enhances their ability to effectively reach leaf surfaces. This observation has practical implications for optimizing spray applications: reducing the size of charged droplets can improve deposition efficiency, particularly on complex or inclined leaf surfaces. In the context of electrostatic spraying, this suggests that nozzle design and operating parameters should be adjusted to produce finer charged droplets. For instance, enhancing nozzle atomization or modifying operating pressures can generate smaller charged droplets that respond more effectively to the electrostatic field, thereby promoting more uniform coverage of target leaves.

4. Conclusions

Within the broader context of research on electrostatic spraying, previous studies by Kim et al. (2020) [17] and Liu et al. (2023) [18] primarily focused on numerical simulations of charged droplets and macroscopic deposition patterns. In the present study, we employed a high-resolution, high-speed imaging system to quantitatively analyze the distribution of charged droplets beneath the abaxial regions of basil, cucumber, and chili pepper leaves. By integrating a neighborhood-matching algorithm with trajectory tracking for charged droplets, we systematically characterized both the deposition patterns and dynamic behavior of charged droplets in the vicinity of crop foliage under electrostatic spraying. The results indicate that (1) electrostatic spraying significantly enhances deposition of charged droplets on abaxial surfaces, with the effect being more pronounced for highly inclined leaves, thereby improving coverage of concealed leaf regions and lower canopy layers; and (2) smaller charged droplets are more susceptible to electrostatic forces, exhibiting greater deflection and a stronger tendency to migrate toward leaf surfaces. Collectively, these findings highlight the potential of electrostatic effects to improve spray efficiency and promote targeted deposition in otherwise difficult-to-reach foliage areas.
From the perspective of agricultural applications, these findings provide practical guidance for optimizing techniques for crop-protection spraying. First, the selection of appropriate spray angles and nozzle types by taking into account leaf inclination and spatial distribution can enhance coverage of charged droplets on abaxial leaf surfaces and within the canopy, thereby improving the control of pests and diseases on leaf undersides and within inner-canopy layers. Second, the results highlight the advantages of deploying smaller charged droplets in electrostatic spraying, suggesting that future nozzle design and optimization of spray parameters should prioritize finer atomization to achieve higher pesticide-use efficiency while reducing environmental impact. Collectively, these findings offer direct guidance for advancing the application of electrostatic spraying in precision crop protection and sustainable agriculture.
It is important to acknowledge certain limitations of the present study. First, the experiments were conducted under highly controlled conditions—including constant temperature, absence of airflow, fixed nozzle parameters, and rigid leaf surfaces—which may not fully represent the complex and variable conditions encountered in the field. Second, the investigation primarily focused on the characterization and analysis of the physical behavior of charged droplets, without directly assessing their biological efficacy. Future studies should extend to multifactorial field experiments that incorporate environmental variability and evaluate the effectiveness of pest and disease control, thereby providing a more comprehensive assessment of the practical applicability of electrostatic spraying.

Supplementary Materials

The following supporting information can be downloaded at: https://www.mdpi.com/article/10.3390/horticulturae11091117/s1, Table S1: The calibration results of the camera; File S1: Coordinate conversion of high-speed imaging system; File S2: Calculation example.

Author Contributions

Conceptualization, X.D. and B.Q.; Methodology, X.D. and L.D.; Software, S.W.; Formal analysis, S.W., K.W. and L.D.; Investigation, T.W.; Resources, L.D. and B.Q.; Data curation, K.W.; Writing—original draft, T.W.; Writing—review & editing, X.D.; Visualization, J.M.; Supervision, J.M.; Project administration, B.Q.; Funding acquisition, X.D. All authors have read and agreed to the published version of the manuscript.

Funding

The present study was supported by grants from the Project Funded by the Priority Academic Program Development of Jiangsu Higher Education Institutions (No. PAPD2023-87), the National Key Research and Development Plan (No. 31971790), and the Key Research and Development Program of Jiangsu Province (No. BE2020328).

Data Availability Statement

The raw data supporting the conclusions of this article will be made available by the authors on request.

Conflicts of Interest

The authors declare no conflicts of interest.

References

  1. Law, S.E. Electrostatic Pesticide Spraying: Concepts and Practice. IEEE Trans. Ind. Appl. 1983, IA-19, 160–168. [Google Scholar] [CrossRef]
  2. Law, S.E. Agricultural Electrostatic Spray Application: A Review of Significant Research and Development during the 20th Century. J. Electrost. 2001, 51, 25–42. [Google Scholar] [CrossRef]
  3. Gossen, B.D.; Peng, G.; Wolf, T.M.; McDonald, M.R. Improving Spray Retention to Enhance the Efficacy of Foliar-Applied Disease- and Pest-Management Products in Field and Row Crops. Can. J. Plant Pathol. 2008, 30, 505–516. [Google Scholar] [CrossRef]
  4. Zhou, H.; Ou, M.; Dong, X.; Zhou, W.; Dai, S.; Jia, W. Spraying Performance and Deposition Characteristics of an Improved Air-Assisted Nozzle with Induction Charging. Front. Plant Sci. 2024, 15, 1309088. [Google Scholar] [CrossRef]
  5. Sánchez-Hermosilla, J.; Pérez-Alonso, J.; Martínez-Carricondo, P.; Carvajal-Ramírez, F.; Agüera-Vega, F. Evaluation of Electrostatic Spraying Equipment in a Greenhouse Pepper Crop. Horticulturae 2022, 8, 541. [Google Scholar] [CrossRef]
  6. Giles, D.; Blewett, T. Effects of Conventional and Reduced-Volume, Charged-Spray Application Techniques on Dislodgeable Foliar Residue of Captan on Strawberries. J. Agric. Food Chem. 1991, 39, 1646–1651. [Google Scholar] [CrossRef]
  7. Zhao, S.; Castle, G.S.P.; Adamiak, K. Factors Affecting Deposition in Electrostatic Pesticide Spraying. J. Electrost. 2008, 66, 594–601. [Google Scholar] [CrossRef]
  8. Appah, S.; Wang, P.; Ou, M.; Gong, C.; Jia, W. Review of Electrostatic System Parameters, Charged Droplets Characteristics and Substrate Impact Behavior from Pesticides Spraying. Int. J. Agric. Biol. Eng. 2019, 12, 1–9. [Google Scholar] [CrossRef]
  9. Almekinders, H.; Ozkan, H.E.; Reichard, D.L.; Carpenter, T.G.; Brazee, R.D. Deposition Efficiency of Air-Assisted, Charged Sprays in a Wind Tunnel. Trans. ASAE 1993, 36, 321–325. [Google Scholar] [CrossRef]
  10. Maski, D.; Durairaj, D. Effects of Charging Voltage, Application Speed, Target Height, and Orientation upon Charged Spray Deposition on Leaf Abaxial and Adaxial Surfaces. Crop Prot. 2010, 29, 134–141. [Google Scholar] [CrossRef]
  11. Western, N.M.; Hislop, E.C.; Dalton, W.J. Experimental Air-Assisted Electrohydrodynamic Spraying. Crop Prot. 1994, 13, 179–188. [Google Scholar] [CrossRef]
  12. Martin, D.E.; Latheef, M.A. Aerial Electrostatic Spray Deposition and Canopy Penetration in Cotton. J. Electrost. 2017, 90, 38–44. [Google Scholar] [CrossRef]
  13. Salcedo, R.; Llop, J.; Campos, J.; Costas, M.; Gallart, M.; Ortega, P.; Gil, E. Evaluation of Leaf Deposit Quality between Electrostatic and Conventional Multi-Row Sprayers in a Trellised Vineyard. Crop Prot. 2020, 127, 104964. [Google Scholar] [CrossRef]
  14. Urkan, E.; Guler, H.; Komekci, F. A Review of Electrostatic Spraying for Agricultural Applications. Tarım Makinaları Bilim. Derg. 2016, 12, 229–233. [Google Scholar]
  15. Lin, Z.; Xie, J.; Tian, S.; Wang, X.; Sun, W.; Mo, X. Research and Experiment of Electrostatic Spraying System for Agricultural Plant Protection Unmanned Vehicle. Front. Ecol. Evol. 2023, 11, 1138180. [Google Scholar] [CrossRef]
  16. Gao, J.; Guo, Y.; Tunio, M.H.; Chen, X.; Chen, Z. Design of a High-Voltage Electrostatic Ultrasonic Atomization Nozzle and Its Droplet Adhesion Effects on Aeroponically Cultivated Plant Roots. Int. J. Agric. Biol. Eng. 2023, 16, 30–37. [Google Scholar] [CrossRef]
  17. Kim, S.; Jung, M.; Choi, S.; Lee, J.; Lim, J.; Kim, M. Discharge Current of Water Electrospray with Electrical Conductivity under High-Voltage and High-Flow-Rate Conditions. Exp. Therm. Fluid Sci. 2020, 118, 110151. [Google Scholar] [CrossRef]
  18. Liu, C.; Hu, J.; Li, Y.; Zhao, S.; Li, Q.; Zhang, W.; Zhao, M. Numerical Simulation of the Trajectory of UAVs Electrostatic Droplets Based on VOF-UDF Electro-Hydraulic Coupling and High-Speed Camera Technology. Agronomy 2023, 13, 512. [Google Scholar] [CrossRef]
  19. Yue, J.; Chao, C.; Hong, L.; Qingjiang, X. Influences of Nozzle Parameters and Low-Pressure on Jet Breakup and Droplet Characteristics. Int. J. Agric. Biol. Eng. 2016, 9, 22–32. [Google Scholar] [CrossRef]
  20. Jiang, Y.; Liu, J.; Li, H.; Hua, L.; Yong, Y. Droplet Distribution Characteristics of Impact Sprinklers with Circular and Noncircular Nozzles: Effect of Nozzle Aspect Ratios and Equivalent Diameters. Biosyst. Eng. 2021, 212, 200–214. [Google Scholar] [CrossRef]
  21. Hua, L.; Jiang, Y.; Li, H.; Qin, L. Effects of Different Nozzle Orifice Shapes on Water Droplet Characteristics for Sprinkler Irrigation. Horticulturae 2022, 8, 538. [Google Scholar] [CrossRef]
  22. Liao, J.; Luo, X.; Wang, P.; Zhou, Z.; O’Donnell, C.C.; Zang, Y.; Hewitt, A.J. Analysis of the Influence of Different Parameters on Droplet Characteristics and Droplet Size Classification Categories for Air Induction Nozzle. Agronomy 2020, 10, 256. [Google Scholar] [CrossRef]
  23. Levia, D.F.; Michalzik, B.; Näthe, K.; Bischoff, S.; Richter, S.; Legates, D.R. Differential Stemflow Yield from European Beech Saplings: The Role of Individual Canopy Structure Metrics. Hydrol. Process. 2015, 29, 43–51. [Google Scholar] [CrossRef]
  24. Gonzalez-Ollauri, A.; Stokes, A.; Mickovski, S.B. A Novel Framework to Study the Effect of Tree Architectural Traits on Stemflow Yield and Its Consequences for Soil-Water Dynamics. J. Hydrol. 2020, 582, 124448. [Google Scholar] [CrossRef]
  25. Zhao, S.; Castle, G.S.P.; Adamiak, K. The Effect of Space Charge on the Performance of an Electrostatic Induction Charging Spray Nozzle. J. Electrost. 2005, 63, 261–272. [Google Scholar] [CrossRef]
  26. Pan, X.; Yang, S.; Gao, Y.; Wang, Z.; Zhai, C.; Qiu, W. Evaluation of Spray Drift from an Electric Boom Sprayer: Impact of Boom Height and Nozzle Type. Agronomy 2025, 15, 160. [Google Scholar] [CrossRef]
  27. Gao, J.; Xu, K.; He, R.; Chen, X.; Tunio, M.H. Development and Experiments of Low Frequency Ultrasonic Electrostatic Atomizing Nozzle with Double Resonators. Int. J. Agric. Biol. Eng. 2022, 15, 39–48. [Google Scholar] [CrossRef]
  28. Liao, J.; Hewitt, A.J.; Wang, P.; Luo, X.; Zang, Y.; Zhou, Z.; Lan, Y.; O’Donnell, C. Development of Droplet Characteristics Prediction Models for Air Induction Nozzles Based on Wind Tunnel Tests. Int. J. Agric. Biol. Eng. 2019, 12, 1–6. [Google Scholar] [CrossRef]
  29. Ou, M.; Zhang, Y.; Wu, M.; Wang, C.; Dai, S.; Wang, M.; Dong, X.; Jiang, L. Development and Experiment of an Air-Assisted Sprayer for Vineyard Pesticide Application. Agriculture 2024, 14, 2279. [Google Scholar] [CrossRef]
  30. Zhang, Z. A Flexible New Technique for Camera Calibration. IEEE Trans. Pattern Anal. Mach. Intell. 2000, 22, 1330–1334. [Google Scholar] [CrossRef]
  31. Zhu, H.; Salyani, M.; Fox, R.D. A Portable Scanning System for Evaluation of Spray Deposit Distribution. Comput. Electron. Agric. 2011, 76, 38–43. [Google Scholar] [CrossRef]
  32. Cerruto, E.; Manetto, G.; Longo, D.; Failla, S.; Papa, R. A Model to Estimate the Spray Deposit by Simulated Water Sensitive Papers. Crop Prot. 2019, 124, 104861. [Google Scholar] [CrossRef]
  33. Sudheer, K.P.; Panda, R.K. Digital Image Processing for Determining Drop Sizes from Irrigation Spray Nozzles. Agric. Water Manag. 2000, 45, 159–167. [Google Scholar] [CrossRef]
  34. Li, J.; Li, Z.; Ma, Y.; Cui, H.; Yang, Z.; Lu, H. Effects of Leaf Response Velocity on Spray Deposition with an Air-Assisted Orchard Sprayer. Int. J. Agric. Biol. Eng. 2021, 14, 123–132. [Google Scholar] [CrossRef]
  35. Gao, Z.-M.; Hu, W.; Dong, X.-Y.; Zhao, X.-Y.; Wang, S.; Chen, J.; Qiu, B.-J. Motion Behavior of Droplets on Curved Leaf Surfaces Driven by Airflow. Front. Plant Sci. 2024, 15, 1450831. [Google Scholar] [CrossRef] [PubMed]
  36. Bowker, G.E.; Crenshaw, H.C. Electrostatic Forces in Wind-Pollination—Part 2: Simulations of Pollen Capture. Atmos. Environ. 2007, 41, 1596–1603. [Google Scholar] [CrossRef]
  37. Dai, S.; Zhang, J.; Jia, W.; Ou, M.; Zhou, H.; Dong, X.; Chen, H.; Wang, M.; Chen, Y.; Yang, S. Experimental Study on the Droplet Size and Charge-to-Mass Ratio of an Air-Assisted Electrostatic Nozzle. Agriculture 2022, 12, 889. [Google Scholar] [CrossRef]
  38. Erinin, M.A.; Néel, B.; Mazzatenta, M.T.; Duncan, J.H.; Deike, L. Comparison between Shadow Imaging and In-Line Holography for Measuring Droplet Size Distributions. Exp. Fluids 2023, 64, 96. [Google Scholar] [CrossRef]
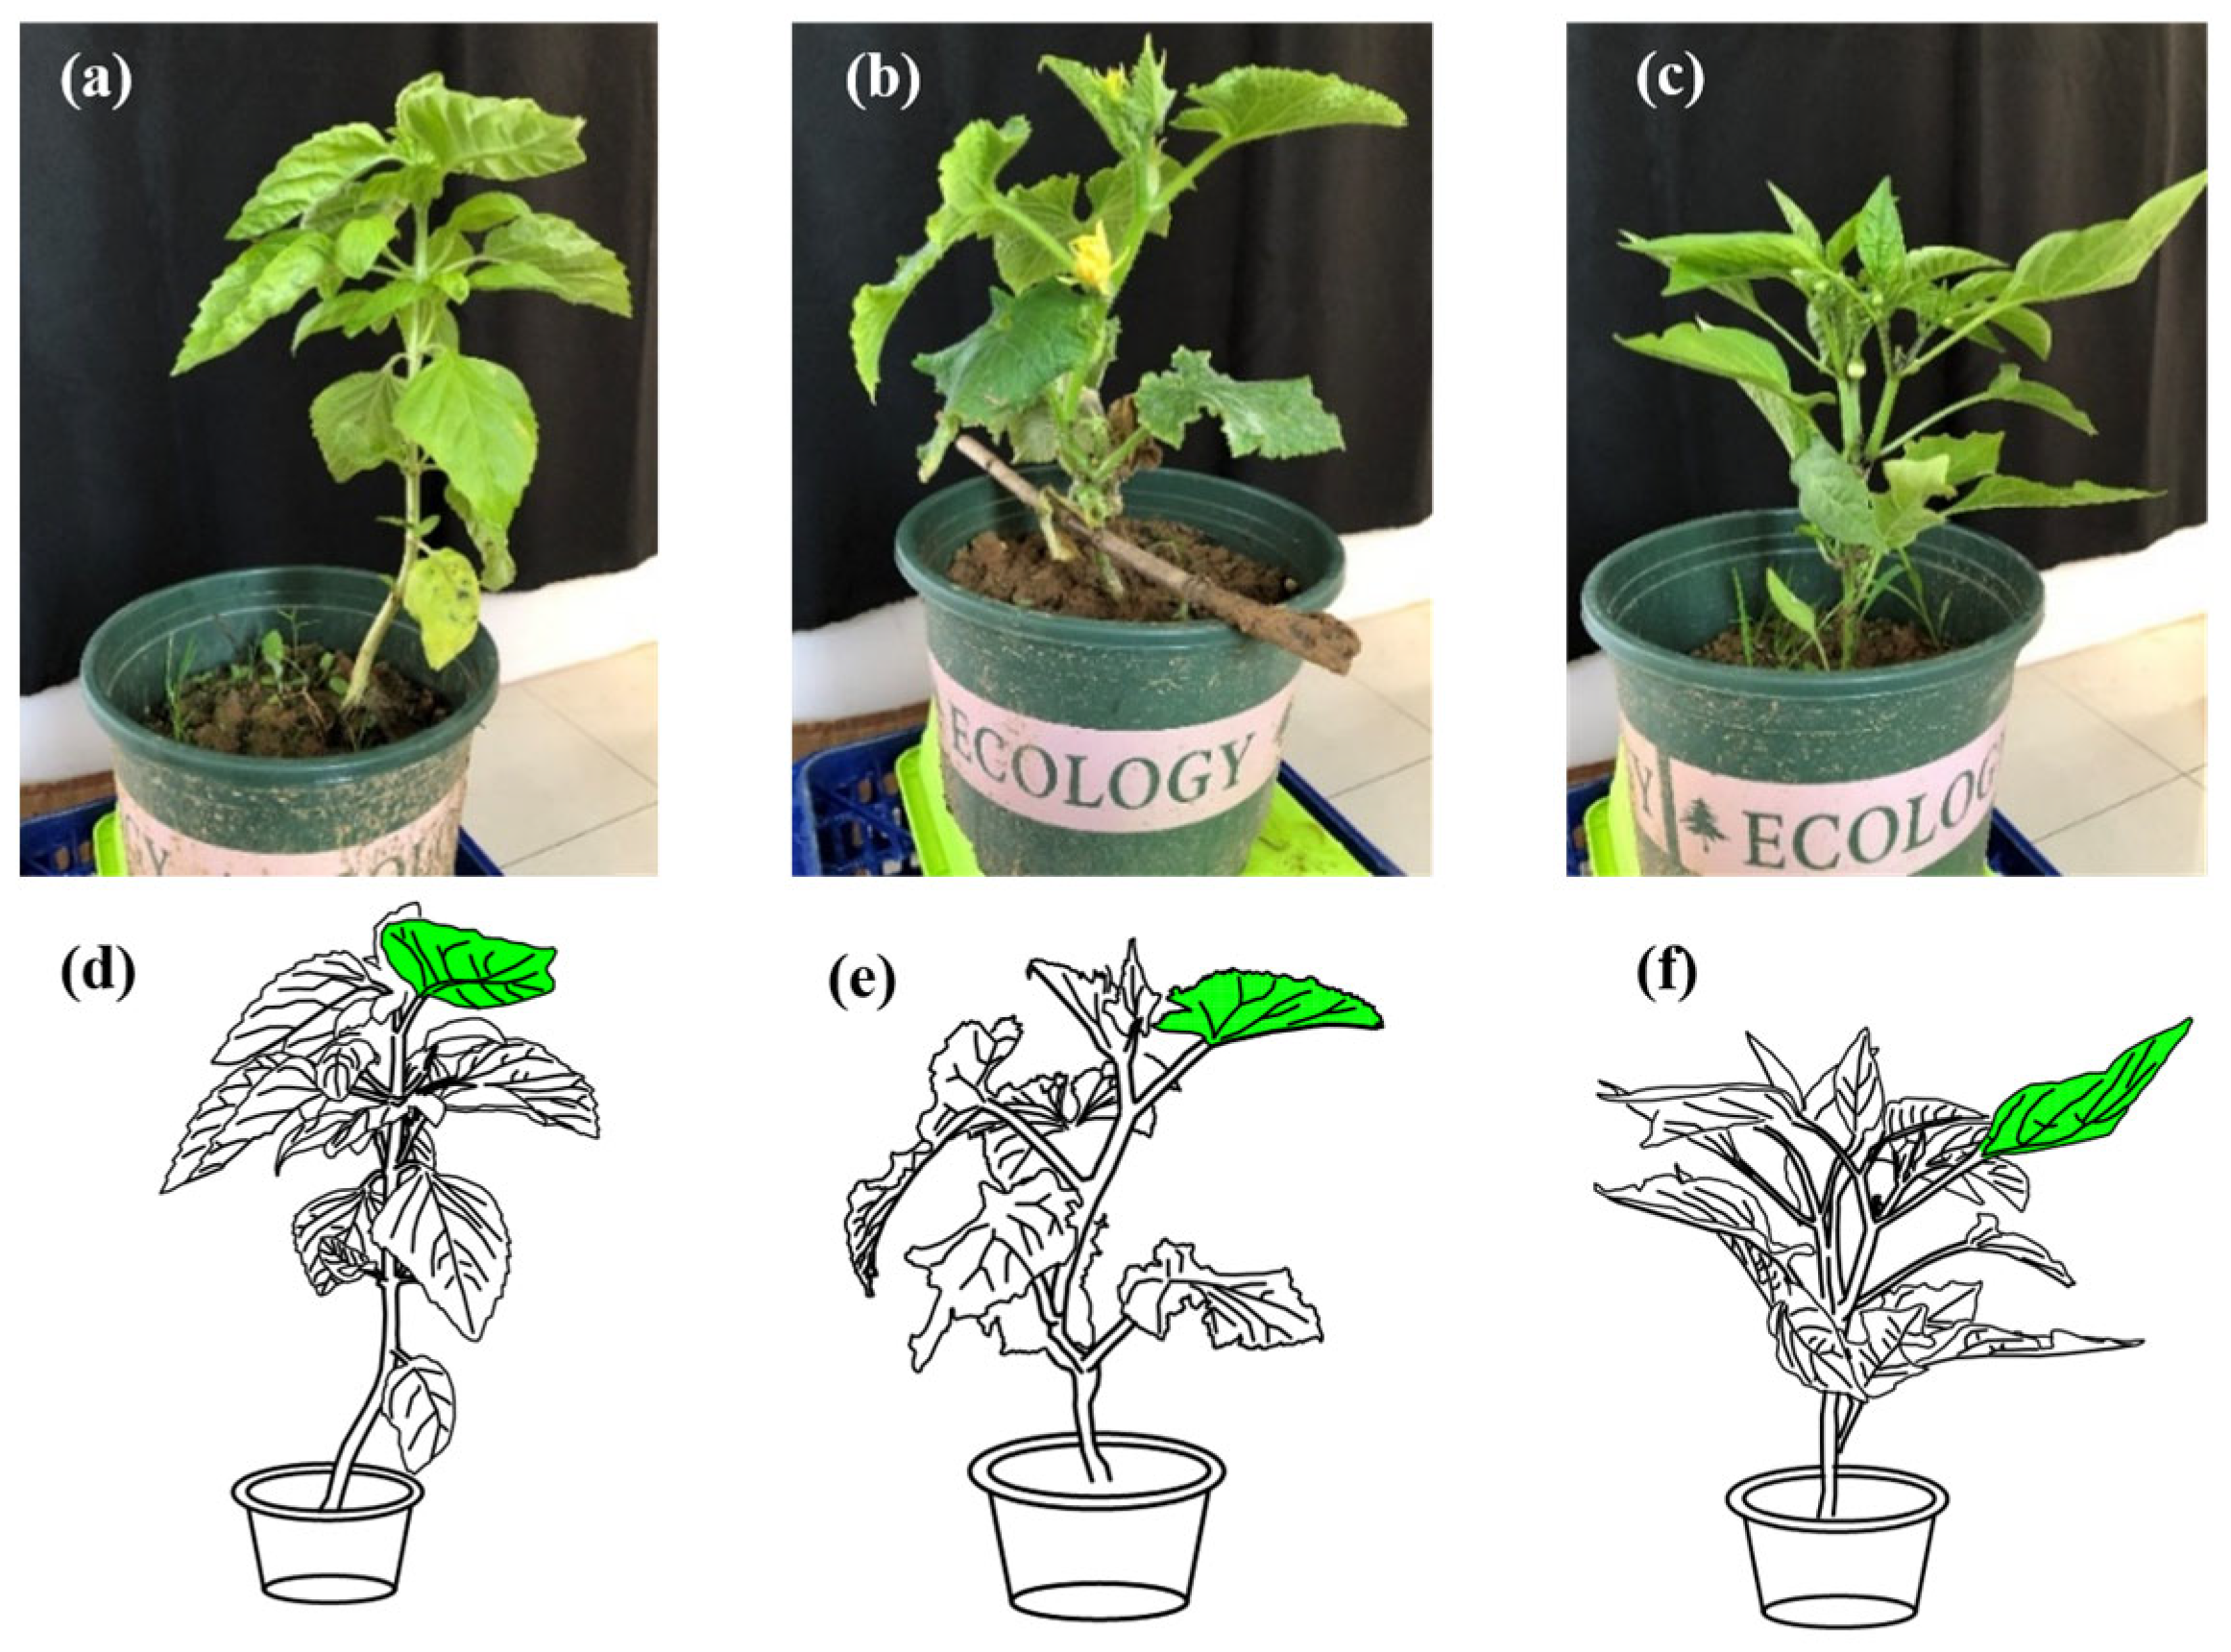
Figure 1. Experimental plants and designated target leaves of the three tested crop species. (ac) Photographs of basil, cucumber, and chili pepper plants, respectively. (df) Corresponding crop-model renderings; target leaves are highlighted in green.
Horticulturae 11 01117 g001
Figure 2. Inclination angles of the target leaves for the three crop species. (ac) basil, cucumber, and chili pepper, respectively.
Horticulturae 11 01117 g002
Figure 3. Schematic of the experimental setup and relative positions of the equipment.
Horticulturae 11 01117 g003
Figure 4. Schematic diagram of droplet motion.
Horticulturae 11 01117 g004
Figure 5. Droplets beneath the abaxial side of the basil leaf at different time points. (Top row): non-electrostatic spraying. (Bottom row): electrostatic spraying.
Horticulturae 11 01117 g005
Figure 6. Droplets beneath the abaxial side of the cucumber leaf at different time points. (Top row): non-electrostatic spraying. (Bottom row): electrostatic spraying.
Horticulturae 11 01117 g006
Figure 7. Droplets beneath the abaxial side of the pepper leaf at different time points. (Top row): non-electrostatic spraying. (Bottom row): electrostatic spraying.
Horticulturae 11 01117 g007
Figure 8. Number of droplets in the regions of interest beneath the three target leaves at different time points.
Horticulturae 11 01117 g008
Figure 9. Droplet positions at different time points within the region of interest (ROI) beneath the abaxial (lower) surface of the basil leaf, with (ad) showing trackable droplets at four 50-frame intervals.
Horticulturae 11 01117 g009
Figure 10. Droplet positions at different time points within the region of interest (ROI) beneath the abaxial (lower) surface of the cucumber leaf, with (ad) showing trackable droplets at four 50-frame intervals.
Horticulturae 11 01117 g010
Figure 11. Droplet positions at different time points within the region of interest (ROI) beneath the abaxial (lower) surface of the pepper leaf, with (ad) showing trackable droplets at four 50-frame intervals.
Horticulturae 11 01117 g011
Figure 12. Spline-fitted trajectories of charged droplets near the target leaf surface. (a) basil, (b) cucumber, (c) chili pepper. Trajectories A (red), B (yellow), and C (green) represent the selected trackable droplet trajectories corresponding to the upper, middle, and lower canopy layers, respectively.
Horticulturae 11 01117 g012
Figure 13. Positions of trackable charged droplets near the chili pepper leaf across four consecutive neighborhood frames, with (ad) showing trackable droplets at four 50-frame intervals.
Horticulturae 11 01117 g013
Table 1. Main experimental equipment and specifications.
EquipmentModelSpecifications
High-voltage power supplyTCM6000 series, Taisman Technology, Dalian, ChinaInput voltage: AC 220 V ± 10%
Laptop computerDell Inspiron 15, Round Rock, TX, USA\
High-speed cameraOLYMPUS i-SPEED 3, Center Valley, PA, USA2000 fps, 15 μs, 1280 × 1040
Light sourceOSRAM, Munich, Germany230 V, 1000 W
Diaphragm pumpXTL-3210, Shenzhen, ChinaDC 24 V, 100 W, 1.1 MPa
Pressure regulatorAirtac BR-2000, Ningbo, China0–1.0 MPa
Electrostatic induction nozzleMaxCharge nozzle, Beijing, Chinainner diameter 45 mm, outer 55 mm
Table 2. Pixel coordinates of charged droplets near three target leaves on the imaging plane.
Capture TimeFirst NeighborhoodSecond NeighborhoodThird NeighborhoodFourth Neighborhood
Basil leavesDroplet A(964, 284)(928, 427)(878, 554)(828, 664)
Droplet B(761, 24)(744, 91)(728, 158)(710, 227)
Droplet C(874, 39)(856, 131)(837, 223)(818, 319)
Cucumber leavesDroplet A(805, 136)(764, 297)(685, 450)(605, 549)
Droplet B(846, 466)(776, 579)(707, 677)(644, 767)
Droplet C(994, 530)(888, 705)(857, 860)(825, 1015)
Pepper leavesDroplet A(906, 100)(876, 255)(800, 366)(723, 447)
Droplet B(1063, 130)(1035, 250)(996, 362)(949, 465)
Droplet C(856, 308)(804, 416)(748, 510)(696, 598)
Table 3. World-coordinate positions of trackable charged droplets near the chili pepper leaf.
Capture TimeFirst NeighborhoodSecond NeighborhoodThird NeighborhoodFourth Neighborhood
Droplet A(−1.3, 10.3)(−2.7, 10.4)(−4.3, 10.6)(−6.3, 10.8)
Droplet B(0.5, 10.0)(−0.4, 10.1)(−1.3, 10.3)(−2.3, 10.4)
Droplet C(0.4, 10.1)(−0.7, 10.2)(−1.8, 10.3)(−3.0, 10.4)
Table 4. Mean two-dimensional velocities of trackable charged droplets across neighborhood frames during approach to the surface of the chili pepper leaf (mm/s).
Capture TimeFirst
Neighborhood
Second NeighborhoodThird
Neighborhood
Droplet A(−56.3, 6.5)(−64.4, 7.4)(−78.4, 9.1)
Droplet B(−34.9, 4.1)(−36.5, 4.2)(−39.9, 6.7)
Droplet C(−41.7, 4.8)(−43.2, 5.1)(−48.9, 5.5)
Table 5. Overall mean 2D velocities of trackable charged droplets approaching the surface of the chili pepper leaf (mm/s).
Trackable DropletAverage Speed/(mm/s)
Horizontal DirectionVertical Direction
Droplet A66.377.67
Droplet B37.105.00
Droplet C44.605.13
Table 6. Number of pixels occupied by trackable charged droplets.
Trackable DropletNumber of Occupied Pixels (Count)
First NeighborhoodSecond NeighborhoodThird NeighborhoodFourth NeighborhoodAverage-e Value
Droplet A1212111011.25
Droplet B2120181819.25
Droplet C1616151415.25
Table 7. Deflection angles of droplet velocity vectors near the pepper leaf across different neighborhoods.
Trackable DropletDeflection Angle/(°)
1 2 3 Average Value
Droplet A6.58586.55496.42086.4605
Droplet B6.70036.56409.53227.5988
Droplet C6.56636.73296.81736.7055
Disclaimer/Publisher’s Note: The statements, opinions and data contained in all publications are solely those of the individual author(s) and contributor(s) and not of MDPI and/or the editor(s). MDPI and/or the editor(s) disclaim responsibility for any injury to people or property resulting from any ideas, methods, instructions or products referred to in the content.