Article

IP-YOLOv8: A Multi-Scale Pest Detection Algorithm for Field-Scale Applications

1
School of Information, Yunnan Normal University, Kunming 650500, China
2
Computer Vision and Intelligent Control Technology Engineering Research Center, Yunnan Provincial Department of Education, Kunming 650500, China
3
Southwest United Graduate School, Kunming 650092, China
*
Author to whom correspondence should be addressed.
Horticulturae 2025, 11(9), 1109; https://doi.org/10.3390/horticulturae11091109
Submission received: 1 August 2025 / Revised: 2 September 2025 / Accepted: 9 September 2025 / Published: 13 September 2025
(This article belongs to the Section Insect Pest Management)

Abstract

Field-scale pest monitoring requires accurate pest recognition and classification techniques. However, there are two main challenges in practical pest detection tasks. First, both intra-species morphological variation across developmental stages and inter-species size differences create challenges for models adapting to multi-scale features. Second, biological camouflage reduces target-background contrast, increasing the difficulty of model recognition. To address these issues, this paper proposes an improved pest detection model, IP-YOLOv8, based on YOLOv8s. First, a multi-scale feature fusion architecture is introduced, establishing a cross-layer feature interaction mechanism that effectively integrates shallow detailed features and deep semantic features, significantly enhancing the model’s multi-scale representation ability. Second, a dynamic detection head is designed to address the diverse morphology of pests. This head adapts the receptive field through a dynamic sampling mechanism, allowing the model to accurately capture pest features of varying scales and shapes. Finally, to tackle the issue of camouflage background confusion, an edge feature fusion module is proposed to enhance target contour information, thereby addressing the blurring of edge features caused by camouflage. Experimental results demonstrate that IP-YOLOv8 outperforms YOLOv8s on the IP102 dataset, achieving improvements of 2.2% in mAP50, 1.3% in mAP50:95, 3.1% in precision, and 1.5% in recall. This method effectively adapts to complex field pest detection tasks, providing strong technical support for precision agriculture.

1. Introduction

Crop pests and diseases represent major threats to agricultural production, characterized by their diversity, widespread impact, and epidemic potential. Monitoring pests at the field scale is a key strategy for preventing pest damage. By continuously monitoring pest populations, farmers can detect early signs of infestation, allowing them to take effective control measures before significant crop damage occurs. However, experience-based assessment often results in misdiagnosis or inappropriate responses to pest infestations. Therefore, the current trend in precision agriculture is to build a standardized pest diagnostic system and introduce expert knowledge-based intelligent technologies to replace traditional manual monitoring methods, improving the accuracy and efficiency of pest control [1].
With the rapid development of smart agricultural technologies, including artificial intelligence (AI), the Internet of Things (IoT), and remote sensing, significant transformations have occurred in pest detection models within precision agriculture [2]. These technological innovations have not only driven research on real-time dynamic pest monitoring but also fundamentally reduced reliance on traditional labor-intensive monitoring methods [3,4,5]. However, effective real-time monitoring requires accurate pest recognition and classification technologies. Currently, pest classification and recognition based on computer vision mainly include traditional machine learning methods and deep learning methods [6]. Traditional machine learning methods rely on manually extracting image features and are typically applied to pest recognition and classification for specific crops. Pattnaik et al. [7] used the Local Binary Pattern (LBP) algorithm to extract texture features from tomato pest images and classified them using Support Vector Machine (SVM), achieving accurate recognition of tomato pests. Qing et al. [8] proposed a novel three-layer detection method for identifying different developmental stages of white-backed planthoppers. This method used Histogram of Oriented Gradients (HOG) features, Gabor features, and Local Binary Pattern (LBP) features to train AdaBoost and SVM classifiers, achieving a recognition rate of 73.1%. Ebrahimi et al. [9] used the SVM classification method for detecting thrips in strawberry crop canopies. By extracting regional indices and brightness as key color feature indicators, they controlled the average detection error to below 2.25%, providing an effective solution for the precise identification of pests and diseases in greenhouse strawberries. Traditional machine learning methods rely on multi-stage manual processing workflows for feature extraction. These methods have poor robustness and limited adaptability, making them unsuitable for complex pest classification requirements in agricultural production.
With the rapid advancement of hardware devices, particularly GPUs, deep learning methods have gradually become dominant in pest and disease recognition [10,11]. On the one hand, convolutional neural network (CNN)-based deep learning models can autonomously learn and extract data features, significantly improving the accuracy and efficiency. On the other hand, deep learning networks have demonstrated excellent performance on large-scale datasets, with their generalization ability extensively validated. For example, Chen et al. [12] proposed a network architecture called MAM-IncNet to address technical challenges such as insufficient accuracy in tea tree pest recognition. This architecture achieved a recall rate of 81.44% in real-world tea tree pest detection scenarios, fully validating its efficiency and practical application value in tea tree pest recognition tasks. Li et al. [13] introduced more advanced SE-RegNetY and SE-Inception-ResNet-V3 models based on the ResNet-18 classification model to optimize wheat pest recognition performance. Through systematic comparative experiments, the SE-Inception-ResNet-V3 model demonstrated superior performance, with an average overall recognition accuracy of 81.5%. Chen et al. [14] developed a multi-image fusion-based pest recognition and classification method, which effectively mitigates the information loss problem in single-image recognition by fusing multiple images of the same pest. Dong et al. [15] addressed the challenges in multi-category small pest recognition by proposing a multi-category pest detection network (MCPD-Net), which leverages a multi-scale feature pyramid and an adaptive feature region proposal network to significantly improve the detection accuracy and category differentiation of small pests. Chakrabarty et al. [16] proposed a single-stage object detection model based on YOLOv5 for identifying important agricultural insects and some of their damage symptoms in cruciferous crops, further exploring the feasibility of using damage symptoms caused by insects for pest detection, providing new technical support for precision agriculture pest and disease monitoring.
Although deep learning models are increasingly applied to agricultural pest detection, acquiring large-scale pest data and ensuring reliable annotations remain bottlenecks that restrict the development of pest detection tasks in agricultural production [17]. Currently, most public datasets focus primarily on pest types and counts, neglecting the morphological changes of the same pest at different developmental stages (such as eggs, larvae, pupae, and adults). This often results in significant intra-class variance and high inter-class similarity, posing challenges for pest recognition. IP102, as one of the most representative large-scale pest datasets, contains 75,000 images covering 102 pest categories and includes images of the same pest at different growth stages [18]. Table 1 summarizes some recent research progress based on the IP102 dataset. Although existing methods can achieve high accuracy in pest recognition tasks for specific crops, the model’s generalization ability still has certain limitations due to issues such as uneven pest category sample distribution and limited sample numbers. Despite the fact that the IP102 dataset covers 102 pest categories and helps improve model generalization, achieving high-precision multi-category pest detection on this dataset still faces significant challenges. Previous studies have shown that improved object detection algorithms can achieve efficient pest detection in specific application scenarios. However, there are still many challenges in practical applications. On the one hand, significant morphological differences exist in pests at different growth stages, and there are large scale differences between different pest species, which somewhat limits the model’s generalization ability. On the other hand, most pests have protective coloration highly similar to the environment, leading to reduced edge contrast between the target and the background, which poses significant difficulties for feature extraction. To address these issues, this study proposes a comprehensive model framework—IP-YOLOv8, with the following main contributions:
  • A multi-scale feature fusion architecture is introduced, consisting of the Scale Sequence Feature Fusion (SSFF) module and the Triple Feature Encoding (TFE) module, which leverages the high-resolution information in shallow feature maps to enhance the model’s multi-scale feature fusion capability.
  • A detection head for pest detection, DyDCNHead, is proposed. This head uses learnable dynamic sampling points, which enable it to adapt more efficiently to large-scale variations and diverse pest morphologies, thereby improving detection accuracy and robustness.
  • An edge feature fusion module (Edge Fusion Stem) is designed to enhance fine-grained edge information, which enables the model to distinguish edge features from background information more accurately, thereby improving detection performance.
The structure of this paper is as follows: Section 2 introduces the datasets and methods, Section 3 presents the experimental results and analysis, and Section 4 concludes the paper.
Table 1. Related research on the IP102 dataset.
ModelClassesmAP50GFLOPsParam
GLU-YOLOv8 [19]10258.7%--
Maize-YOLO [20]1376.3%38.9 G33.4 M
PestLite [21]10257.1%16.3 G6.34 M
Yolo-Pest [22]10257.1%-5.8 M
C3M-YOLO [23]10257.2%16.1 G7.1 M
CSWin + FRC + RPSA [24]10257.3%261.2 G41.4 M
YOLOv8-SCS [25]1087.9%16.8 G6.2 M
SAW-YOLO [26]1390.3%-4.58 M

2. Materials and Methods

2.1. IP102 Dataset

Nankai University researchers collected the IP102 dataset from internet sources and obtained expert annotations. The IP102 dataset is constructed using a hierarchical classification system with super-classes and sub-classes. Each pest is categorized into a super-class, corresponding to the main type of crop it damages, while specific pests are treated as sub-classes. The super-classes “FC” (Field Crop) and “EC” (Economic Crop) represent field crops and economic crops, respectively. Additionally, there are 8 specific categories further subdivided to represent the host crops of different pests. Ultimately, 102 pest categories are used as sub-classes to form the complete classification system of the IP102 dataset. Data annotation followed a systematic approach, where eight crop specialists collaborated to label images. Images were officially labeled only when at least five experts reached consensus. Each image is annotated strictly according to standards, and it is only officially labeled when at least five experts reach a consensus; otherwise, the image is discarded.
Figure 1 shows some example images from the IP102 dataset, which includes various agricultural pests, including the different life stages of the same pest. Due to the significant morphological changes during the pest’s life cycle, categorizing these morphologically diverse individuals into the same class adds complexity to feature extraction, placing higher demands on the model’s recognition ability. The IP102 dataset is primarily used for classification and detection tasks. For object detection, the dataset contains 18,976 images with labeled bounding boxes, which are divided into training, validation, and test sets in a 7:2:1 ratio.

2.2. Data Analysis

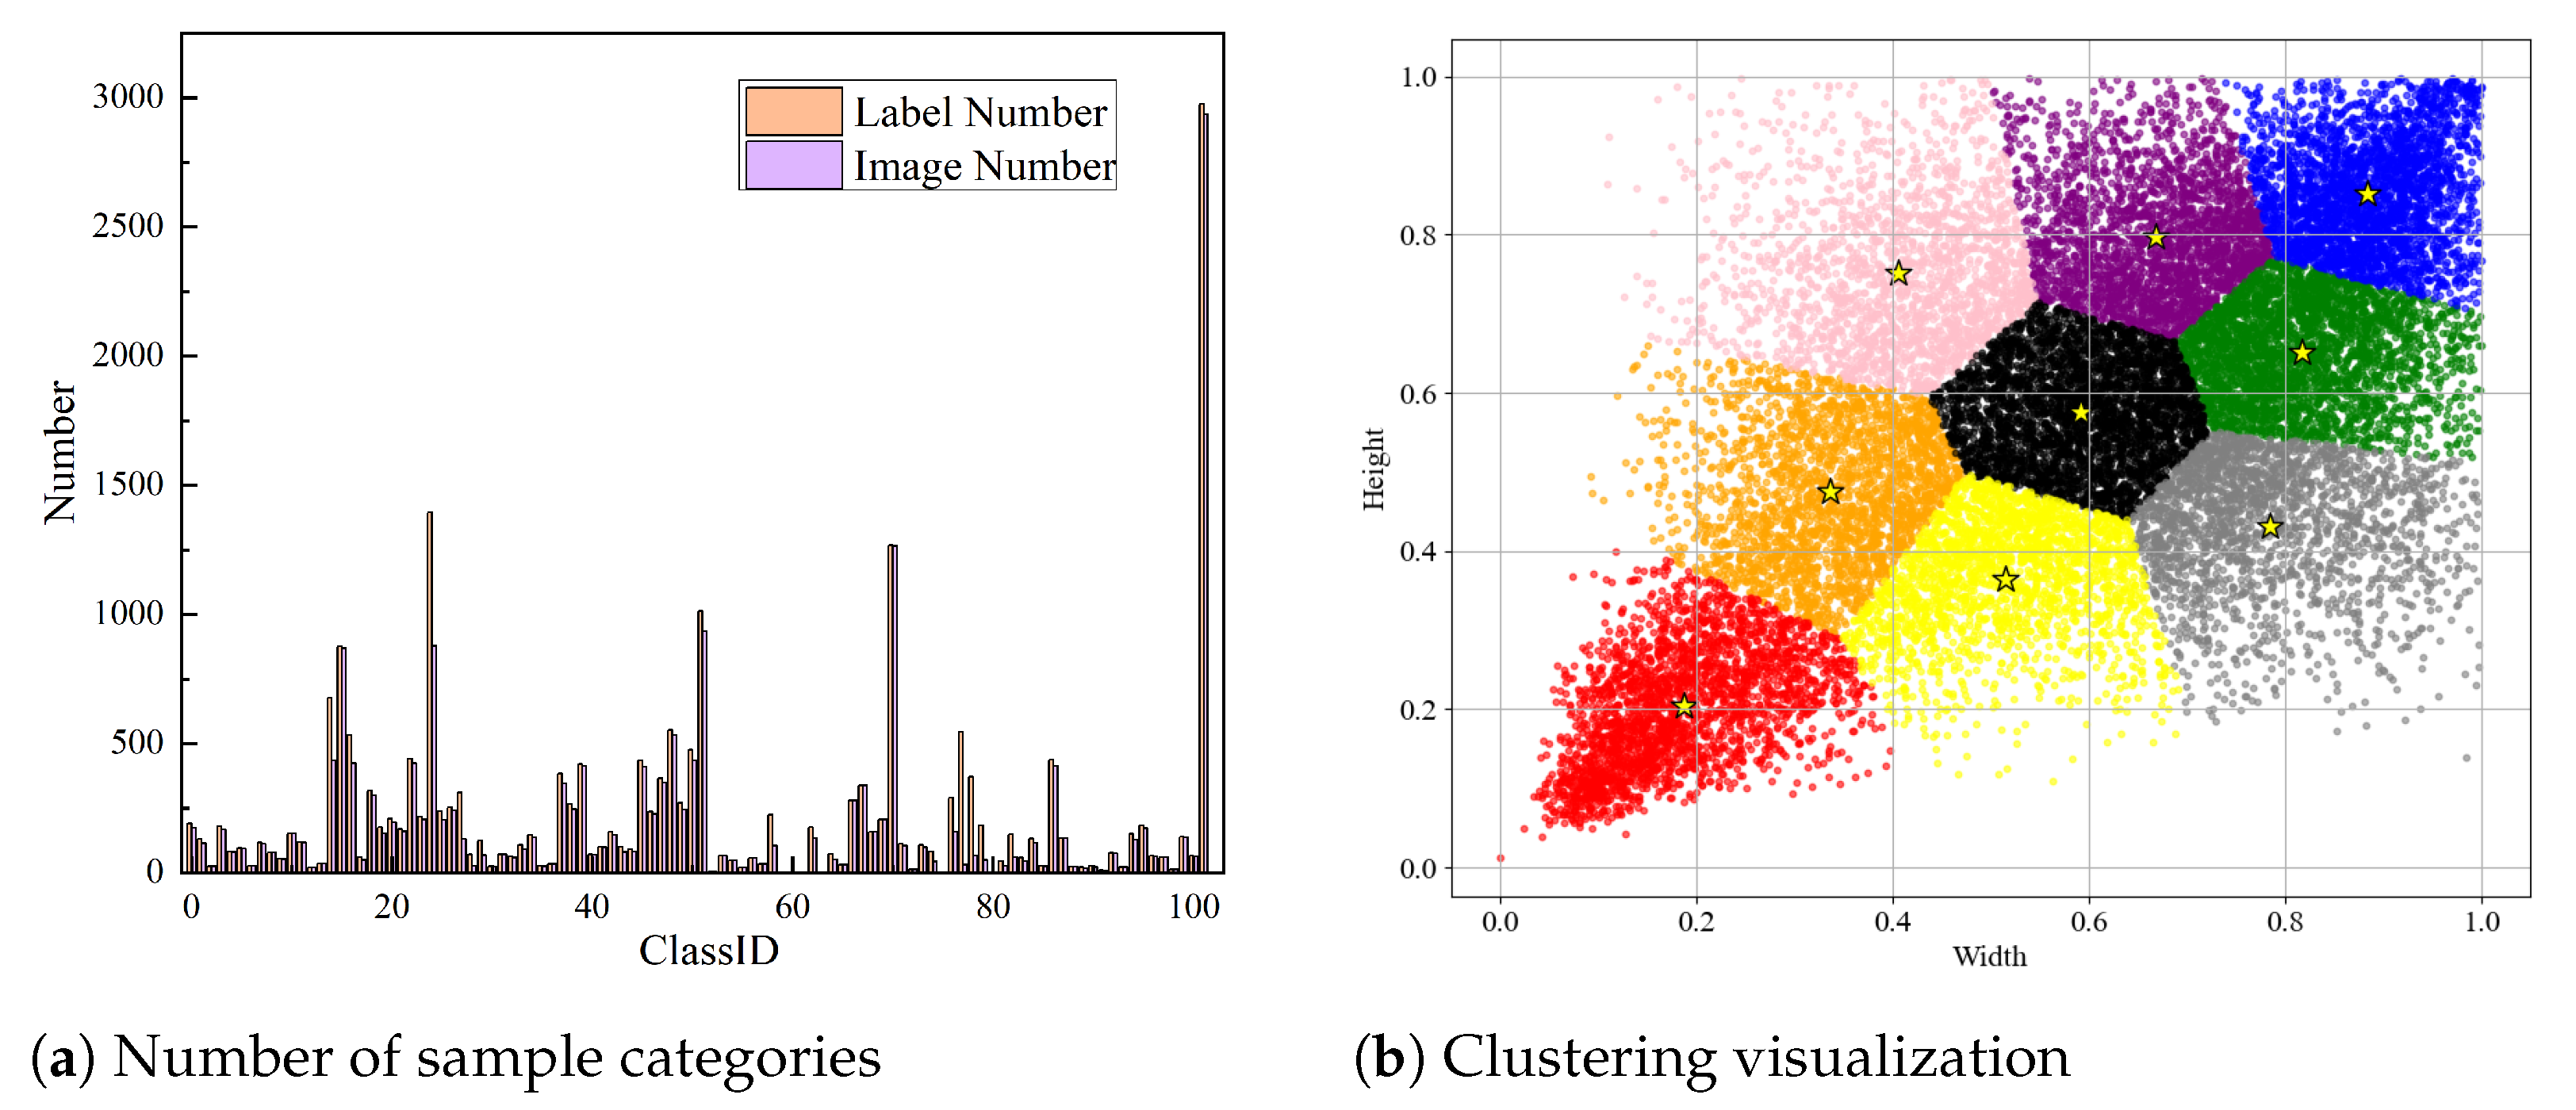
We conducted an analysis of the image data and drew the following conclusions based on the results. As shown in Figure 2a, we report the label and image distributions of the 102 sample categories. From the figure, it is evident that the sample distribution is significantly uneven, exhibiting a typical long-tail distribution. Specifically, the label count for the Cicadellidae (101) category is as high as 2975, while the label count for the grain spreader thrips (12) and alfalfa seed chalcid (55) categories is only 20. Although pests with fewer samples occur less frequently in nature, the significant difference in sample size can have a considerable impact on the model’s detection performance. During training, the model tends to learn the features of categories with more samples, resulting in better prediction performance for these categories. However, for categories with fewer samples, the model’s feature learning ability is weaker, which often leads to missed detections for small sample categories.
In addition, to further analyze the target box size and distribution characteristics in the IP102 dataset, we applied the K-means algorithm to cluster the ground truth label data and visualized the clustering results. As shown in Figure 2b, the different colors and shapes of the points represent different clustering categories, with 9 cluster centers generated (indicated by the stars in the figure). From the figure, it can be observed that some clustering categories have a sparse distribution, while others are more densely packed, further confirming the long-tail distribution phenomenon in the dataset. It is worth noting that there is a significant difference in the size of ground truth boxes in the pink and gray areas. This diversity makes it challenging for the generated anchor boxes to fully match the ground truth, thus complicating training of the detection location regression model.

2.3. YOLOv8 Object Detection Algorithm

Currently, mainstream object detection algorithms are mainly categorized into two types: one-stage and two-stage methods [27,28]. One-stage object detection algorithms directly predict the bounding box locations and labels, offering fast detection speeds, making them particularly suitable for real-time detection tasks. Common one-stage algorithms include SSD [29], RetinaNet [30], and the YOLO (You Only Look Once) series [31,32,33]. In contrast, two-stage object detection algorithms first generate candidate boxes and then perform classification and regression to predict object locations, while these methods achieve higher detection accuracy, they come with increased model complexity and computational costs. Notable two-stage algorithms include Faster R-CNN [34], Mask R-CNN [35], and R-FCN [36]. As a representative one-stage detection algorithm, YOLO stands out in real-time detection tasks due to its speed and accuracy. Taking into account both algorithm robustness and deployment convenience, this study selects YOLOv8s as the baseline model.
YOLOv8 offers five different model variants: n, s, m, l, and x. The YOLOv8 architecture is divided into three main components: the backbone network, the feature enhancement network, and the detection head. In the backbone network, YOLOv8 replaces the C3 module from YOLOv5 with the newly designed C2f module, which more effectively captures gradient flow information. In the detection head, YOLOv8 introduces a decoupled head and an anchor-free approach, while incorporating DFL Loss and CIoU for regression tasks. With these advancements, YOLOv8 is capable of handling complex scenarios and diverse object variations, providing strong technical support for various applications.

2.4. Model Improvement

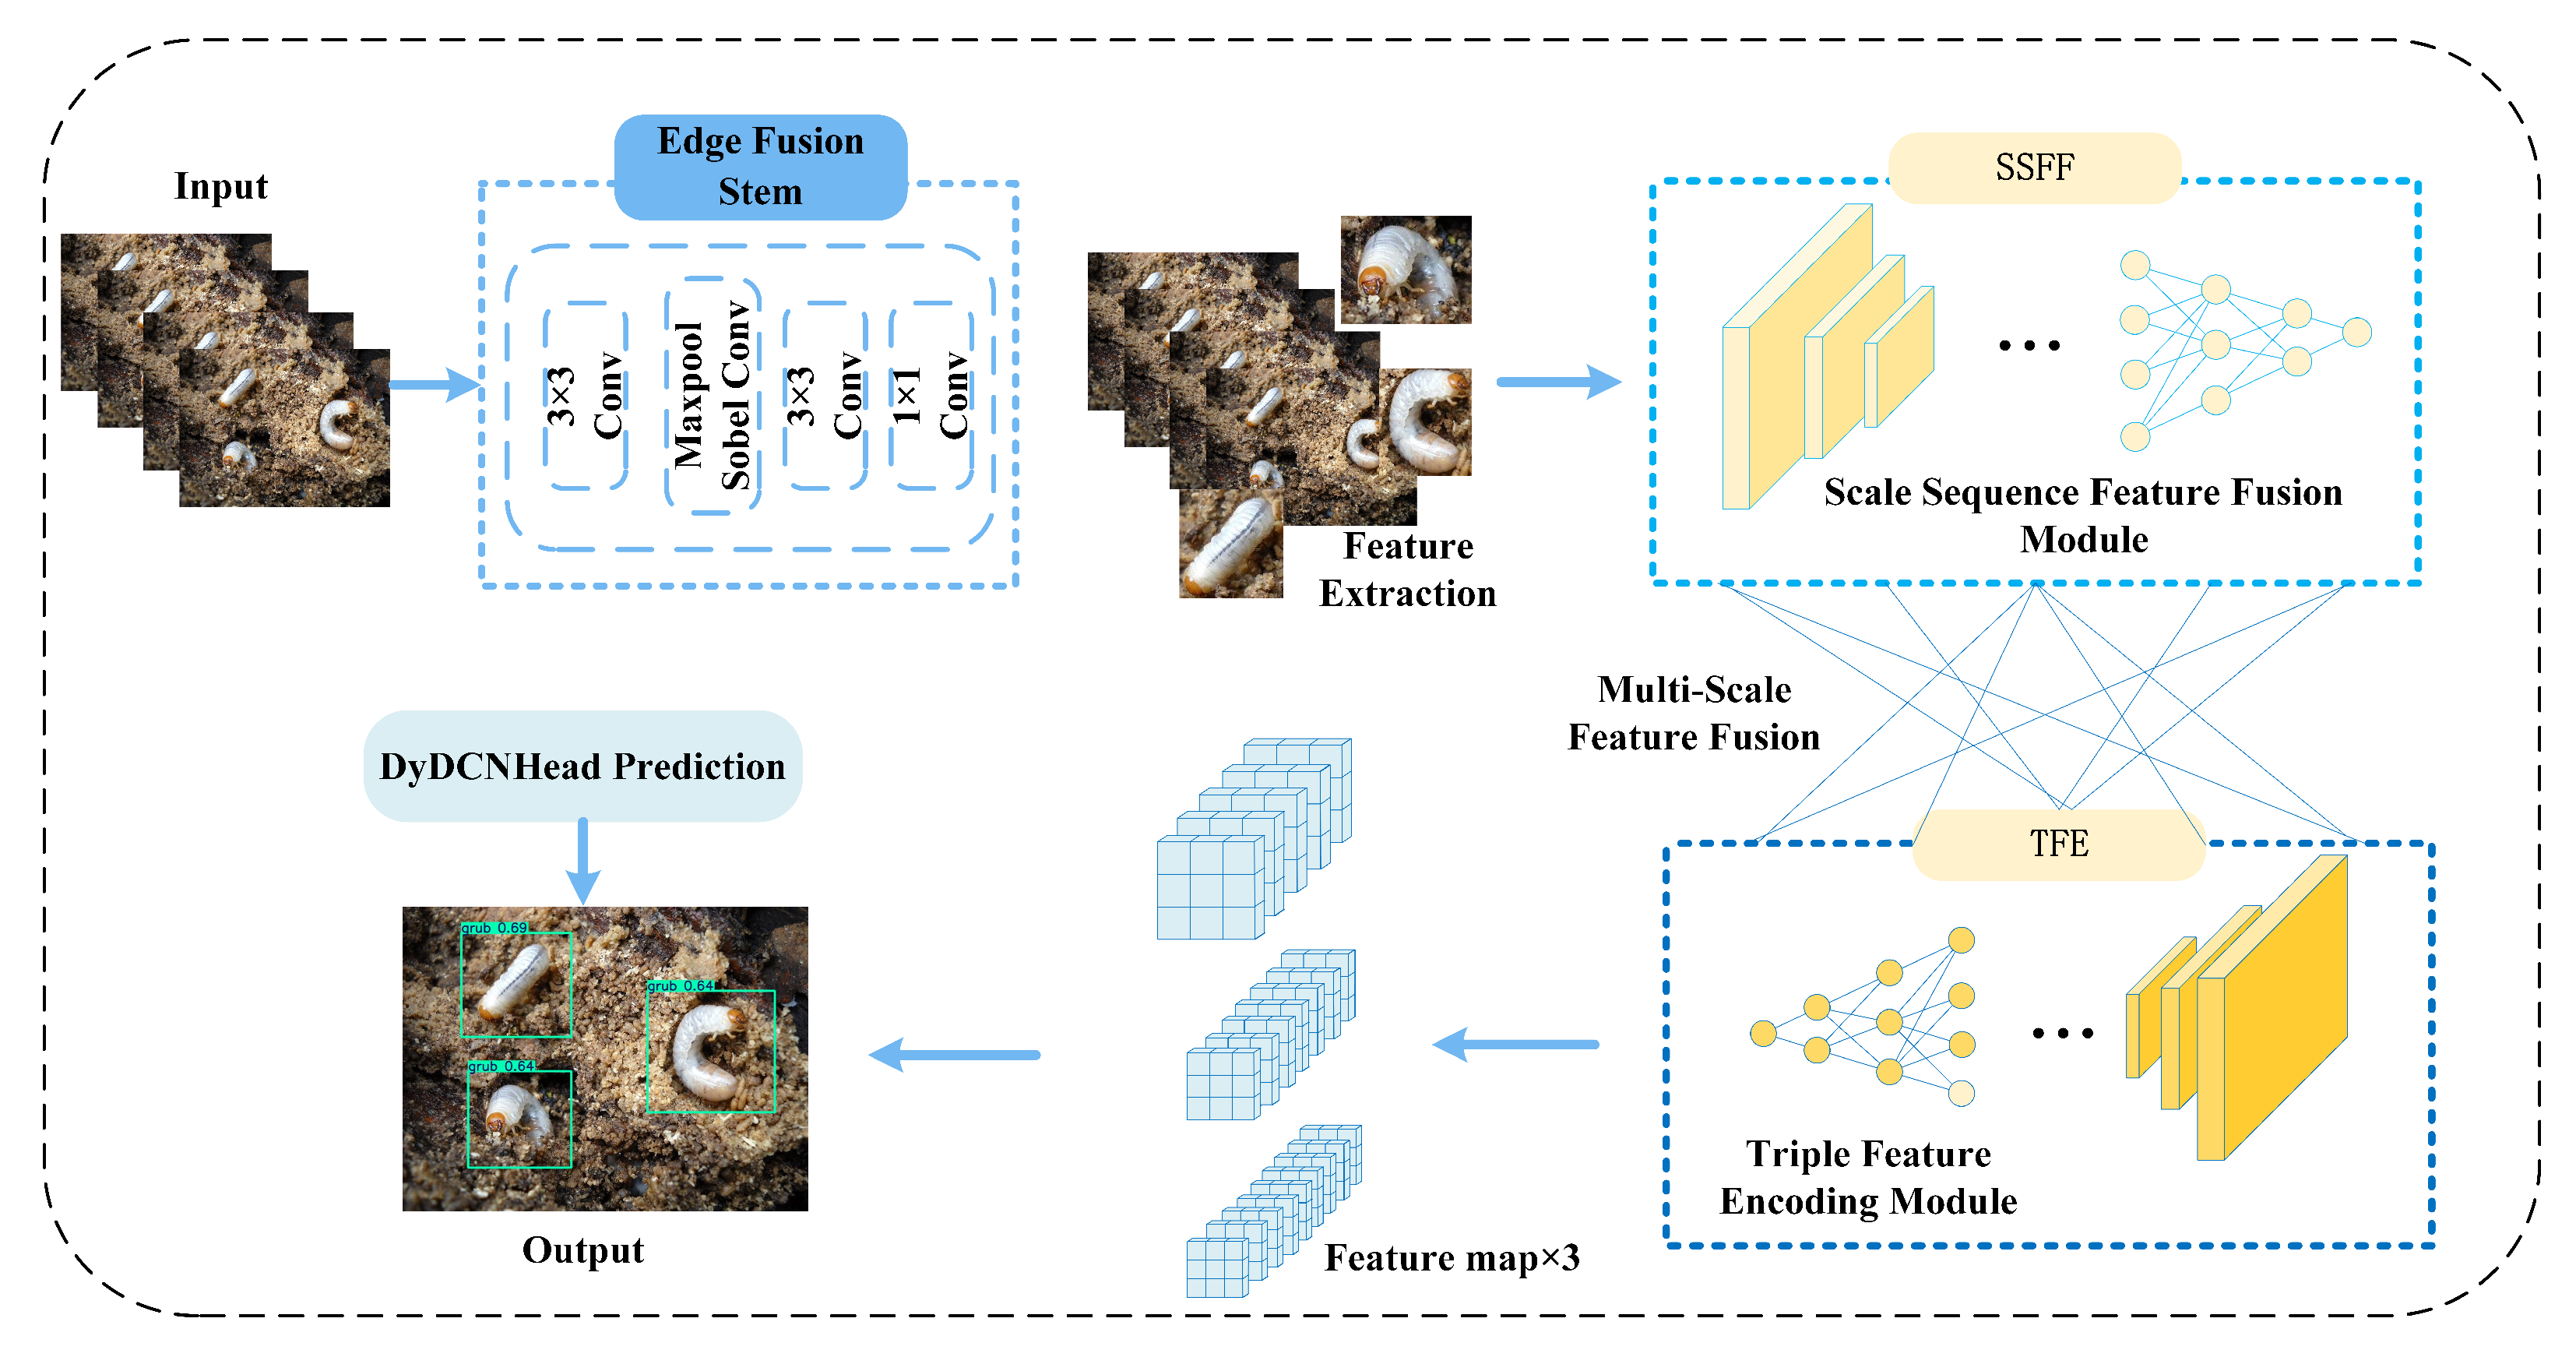
Building on YOLOv8s, this paper proposes a specialized model for pest and disease detection, termed IP-YOLOv8. Its overall framework is illustrated in Figure 3. First, we introduce a multi-scale feature fusion mechanism that fully integrates shallow high-resolution feature maps to achieve efficient fusion of small, medium, and large-scale features. This effectively addresses the significant variations in size and morphology among different pest species. Second, we propose a dynamic detection head based on Deformable Convolution v3. By leveraging a learnable dynamic sampling point mechanism, the model significantly improves its adaptability to pests with diverse shapes and complex features. Finally, to tackle the issue of edge blurring caused by pest camouflage, we design an edge feature fusion module. This module enhances edge feature representation, substantially improving detection performance in complex backgrounds.

2.4.1. Multi-Scale Feature Fusion

In object detection tasks, the YOLOv8s model extensively employs the Feature Pyramid Network (FPN) structure, which is particularly effective in handling multi-scale problems by leveraging features at different scales. However, FPN has limitations for complex multi-scale pest detection applications. As highlighted in the clustering analysis in Section 2.3, pests exhibit a wide variety of species with considerable scale differences, resulting in diverse shapes and sizes. FPN enhances multi-scale object detection performance by fusing low-level features with high-level semantic features in a bottom-up manner. However, as the network depth increases, this process also leads to the loss of low-level detail information. Since low-level feature maps typically retain high spatial resolution and rich detail features, their fusion may result in the loss of critical local information, thereby reducing the model’s ability to recognize complex and diverse pest characteristics. To address the multi-scale feature fusion issue, we introduce a novel feature fusion architecture [37].
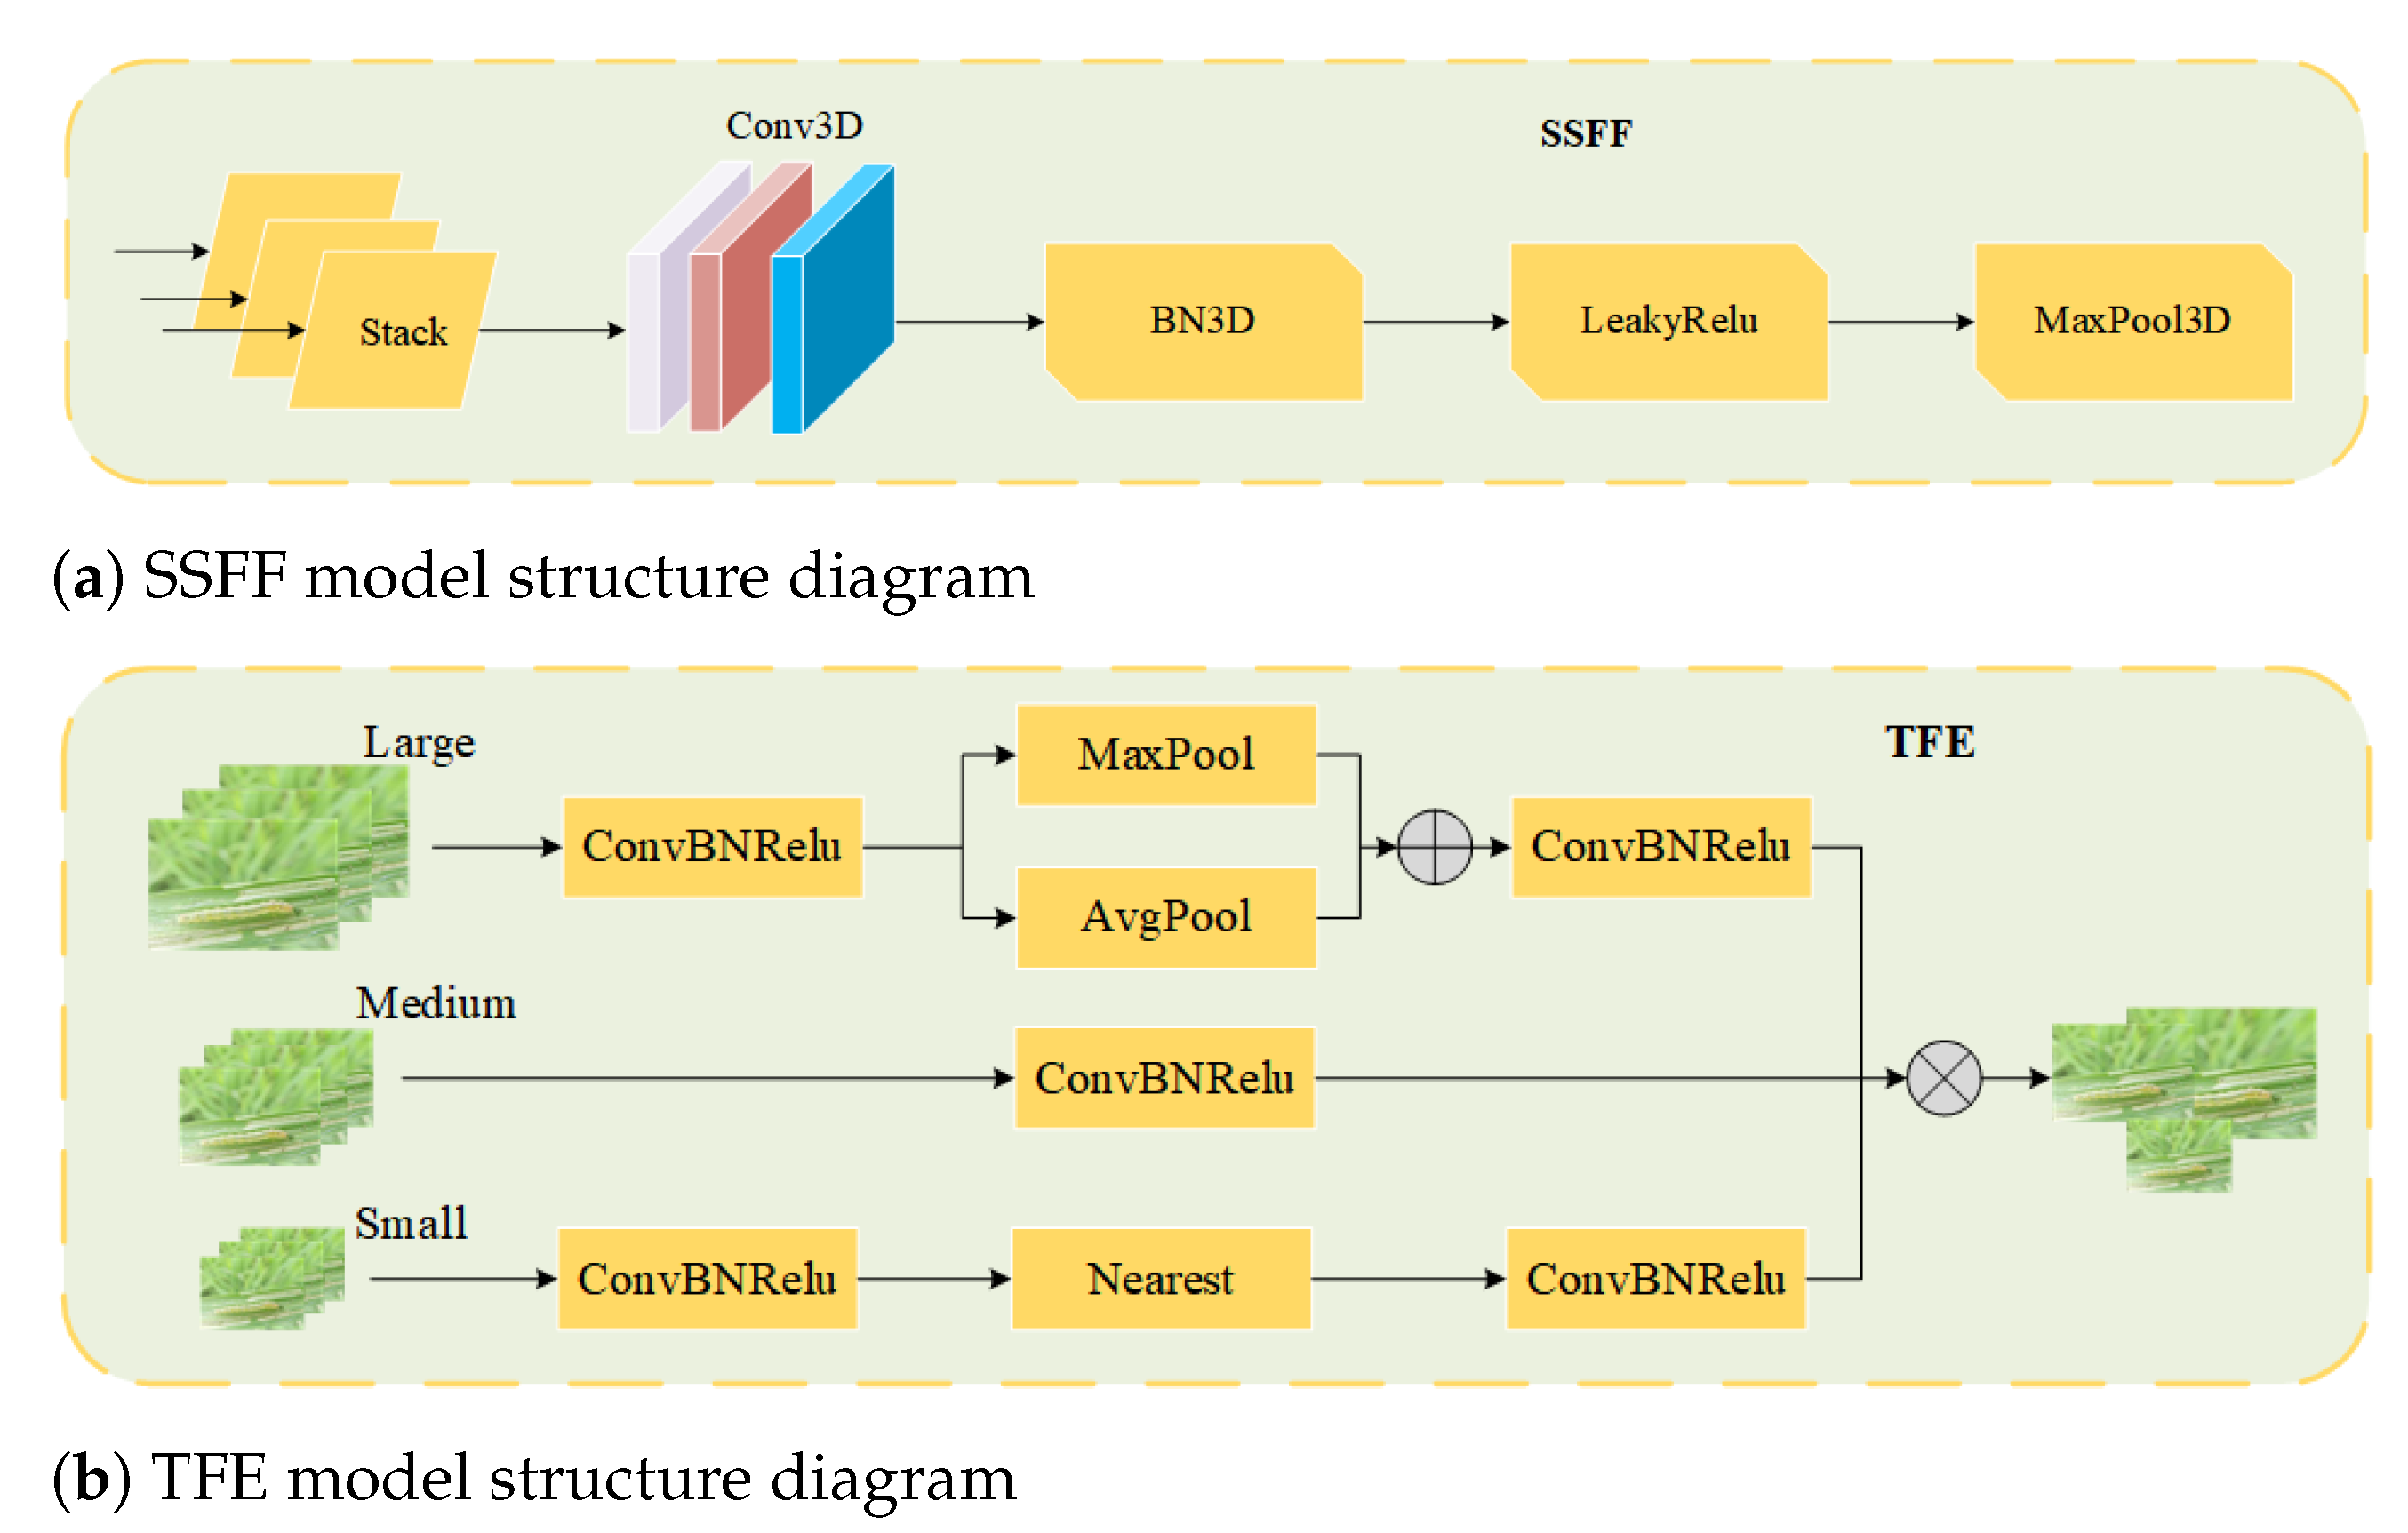
In the original paper, this framework mainly consists of two components: the Scale Sequence Feature Fusion (SSFF) module and the Triple Feature Encoding (TFE) module. The structure of the SSFF module is illustrated in Figure 4a. The SSFF module fully leverages the advantages of shallow feature maps by performing multi-scale fusion on the P3, P4, and P5 outputs extracted from the backbone network. These feature maps capture high-resolution detailed information, medium-scale structural information, and deep semantic information, respectively, effectively covering the diversity of pest sizes and shapes. Specifically, the P3, P4, and P5 feature maps are smoothed by convolution with a series of Gaussian kernels with gradually increasing standard deviations:
F σ ( i , j ) = u v f ( i u , i v ) × G σ ( u , v )
G σ ( x , y ) = 1 2 π σ 2 e x 2 + y 2 2 σ 2
where F σ ( ) denotes the feature map after 2D Gaussian convolution smoothing, and f ( ) represents the original 2D feature map. Subsequently, the multi-scale feature maps are stacked horizontally, and a series of 3D convolution operations are applied to extract their scale sequence features. The TFE module processes large-, medium-, and small-scale features separately to extract the fused feature information. As shown in Figure 4b, let F l , F m and F s denote the feature maps at the three scales, where F R C × H × W . The output of the TFE module, F T F E , is computed as follows:
F l = R ( F l )
F s = R ( F s )
F T F E = C o n c a t ( F l , F m , F s )
where R ( ) represents the downsampling operation. For large-scale feature maps, TFE applies max pooling and average pooling to reduce the spatial dimension and achieve translation invariance. R ( ) represents the upsampling operation, where small-scale feature maps are upsampled using nearest-neighbor interpolation to restore spatial resolution. Finally, the large, medium, and small feature maps are concatenated to achieve multi-scale feature fusion. By combining the strengths of both SSFF and TFE modules, the model can more comprehensively capture multi-scale object features, thereby significantly enhancing the performance of multi-scale object detection tasks.

2.4.2. Dynamic Detection Head Based on Deformable Convolution v3

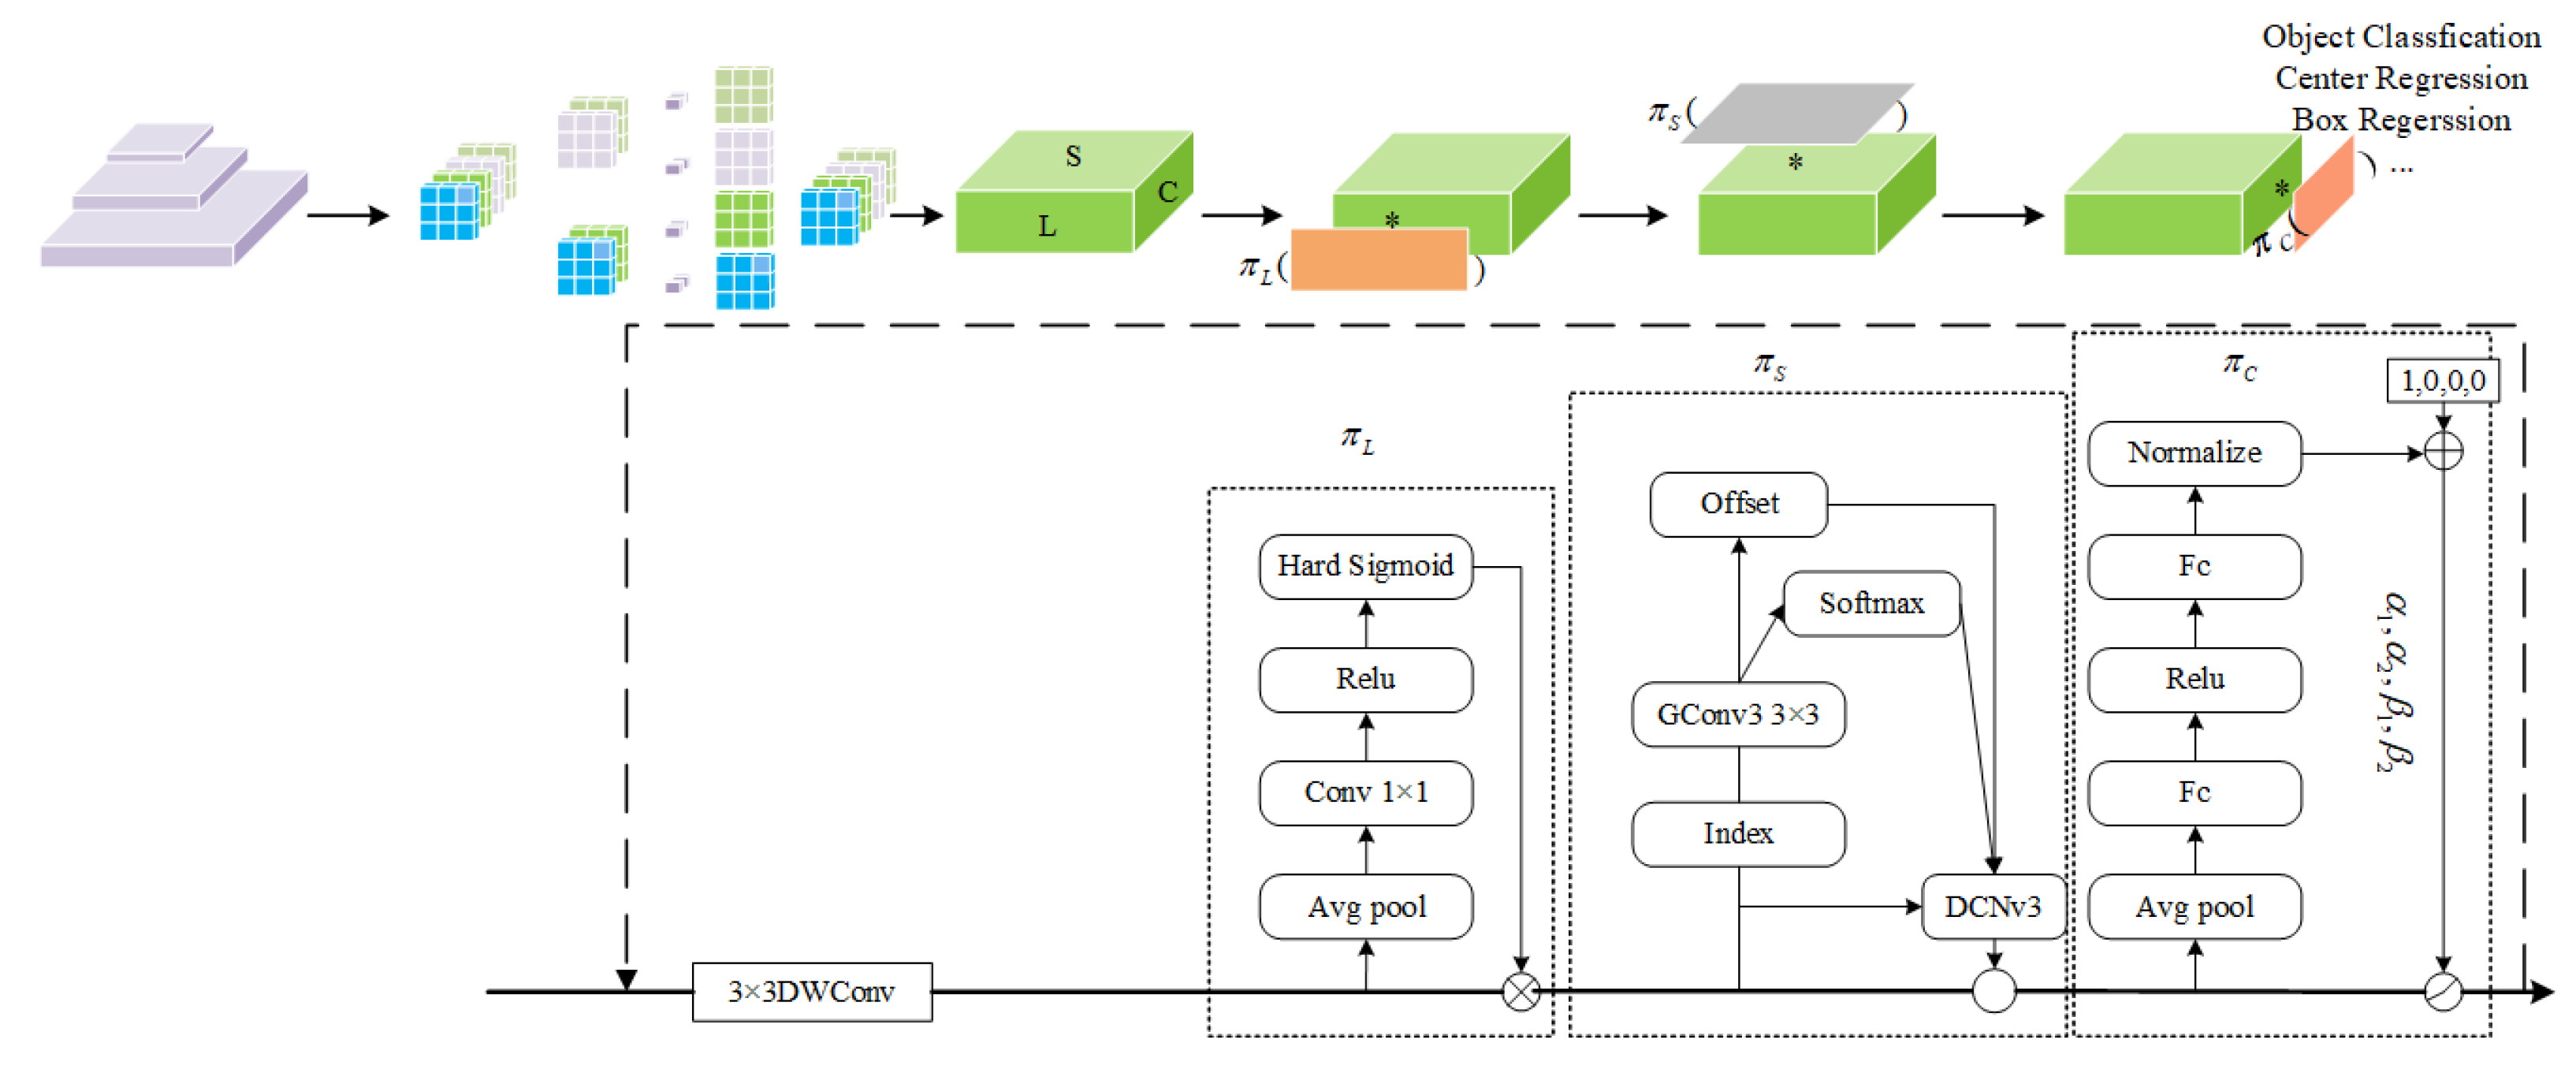
As the final decision-making layer of the detection model, the detection head is responsible for object localization, category prediction, and confidence assessment. Through a decoupled design and a multi-scale feature fusion architecture, the detection head in YOLOv8 demonstrates outstanding performance in general scenarios. However, in the specific context of agricultural pest detection, the detection head faces significant challenges. On the one hand, pests exhibit considerable variations in body size, with scale differences spanning multiple orders of magnitude. On the other hand, within the same pest species, distinct morphological changes occur across different growth stages, leading to intra-class variations that result in a dispersed feature space. Consequently, the detection head may suffer from localization deviations and classification confusion during feature representation and prediction, ultimately degrading detection performance. To address these challenges, we introduce a dynamic detection head (DyHead) [38] and further optimize it by proposing a specialized detection head, DyDCNHead, tailored for pest detection. Its structure is illustrated in Figure 5.
DyDCNHead first extracts feature information at different levels (high, middle, and low) using depthwise separable convolution. It then integrates scale-aware attention, spatial-aware attention, and task-aware attention to operate on various dimensions of the feature tensors across different levels. Assuming the feature maps are F i n x , F i n x R L × S × C , x s , m , l , then:
F x = ϕ 3 × 3 ( F i n x )
where ϕ 3 × 3 ( ) represents the depthwise separable convolution with a 3 × 3 kernel. Scale-aware attention operates along the hierarchical dimension, manipulating different dimensions of the feature tensor across multiple levels:
π L ( F x ) F x = σ ( f ( 1 S C S , C F x ) ) F x
where π L ( ) represents the scale-aware attention function, f ( ) is a linear function implemented by a 1 × 1 convolution layer, and σ ( ) represents the hard-sigmoid function, which is defined as follows:
σ ( x ) = max ( 0 , min ( 1 , x + 1 2 ) )
Spatial-aware attention continuously focuses on the discriminative regions that exist jointly between positions and feature hierarchies:
π S ( F x ) F x = 1 L l = 1 L k = 1 K w l , k F x ( l ; p k + Δ p k ; c ) Δ m k
where K represents the number of sparse sampling positions, p k + Δ p k is the self-learned spatial offset, and Δ m k is the self-learned importance scalar at position p k . In the spatial-aware attention module, DyDCNHead introduces deformable convolution v3 (DCNv3) [39] to replace traditional convolution operations. Compared to DCNv2, DCNv3 employs learnable dynamic sampling points, making it more efficient in handling large-scale variations and diverse target morphologies in pest detection scenarios. Additionally, it can aggregate features across layers at the same spatial location, further enhancing the model’s discriminative ability and object detection accuracy. The ability of DCNv3 convolution kernels to adaptively select and weight the most discriminative regions mainly relies on the choice of sampling offsets and modulation masks. In the DyDCNHead, we generate the required offsets and sampling weights for deformable convolution through group convolution, while applying softmax normalization to the modulation mask to further optimize the importance distribution of sampling points. Subsequently, the generated offsets and masks are fed into the DCNv3 convolution layer. The DCNv3 kernels then adjust the position of each sampling point according to the offsets and weight the sampled values using the mask, ultimately producing the output feature map. Task-aware attention is applied to channel features, guiding different feature channels to focus on different tasks based on the target’s response under different convolution kernels as follows:
π C ( F x ) F x = max ( α 1 ( F x ) F C + β 1 ( F x ) , α 2 ( F x ) F C + β 2 ( F x ) )
where F C is the slice of the C-th channel, and [ α 1 , α 2 , β 1 , β 2 ] T = θ ( ) is a hyperparameter used for learning the activation threshold.

2.4.3. Edge Fusion Stem

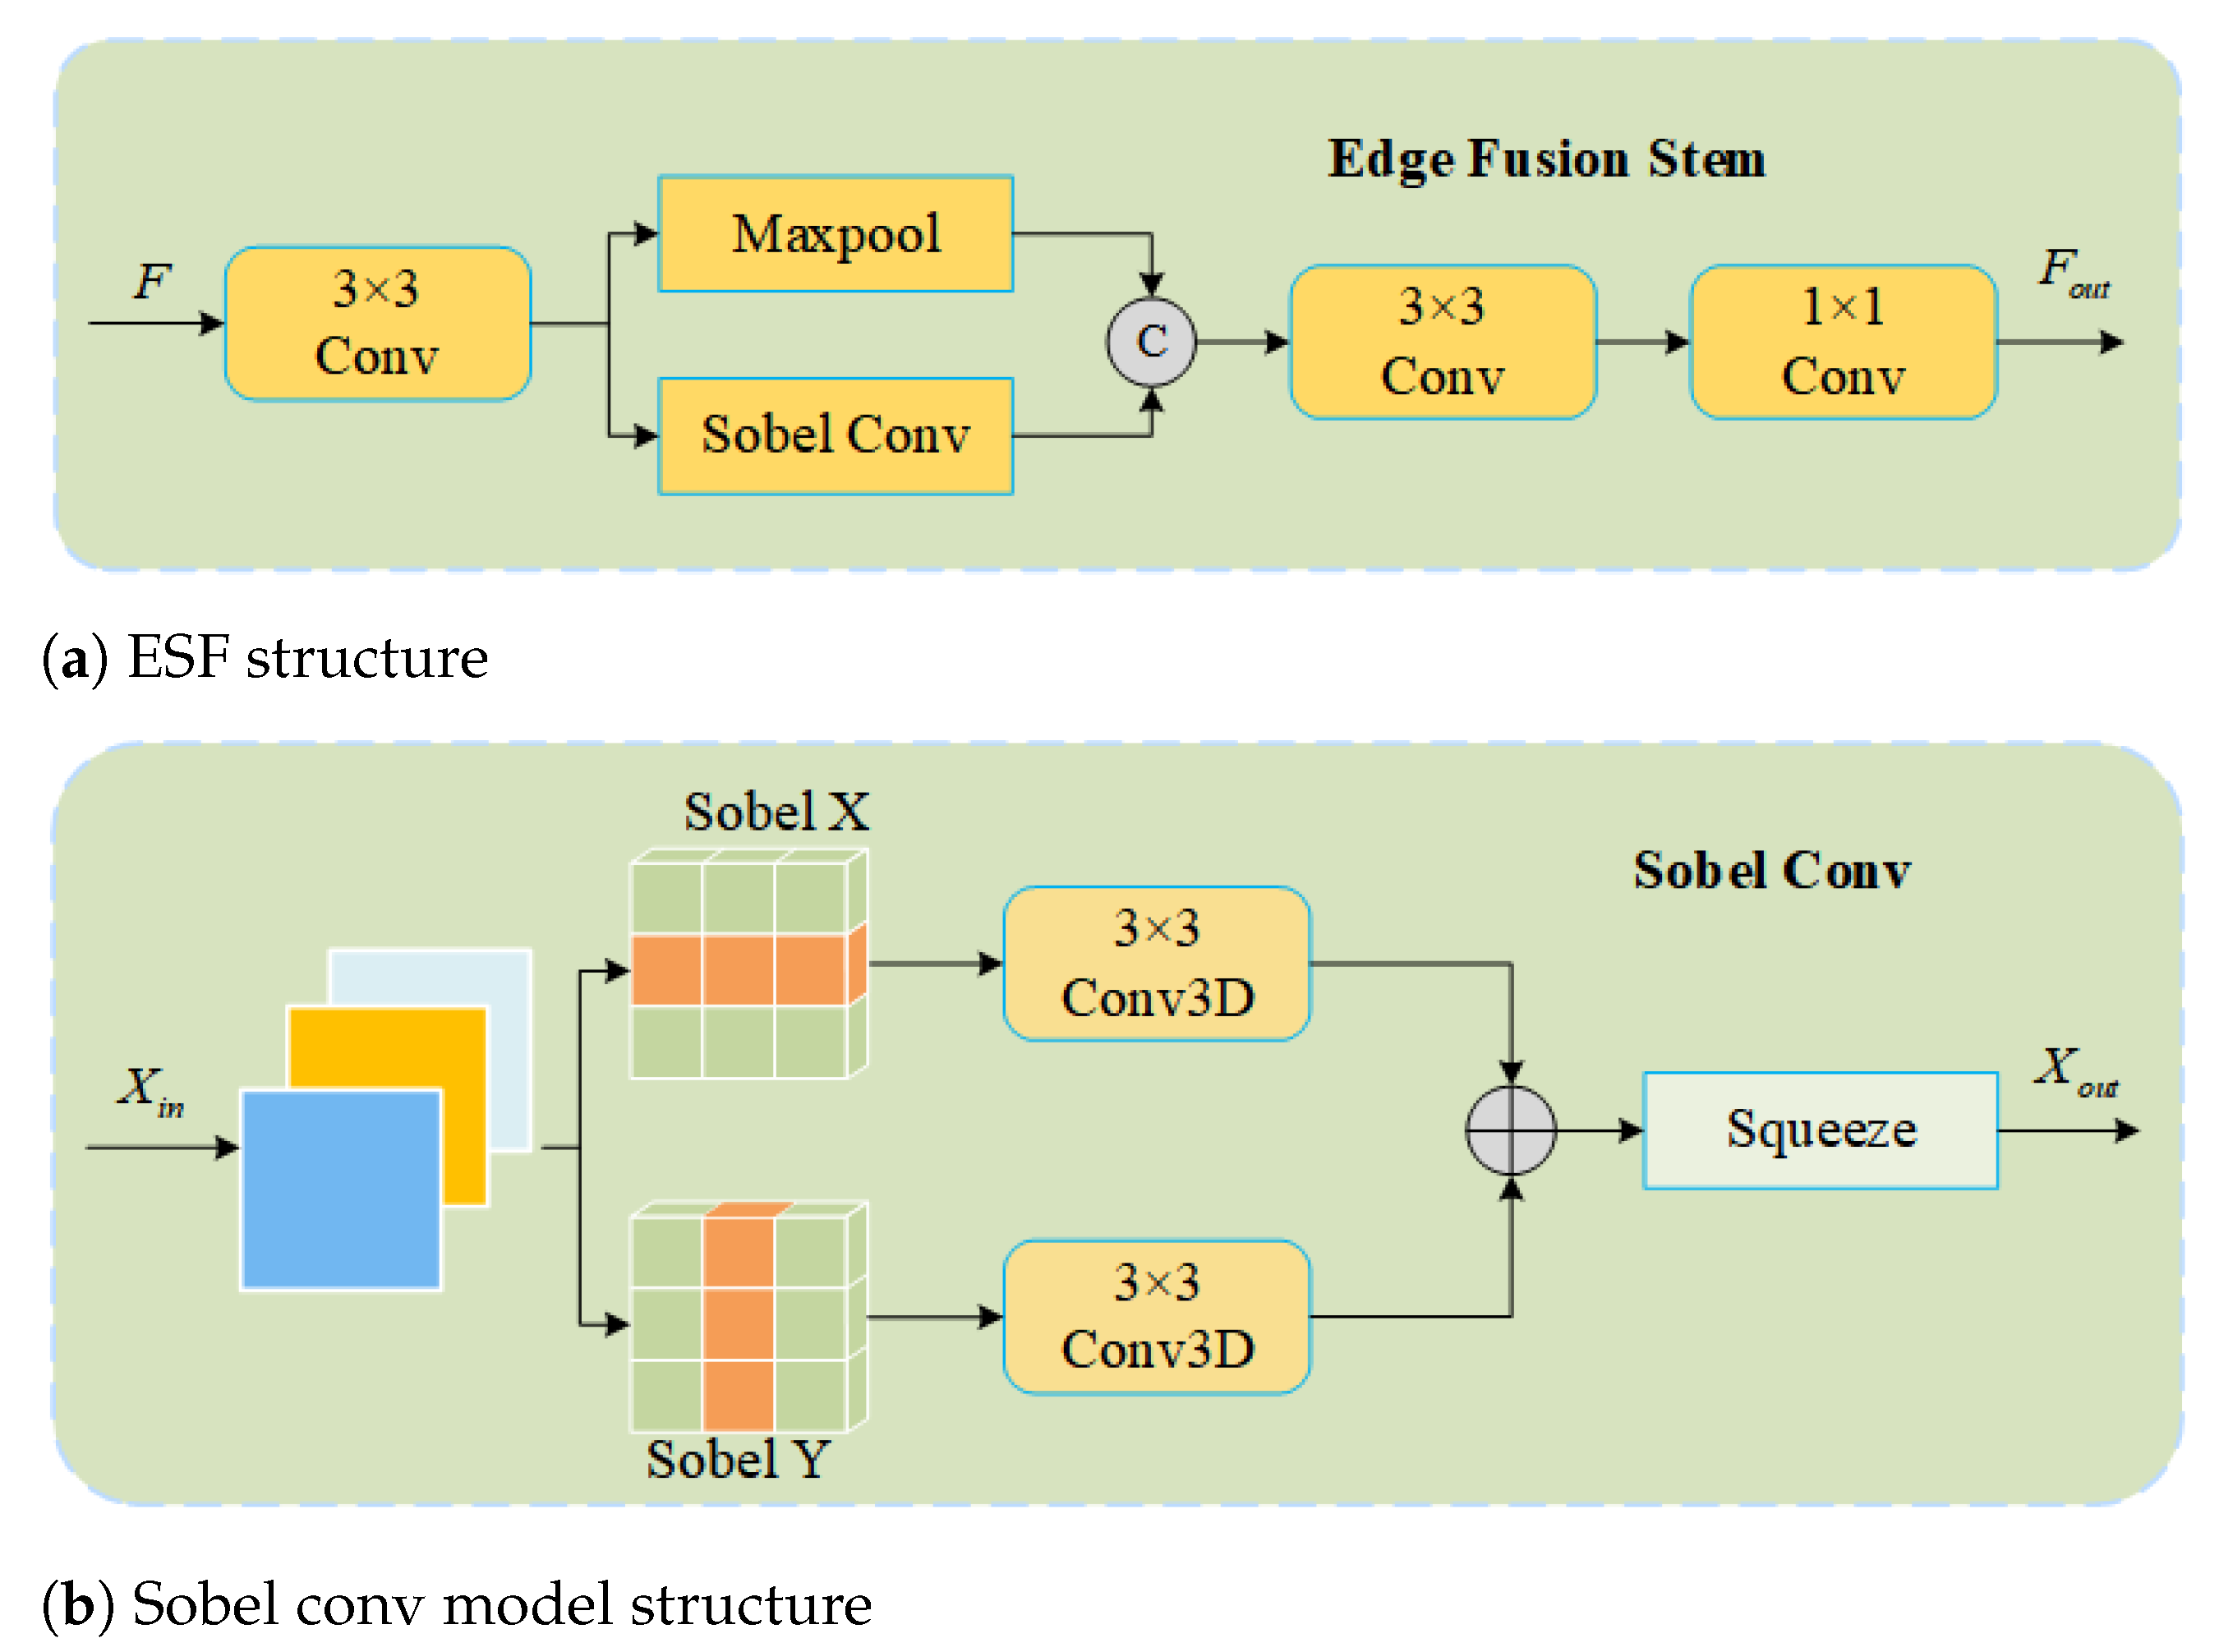
YOLOv8’s shallow feature maps have high resolution characteristics, which retain rich spatial detail information, including low-level visual features such as edges and textures. However, in pest detection tasks, relying solely on 3 × 3 convolution operations to capture local details from shallow feature maps often yields poor results. This is primarily because many pests exhibit characteristics highly similar to their surrounding environment, a feature known as mimicry or camouflage. The presence of camouflage reduces the distinction between the pest’s edge contour and the background, thereby diminishing feature extraction effectiveness. To address this issue, we propose an Edge Feature Fusion Module (Edge Fusion Stem), aimed at enhancing fine-grained edge information for better handling of complex detection tasks. Its structure is shown in Figure 6.
EFS extracts the edge features of the feature map using Sobel convolution and retains the local spatial information of the image through pooling operations. Assuming the input feature map is F, F R C × H × W , the processing procedure of EFS is as follows:
F 1 = φ 3 × 3 ( F )
F 2 = φ 3 × 3 ( C a t [ S o b e l ( F 1 ) , P o o l ( F 1 ) ] )
F o u t = φ 1 × 1 ( F 2 )
where φ 3 × 3 represents a 3 × 3 convolution, and φ 1 × 1 represents a 1 × 1 convolution. First, the feature map goes through the first 3 × 3 convolution layer to output feature map, achieving channel conversion and downsampling. Then, F 1 is processed using operations S o b e l ( ) and P o o l ( ) to extract edge information and local spatial information, respectively. Next, the feature maps from the two branches are concatenated. Finally, a 3 × 3 convolution is applied to the concatenated feature map, followed by a 1 × 1 convolution, resulting in the output feature map.
Sobel convolution performs edge detection by applying the Sobel filter to extract horizontal and vertical information from the image. Let the Sobel convolution kernel in the horizontal direction be defined as K x , and the Sobel convolution kernel in the vertical direction be defined as K y . For the input image X i n , X i n R C × H × W , we first expand the Sobel convolution kernels across the channels to make them applicable to multi-channel inputs as follows:
K x e x t = exp a n d ( K x , C ) ; K y e x t = exp a n d ( K y , C )
Here, exp a n d ( , C ) represents the extension of the Sobel kernel to all channels. Next, the Sobel edge response is calculated using the following 3 × 3 3D depthwise separable convolution:
S o b e l ( x ) = ϕ 3 × 3 ( x , K x e x t ) ; S o b e l ( y ) = ϕ 3 × 3 ( y , K y e x t )
S o b e l ( x ) and S o b e l ( y ) represent the Sobel convolution operations in the horizontal and vertical directions, respectively. Then, during the forward propagation process, the Sobel convolutions in the horizontal and vertical directions are combined and output as follows:
X c = S o b e l ( x ) + S o b e l ( y )
where X c R C × H × W , finally, we remove the excess image dimensions to obtain the final Sobel output as follows:
X o u t = F l a ( X c )
F l a ( ) represents the operation of removing excess dimensions, X o u t R C × H × W , X o u t is the final output feature maps. This process uses the Sobel operator to extract edge features from the image, allowing each channel to independently perform Sobel edge detection, thereby enhancing the model’s ability to perceive edge information.

3. Experiments and Analysis

3.1. Experimental Environment

The experiments provided in this paper were conducted on Windows 11, with an Nvidia GeForce RTX 3090ti 24G GPU, an Intel(R) Core(TM) i5-13600kf CPU @ 3.5 GHz, and 32 GB of system memory. Python 3.9 was used as the programming language, and the Pytorch framework version is 2.0.1. The model training parameters are shown in Table 2.

3.2. Metrics

For object detection, mean Average Precision (mAP), Precision (P), and Recall (R) are used to evaluate the model’s detection accuracy, while the number of parameters (Parameter) and computational cost (GFLOPs) are used to evaluate the model’s complexity.
Precision: The ratio of the number of true positive samples detected by the model to the total number of samples classified as positive by the following model:
P = T P T P + F P × 100 %
Recall: The ratio of the number of true positive samples successfully detected by the model to the total number of actual positive samples as follows:
R = T P T P + F N × 100 %
Accuracy: The ratio of the number of correctly classified samples by the model to the total number of samples in the test set. In object detection tasks, mean Average Precision (mAP) can be used as a metric for accuracy.
A P = 0 1 P ( R ) d R
m A P = i = 1 k A P i k × 100 %
where T P represents the probability that a predicted positive sample is actually a positive sample, F P represents the probability that a predicted positive sample is actually a negative sample, F N represents the probability that a predicted negative sample is actually a positive sample, and k represents the number of classes.
The F 1 score is the harmonic mean of precision (P) and recall (R), providing a comprehensive measure of the model’s performance in detection tasks. It is calculated as follows:
F 1 = 2 × P × R P + R × 100 %

3.3. Ablation Study

To validate the feasibility of the proposed method, we conducted ablation experiments on the IP102 dataset. The experimental results are shown in Table 3. Table results demonstrate that the proposed ASF (SSFF + TFE), DyDCNHead, and EFS modules improve detection performance, with the performance improvement being most significant when all three methods are combined. Firstly, we introduced a novel feature fusion approach. From the performance of the ASF module, its mAP50 increased by 1.1%, indicating that the ASF module is highly effective in adapting to pest features of different scales. This method fuses shallow features of different scales with deep features, showing excellent detection performance. Based on this, we further optimized the detection head. The experimental results demonstrate that DyDCNHead exhibits high efficiency in pest detection tasks characterized by large scale variations and diverse target morphologies. It not only further improves mAP50 but also slightly reduces the number of model parameters. This improvement is mainly attributed to the introduction of depthwise convolution before predicting the sampling offsets and modulation masks, as well as the use of group convolution during the prediction stage. Although the computational cost increases, the increment is relatively small and remains within an acceptable range. From the performance of the EFS module, it can be observed that, despite the limited increase in mAP50 based on the first two improvements, the performance of the model is gradually approaching a bottleneck, making further significant improvements difficult. However, the experimental results of adding the EFS module alone still demonstrate good performance. Finally, our proposed pest detection model, IP-YOLOv8, based on the original YOLOv8s model, achieved a 2.2% improvement in mAP50, a 1.3% improvement in mAP50:95, a 3.1% increase in Precision (P), and a 1.5% increase in Recall (R). These results indicate that the proposed method effectively adapts to complex field pest detection tasks, offering robust technical support for precision agriculture.

3.4. Model Comparison Experiment

To demonstrate the superiority of the proposed method, we conducted a comparison analysis of different models on the IP102 dataset. Table 4 shows that IP-YOLOv8 achieves superior performance compared to other YOLO variants. Our method attains the highest mAP50 of 59.2%, representing approximately 2% improvement over most mainstream models. The early YOLOv3 model, although having lower model complexity, showed relatively low detection accuracy. However, in recent years, mainstream YOLO models have improved detection accuracy, though there is still room for optimization in pest and disease detection tasks. Most mainstream models achieve detection accuracy of around 57% for this task. In comparison, our proposed IP-YOLOv8 achieves an improvement of about 2%, with the best mAP50 of 59.2% in all experiments. Although the model complexity slightly increased in terms of model parameters and computation, it still remains within an acceptable range, achieving a good balance between detection accuracy and model complexity.

3.5. Comparison with Current Methods

To validate the effectiveness of the proposed method, we compared it with several representative pest detection methods based on the IP102 dataset over the past three years. The results are shown in Table 5. Although differences in experimental training environments and settings exist among these methods, the overall comparison still provides an objective reflection of the advantages and limitations of our approach relative to existing methods. First, in terms of detection accuracy, some traditional YOLO variants, such as PestLite, YOLO-Pest, and C3M-YOLO, achieve mAP50 values around 57%. The Transformer-based CAFPN performs the worst, with an mAP50 of only 49.8%, indicating that attention-based feature fusion methods still have considerable room for improvement in pest detection tasks. On the other hand, DCF-YOLOv8 achieves the highest mAP50 of 60.8%, but its parameter size reaches 25.8 M, approximately twice that of our method, making it challenging to balance accuracy and complexity. In contrast, the proposed method achieves mAP50 and mAP50:95 of 59.2% and 38.4%, respectively, performing better than most existing methods overall. Second, regarding model complexity, Transformer-based methods such as CFR and CAFPN clearly have high computational cost and parameter counts, which greatly limit their practical application in pest detection scenarios. In comparison, our proposed method requires only 11.1 M parameters and 29.1 G FLOPs. It maintains relatively low model complexity while achieving high detection accuracy, demonstrating practical applicability and reflecting its potential value for widespread adoption in pest detection research.

3.6. Visualization Analysis

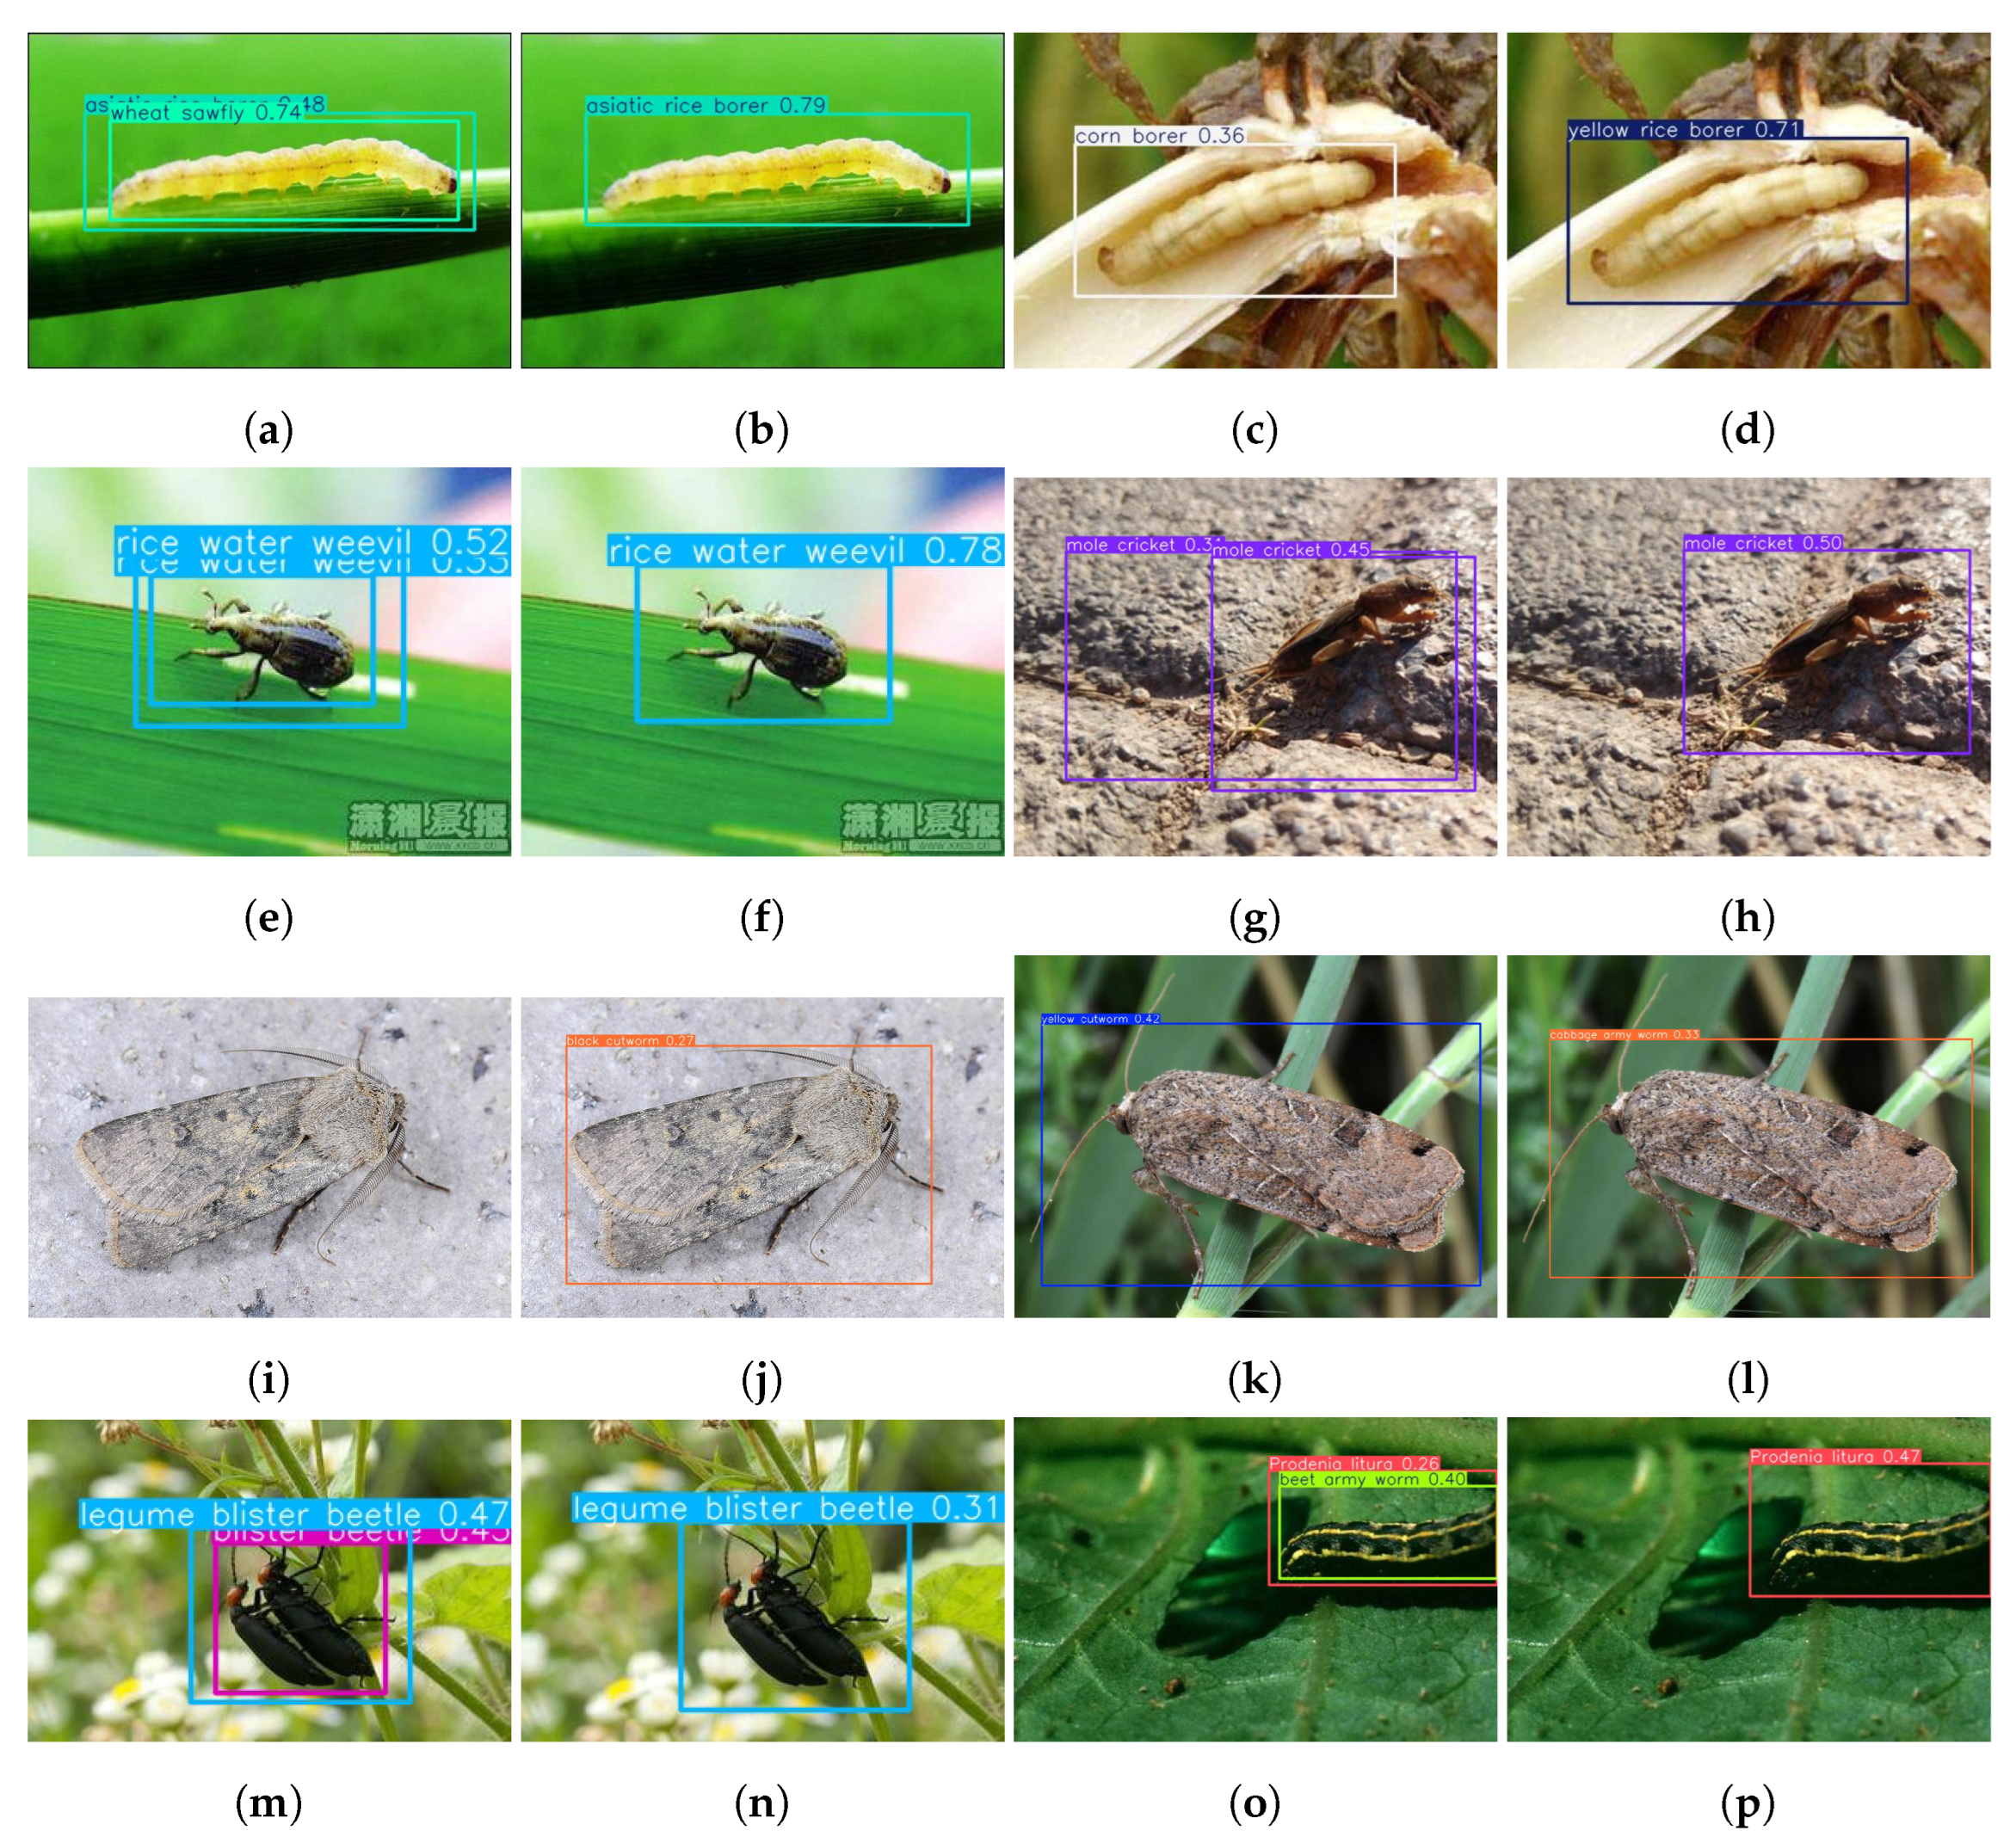
Figure 7 shows the detection results of the YOLOv8s model and the IP-YOLOv8 model on the IP102 dataset. From the visual results, it can be observed that the major challenge of this dataset lies in pest classification. Although the YOLOv8s model effectively locates pest targets, there are noticeable misclassification issues. Additionally, the original YOLOv8s model also exhibits a problem of duplicate detections, where multiple detection results are generated for the same pest target. In contrast, the IP-YOLOv8 significantly improves classification accuracy, primarily due to the ASF module, which fully leverages the high-resolution advantage of shallow feature maps to enhance feature extraction. Meanwhile, DyDCNHead effectively handles large-scale variations and diverse pest morphologies. Notably, in the cases shown in Figure 7g,i, due to the interference of pest camouflage, YOLOv8s tends to miss detections. The improved IP-YOLOv8 model, however, enhances pest recognition performance in complex backgrounds by utilizing the EFS module to enhance edge information in the features.
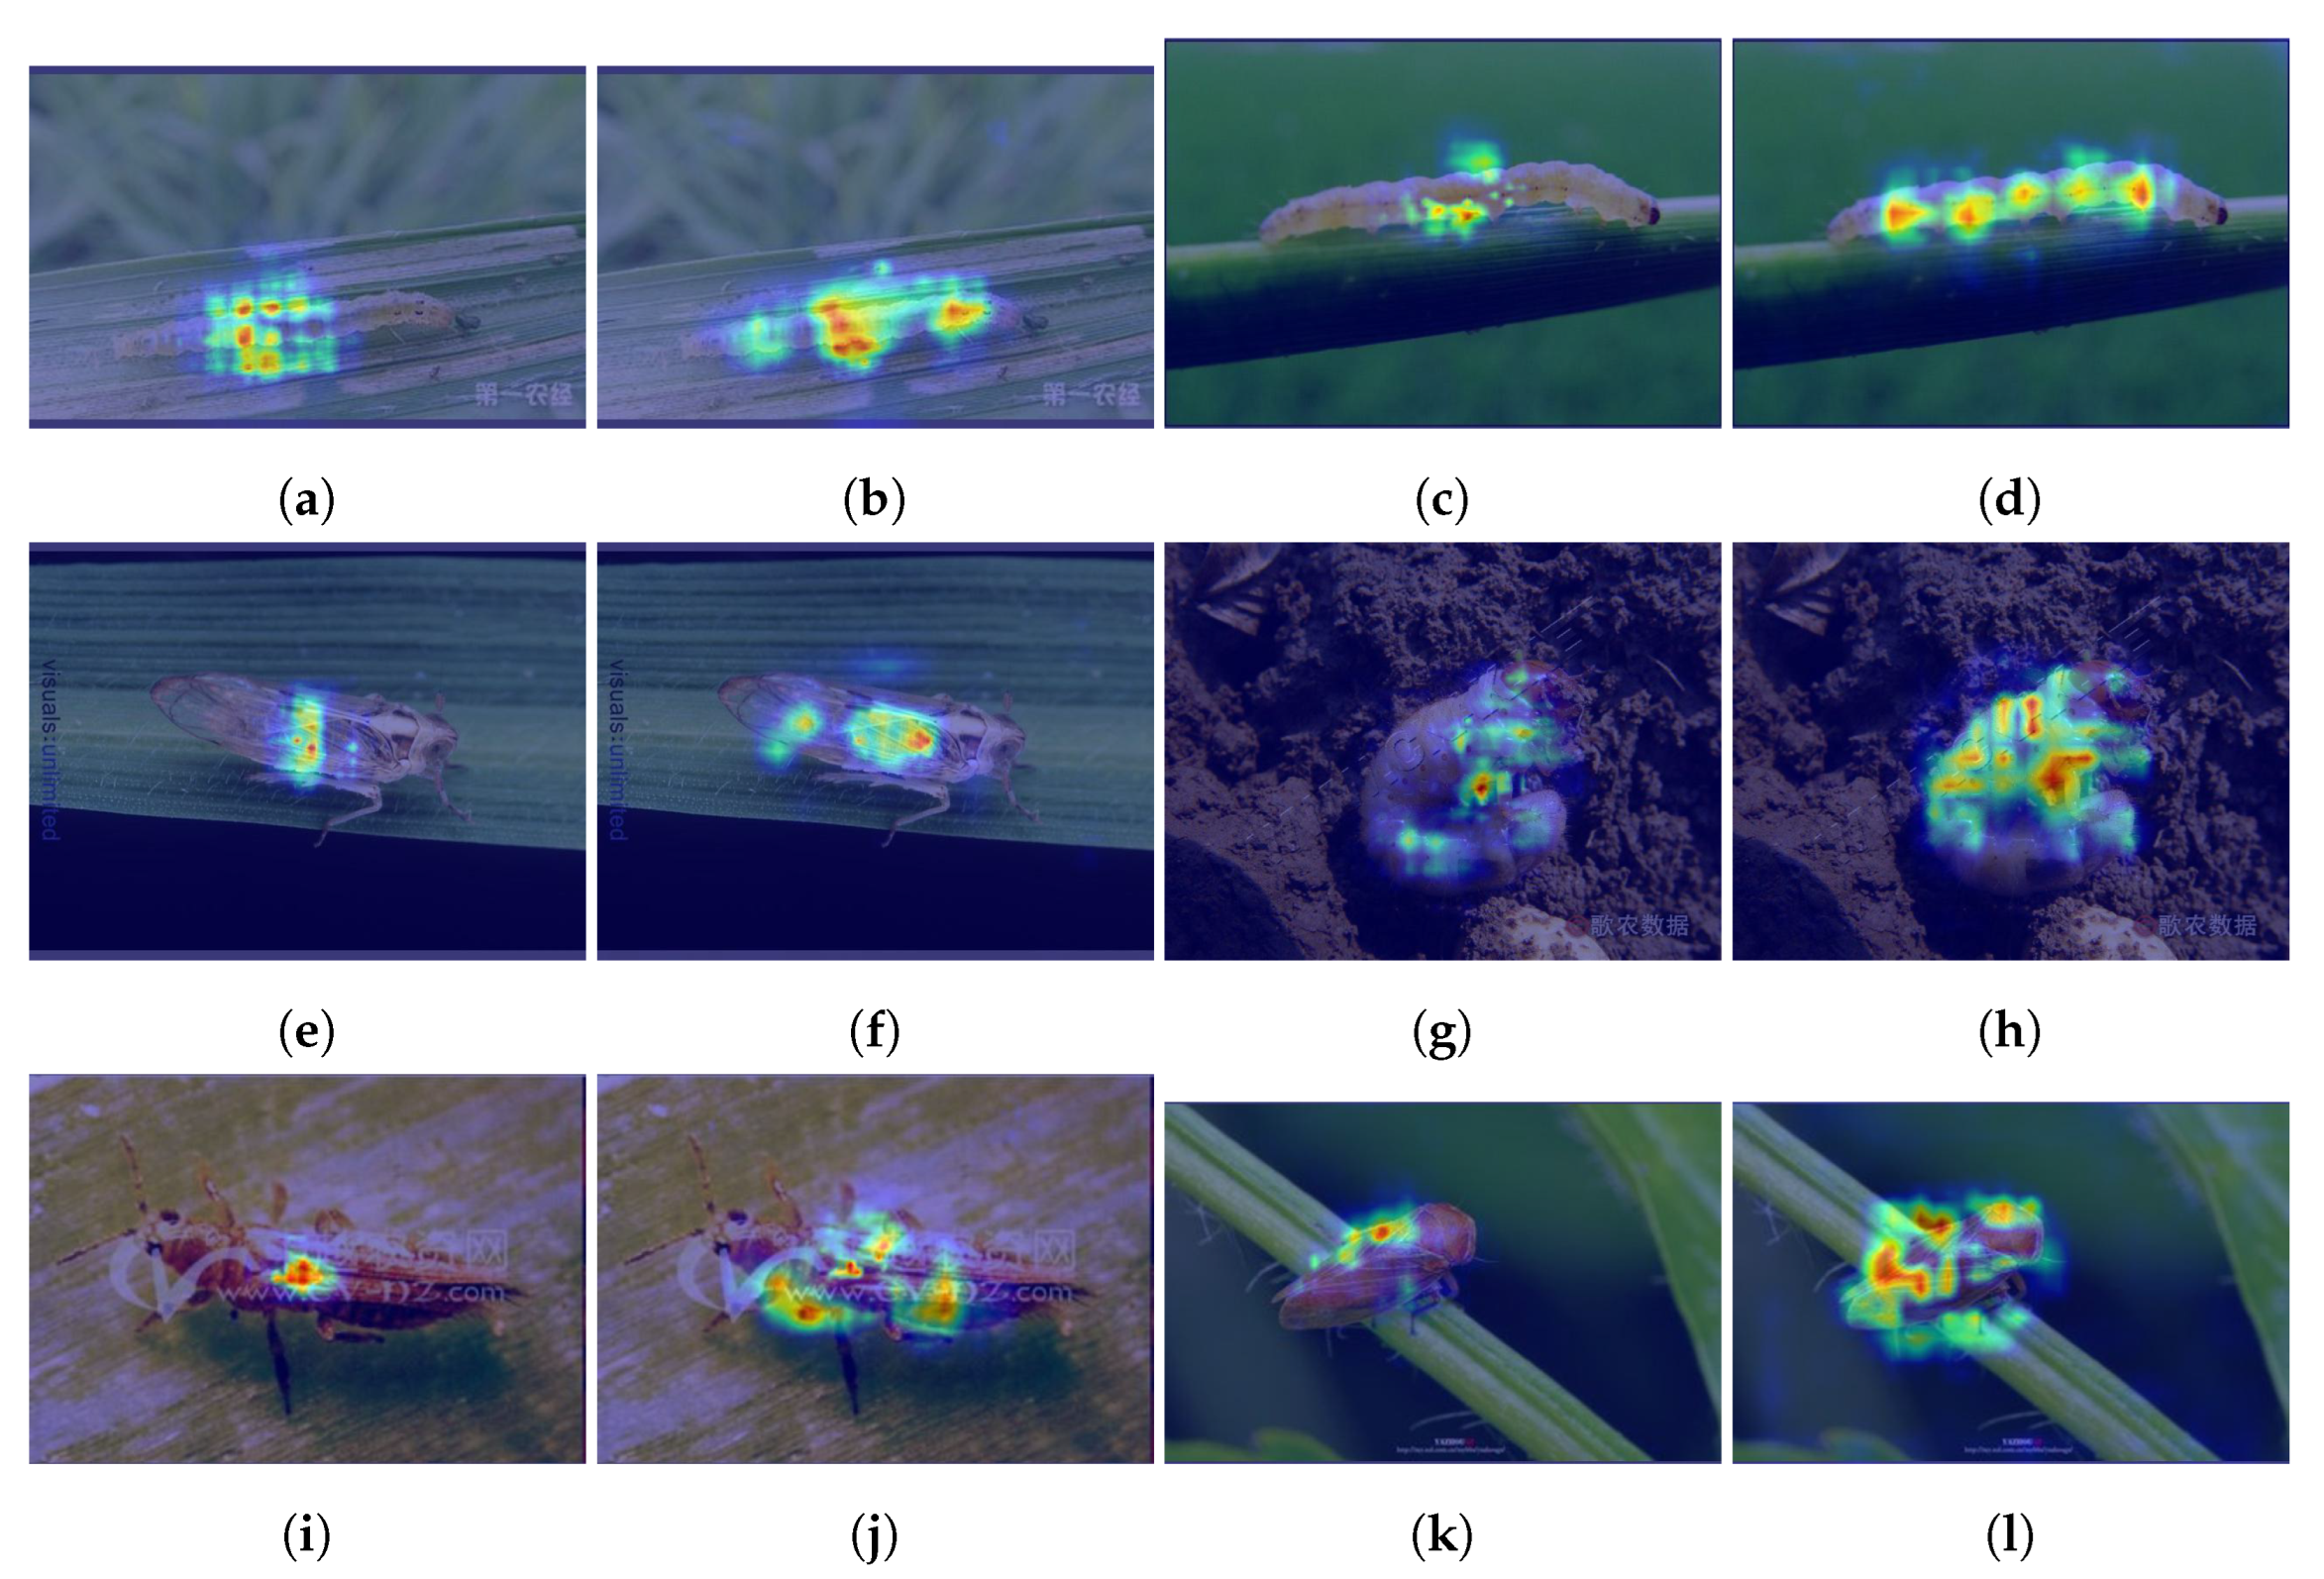
Figure 8 visualizes the comparison of attention areas and pest target distributions of the two models via heatmaps, where the color depth is positively correlated with the model’s attention. From the heatmap distribution, it is clearly observed that the improved IP-YOLOv8 model exhibits more extensive and stronger feature responses in the pest target areas. This phenomenon indicates that, compared to the baseline model, IP-YOLO has achieved a more powerful receptive field and more precise feature focusing ability through structural optimization, enabling it to effectively capture the discriminative features of pest targets.

3.7. Comparison Experiments on the Pest24 Dataset

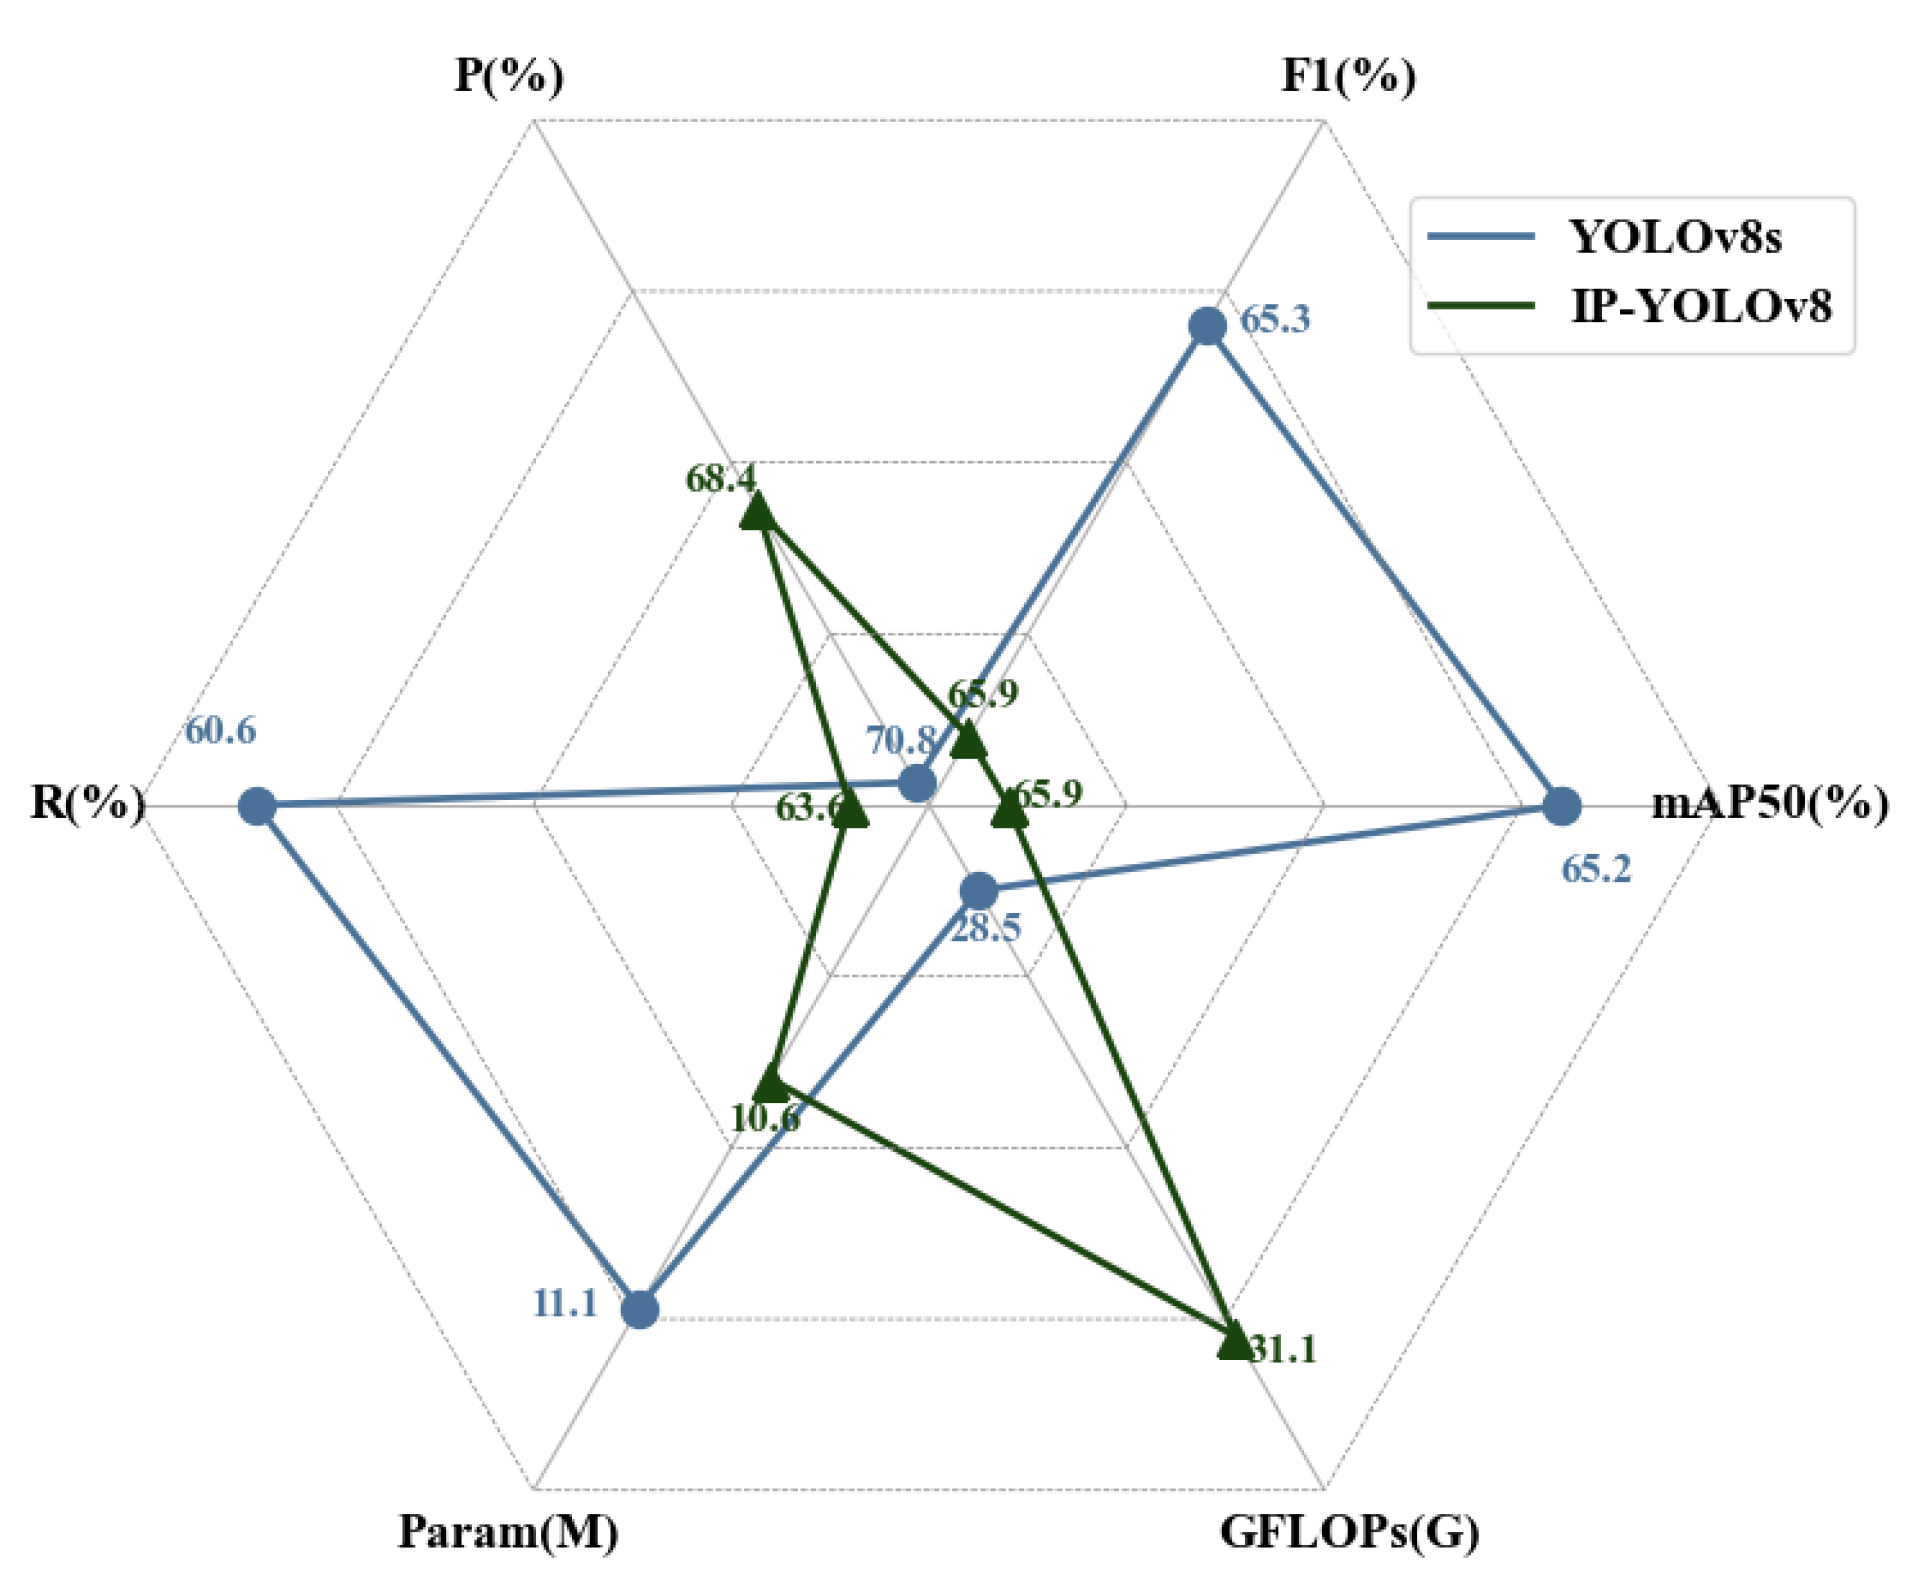
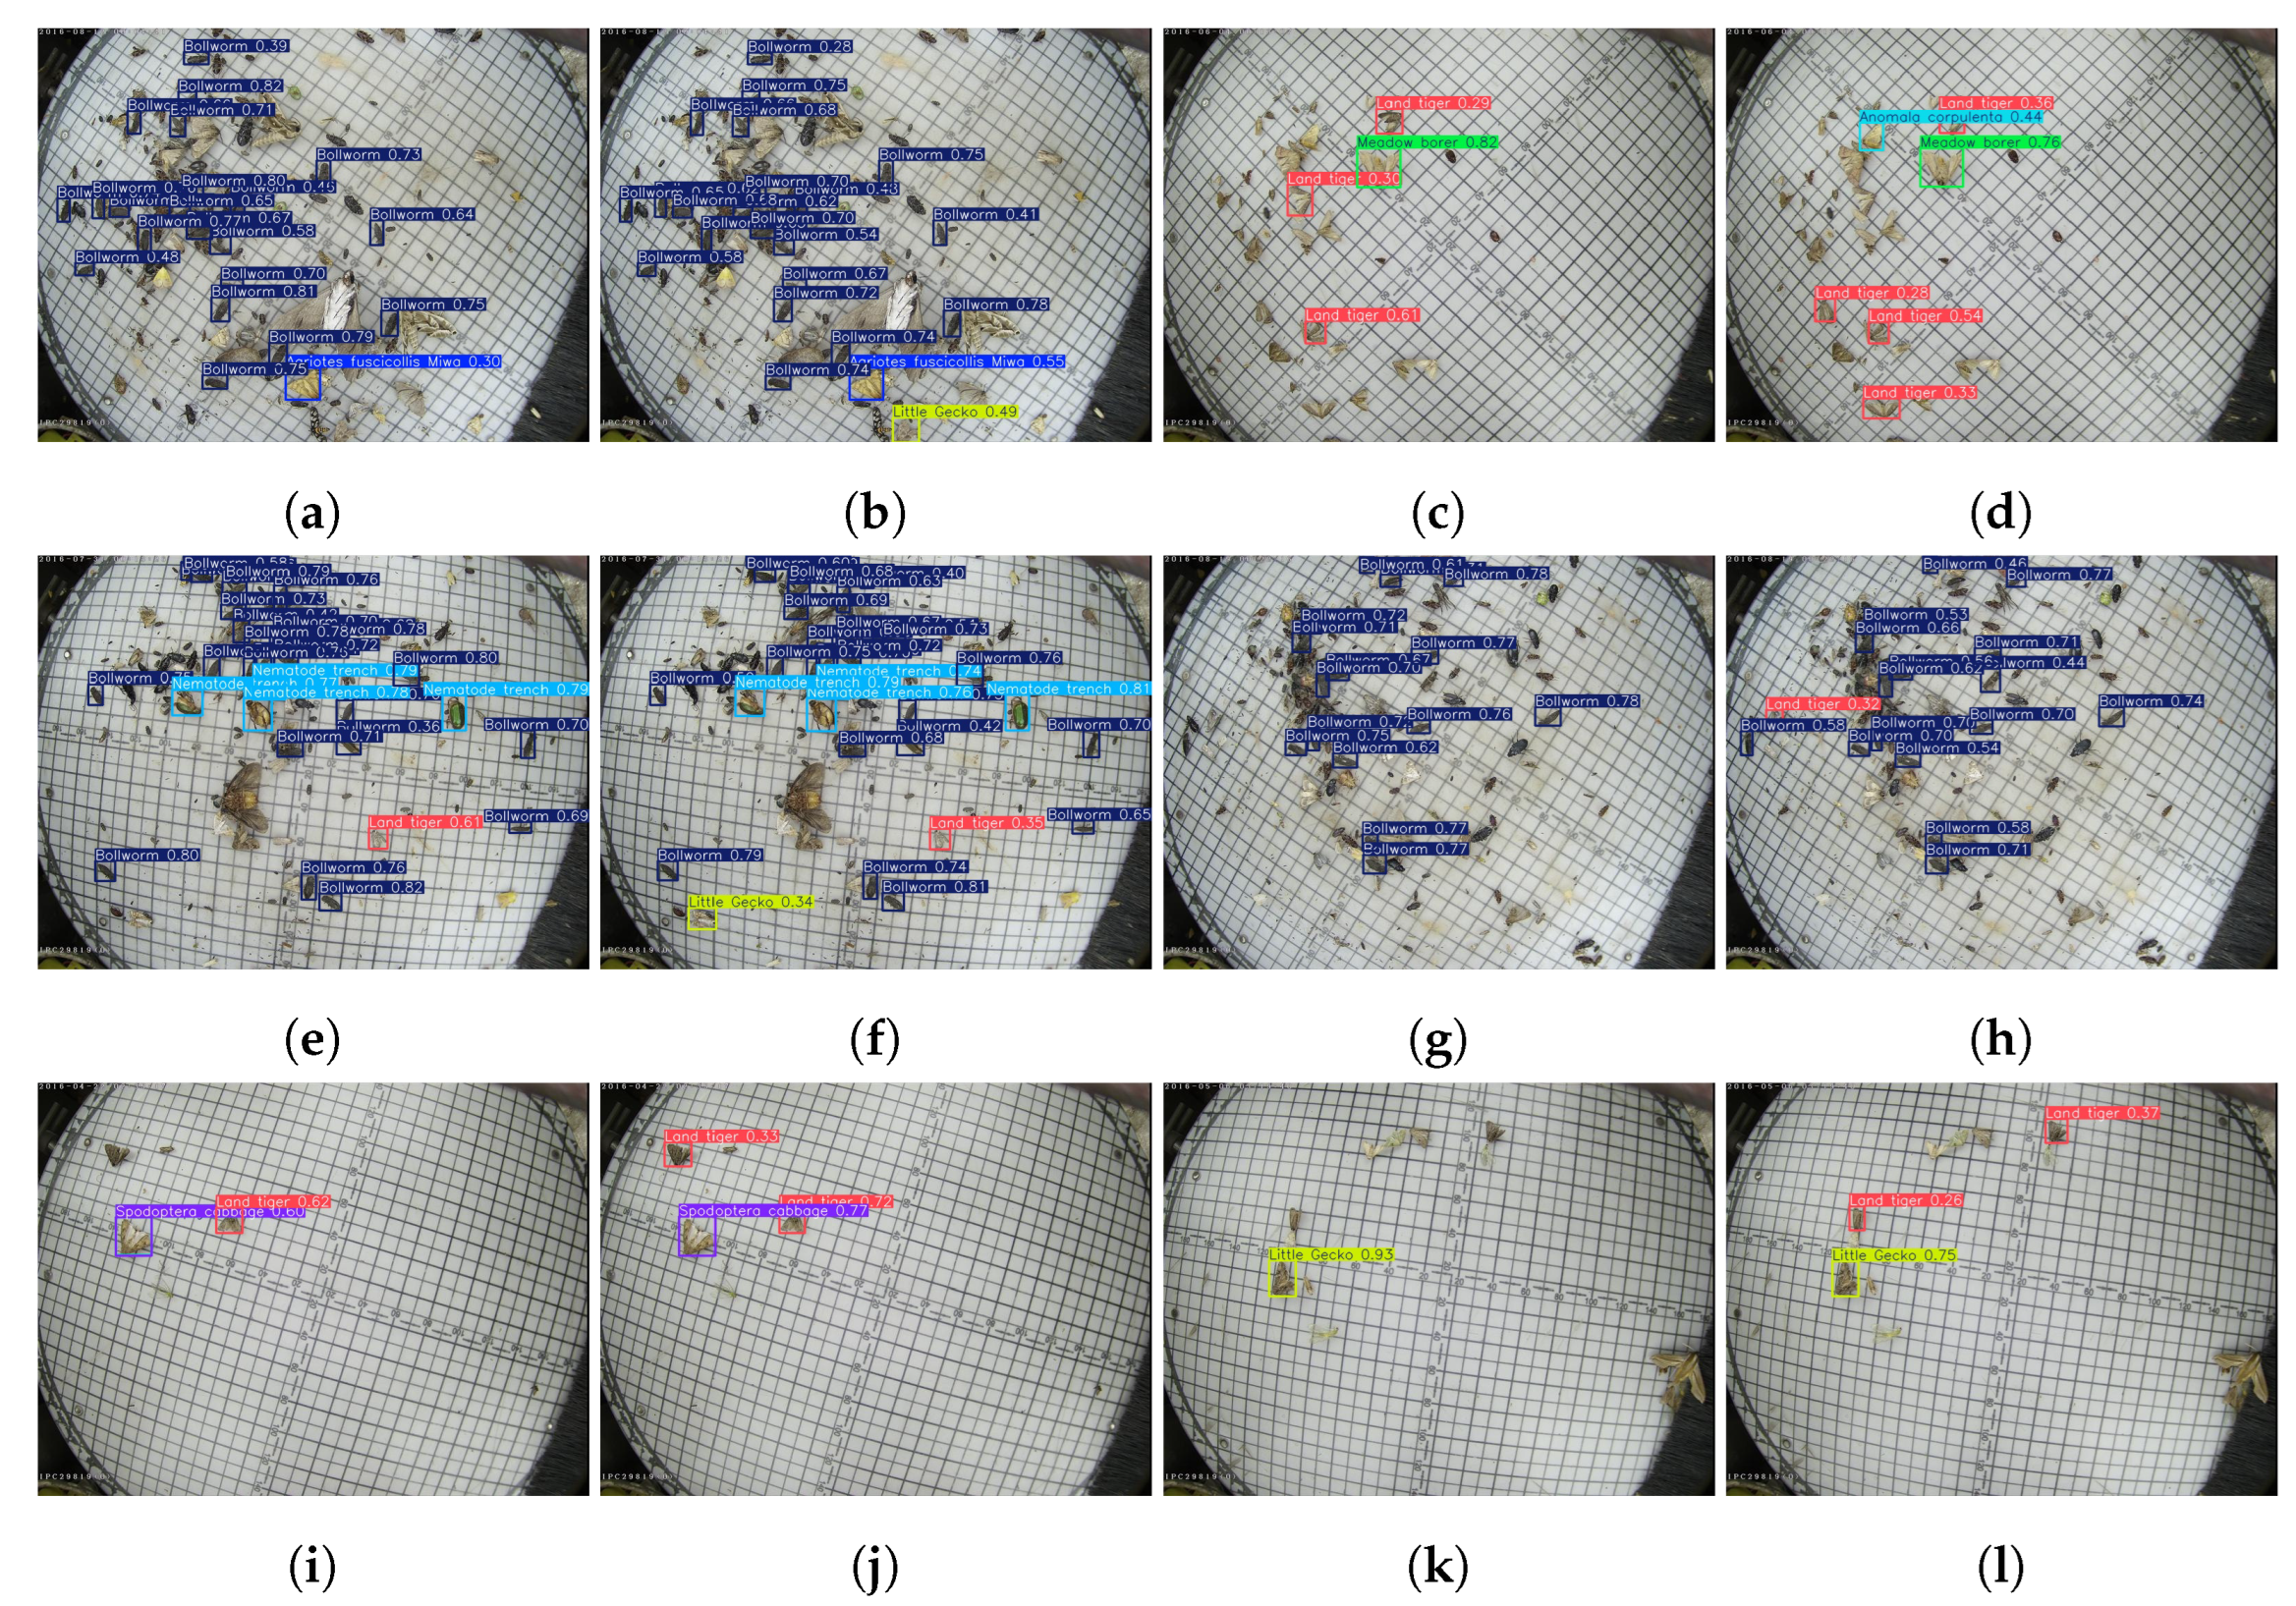
To evaluate the generalization performance of the model, we conducted a comparative analysis on the Pest24 dataset [43]. Unlike the IP102 dataset, the pest samples in the Pest24 dataset were collected from real field environments, where target sizes are generally smaller and exhibit highly dense distributions. As shown in Table 6, IP-YOLOv8 not only demonstrates significant performance improvements on the IP102 dataset but also achieves remarkable results in the densely packed small-target scenario of the Pest24 dataset. Compared to the baseline model YOLOv8s, IP-YOLOv8 improves the mAP50 metric by 0.7% and increases the F1-score by 0.6%. Additionally, the radar chart in Figure 9 provides an intuitive comparison, illustrating six key evaluation metrics of the model. It is evident that IP-YOLOv8 achieves improvements in recall, mean average precision (mAP), F1-score, and parameter count. Furthermore, the visualization results in Figure 10 further validate the model’s performance on the Pest24 dataset. Due to the small size and high density of pests in this dataset, there are numerous missed detections across models. However, compared to YOLOv8s, IP-YOLOv8 exhibits more robust performance, demonstrating stronger generalization capability and practical applicability. This demonstrates that IP-YOLOv8 can provide a reliable technical solution for pest detection in complex environments.

4. Conclusions

With the continuous development of precision agriculture technology, establishing a standardized pest diagnosis system has become a crucial approach to replacing traditional manual monitoring methods. This system not only facilitates real-time dynamic monitoring of agricultural pests but also fundamentally reduces reliance on traditional labor-intensive methods, enhancing both the intelligence and precision of pest management. However, achieving efficient real-time dynamic monitoring still depends on accurate pest detection and classification techniques. To address the key challenges in agricultural pest detection, this study proposes a series of innovative solutions.
Firstly, to address significant differences in pest body sizes, we introduced a multi-scale feature fusion architecture that integrates the Scale Sequence Feature Fusion (SSFF) module and the Triple Feature Encoding (TFE) module. Through a cross-layer feature interaction mechanism, it effectively fuses shallow detailed features with deep semantic features, enhancing the model’s multi-scale representation capability. Secondly, to tackle the challenge of highly variable pest morphology, we proposed a dynamic detection head based on Deformable Convolution v3 (DCNv3). Through a dynamic sampling mechanism, this detection head adaptively adjusts the receptive field, enabling the model to accurately capture pest features of different scales and shapes, greatly improving detection robustness. Finally, to mitigate the background confusion caused by pest camouflage, we introduced the Edge Feature Fusion (EFS) module. This module enhances target contour information, effectively resolving the issue of blurred edge features caused by protective coloration. Experimental results demonstrate that IP-YOLOv8 achieves significant improvements across multiple metrics. Compared to the baseline model YOLOv8s, mAP50 increased by 2.2%, mAP50:95 improved by 1.3%, precision (P) increased by 3.1%, and recall (R) improved by 1.5%. Compared with current mainstream models, our model has reached the state-of-the-art level in detection performance. Specifically, IP-YOLOv8 outperforms YOLOv9s, YOLOv11s, and Rtdetr-r18 in mAP50 by 3.2%, 1.6%, and 16.6%, respectively. Furthermore, we conducted a generalization evaluation on the Pest24 dataset, demonstrating that IP-YOLOv8 not only achieves significant performance improvements on the IP102 dataset but also excels in the dense small-object scenario of Pest24. Compared to the baseline model YOLOv8s, IP-YOLOv8 improves mAP50 by 0.7% and F1-score by 0.6%. Our visualization analysis on the IP102 dataset shows that IP-YOLOv8 effectively avoids common issues in pest detection tasks, such as misclassification and duplicate detection, providing a reliable technical solution for pest monitoring in precision agriculture.
Although IP-YOLOv8 performs excellently in pest detection tasks under complex environments, it still has certain limitations. On the one hand, while the model’s detection accuracy has improved, the optimization process did not focus on model lightweighting, which poses challenges for deployment on low-cost hardware. On the other hand, although we tested the model on the Pest24 dataset, due to experimental constraints, its performance has not yet been validated in real-field environments. Therefore, further research is needed to further improve the model by optimizing its lightweight characteristics and conducting comprehensive evaluations in practical application scenarios. This will improve its practicality and adaptability for agricultural pest monitoring.
References yes

Author Contributions

Conceptualization, C.Y. and Y.W.; methodology, H.W.; software, C.Y.; validation, Y.W., L.Y. and C.Y.; formal analysis, Z.C.; investigation, Y.W. and H.W.; resources, Y.W. and H.W.; data curation, Y.W.; writing—original draft preparation, C.Y.; writing—review and editing, C.Y. and Y.W.; visualization, Y.H.; supervision, L.Y.; project administration, L.Y.; funding acquisition, L.Y. All authors have read and agreed to the published version of the manuscript.

Funding

Yunnan Province Applied Basic Research Program Key Project (202401AS070034); Yunnan Province Forest and Grassland Science and Technology Innovation Joint Project (202404CB090002); and the Yunnan Normal University Graduate Student Scientific Research Innovation Fund (YJSJJ25-B118).

Institutional Review Board Statement

Not applicable.

Data Availability Statement

The raw data supporting the conclusions of this article will be made available by the authors on request.

Conflicts of Interest

The authors declare no conflicts of interest.

References

  1. Tian, Y.; Wang, S.; Li, E.; Yang, G.; Liang, Z.; Tan, M. MD-YOLO: Multi-scale Dense YOLO for small target pest detection. Comput. Electron. Agric. 2023, 213, 108233. [Google Scholar] [CrossRef]
  2. Ma, L.; Liu, Y.; Zhang, X.; Ye, Y.; Yin, G.; Johnson, B.A. Deep learning in remote sensing applications: A meta-analysis and review. ISPRS J. Photogramm. Remote Sens. 2019, 152, 166–177. [Google Scholar] [CrossRef]
  3. Yao, Q.; Feng, J.; Tang, J.; Xu, W.-G.; Zhu, X.-H.; Yang, B.-J.; Lü, J.; Xie, Y.-Z.; Yao, B.; Wu, S.-Z.; et al. Development of an automatic monitoring system for rice light-trap pests based on machine vision. J. Integr. Agric. 2020, 19, 2500–2513. [Google Scholar] [CrossRef]
  4. Huang, R.; Yao, T.; Zhan, C.; Zhang, G.; Zheng, Y. A motor-driven and computer vision-based intelligent e-trap for monitoring citrus flies. Agriculture 2021, 11, 460. [Google Scholar] [CrossRef]
  5. Ramalingam, B.; Mohan, R.E.; Pookkuttath, S.; Gómez, B.F.; Sairam Borusu, C.S.C.; Wee Teng, T.; Tamilselvam, Y.K. Remote insects trap monitoring system using deep learning framework and IoT. Sensors 2020, 20, 5280. [Google Scholar] [CrossRef] [PubMed]
  6. Gao, Y.; Xue, X.; Qin, G.; Li, K.; Liu, J.; Zhang, Y.; Li, X. Application of machine learning in automatic image identification of insects-a review. Ecol. Inform. 2024, 80, 102539. [Google Scholar] [CrossRef]
  7. Pattnaik, G.; Parvathy, K. Machine learning-based approaches for tomato pest classification. TELKOMNIKA Telecommun. Comput. Electron. Control. 2022, 20, 321–328. [Google Scholar] [CrossRef]
  8. Qing, Y.; Chen, G.T.; Zheng, W.; Zhang, C.; Yang, B.J.; Jian, T. Automated detection and identification of white-backed planthoppers in paddy fields using image processing. J. Integr. Agric. 2017, 16, 1547–1557. [Google Scholar] [CrossRef]
  9. Ebrahimi, M.; Khoshtaghaza, M.H.; Minaei, S.; Jamshidi, B. Vision-based pest detection based on SVM classification method. Comput. Electron. Agric. 2017, 137, 52–58. [Google Scholar] [CrossRef]
  10. Shoaib, M.; Sadeghi-Niaraki, A.; Ali, F.; Hussain, I.; Khalid, S. Leveraging deep learning for plant disease and pest detection: A comprehensive review and future directions. Front. Plant Sci. 2025, 16, 1538163. [Google Scholar] [CrossRef]
  11. Leite, D.; Brito, A.; Faccioli, G. Advancements and outlooks in utilizing Convolutional Neural Networks for plant disease severity assessment: A comprehensive review. Smart Agric. Technol. 2024, 9, 100573. [Google Scholar] [CrossRef]
  12. Chen, J.; Chen, W.; Nanehkaran, Y.A.; Suzauddola, M. MAM-IncNet: An end-to-end deep learning detector for Camellia pest recognition. Multimed. Tools Appl. 2024, 83, 31379–31394. [Google Scholar] [CrossRef]
  13. Li, C.; Chen, S.; Ma, Y.; Song, M.; Tian, X.; Cui, H. Wheat Pest Identification Based on Deep Learning Techniques. In Proceedings of the 2024 IEEE 7th International Conference on Big Data and Artificial Intelligence (BDAI), Beijing, China, 5–7 July 2024; pp. 87–91. [Google Scholar]
  14. Chen, Y.; Chen, M.; Guo, M.; Wang, J.; Zheng, N. Pest recognition based on multi-image feature localization and adaptive filtering fusion. Front. Plant Sci. 2023, 14, 1282212. [Google Scholar] [CrossRef] [PubMed]
  15. Dong, S.; Du, J.; Jiao, L.; Wang, F.; Liu, K.; Teng, Y.; Wang, R. Automatic crop pest detection oriented multiscale feature fusion approach. Insects 2022, 13, 554. [Google Scholar] [CrossRef]
  16. Chakrabarty, S.; Shashank, P.R.; Deb, C.K.; Haque, M.A.; Thakur, P.; Kamil, D.; Marwaha, S.; Dhillon, M.K. Deep learning-based accurate detection of insects and damage in cruciferous crops using YOLOv5. Smart Agric. Technol. 2024, 9, 100663. [Google Scholar] [CrossRef]
  17. Chen, H.; Wen, C.; Zhang, L.; Ma, Z.; Liu, T.; Wang, G.; Yu, H.; Yang, C.; Yuan, X.; Ren, J. Pest-PVT: A model for multi-class and dense pest detection and counting in field-scale environments. Comput. Electron. Agric. 2025, 230, 109864. [Google Scholar] [CrossRef]
  18. Wu, X.; Zhan, C.; Lai, Y.K.; Cheng, M.M.; Yang, J. Ip102: A large-scale benchmark dataset for insect pest recognition. In Proceedings of the IEEE/CVF Conference on Computer Vision and Pattern Recognition, Long Beach, CA, USA, 16–17 June 2019; pp. 8787–8796. [Google Scholar]
  19. Yue, G.; Liu, Y.; Niu, T.; Liu, L.; An, L.; Wang, Z.; Duan, M. Glu-yolov8: An improved pest and disease target detection algorithm based on yolov8. Forests 2024, 15, 1486. [Google Scholar] [CrossRef]
  20. Yang, S.; Xing, Z.; Wang, H.; Dong, X.; Gao, X.; Liu, Z.; Zhang, X.; Li, S.; Zhao, Y. Maize-YOLO: A new high-precision and real-time method for maize pest detection. Insects 2023, 14, 278. [Google Scholar] [CrossRef]
  21. Dong, Q.; Sun, L.; Han, T.; Cai, M.; Gao, C. PestLite: A novel YOLO-based deep learning technique for crop pest detection. Agriculture 2024, 14, 228. [Google Scholar] [CrossRef]
  22. Xiang, Q.; Huang, X.; Huang, Z.; Chen, X.; Cheng, J.; Tang, X. YOLO-pest: An insect pest object detection algorithm via CAC3 module. Sensors 2023, 23, 3221. [Google Scholar] [CrossRef]
  23. Zhang, L.; Zhao, C.; Feng, Y.; Li, D. Pests identification of ip102 by yolov5 embedded with the novel lightweight module. Agronomy 2023, 13, 1583. [Google Scholar] [CrossRef]
  24. Liu, H.; Zhan, Y.; Sun, J.; Mao, Q.; Wu, T. A transformer-based model with feature compensation and local information enhancement for end-to-end pest detection. Comput. Electron. Agric. 2025, 231, 109920. [Google Scholar] [CrossRef]
  25. Song, H.; Yan, Y.; Deng, S.; Jian, C.; Xiong, J. Innovative lightweight deep learning architecture for enhanced rice pest identification. Phys. Scr. 2024, 99, 096007. [Google Scholar] [CrossRef]
  26. Wu, X.; Liang, J.; Yang, Y.; Li, Z.; Jia, X.; Pu, H.; Zhu, P. SAW-YOLO: A Multi-Scale YOLO for Small Target Citrus Pests Detection. Agronomy 2024, 14, 1571. [Google Scholar] [CrossRef]
  27. Kecen, L.; Xiaoqiang, W.; Hao, L.; Leixiao, L.; Yanyan, Y.; Chuang, M.; Jing, G. Survey of one-stage small object detection methods in deep learning. J. Front. Comput. Sci. Technol. 2022, 16, 41. [Google Scholar]
  28. Staff, A.C. The two-stage placental model of preeclampsia: An update. J. Reprod. Immunol. 2019, 134, 1–10. [Google Scholar] [CrossRef]
  29. Liu, W.; Anguelov, D.; Erhan, D.; Szegedy, C.; Reed, S.; Fu, C.Y.; Berg, A.C. Ssd: Single shot multibox detector. In Proceedings of the Computer Vision–ECCV 2016: 14th European Conference, Amsterdam, The Netherlands, 11–14 October 2016; Proceedings, Part I 14. Springer: Berlin/Heidelberg, Germany, 2016; pp. 21–37. [Google Scholar]
  30. Lin, T. Focal Loss for Dense Object Detection. arXiv 2017, arXiv:1708.02002. [Google Scholar]
  31. Redmon, J.; Divvala, S.; Girshick, R.; Farhadi, A. You only look once: Unified, real-time object detection. In Proceedings of the IEEE Conference on Computer Vision and Pattern Recognition, Las Vegas, NV, USA, 27–30 June 2016; pp. 779–788. [Google Scholar]
  32. Redmon, J.; Farhadi, A. YOLO9000: Better, faster, stronger. In Proceedings of the IEEE Conference on Computer Vision and Pattern Recognition, Honolulu, HI, USA, 21–26 July 2017; pp. 7263–7271. [Google Scholar]
  33. Bochkovskiy, A.; Wang, C.Y.; Liao, H.Y.M. Yolov4: Optimal speed and accuracy of object detection. arXiv 2020, arXiv:2004.10934. [Google Scholar] [CrossRef]
  34. Ren, S. Faster r-cnn: Towards real-time object detection with region proposal networks. arXiv 2015, arXiv:1506.01497. [Google Scholar] [CrossRef]
  35. He, K.; Gkioxari, G.; Dollár, P.; Girshick, R. Mask r-cnn. In Proceedings of the IEEE International Conference on Computer Vision, Venice, Italy, 22–29 October 2017; pp. 2961–2969. [Google Scholar]
  36. Dai, J.; Li, Y.; He, K.; Sun, J. R-fcn: Object detection via region-based fully convolutional networks. In Proceedings of the 30th Conference on Neural Information Processing Systems (NIPS 2016), Barcelona, Spain, 5–10 December 2016. Volume 29. [Google Scholar]
  37. Kang, M.; Ting, C.M.; Ting, F.F.; Phan, R.C.W. ASF-YOLO: A novel YOLO model with attentional scale sequence fusion for cell instance segmentation. Image Vis. Comput. 2024, 147, 105057. [Google Scholar] [CrossRef]
  38. Dai, X.; Chen, Y.; Xiao, B.; Chen, D.; Liu, M.; Yuan, L.; Zhang, L. Dynamic head: Unifying object detection heads with attentions. In Proceedings of the IEEE/CVF Conference on Computer Vision and Pattern Recognition, Nashville, TN, USA, 19–25 June 2021; pp. 7373–7382. [Google Scholar]
  39. Wang, W.; Dai, J.; Chen, Z.; Huang, Z.; Li, Z.; Zhu, X.; Hu, X.; Lu, T.; Lu, L.; Li, H.; et al. Internimage: Exploring large-scale vision foundation models with deformable convolutions. In Proceedings of the IEEE/CVF Conference on Computer Vision and Pattern Recognition, Vancouver, BC, Canada, 18–22 June 2023; pp. 14408–14419. [Google Scholar]
  40. Kang, C.; Jiao, L.; Liu, K.; Liu, Z.; Wang, R. Precise Crop Pest Detection Based on Co-Ordinate-Attention-Based Feature Pyramid Module. Insects 2025, 16, 103. [Google Scholar] [CrossRef]
  41. Zhang, L.; Ding, G.; Li, C.; Li, D. DCF-Yolov8: An improved algorithm for aggregating low-level features to detect agricultural pests and diseases. Agronomy 2023, 13, 2012. [Google Scholar] [CrossRef]
  42. Zhang, L.; Cui, H.; Sun, J.; Li, Z.; Wang, H.; Li, D. CLT-YOLOX: Improved YOLOX based on cross-layer transformer for object detection method regarding insect pest. Agronomy 2023, 13, 2091. [Google Scholar] [CrossRef]
  43. Wang, Q.J.; Zhang, S.Y.; Dong, S.F.; Zhang, G.C.; Yang, J.; Li, R.; Wang, H.Q. Pest24: A large-scale very small object data set of agricultural pests for multi-target detection. Comput. Electron. Agric. 2020, 175, 105585. [Google Scholar] [CrossRef]
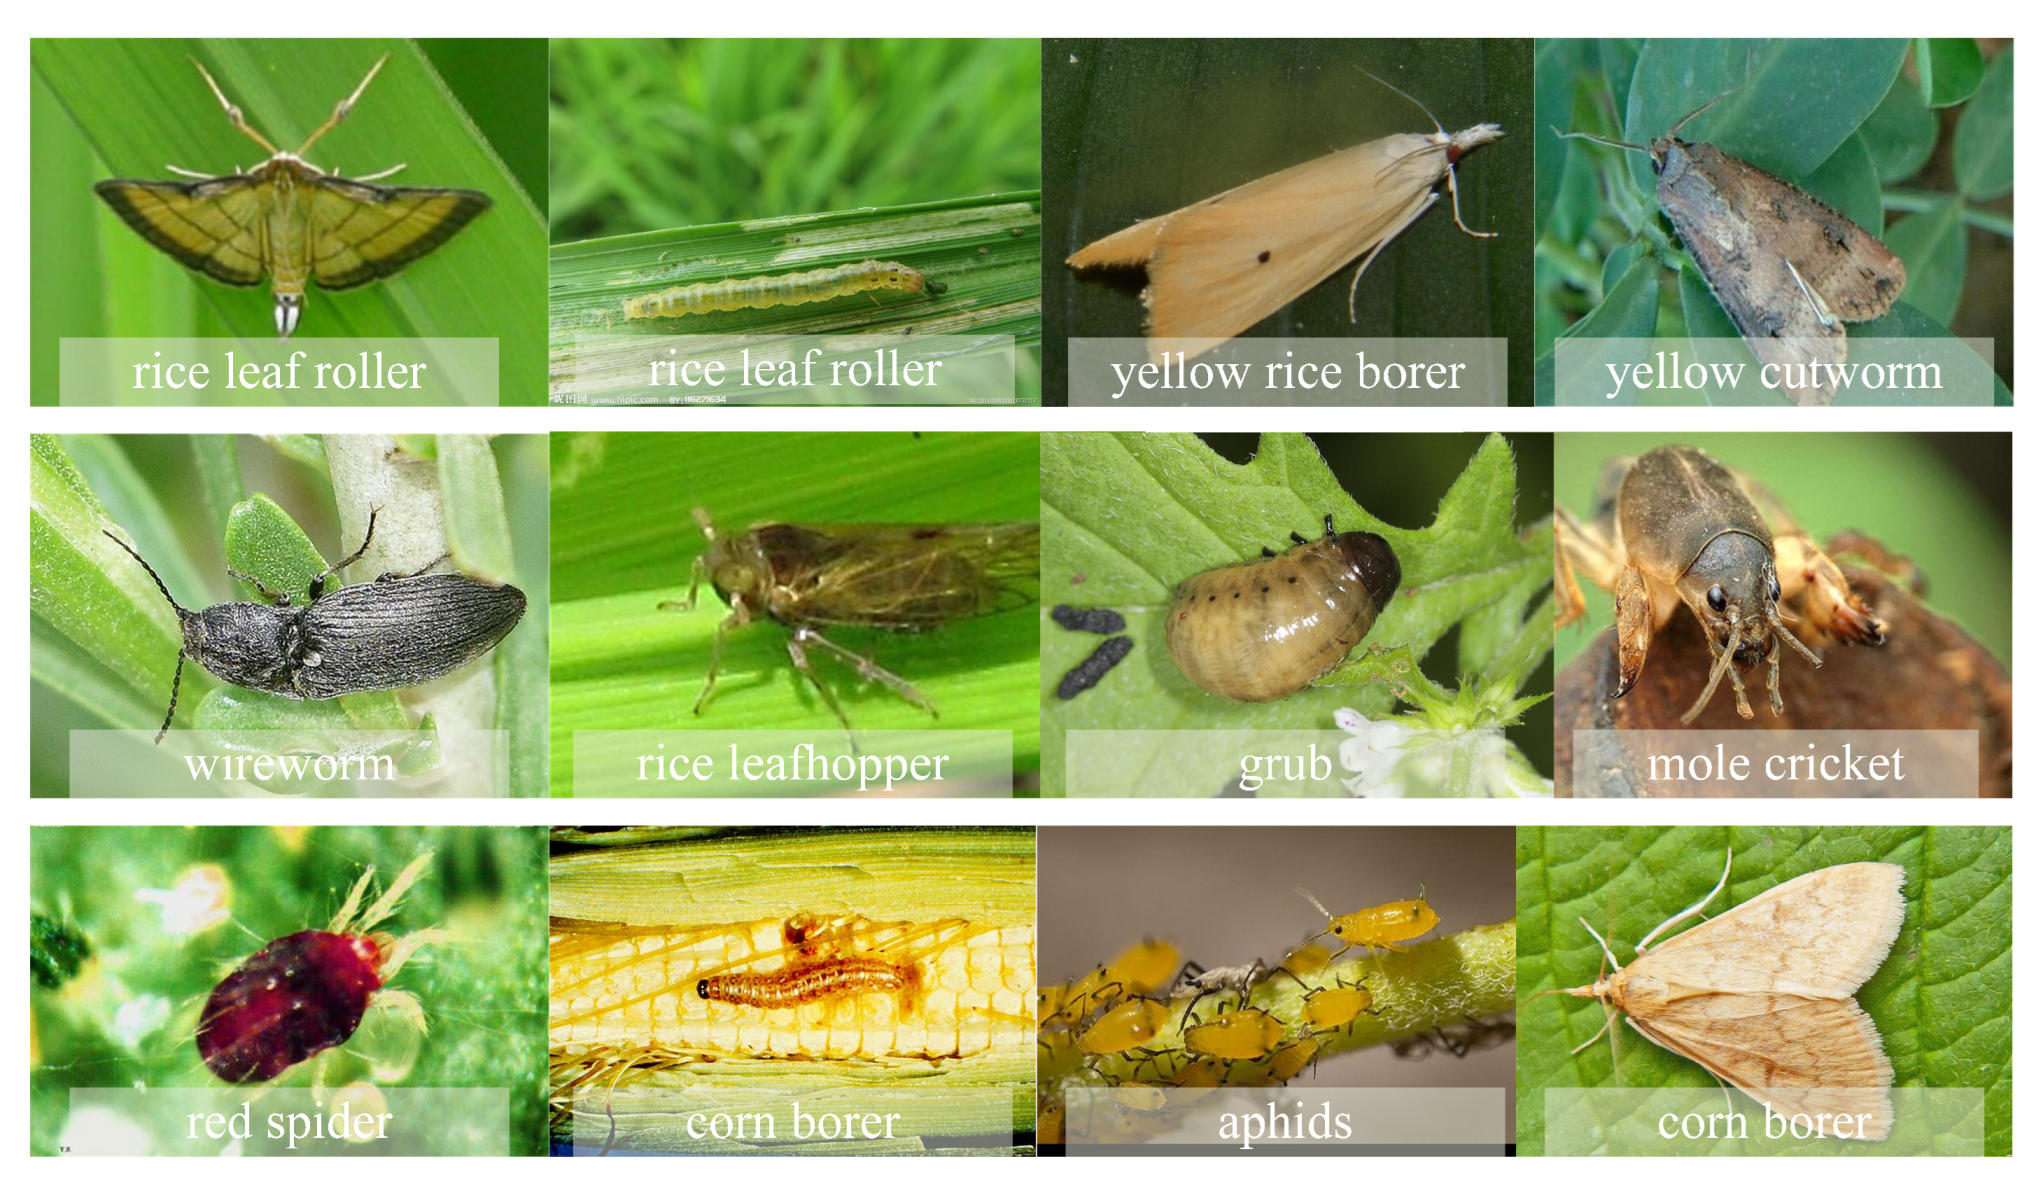
Figure 1. Example images from the IP102 dataset.
Horticulturae 11 01109 g001
Figure 2. Sample category distribution and clustering visualization.
Horticulturae 11 01109 g002
Figure 3. IP-YOLOv8 model framework.
Horticulturae 11 01109 g003
Figure 4. SSFF and TFE structural framework.
Horticulturae 11 01109 g004
Figure 5. DyDCNHead architecture diagram.
Horticulturae 11 01109 g005
Figure 6. Edge fusion stem.
Horticulturae 11 01109 g006
Figure 7. Visual results. In the figure, (a,c,e,g,i,k,m,o) represent the detection results of YOLOv8s, while (b,d,f,h,j,l,n,p) represent the detection results of IP-YOLOv8. Watermark data source: http://github.com/xpwu95/IP102 (accessed on 8 September 2025).
Horticulturae 11 01109 g007
Figure 8. Heatmap results. In the figure, (a,c,e,g,i,k) represent the detection results of YOLOv8s, while (b,d,f,h,j,l) represent the detection results of IP-YOLOv8. Watermark data source: http://github.com/xpwu95/IP102 (accessed on 8 September 2025).
Horticulturae 11 01109 g008
Figure 9. Radar chart of model performance comparison.
Horticulturae 11 01109 g009
Figure 10. Visualization of Pest24 detection results. In the figure, (a,c,e,g,i,k) represent the detection results of YOLOv8s, while (b,d,f,h,j,l) represent the detection results of IP-YOLOv8.
Horticulturae 11 01109 g010
Table 2. Initialization parameter table.
ParameterValue
epoch300
lr00.01
momentum0.937
weight_decay0.0005
batch_size8
optimizerSGD
Image size640
Close_mosaic0
Learning Rate Scheduling StrategyCosine Annealing
Table 3. Ablation experiment results.
ASFHeadEFSP (%)R (%)mAP50mAP50:90GFLOPsParam
(%)(%)(G)(M)
57.052.757.037.128.711.1
58.752.258.137.530.311.3
56.956.758.537.929.410.5
53.561.058.838.429.111.1
55.655.959.038.331.010.6
57.157.058.537.930.411.3
55.858.758.938.130.010.5
60.154.259.238.431.310.6
Note: √ represents adding this module. ASF = SSFF + TFE.
Table 4. Comparison experiment results.
ModelP (%)R (%)mAP50 (%)mAP50:95 (%)GFLOPs (G)Param (M)
YOLOv3-tiny49.554.553.732.612.119.1
YOLOv5s55.854.457.737.49.124.0
YOLOv656.754.857.236.916.645.6
YOLOv753.953.354.534.037.0104.9
YOLOv8s57.052.057.037.111.128.7
YOLOv9s51.257.656.036.57.226.9
YOLOv11s57.651.757.637.49.421.5
YOLOv12s55.753.656.336.49.119.5
Rtdetr-r1852.145.642.626.320.057.4
Ours60.154.259.238.411.129.1
Table 5. Comparison of current research results.
ModelP (%)R (%)mAP50 (%)mAP50:95 (%)GFLOPs (G)Param (M)
PestLite [21]57.256.457.1-6.3416.3
Yolo-Pest [22]--57.1-5.8-
C3M-YOLO [23]57.457.557.234.97.116.1
CFR [24]--57.3-41.4261.2
CAFPN [40]--49.729.832.19211.37
DCF-YOLOv8 [41]5360.460.839.425.8-
CLT-YOLOX [42]--57.7-10.535.4
Ours60.154.259.238.411.129.1
Table 6. Comparison on the Pest24 dataset.
ModelP (%)R (%)mAP50 (%)F1 (%)
YOLOv8s70.860.665.265.3
IP-YOLOv868.463.665.965.9
Disclaimer/Publisher’s Note: The statements, opinions and data contained in all publications are solely those of the individual author(s) and contributor(s) and not of MDPI and/or the editor(s). MDPI and/or the editor(s) disclaim responsibility for any injury to people or property resulting from any ideas, methods, instructions or products referred to in the content.