Article

Effects of Different Agricultural Wastes on the Growth of Photinia × fraseri Under Natural Low-Temperature Conditions

1
College of Resource and Environment, Anhui Science and Technology University, Donghua Road No. 9, Chuzhou 233100, China
2
College of Agriculture, Anhui Science and Technology University, Donghua Road No. 9, Chuzhou 233100, China
3
College of Biomedicine and Health, Anhui Science and Technology University, Donghua Road No. 9, Chuzhou 233100, China
4
College of Architecture, Anhui Science and Technology University, Donghua Road No. 9, Chuzhou 233100, China
*
Authors to whom correspondence should be addressed.
Horticulturae 2025, 11(9), 1055; https://doi.org/10.3390/horticulturae11091055
Submission received: 29 June 2025 / Revised: 28 August 2025 / Accepted: 29 August 2025 / Published: 3 September 2025

Abstract

As low temperature is a key factor affecting the growth and development of plants and the utilization of agricultural waste has significant research value, this study explores the effects of 16 agricultural wastes on the growth of P. fraseri under natural low-temperature conditions and evaluates its cold resistance capacity. Soil chemical properties were analyzed and all the wastes were found to exhibit alkalinity. The highest total nitrogen content was found in group A (garden soil/coir/municipal sludge = 7:1:2). In this group, the branch number, branch length, and branch diameter were the largest. Interestingly, the plants in group E (garden soil/coir/pig manure = 7:1:2) had the highest average number of new shoots, with 5.72. Analysis of the physiological indexes of leaves revealed that the proline content, superoxide dismutase activity, fresh weight, and dry weight of plants in group L (garden soil/coir/pear residue = 7:1:2) were the highest. The stomatal conductance and transpiration rate of the leaves of plants in group L were the largest, at 86.23 mmol∙m−2∙s−1 and 1.67 mmol∙m−2∙s−1, respectively. Furthermore, combined with morphological and physiological indicators for membership function analysis, the results show that plants in group A exhibited optimal growth under natural low temperature. Correlation analysis indicated varying degrees of correlation between 38 pairs of indicators, including branch number and branch length, intercellular CO2 concentration and stomatal conductance, and leaf fresh weight and dry weight. Heatmap analysis showed that branch number, branch length, and branch diameter were highest in group A plants, while the highest levels of proline occurred in group L plants. In this study, groups A and L are recommended for growth under naturally low-temperature conditions.

1. Introduction

As a common environmental stress, low temperature can greatly affect the growth status of plants, causing low-temperature injury or even death of plants [1]. Studies have shown that low-temperature treatment of tea (Camellia sinensis) trees leads to a decrease in leaf length and width [1]. Transgenic tobacco plants overexpressing tea CsWRKY29 exhibited enhanced cold resistance, and under low-temperature stress, their superoxide dismutase activity and soluble sugar content were significantly increased, while the plants became shorter and their area decreased [2]. In addition, a study on Amygdalus communis showed that palisade tissue, palisade/spongy ratio, and leaf compactness were positively correlated with cold tolerance [3]. A similar result was observed in other plants [4]. Different plant species vary greatly in their cold tolerance and their regulatory mechanisms for cold resistance also differ.
P. fraseri belongs to the Rosaceae family and is a hybrid offspring of P. glabra and P. serrulate, with vibrant leaf colors and high aesthetic value. P. fraseri is an evergreen ornamental plant whose young leaves appear red and purple in spring and autumn, gradually turning green in summer and winter. This continuous change in leaf color throughout the year gives it significant ornamental value [5]. Research shows that P. fraseri also has ecological functions, such as carbon fixation and temperature reduction [6]. P. fraseri grows rapidly, is easy to transplant and shape, has relatively strong resistance to abiotic stress, and is widely applicable [7]. The growth and physiological adaptability of two types of P. fraseri in the central region of Shaanxi Province, China, were investigated, and it was found that the ‘Red Robin’ variety has stronger growth vigor [8]. In P. fraseri Dress ‘Red Robin’, drought tolerance and recovery ability were explored through physiological and biochemical analyses. Notably, P. fraseri avoided photoinhibition by reducing the chlorophyll content and actual efficiency of photosystem II [9]. The latest research shows that Pseudopestalotiopsis ixorae causes leaf spot in P. fraseri [10]. In addition, the adsorption capacity and photosynthetic response of P. fraseri on different particle sizes were studied. P. fraseri showed the highest adsorption capacity for sPM100, greater than that for wPM100 (leaf surface particle size of 10–100 μm), and significantly higher than for wPM2.5 (waxy layer particle size of 10–100 μm) [11].
It has been reported that light intensity participates in regulating leaf color, anthocyanin, antioxidant enzyme activity, and polyphenol content in P. fraseri [5]. Nighttime light stress significantly increases cell membrane peroxidation and antioxidant enzyme activity in P. fraseri, activating the antioxidant enzyme protection system [12]. In addition, P. fraseri leaves have relatively high photochemical reaction and heat dissipation capabilities to defend against low-temperature photoinhibition [13]. P. fraseri protects its photosynthetic apparatus from low-temperature strong light damage by reducing the light energy absorption capacity of light-harvesting pigment molecules while maintaining high photochemical capacity and electron transfer rates [14].
It is well known that plants can develop unique physiological characteristics under long-term low-temperature stress [15]. Theoretical analysis of low-temperature stress-related indicators is important for the introduction, cultivation, and propagation of ornamental plants [16]. In recent years, extreme low-temperature weather has occurred frequently, sometimes dropping below −7 °C, leading to a severe reduction in ornamental value. Different agricultural wastes vary in their ability to help plants resist low temperatures, but related research is limited. However, the use of agricultural waste continues to be an important research topic, as applying it as a cultivation substrate is a sustainable practice that can affect plant growth and stress resistance. This study uses P. fraseri as the research subject to explore the effects of different agricultural wastes on its growth and development under natural low-temperature conditions. It identifies suitable cultivation substrates and provides a theoretical and practical basis for the cultivation and management of this plant. Additionally, this study also provides a reference for the recycling of agricultural wastes.

2. Materials and Methods

2.1. Plant Materials and Growth Conditions

The experimental material was P. fraseri ‘Red Robin’, with 2-year-old cutting seedlings provided by Anhui Science and Technology University being used. P. fraseri plants were grown in cylindrical cultivation bags (30 cm × 35 cm), with one healthy and uniform-sized planted in each bag. The plants’ height was about 100 cm, and the stem diameter was about 13 cm.
In this experiment, 16 types of agricultural waste, including coir, chicken manure, and cow manure, were mixed in volume ratios of 9:1 or 7:1:2 to create 16 different treatments (Table 1). A mixture of garden soil and coir (9:1) was used as the control group (CK).
This experiment was conducted in 2023 at the experimental base of Anhui Science and Technology University (latitude 32°43′ to 33°30′ N, longitude 116°45′ to 118°04′ E), using outdoor cultivation with routine management. The P. fraseri were watered using drip irrigation and grown under natural conditions from 1 December 2023 to 15 March 2024. The air temperature data are shown in Figure 1. The minimum, average, and maximum temperature data show that the lowest air temperatures were −9 °C, −5 °C, and −2 °C, respectively (Figure 1). Therefore, the plants were vulnerable to low-temperature injury during the study period.

2.2. Determination of Chemical Properties of Substrates

The substrate pH was measured using a pH meter (HJ 962-2018), and the Kjeldahl method was used to determine the total nitrogen content (NY/T 1121.24-2012). In addition, the NaOH alkaline fusion–molybdenum antimony colorimetric method was used to measure the total phosphorus content (GB/T 9837-1988), the NaOH fusion method was used to measure the total potassium content (NY/T 87-1988), and the alkaline hydrolysis diffusion method was used to measure the alkali-hydrolyzed nitrogen content (LY/T 1228-2015). The spectrophotometric method was used to measure the available phosphorus content (NY/T 1121.7-2014), and the ammonium acetate extraction method was used to determine the available potassium content (NY/T 889-2004). Finally, the potassium dichromate volumetric method was used to determine the organic matter content (NY/T 1121.6-2006).

2.3. Measurement of Morphological Indicators of P. fraseri

Plant height was measured using a tape measure, and the length from the bottom of the plant to its highest point was recorded. In a similar manner, the stem diameter was measured using a vernier caliper at the point where the main trunk contacts the substrate. In addition, a ruler was used to measure the length of branches on the main trunk; and a vernier caliper was used to measure the thickness of branches on the main trunk, specifically the diameter at the middle portion of the branch. The number of new shoots at the branch tips and the number of branches on the main trunk were manually recorded. Three plants were randomly selected from each group for morphological indicator measurements.

2.4. Measurement of Physiological and Photosynthetic Indicators

Mature leaves from the same position (5th–7th leaves from the top) were collected for physiological indicator measurements, with leaves taken from at least three plants and then mixed. The ethanol extraction method was used to measure the chlorophyll content in the leaves [17]. Additionally, leaf fresh weight was measured directly, while the oven-drying method was used to measure leaf dry weight and leaf water content [13]. The conductivity meter method was used to determine the relative electrical conductivity of leaves [18]. The thiobarbituric acid method was used to determine the malondialdehyde content, and the nitroblue tetrazolium method was used to determine superoxide dismutase activity [19]. A modified ninhydrin colorimetric method was used to determine the free proline content. The Coomassie Brilliant Blue G-250 staining method was used to determine the soluble protein content [17]. All the above indicators were measured in biological replicates. Each replicate weighed 0.5 g, except for the leaf water content test, which required 10 g.
A portable photosynthesis system (model TPS-2, PP SYSTEMS, Amesbury, MA, USA) was used to measure the net photosynthetic rate, transpiration rate, stomatal conductance, and intercellular CO2 concentration, with 3 replicates and 10 observations recorded for each replicate. The experiment was conducted from approximately 9:00 to 11:00 a.m.

2.5. Comprehensive Evaluation

The membership function method was used to evaluate the experimental results, separately calculating the morphological and physiological indicators of P. fraseri. Then comprehensive evaluation analysis of the growth status of P. fraseri under low-temperature conditions was conducted with different cultivation substrates to determine its cold resistance capacity. The calculation method used was as follows: M(n) = (M − Mmin) / (Mmax − Mmin). If a certain indicator of P. fraseri was inversely proportional to its growth status, the following method was used for calculation: M(n) = 1 − (M − Mmin) / (Mmax − Mmin), where M(n) is the membership function value of a certain indicator of P. fraseri plants, M represents the measured value of a certain indicator of P. fraseri, Mmax is the maximum value of the measured indicator, and Mmin is the minimum value of the measured indicator. For each treatment group, the membership function values of all indicators were added together and then averaged to obtain the comprehensive evaluation value for P. fraseri [20].

2.6. Statistical Analysis

Excel 2019 was used to perform the statistical calculations and create graphs. Variance analysis of the data was performed using Duncan’s test at p < 0.05 employing SPSS 27.0. The R programming language was used for the z-score normalization of 27 indexes, and then heatmap software and corrplot software were used to draw a heatmap and Pearson correlation heatmap, respectively, and data processing and analysis were performed in the R 4.3.1 environment (https://cran.r-project.org/src/base/R-4/, accessed on 28 August 2025) [18].

3. Results

3.1. Analysis of Chemical Properties of Different Combined Cultivation Substrates

A total of eight indicators in the soil were tested (organic matter; pH; alkali-hydrolyzed nitrogen; available phosphorus; available potassium; total nitrogen; total phosphorus, and total potassium). The following results were found among the 16 treatments: the highest organic matter content was found in group E at 34.48 g/kg, while the lowest was found in group C at 13.49 g/kg. In addition, the highest pH was found in group I at 9.27, while the lowest was found in group E at 7.24. The highest alkali-hydrolyzed nitrogen content was found in group E at 466.84 mg/kg, while the lowest was found in the CK group at 40.47 mg/kg. Moreover, the highest available phosphorus content in the soil was found in group F at 290.60 mg/kg, while the lowest was found in group O at 15.79 mg/kg. Furthermore, the highest total potassium content was found in group I at 1705.55 mg/kg, while the lowest found was in group N at 207.57 mg/kg. The highest total nitrogen content was found in group A at 2.59 g/kg, while the lowest was found in the CK group at 0.59 g/kg. In the analysis of total phosphorus content, the highest was found in group N at 4.64 g/kg, while the lowest was found in the CK group at 0.42 g/kg. Finally, the highest total potassium content was found in group I at 19.90 g/kg, while the lowest was found in group L at 11.15 g/kg (Table 2).

3.2. Effects of Different Cultivation Substrates on the Growth and Development of P. fraseri

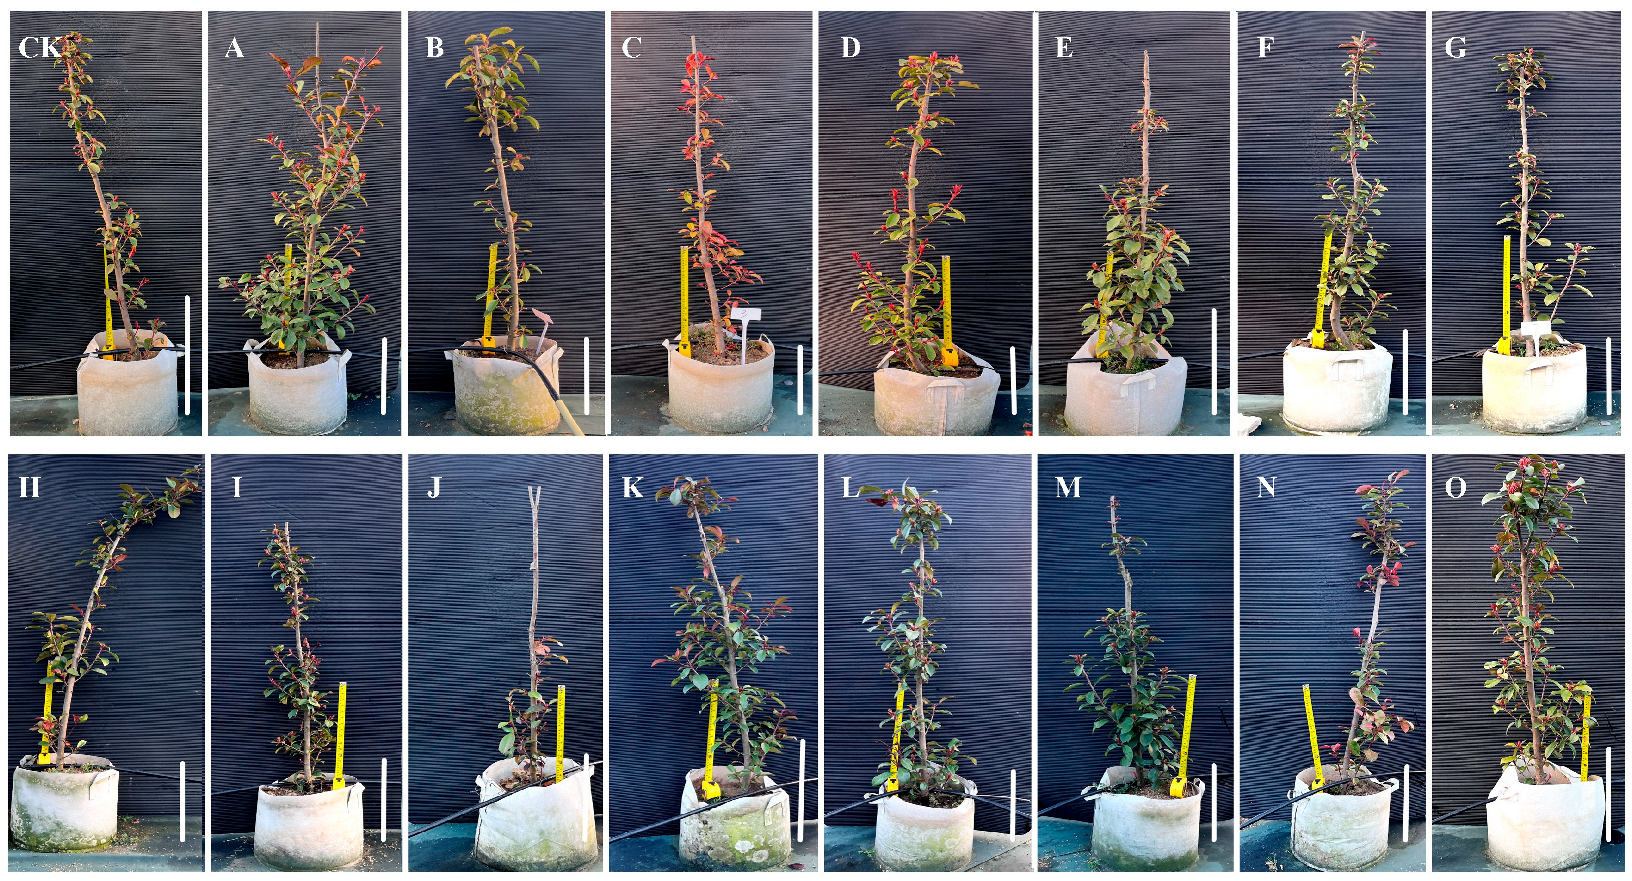
Under natural low-temperature conditions, different cultivation substrates had varying effects on indicators such as leaf color, plant height, stem diameter, and branch length of P. fraseri (Figure 2).
Table 3 shows that group F plants had the highest average plant height, at 128.67 cm, while group I plants had the lowest average plant height at 116.67 cm. The average height of group F plants was 1.1 times that of group I plants. Group O plants exhibited the highest average stem diameter at 23.80 mm, while group B plants had the lowest average stem diameter at 15.36 mm, with the former being 1.55 times the latter. Group A plants had the highest average branch number at 64, while group J plants had the lowest average branch number at 27, with the branch number of group A plants being 2.4 times that of group J plants. Group A plants also had the highest average branch length at 15.70 cm, while group C plants had the lowest average branch length at 5.13 cm, with the former exceeding the latter by 10.57 cm. Simultaneously, group A plants also exhibited the highest stem diameter at 4.53 mm, while group J plants had the lowest average stem diameter at 3.08 mm, with the former being 1.47 times the latter. The relatively high total nitrogen content in group A was conducive to increasing the branch number, branch length, and stem diameter.
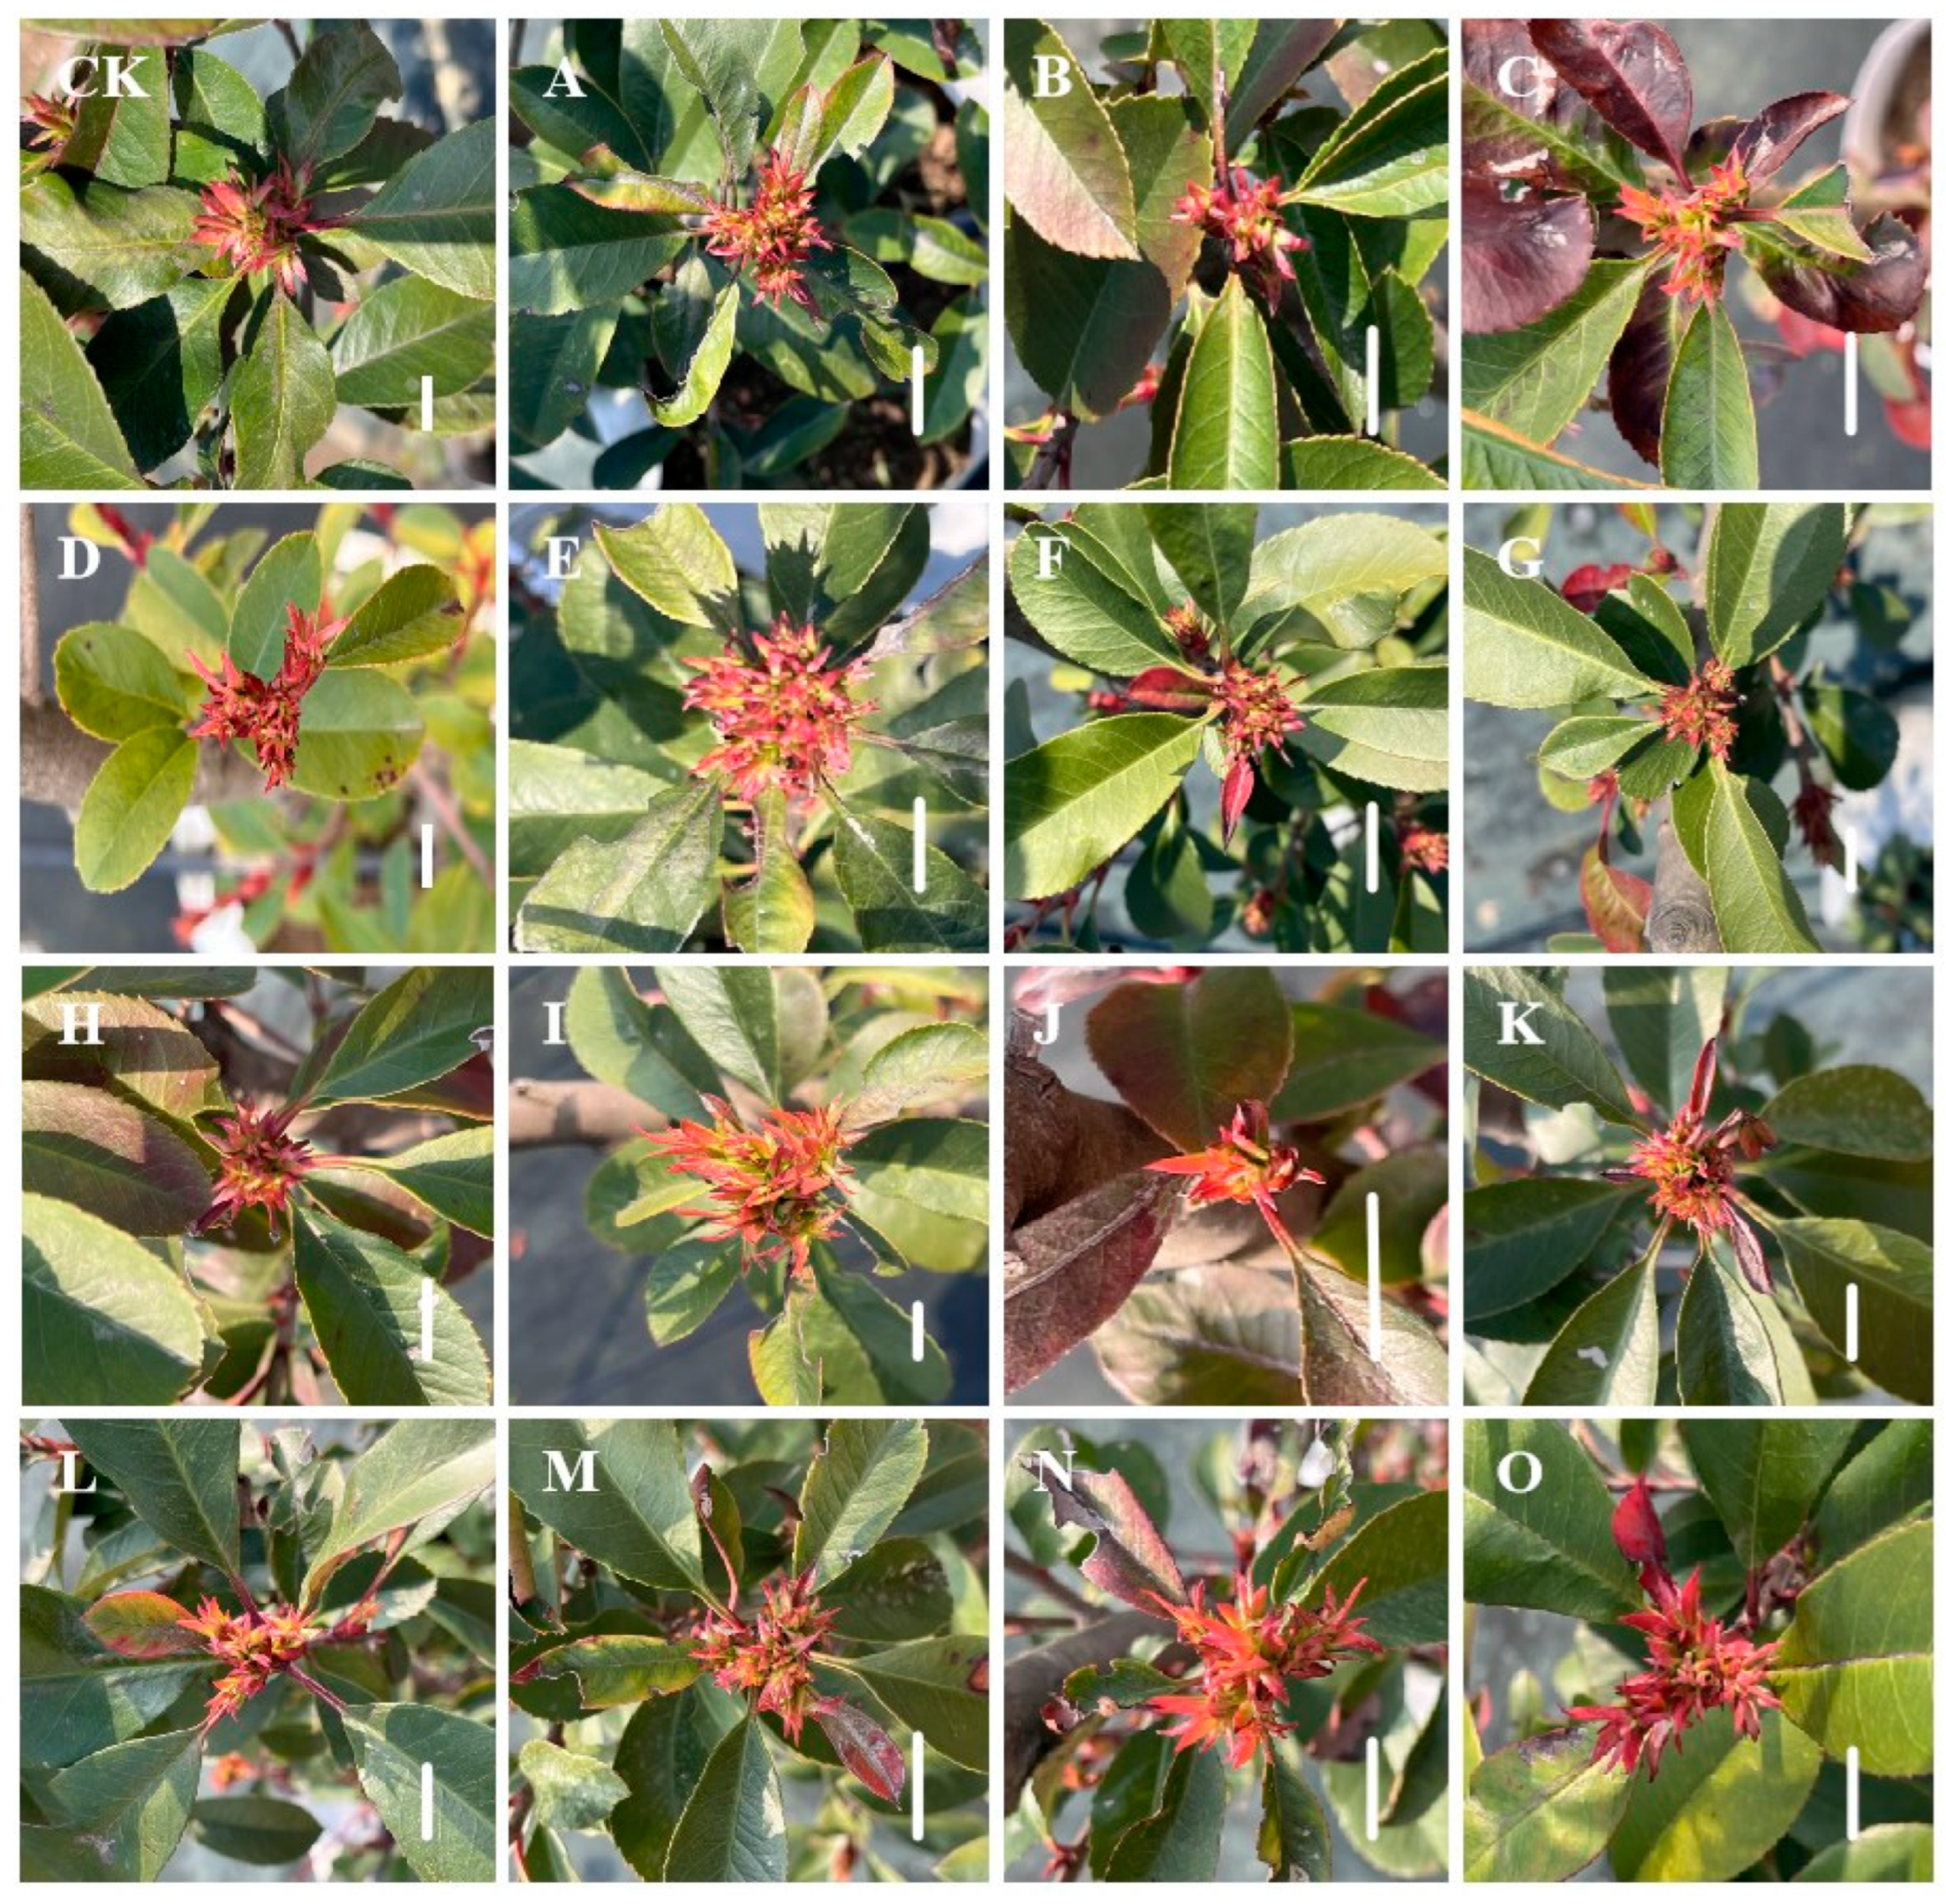
Additionally, statistical analysis showed that group E plants had the highest number of new shoots on branches with six, while group J plants had the lowest average number of new shoots with two. Therefore, the former had three times that of the latter (Table 3 and Figure 3). In addition, in the C, J, and N group plants, most of the leaves turned red (Figure 4), indicating that these three groups of plants may have suffered more serious cold damage.

3.3. Determination of Physiological Indicators of P. fraseri

It is well known that low temperatures lead to changes in plant morphology. Additionally, it also leads to changes in the proline content, soluble protein content, superoxide dismutase activity, and other parameters in plants. Therefore, in this study, these seven physiological indexes were detected (Table 4). And the results showed that significant differences in membrane permeability were observed in this study among the different treatments, with group F plants exhibiting the highest leaf membrane permeability at 83.78%, while group E plants had the lowest at 43.62%, the latter being half of the former. Analysis of the soluble protein content in leaves revealed that group D plants had the highest content at 110.75 mg/g, while group F plants had the lowest at 45.85 mg/g, with the former being approximately 2.4 times the latter. The proline content in leaves of plants across the 16 treatments ranged from 2.92 μg/g to 37.40 μg/g, with the content ranking from highest to lowest as follows: L > A > I > O > M > J > H > G > N > E > C > D > F > CK > B > K. Among these, group L plants had the highest proline content at 37.40 μg/g, while group K plants had the lowest at 2.92 μg/g. The highest superoxide dismutase activity in the leaves was observed in groups K and L, at 268.52 U/g·FW, and 266.41 U/g·FW, respectively, with no significant difference between the two groups. Groups D and E exhibited relatively lower superoxide dismutase activity, with no significant difference between the two groups. Additionally, the malondialdehyde content in plant leaves, ranked from highest to lowest, was as follows: K > H > O > J > E > N > M > I > A > CK > D > L > F > C > G > B, with groups B and G showing relatively lower malondialdehyde content and no significant difference between the two groups. Group L exhibited the highest leaf fresh weight = 0.99 g and dry weight = 0.48 g, while group I plants had the lowest at 0.42 g and 0.19 g, respectively.

3.4. Detection of Photosynthetic-Related Indicators of P. fraseri

Photosynthesis-related indicators play an important role in the growth and resistance of plants [17]. The leaf water content, chlorophyll content, stomatal conductance, and other photosynthetic indicators were also measured. The results show that group H plants had the highest leaf water content of leaves at 55.82%, while group A plants had the lowest at 50.50% (Table 5). The highest chlorophyll content was observed in group O at 9.78 mg/g, while the lowest was found in group N at 1.680 mg/g, with the chlorophyll content in group N plants being 17.18% of that in group O plants. The highest intercellular CO2 concentration was found in group J at 477.59 mg/m3, while the lowest was found in group G at 333.20 mg/m3. The highest stomatal conductance was observed in group D at 91.13 mmol·m−2·s−1, while the lowest was found in group B at 23.44 mmol·m−2·s−1. In addition, the highest net photosynthetic rate was recorded in group I at 11.30 µmol·m−2·s−1, while the lowest was found in group M at 0.76 µmol·m−2·s−1. Finally, the highest transpiration rate was observed in group L at 1.67 mmol·m−2·s−1, while the lowest was found in group B at 0.54 mmol·m−2·s−1.

3.5. Comprehensive Evaluation Analysis

The membership function method was applied to comprehensively evaluate the growth status of P. fraseri. Based on the morphological indicators, including plant height, stem diameter, branch length, etc., the plants in group A were rated the highest and those in group J the lowest (Table 6).
Membership function analysis was also carried out based on 13 physiological indexes, including leaf water content (LWC), chlorophyll (Chl) content, intercellular CO2 concentration (Ci), stomatal conductance (Gs), net photosynthetic rate (Pn), and transpiration rate (Tr), membrane permeability (MP), soluble protein (SP), proline (Pro), superoxide dismutase (SOD), malondialdehyde (MDA), fresh weight (FW), and dry weight (DW). The results show that the composite index values, ranked from highest to lowest, were L > A > N > D = I = M > J > O > B > G > K > E > C = CK > F > H (Table 7). This indicates that group L plants had the strongest ability to resist low temperature, followed by group A plants.
Meanwhile, according to both the morphological and physiological indicators, group A ranked first in the comprehensive evaluation of growth status, with a composite index of 0.59, followed by group L in second place, with a composite index of 0.52 (Table 8). Group J ranked the lowest, with a composite index of 0.29 (Table 8). This indicates that group A plants grew well and had a strong ability to resist low temperatures.

3.6. Correlation Analysis Between Different Indicators

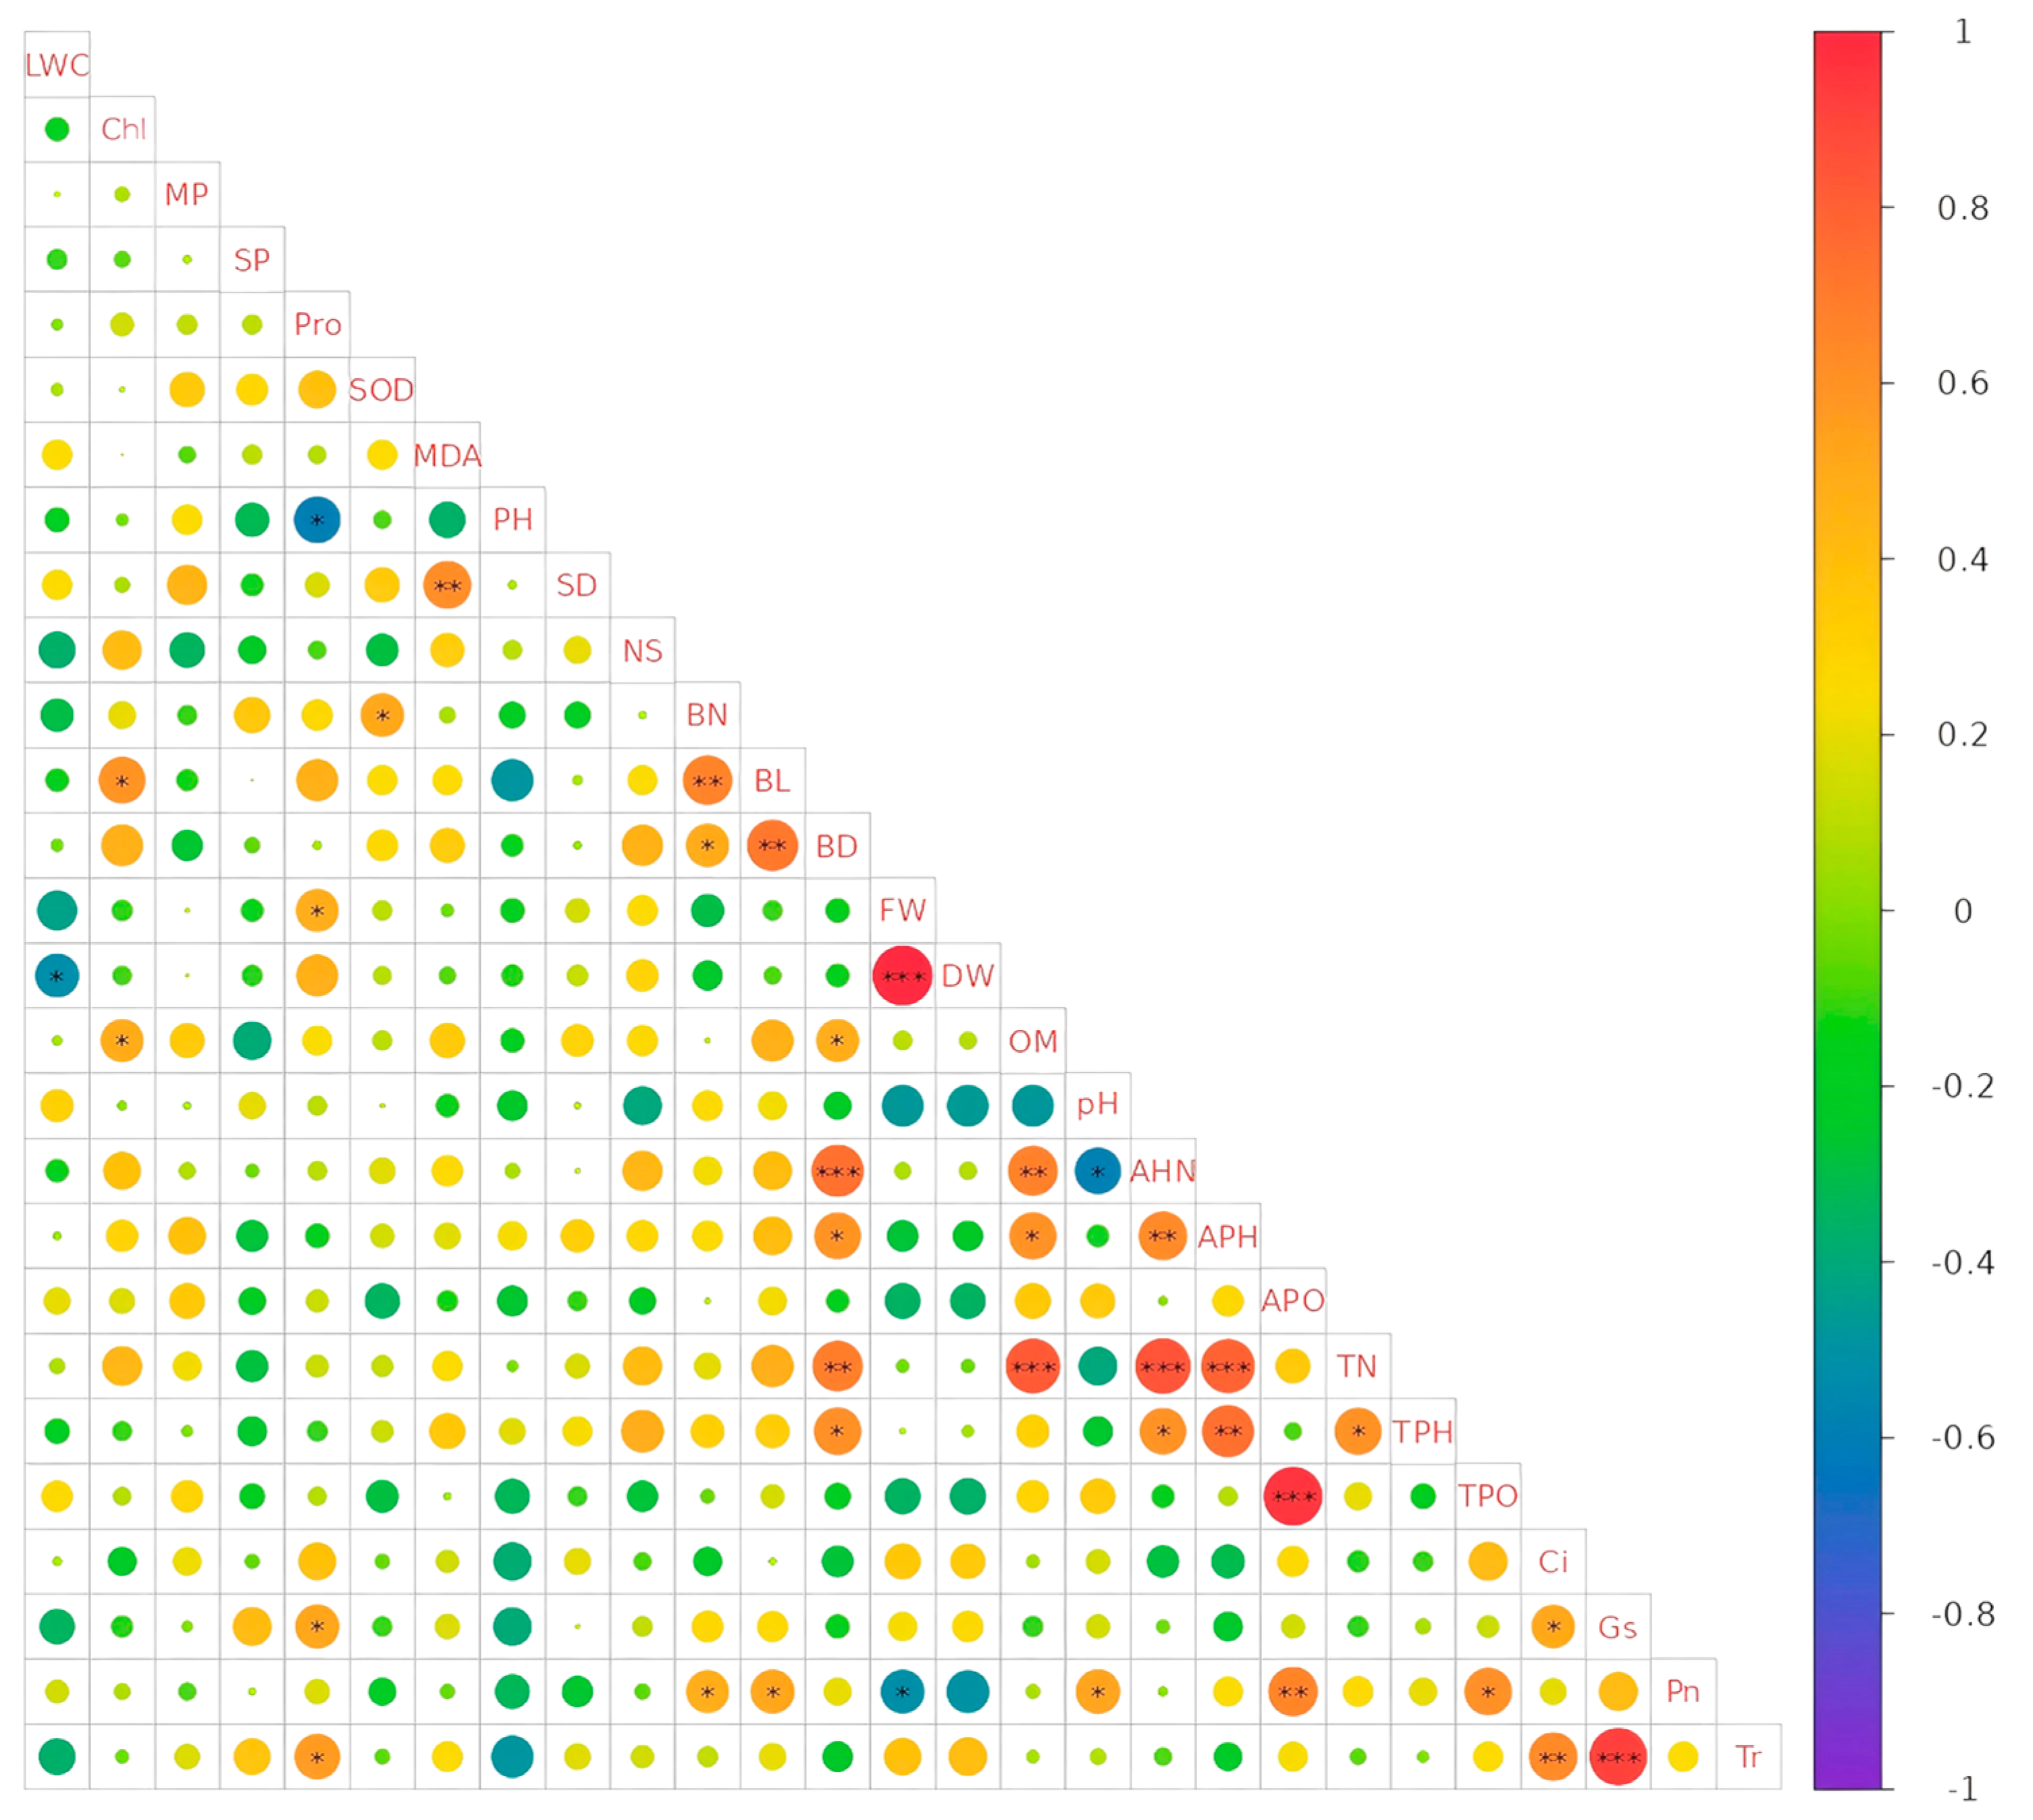
Furthermore, significance analysis of 27 indicators (Figure 5), including plant height, branch number, proline content, and superoxide dismutase activity, revealed the following correlations: at the p = 0.001 level, there were seven pairs with extremely significant positive correlations, including branch diameter and alkali-hydrolyzed nitrogen, fresh weight and dry weight, and stomatal conductance and transpiration rate. At the p = 0.01 level, there were nine pairs with significant positive correlations, including branch number and branch length, organic matter and alkali-hydrolyzed nitrogen, and intercellular CO2 concentration and transpiration rate. At the p = 0.05 level, there were 18 pairs with significant positive correlations, including proline and stomatal conductance, total nitrogen and total phosphorus, and total potassium and net photosynthetic rate. Finally, at the p = 0.05 level, there were four pairs with significant negative correlations, including leaf water content and dry weight, proline and plant height, and pH and alkali-hydrolyzed nitrogen.
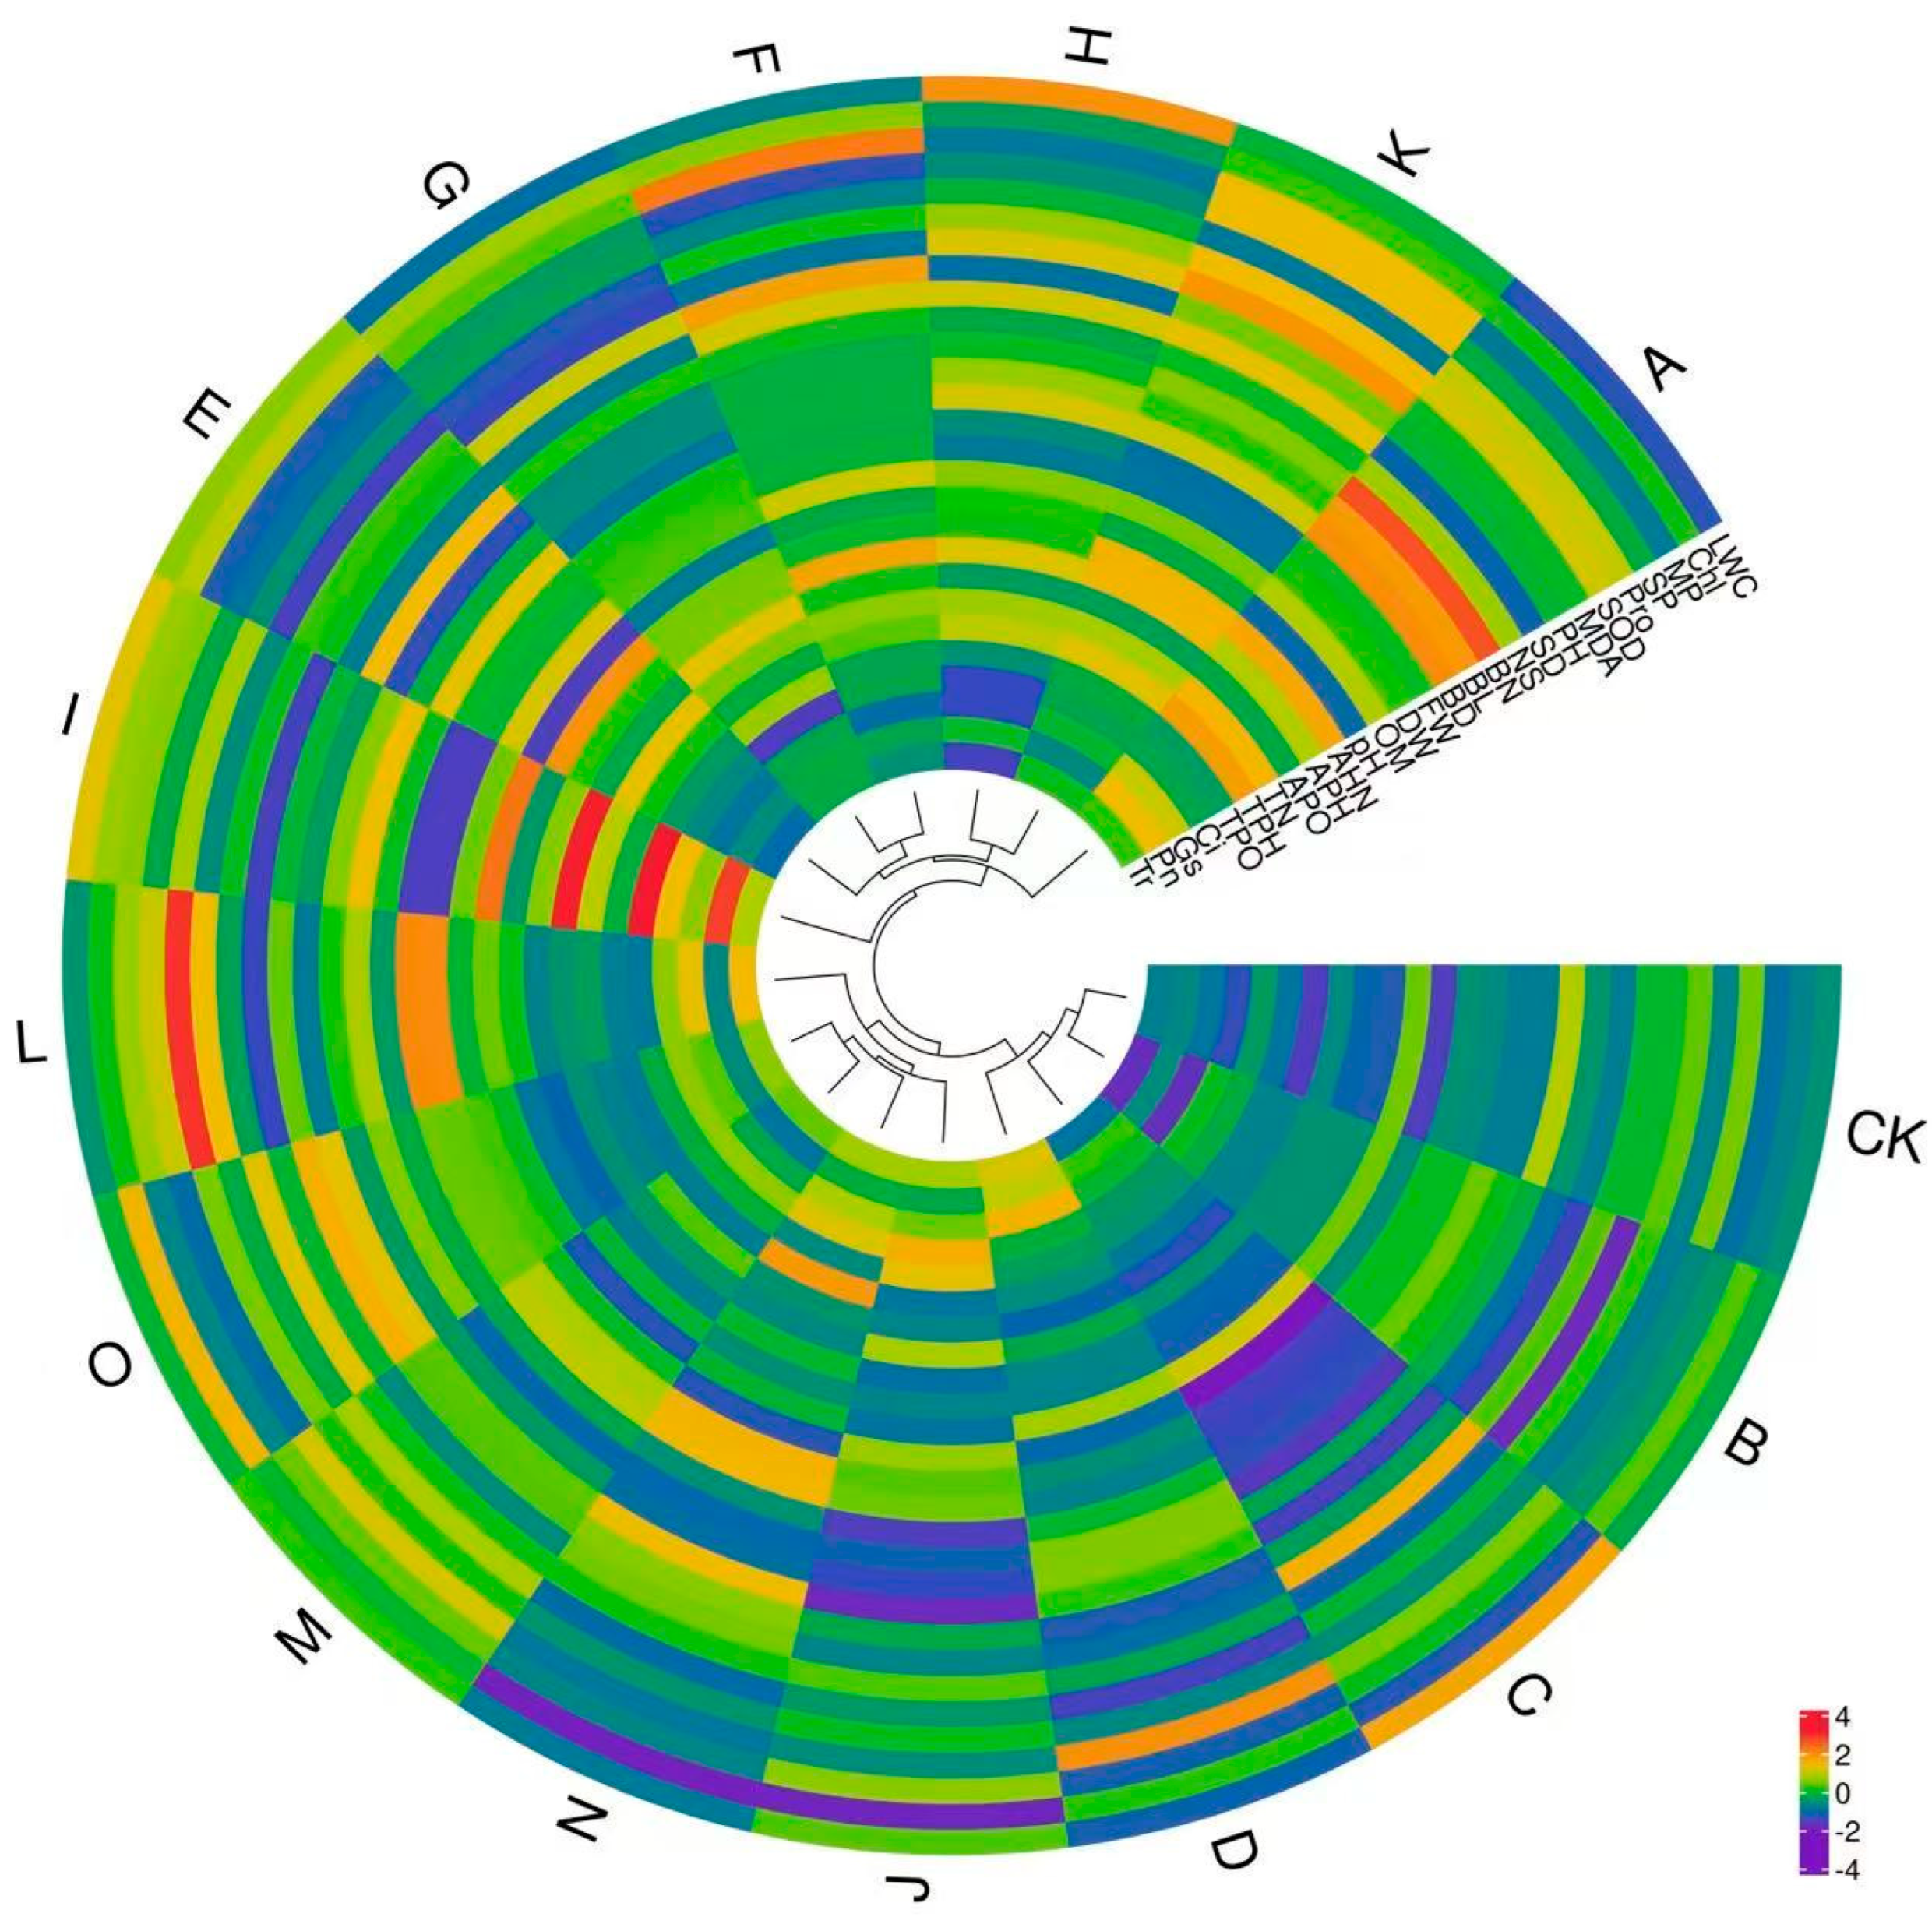
In addition, heatmap analysis revealed that the branch number was highest in group A plants; net photosynthetic rate, total potassium, and available potassium were the highest in group I plants; and proline was the highest in group L plants (Figure 6). Proline may play an important role in helping P. fraseri to resist low-temperature stress.

4. Discussion

4.1. Impact of Substrates on the Growth of P. fraseri

Substrate composition plays a crucial role in the growth of plant morphological indicators [21]. Previous studies have shown that a higher alkali-hydrolyzed nitrogen content in soil can significantly promote the height and crown width growth of camellia plants [22]. This study found that group A (garden soil/coir/municipal sludge = 7:1:2) plants exhibited the best performance in branch number, branch length, and branch diameter, which may be related to the higher alkali-hydrolyzed nitrogen content in the substrate. Additionally, research on blueberries has demonstrated that increasing soil organic matter content can enhance plant growth, a finding consistent with the results of this study [23]. Here, the group A substrate had the highest total nitrogen content, with the plants showing optimal branch length, branch number, and branch diameter, suggesting that soil total nitrogen content has a promoting effect on the growth of P. fraseri.
It was reported that an appropriate addition of garden greening waste can significantly increase the content of nutrients, including total nitrogen, total phosphorus, total potassium, and available potassium, in the planting substrate, resulting in a 137.4% increase in plant height and a 109.0% increase in the number of flowers in Cosmos bipinnata [24]. Rice husk was used to partially replace peat as a cultivation substrate [V (peat):V (perlite):V (vermiculite):V (rice husk) = 5:2:2:1] for Paeonia suffruticosa, increasing the total phosphorus content of the substrate, and clearly alleviating P (phosphorus) limitation. Thus, the comprehensive characteristics of Paeonia suffruticosa plants were further improved [21].
Anthocyanins, as important secondary metabolites, impart color to plant tissues and protect plants from stress caused by environmental factors, such as low temperature [25]. In C (garden soil/coir/edible fungus residue = 7:1:2), J (garden soil/coir/wheat straw = 7:1:2), and N (garden soil/coir/sawdust = 7:1:2) group plants, most of the leaves turned red, probably as a result of increased anthocyanins. Meanwhile, in these three groups of P. fraseri, the chlorophyll content was relatively low. This may have been due to the specific effect of nutrients on chloroplast development. In addition, pH is an important chemical property of the substrate, which directly affects plant growth and adaptability [26]. In this study, 16 treatments exhibited alkalinity; how it plays a role in P. fraseri under low-temperature stress needs to be further investigated.

4.2. Photosynthetic Indicators Affect the Growth and Development of P. fraseri

In addition, it was reported that minimizing vapor pressure deficit (VPD) fluctuations maintains higher stomatal conductance and photosynthesis, resulting in improvement of plant growth in lettuce [27]. It was also found that the shoot dry weight, leaf area, and leaf mass per area of fully expanded leaves were increased with moderate VPD fluctuation [27]. In group A, the branch number, branch length, and branch diameter were all higher than in the other groups, which may be related to its higher stomatal conductance. However, similar phenotypes of plant height, stem diameter, and new shoots were not observed in group A plants. This indicates that the morphological indicators of P. fraseri were affected by various factors.
In group O (garden soil/coir/pond sediment = 7:1:2) plants, the chlorophyll content and leaf water content in the leaves were higher than those in all other groups. Meanwhile, in group O, the stem diameter and new shoots number were also higher than in the other groups of P. fraseri. However, correlation analysis showed that the stem diameter and new shoots number were all not positively correlated with the new shoot number and stem diameter. Therefore, the regulation of plant morphological indicators may be influenced by other factors.

4.3. Impact of Substrates on the Physiological Status of P. fraseri

Superoxide dismutase, as the first line of defense in plants for scavenging reactive oxygen species, catalyzes the dismutation of superoxide radicals, thereby enhancing plant tolerance to abiotic stress [17]. It was reported that superoxide dismutase is involved in the response of hybrid larch seedlings to low temperatures [28]. In line 1307, when the low-temperature stress (cold stress at 4 °C and freezing stress at −12 °C) duration was 24 h, superoxide dismutase activity was significantly higher than that in the control (25 °C), by more than three times [28]. In Cibotium barometz, the superoxide dismutase activity was increased significantly under low-temperature stress [29]. Studies have demonstrated that superoxide dismutase participates in low-temperature stress responses in plants such as tomato (Solanum lycopersicum) [30] and red mangrove (Rhizophora stylosa) [31]. This study also found that under natural low-temperature conditions, group L plants exhibited the highest superoxide dismutase activity in their leaves, indicating that superoxide dismutase may play a significant role in the low-temperature tolerance of P. fraseri.
Meanwhile, under environmental stress, plants exhibit increased proline levels. The application of potential external osmotic protective compounds such as proline is one of the approaches used to counteract the adverse effects of low-temperature stresses on plants [32,33]. Proline accumulation not only serves as a stress signal but also enhances plant resistance to abiotic stress by improving photosynthesis and enzymatic and non-enzymatic antioxidant activities, regulating osmotic potential, and maintaining sodium–potassium homeostasis [32]. In other words, the level of free proline content is closely related to the strength of plant stress resistance. Studies have shown that an increase in proline content in the roots of Caragana korshinskii Kom. enhances the plant’s stress resistance [34]. Low-temperature stress treatment at 4 °C on three species of the Dendrobenthamia genus resulted in elevated proline content, thereby improving the plant’s cold tolerance [35]. Under low-temperature stress, the proline content in the leaves of Dendrobium hybrida significantly increased compared to the control, enabling the plant to cope with low-temperature stress [36]. Similar findings have been reported in plants such as centipede grass (Eremochloa ophiuroides) [37], peanut [38], and Ligustrum lucidum [39]. In this study, group L (garden soil/coir/pear residue = 7:1:2) P. fraseri leaves exhibited the highest proline content under natural low-temperature conditions, indicating the plant’s enhanced ability to withstand low temperatures. Therefore, superoxide dismutase activity and proline content can be used as primary indicators for the evaluation of P. fraseri low-temperature resistance identification.

5. Conclusions

Under natural low-temperature environmental conditions, 14 combined treatments, including A (garden soil/coir/municipal sludge = 7:1:2), B (garden soil/coir/cyanobacterial mud = 7:1:2), and D (garden soil/coir/vermicompost = 7:1:2), etc., can be promoted and applied in P. fraseri cultivation. However, the C (garden soil/coir/edible fungus residue = 7:1:2) and the J (garden soil/coir/wheat straw = 7:1:2) two treatments were not appropriate. Interestingly, in the E (garden soil/coir/pig manure = 7:1:2), N (garden soil/coir/sawdust = 7:1:2), and O (garden soil/coir/pond sediment = 7:1:2) groups, the number of new shoots was the largest, which is of great significance for applications such as cutting propagation. In P. fraseri, proline plays an important role in resisting low-temperature stress. Future studies should investigate whether exogenous proline can improve the resistance of P. fraseri to low temperature. Additionally, the mechanism of leaf reddening and the increase in the number of new shoots also needs to be further investigated. Based on a comprehensive evaluation of both morphological and physiological indicators, group A P. fraseri ranked the highest, indicating that the group A treatment (garden soil/coir/municipal sludge = 7:1:2) is the ideal substrate for the growth of P. fraseri under natural low-temperature conditions. Specifically, the group L (garden soil/coir/pear residue = 7:1:2) treatment had the strongest ability to resist low temperature. In the future, the mechanisms by which agricultural waste helps promote P. fraseri growth and improves its ability to resist low temperatures need to be further explored.

Author Contributions

X.L., J.L. and A.L. performed the experiments; K.Z. and Y.Z. conceptualized and supervised the research; X.L., K.Z. and A.L. participated in the writing of the manuscript. All authors have read and agreed to the published version of the manuscript.

Funding

This research was funded by Key Projects of Natural Science Research in Colleges and Universities of Anhui (2022AH051621, 2022AH051622, 2024AH050326), Introduction of Talent Projects of Anhui Science and Technology University (JZYJ202201), and the Foundation of Key Laboratory of Biology of Ornamental Plants in East China, National Forestry and Grassland Administration (KFE202403).

Data Availability Statement

All data included in this study are available upon request by contacting the corresponding author.

Conflicts of Interest

The authors declare no conflicts of interest.

Abbreviations

The following abbreviations are used in this manuscript:
Chlchlorophyll
LWCleaf water content
Ciintercellular CO2 concentration
Gsstomatal conductance
Pnnet photosynthetic rate
Trtranspiration rate
MDAmalondialdehyde
SODsuperoxide dismutase
Proproline
SPsoluble protein
OMorganic matter
AHNalkali-hydrolyzed nitrogen
APHavailable phosphorus
APOavailable potassium
TNtotal nitrogen
TPHtotal phosphorus
TPOtotal potassium
PHplant height
SDstem diameter
BNbranch number
BLbranch length
BDbranch diameter
NSnew shoots
MPmembrane permeability
FWfresh weight
DWdry weigh

References

  1. Yu, X.; Kou, Y.; Jia, R.; Zhao, X.; Zha, N.; Guo, Y.; Zhang, Q.; Ge, H.; Yang, S. Advances in overwintering physiological responses and molecular regulation mechanism of cold tolerance in woody plants. Mol. Plant Breed. 2022, 1–19. Available online: https://link.cnki.net/urlid/46.1068.S.20220712.1651.010 (accessed on 29 August 2025).
  2. Lu, L.; Chen, Y.; Xue, C.; Huang, X.; Zhao, Y. Overexpression of the tea plant CsWRKY29 transcription factor influences cold tolerance and growth development in transgenic tobacco. Genom. Appl. Biol. 2025, 44, 527–536. [Google Scholar]
  3. Zhao, T.; Zhao, J.; Zhang, D.; Chen, C. Comparative study on the anatomical and physiological characteristics and cold resistance of 8 almond varieties. J. Arid Land Resour. Environ. 2024, 38, 182–190. [Google Scholar]
  4. Sun, G.; Chen, F.; Meng, X.; Huang, D.; Meng, Q. Study on the anatomic structure of leaves of nine evergreen broad-leaved plants. N. Horticult. 2024, 5, 53–61. [Google Scholar]
  5. Deng, C.; Liu, X.; Liao, F.; Chen, S.; Yang, L.; Yin, P. Light intensity plays the key role in the regulation of leaf color, anthocyanin and polyphenol profiles, as well as antioxidant activity of Photinia × fraseri leaves. Arab. J. Chem. 2024, 17, 106046. [Google Scholar] [CrossRef]
  6. Si, M.; Mu, Y. Comparison of carbon sequestration and cooling benefits of plants in different landscaped green sites based on GGE biplot. Chin. J. Appl. Ecol. 2024, 36, 682–692. [Google Scholar] [CrossRef]
  7. Kong, Q.; Zhang, J.; Chen, S.; Zhang, J.; Ren, Y.; Jin, X.; Chen, J. Effects of periodic drought with severe exhaust exposure on particle retention capacity and physiological responses of Photinia × fraseri Dress. Ecotoxicol. Environ. Saf. 2022, 241, 113807. [Google Scholar] [CrossRef]
  8. Wang, F.; Liu, N.; Chen, K.; Xie, Z. Growth performance of two Photinia × fraseri varieties introduced to Jinzhong region. J. Shanxi Agric. Sci. 2023, 51, 69–73. [Google Scholar] [CrossRef]
  9. Detti, C.; Gori, A.; Azzini, L.; Nicese, F.P.; Alderotti, F.; Lo Piccolo, E.; Stella, C.; Ferrini, F.; Brunetti, C. Drought tolerance and recovery capacity of two ornamental shrubs: Combining physiological and biochemical analyses with online leaf water status monitoring for the application in urban settings. Plant Physiol. Biochem. 2024, 216, 109208. [Google Scholar] [CrossRef] [PubMed]
  10. Zhong, Q.; Yuan, X.; Wei, S.; Zhang, N.; Xiao, Y.; Huo, G.; Cui, C. First report of Pseudopestalotiopsis ixorae causing leaf spot of Photinia × fraseri in China. Plant Dis. 2024, 108. [Google Scholar] [CrossRef]
  11. Wu, H.; Yang, S.; Chen, J.; Wang, B.; Liu, M.; Shen, J.; Zheng, G. Adsorption capacity and photosynthetic response of Photinia fraseri on different particle size. J. Fujian Agric. For. Univ. (Nat. Sci. Ed.) 2018, 47, 600–606. [Google Scholar]
  12. Shen, S.; Wang, J.; Zhou, T.; Ma, Y.; Wang, B. Physiological responses of typical subtropical landscape shrubs to artificial light at night. Chin. J. Appl. Ecol. 2023, 34, 2321–2329. [Google Scholar]
  13. Hu, X.; Yuan, Q.; Zhan, M.; Zhou, S.; Hu, W. Effects of low temperature in winter on photoinhibition of sun leaves and shade leaves in three evergreen broad-leaved plants. J. Plant Resour. Environ. 2023, 32, 65–72. [Google Scholar]
  14. Hu, W.; Xiao, Y.; Yan, X.; Ye, Z.; Zeng, J.; Li, X. Photoprotective mechanisms under low temperature and high light stress of Photinia × fraseri and Osmanthus fragrans during overwintering. Bull. Bot. Res. 2021, 41, 938–946. [Google Scholar] [CrossRef]
  15. Gusta, L.; Wisniewski, M. Understanding plant cold hardiness: An opinion. Physiol. Plant. 2013, 147, 4–14. [Google Scholar] [CrossRef]
  16. Xu, C. Research progress on the mechanism of improving plant cold hardiness. Acta Ecol. Sin. 2012, 32, 7966–7980. [Google Scholar] [CrossRef]
  17. Zhao, Z.; Liu, A.; Zhang, Y.; Yang, X.; Yang, S.; Zhao, K. Effects of progressive drought stress on the growth, ornamental values, and physiological properties of Begonia semperflorens. Horticulturae 2024, 10, 405. [Google Scholar] [CrossRef]
  18. Wang, X.; Huang, J. Principles and Techniques of Plant Physiological and Biochemical Experiments; Higher Education Press: Beijing, China, 2015. [Google Scholar]
  19. Li, Q.; Zhang, L.; He, J.; Li, J.; Zhang, H.; Li, Y.; Gu, Y.; Luo, H.; Lu, M.; Lu, K.; et al. Effects of different shade treatments on Melaleuca seedling growth and physiological properties. BMC Plant Biol. 2025, 25, 203. [Google Scholar] [CrossRef]
  20. Zhang, S.; Zhang, X.; Tian, R.; Gao, Z.; Chen, L.; Hu, Y. Evaluation of heat resistance of new wheat advanced lines at seedling stage. J. Triticeae Crops 2024, 44, 279–1286. [Google Scholar]
  21. You, L.; Zhu, X.; Zhang, Q.; Li, Y.; Chen, X.; Xue, H.; Zhu, P.; Zhang, K. Characteristics of formula substrates added agricultural wastes and their effects on the growth of Paeonia suffruticosa. J. Plant Resour. Environ. 2024, 33, 36–49. [Google Scholar]
  22. Ding, H.; Li, P.; Sun, W.; Wu, L.; Yuan, X.; Zou, S. Effect of different planting patterns on the growth of Camellia and soil physicochemical properties. Jiangsu Agric. Sci. 2018, 46, 106–110. [Google Scholar]
  23. Zhang, Q.; Zhang, S.; Li, L. Effects of organic material-improved purple soil on the growth and development of blueberry. J. Southwest. Univ. (Nat. Sci. Ed.) 2018, 40, 21–28. [Google Scholar]
  24. Yin, Z.; Zhang, L.; Bai, Y. Replacing peat with garden waste compost in Cosmos bipinnata cultivation. J. Zhejiang AF Univ. 2022, 5, 1045–1051. [Google Scholar]
  25. Bi, M.; Liang, R.; Wang, J.; Qu, Y.; Liu, X.; Cao, Y.; He, G.; Yang, Y.; Yang, P.; Xu, L.; et al. Multifaceted roles of LhWRKY44 in promoting anthocyanin accumulation in Asiatic hybrid lilies (Lilium spp.). Hortic. Res. 2023, 10, uhad167. [Google Scholar] [CrossRef]
  26. Zhang, L.; Hu, H. Research progress on effect of soil pH on plant growth. Guizhou Agric. Sci. 2022, 67, 4039–4040. [Google Scholar]
  27. Inoue, T.; Sunaga, M.; Ito, M.; Yuchen, Q.; Yamori, W. Minimizing VPD fluctuations maintains higher stomatal conductance and photosynthesis, resulting in improvement of plant growth in lettuce. Front. Plant Sci. 2021, 12, 646144. [Google Scholar] [CrossRef] [PubMed]
  28. Ning, Y.; Zhao, W.; Cui, C.; Zhang, X.; Zhao, X.; Liu, Y.; Wang, C.; Zhang, H.; Li, S. Physiological indices of five hybrid larch seedlings under low-temperature stress. Forests 2024, 15, 2026. [Google Scholar] [CrossRef]
  29. Lin, Z.; Gan, Y.; Lin, W.; Wang, B.; Guo, C.; Liu, L.; Wang, H. Effects of low temperature stress on the adversity physiology and total flavonoid content of Cibotium barometz leaves. Chin. J. Trop. Crops 2025, 46, 1441–1448. [Google Scholar]
  30. Yang, Z.; Zhang, Y.; Ding, Q.; Xing, H.; Wang, H.; Meng, X.; Fan, H.; Yu, Y.; Cui, N. The role of TOR in response to chilling stress in Solanum lycopersicum L. Plant Growth Regul. 2025, 105, 1–15. [Google Scholar] [CrossRef]
  31. Ouyang, Z.; Shi, J.; Jia, X.; Teng, W.; Liu, X. Effect of exogenous growth regulators on physiological characteristics of cold resistance of Rhizophora stylosa seedlings with different ages under low temperature stress. Chin. J. Appl. Ecol. 2025, 36, 780–790. [Google Scholar] [CrossRef]
  32. Hosseinifard, M.; Stefaniak, S.; Ghorbani Javid, M.; Soltani, E.; Wojtyla, Ł.; Garnczarska, M. Contribution of exogenous proline to abiotic stresses tolerance in plants: A review. Int. J. Mol. Sci. 2022, 23, 5186. [Google Scholar] [CrossRef]
  33. Guo, Q.; Liu, Y.; Sun, N.; Zhang, Y.; Wang, D.; Guo, C. The role of proline in plant resistances to oxidative stress induced by abiotic stresses. J. Plant Genet. Res. 2025, 1–15. [Google Scholar] [CrossRef]
  34. Zhao, W.; Yao, Y.; Guo, Y. The relationship between the shape of Cartagena’s root and free proliferating line. J. Sichuan Univ. (Nat. Sci. Ed.) 2018, 55, 1121–1126. [Google Scholar]
  35. Chen, G.; Zhang, Q.; Tang, S.; Cai, H.; Chen, F.; Liu, G. Physiological changes and cold resistance evaluation of different Dendrobenthamia plants under low temperature stress. Chin. Wild Plant Resour. 2025, 44, 43–49. [Google Scholar]
  36. Wei, X.; Yu, X.; Mo, S.; Lu, S.; Luo, X.; Yi, S.; Liao, Y.; Zhang, J.; Yang, G. The influences of exogenous 2,4-epibrassinolide on physiological characteristics of Dendrobium hybrid seedlings under low-temperature stress. Chin. J. Trop. Crops 2025, 46, 1405–1415. [Google Scholar]
  37. Liu, N.; Lin, S.; Shen, Y. The response of leaf osmolyte content to low temperature in autumn, and its relationship with chilling injury in centipede grass. Acta Pratacult. Sin. 2019, 28, 122–130. [Google Scholar] [CrossRef] [PubMed]
  38. Chang, B.; Zhong, P.; Liu, J.; Tang, Z.; Gao, Y.; Yu, H.; Guo, W. Effect of low-temperature stress and gibberellin on seed germination and seedling physiological responses in peanut. Acta Agron. Sin. 2019, 45, 118–130. [Google Scholar] [CrossRef]
  39. Han, S.; Li, J.; Huang, D.; Zhang, X. Effect of exogenous ABA on the cold resistance of Ligustrum lucidum under the condition of natural decreasing in temperature. For. Ecol. Sci. 2025, 40, 229–238. [Google Scholar]
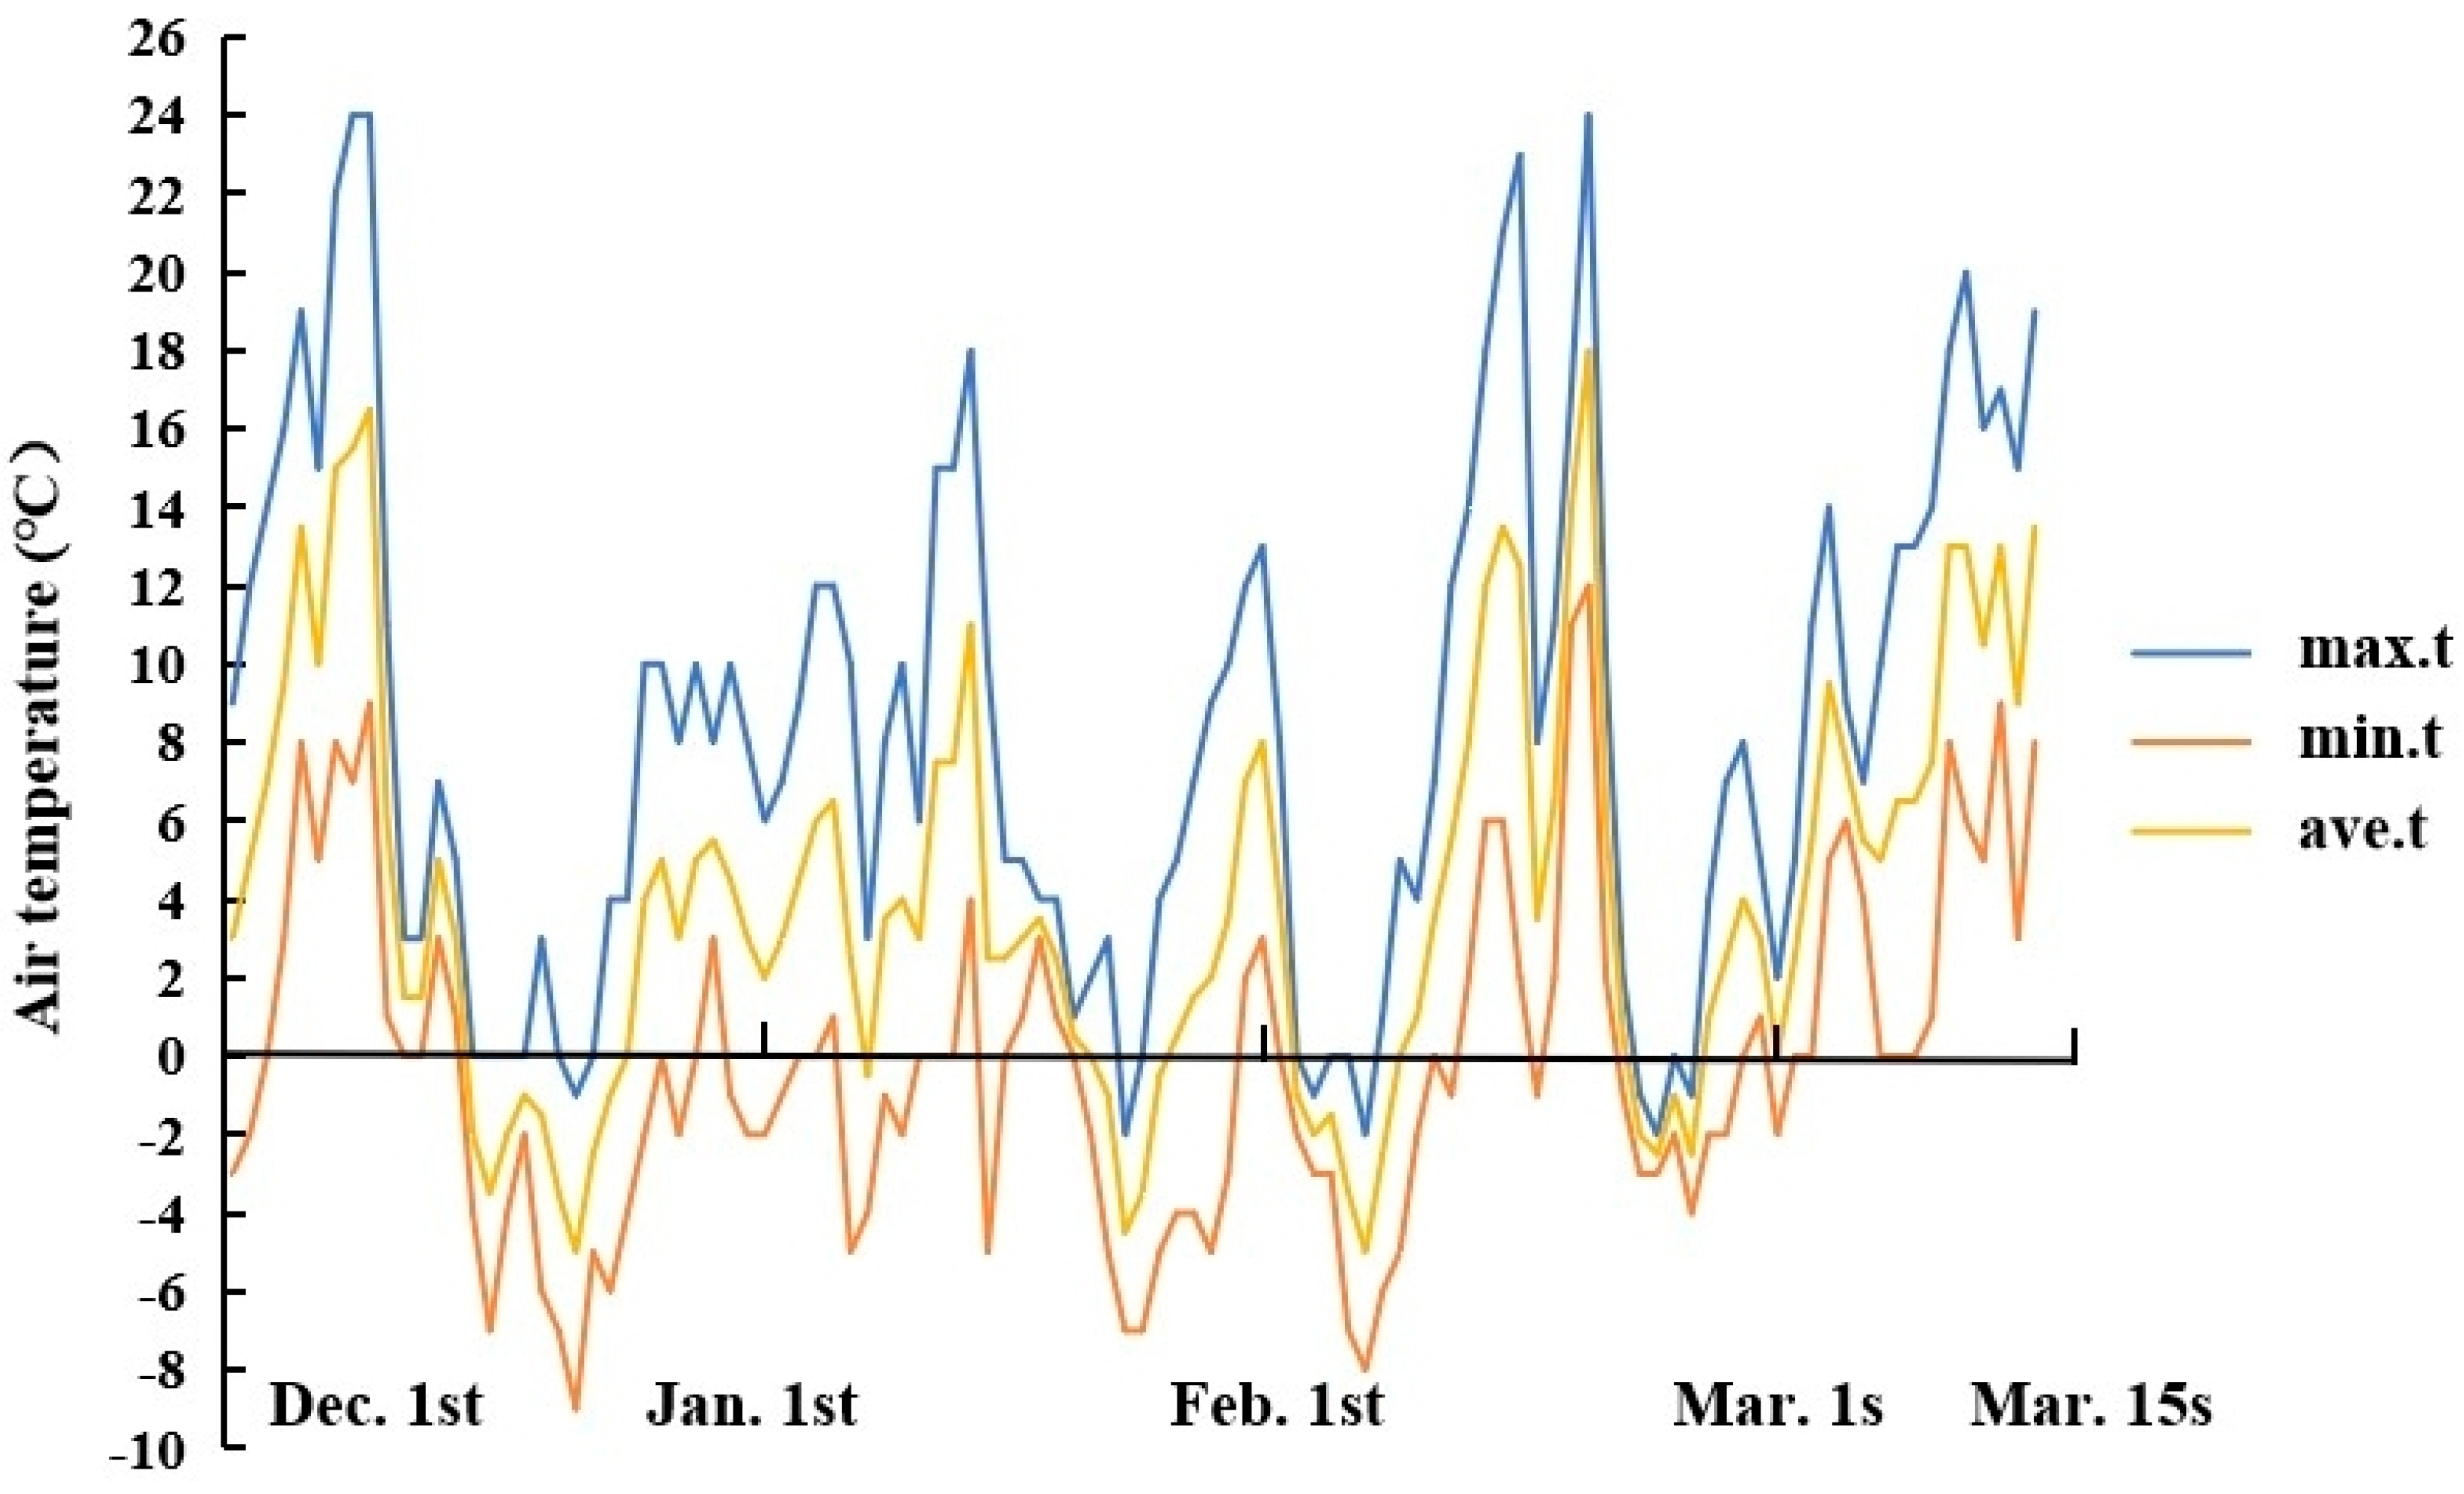
Figure 1. The minimum (min.t), maximum (max.t), and average temperature (ave.t) from 1 December 2023 to 15 March 2024.
Horticulturae 11 01055 g001
Figure 2. Phenotype of P. fraseri under different substrates. (CK) Plant has few branches, short branches, and small branch diameter; (A) The plant has the most branches, the longest branch length, the largest branch diameter, but the plant upper part has no branches. (B) The plant upper part has longer branches than the lower part; (C) The plant height is higher and most of the leaves turned red; (D) The plant lower part has longer branches than the upper part; (E) The upper part of the plant has almost no branches, and the lower part has more and logger branches; (F) The plant height is the highest; (G) The plant lower part has longer branches; (H) The value of the plant stem diameter belongs to the largest one; (I) The plant is the shortest; (J) The plant has the fewest number of branches, and the upper part of the plant has almost no branches; (K) The value of the plant stem diameter belongs to the largest one; (L) Plant has few branches, short branches, and small branch diameter; (M) The upper part of the plant has almost no branches, and the plant lower part has more branches; (N) Plant has few branches, short branches, and small branch diameter, and most of the leaves turned red; (O) The plant has the largest stem diameter (bars = 28 cm).
Horticulturae 11 01055 g002
Figure 3. The phenotype of new shoots of P. fraseri under different treatments. (CK) The number of new shoots is small, and the leaves are dark green; (A) More new shoots, closely grown, and the leaves are dark green; (B) Fewer new shoots, closely grown; (C) Fewer new shoots; the cluster of new shoots is loose; (D) The cluster of new shoots is irregular in shape, and the number of new shoots is small, the new shoots are dark red, and leaves narrow, oblong; (E) The number of new shoots is the most, and the growth is compact, and the new shoots are bright red; (F) The number of new shoots is small, and the leaves are dark green; (G) The new shoots of the plant are closely clustered, and the new shoot is smaller in shape; (H) Fewer new shoots, closely grown, and some of the leaves are light red; (I) The new shoot cluster is larger in shape, and the new shoots are longer, and the new shoots are bright red; (J) The number of new shoots is the least, and the new shoots are bright red, and all the leaves are red; (K) The number of new shoots is small, the new shoots are dark red, and the leaves are dark green; (L) The cluster of new shoots is irregular and small volume in shape, and the number of new shoots is small; (M) More new shoots, closely grown, and the new shoots are dark red, and the leaves are green; (N) The new shoots of the plant are closely clustered, and the new shoot is larger in shape, and the number of new shoots is relatively large, the new shoots are bright red; (O) The cluster of new shoots is irregular in shape, the number of new shoots is relatively large, and the new shoots are dark red, but some of the leaves are pale yellow (bars = 1 cm).
Horticulturae 11 01055 g003
Figure 4. The phenotype of leaves under different substrates. (CK, AO) indicates the adaxial surface of the leaf. (CK1, A1O1) indicates the abaxial surface of the leaf (bars = 3 cm).
Horticulturae 11 01055 g004
Figure 5. Correlation analysis between 27 indexes of P. fraseri. The ball size indicates the strength of the correlation. *, **, and *** indicate significant correlation at levels of p = 0.05, p = 0.01, and p = 0.001, respectively.
Horticulturae 11 01055 g005
Figure 6. Heatmap analysis of 27 indexes of P. fraseri.
Horticulturae 11 01055 g006
Table 1. Cultivation substrates for P. fraseri.
TreatmentSubstrate SpeciesVolume Ratio
CKGarden soil/coir9:1
AGarden soil/coir/municipal sludge7:1:2
BGarden soil/coir/cyanobacterial mud7:1:2
CGarden soil/coir/edible fungus residue7:1:2
DGarden soil/coir/vermicompost7:1:2
EGarden soil/coir/pig manure7:1:2
FGarden soil/coir/cow manure7:1:2
GGarden soil/coir/chicken manure7:1:2
HGarden soil/coir/duck manure7:1:2
IGarden soil/coir/tobacco residue7:1:2
JGarden soil/coir/wheat straw7:1:2
KGarden soil/coir/cassava residue7:1:2
LGarden soil/coir/pear residue7:1:2
MGarden soil/coir/distiller’s grains7:1:2
NGarden soil/coir/sawdust7:1:2
OGarden soil/coir/pond sediment7:1:2
Table 2. Chemical properties of different treatments.
TreatmentOrganic Matter (g/kg)pHAlkali-Hydrolyzed N (mg/kg)Available P (mg/kg)Available K (mg/kg)Total N (g/kg)Total P (g/kg)Total K (g/kg)
CK16.24 j8.35 bc40.47 n16.20 o209.29 l0.59 h0.42 n12.08 de
A32.62 bc7.52 efg438.12 b207.73 d358.38 e2.59 a4.59 b12.14 de
B22.71 g8.34 bc129.31 i72.38 i247.22 k1.16 e0.71 j12.63 d
C13.49 k8.648 c48.49 m21.40 n264.39 j0.77 fg0.54 l11.86 def
D19.89 h8.47 bc103.72 k56.37 j360.45 e0.9 f0.89 i12.13 de
E34.48 a7.24 g466.84 a150.50 g359.02 e2.48 a2.13 f12.07 de
F33.81 ab7.92 cdef208.53 f290.60 a528.46 d2.06 bc2.47 e12.28 de
G29.318 e7.63 defg278.23 d179.38 f981.55 b2.01 bc1.49 h14.62 c
H30.92 b8.22 bcd229.74 e240.39 c303.43 g2.13 b3.27 d11.82 def
I30.19 de9.27 a140.59 h184.62 e1705.55 a2.21 b1.59 g19.90 a
J31.44 cd7.59 cde107.30 j30.11 m794.32 c1.18 de0.47 m15.91 b
K30.66 d7.95 defg415.51 c268.57 b323.01 f2.15 b3.72 c12.57 de
L26.42 f8.33 bc228.64 e53.61 k266.62 i1.38 d0.60 k11.15 f
M27.36 f7.38 fg201.63 g46.35 l284.81 h1.90 c0.59 k12.74 d
N18.33 i8.04 bcde129.19 i123.65 h207.57 l1.30 de4.64 a11.65 ef
O29.14 e8.10 bcde87.49 l15.79 o246.49 k1.16 e0.54 l12.57 de
Note: Letters in the table indicate significant differences at the p = 0.05 level.
Table 3. Phenotype of P. fraseri under different treatments.
TreatmentPlant Height (cm)Stem Diameter (mm)Branch NumberBranch Length (cm)Branch Diameter (mm)No. New Shoots
CK122.33 de17.28 fg48 b7.73 g3.39 j3.57 ef
A122.17 de16.38 gh64 a15.70 a4.53 a4.94 b
B123.67 cd15.36 h38 de10.53 e3.93 d3.06 f
C128.00 ab18.41 ef37 ef5.13 i3.17 k2.41 g
D118.67 fg16.15 ef45 b11.90 d3.72 ef4.46 bc
E122.83 d17.29 fg28 h9.87 f4.24 b5.72 a
F128.67 a22.60 cd38 de9.67 f3.66 fg4.24 cd
G126.00 bc17.28 fg34 f8.33 g3.37 j4.45 bc
H118.83 fg22.64 ab41 cd12.27 cd4.18 bc3.80 de
I116.67 g19.34 de46 b14.33 b3.76 e3.65 e
J119.67 f18.69 ef27 h6.67 h3.08 i2.09 g
K124.17 cd23.09 a45 b11.07 e4.16 c4.22 cd
L117.00 g20.81 cd42 c12.60 c3.54 hi3.22 ef
M120.00 ef20.52 cd36 de6.93 h3.59 gh4.61 bc
N124.17 cd21.24 bc31 g6.93 h3.49 i5.70 a
O122.17 de23.80 a36 de12.00 cd3.62 g5.54 a
Note: Letters in the table indicate significant differences at the p = 0.05 level.
Table 4. Detection of seven physiological indexes under different treatments.
TreatmentMembrane Permeability (%)Soluble Protein (mg/g)Proline (mg/g)Superoxide Dismutase (U/g)Malondialdehyde (µmol/g)Fresh Weight (g)Dry Weight (g)
CK46.33 j82.57 e3.75 kl219.70 d0.02 cde0.57 fg0.27 de
A47.93 i67.40 f19.69 b254.74 b0.02 cde0.68 de0.34 bc
B52.16 g59.33 i3.24 l212.01 e0.01 h0.68 de0.33 cd
C59.20 f83.25 e5.15 ij194.49 f0.01 fg0.44 hi0.20 fg
D43.78 k110.75 a4.361 jk118.34 k0.02 de0.55 fg0.27 de
E43.62 k53.30 i5.33 ij118.34 k0.02 c0.67 de0.31 cd
F83.78 a45.85 k3.96 kl206.70 e0.01 f0.64 ef0.31 cd
G62.72 e63.15 h7.24 h134.00 j0.01 gh0.70 de0.34 bc
H47.70 i60.22 i9.61 g231.64 c0.03 b0.57 fg0.25 e
I65.11 d65.93 g17.75 c164.78 h0.02 cd0.42 i0.19 g
J65.32 d60.08 i11.41 f171.94 h0.02 c0.75 bc0.35 bc
K74.29 b100.30 b2.92 l268.52 a0.03 a0.52 gh0.25 ef
L66.50 c92.13 d37.40 a266.41 a0.02 e0.99 a0.48 a
M63.50 e94.50 c12.49 e237.31 c0.02 c0.82 bc0.38 b
N49.37 h55.08 j5.83 i144.08 j0.02 c0.90 b0.44 a
O49.54 h52.32 k15.73 d184.51 g0.03 b0.75 cd0.36 bc
Note: Letters in the table indicate significant differences at the p = 0.05 level.
Table 5. Analysis of leaf water content (LWC), chlorophyll (Chl), intercellular CO2 concentration (Ci), stomatal conductance (Gs), net photosynthetic rate (Pn), and transpiration rate (Tr) under different treatments.
TreatmentLWC (%)Chl (mg/g)Ci (mg/m3)Gs (mmol∙m−2∙s−1)Pn (µmol∙m−2∙s−1)Tr (mmol∙m−2∙s−1)
CK51.72 abcd4.49 h343.63 i41.57 g1.52 hi0.90 h
A50.50 fg6.66 ef391.39 fg81.24 ab7.33 b1.28 de
B52.17 fg7.20 d409.85 e23.44 h1.71 ghi0.54 i
C55.46 abc3.261 i384.53 g59.50 f4.29 d0.85 h
D50.72 bcde6.85 de398.32 f91.13 a6.02 c1.58 a
E53.68 efg8.43 b375.81 h41.11 g1.67 ghi0.81 h
F51.42 defg7.67 c391.66 fg38.60 g2.43 fgh0.97 gh
G51.01 a7.95 c333.20 j52.94 f2.77 ef1.09 fg
H55.82 a5.25 g340.56 ij30.28 h3.64 de0.63 i
I54.69 efg7.88 c469.52 b72.77 bcd11.30 a1.46 bc
J53.26 bcde1.80 j477.59 a69.51 de2.54 gf1.45 bcd
K52.44 fg6.98 de390.61 fg59.17 f1.55 hi1.22 ef
L51.79 cdef6.58 ef435.23 d86.23 a1.47 hi1.67 a
M53.14 g6.18 f435.61 d53.66 f0.76 i1.33 cde
N51.25 g1.68 j460.54 c76.23 cd2.79 ef1.44 bcd
O52.56 ab9.78 a434.93 d67.75 e1.60 ghi1.39 cd
Note: Letters in the table indicate significant differences at the p = 0.05 level.
Table 6. Comprehensive evaluation of the morphological indicators of P. fraseri.
TreatmentPlant
Height
Stem
Diameter
Branch
Length
Branch
Diameter
Branch
Number
No. New ShootsComposite
Index
Ranking
CK0.490.280.250.070.570.390.3410
A0.480.200.920.320.970.740.601
B0.580.110.490.190.330.260.3311
C0.870.390.030.030.300.100.2812
D0.240.180.600.150.510.620.387
E0.520.290.430.260.080.930.425
F0.910.770.410.130.330.560.523
G0.730.290.300.070.230.610.378
H0.260.770.630.250.390.450.464
I0.110.470.810.160.520.410.416
J0.310.410.160.010.060.020.1613
K0.610.820.530.240.510.560.542
L0.130.610.660.110.430.310.378
M0.330.580.180.120.280.650.369
N0.610.650.180.100.160.930.446
O0.480.880.610.120.280.880.542
Table 7. Comprehensive evaluation of physiological indexes of P. fraseri.
TreatmentLWCChlCiGsPnTrMPSPProSODMDAFWDWComposite IndexRanking
CK0.040.350.090.280.080.370.920.330.040.670.500.300.330.3311
A0.340.610.400.830.580.650.880.200.490.880.480.490.530.572
B0.050.680.530.030.090.100.780.120.030.620.960.490.490.387
C0.100.200.360.530.320.330.610.340.080.510.760.100.090.3311
D0.020.640.450.970.470.870.980.590.060.040.580.280.320.484
E0.070.830.300.280.090.300.990.070.080.040.420.470.450.3410
F0.030.740.410.240.150.420.010.000.050.590.720.420.440.3212
G0.030.770.020.440.180.500.520.160.140.140.860.520.540.378
H0.110.440.070.130.260.170.890.130.200.740.190.310.260.3013
I0.090.760.920.710.930.780.460.180.430.330.470.070.080.484
J0.070.020.970.670.160.770.460.130.260.370.400.600.560.425
K0.050.650.400.530.080.600.240.490.020.970.020.220.240.359
L0.040.600.690.900.070.940.430.420.980.950.590.980.950.661
M0.060.550.700.450.010.680.500.440.290.770.450.710.670.484
N0.030.990.860.760.190.760.850.090.100.200.440.840.840.533
O0.050.010.690.640.080.730.840.060.380.450.180.590.580.416
Table 8. Comprehensive evaluation of the growth status of P. fraseri.
TreatmentMorphologyPhysiologyComposite IndexRanking
CK0.340.330.3411
A0.600.570.591
B0.330.380.3610
C0.280.330.3112
D0.380.480.436
E0.420.340.388
F0.520.320.427
G0.370.370.379
H0.460.300.388
I0.410.480.455
J0.160.420.2913
K0.540.350.455
L0.370.660.522
M0.360.480.427
N0.440.530.493
O0.540.410.484
Disclaimer/Publisher’s Note: The statements, opinions and data contained in all publications are solely those of the individual author(s) and contributor(s) and not of MDPI and/or the editor(s). MDPI and/or the editor(s) disclaim responsibility for any injury to people or property resulting from any ideas, methods, instructions or products referred to in the content.