Article

Effects of Fertilization on Stoichiometric Characteristics, Rhizosphere Microorganisms and Metabolites Under Substrate Cultivation for Pepper

1
College of Horticulture, Henan Agricultural University, Zhengzhou 450046, China
2
Puyang Academy of Agriculture and Forestry Sciences, Puyang 457001, China
*
Authors to whom correspondence should be addressed.
Horticulturae 2025, 11(7), 764; https://doi.org/10.3390/horticulturae11070764
Submission received: 6 May 2025 / Revised: 29 June 2025 / Accepted: 30 June 2025 / Published: 2 July 2025

Abstract

Substrate cultivation is a widely used method in greenhouses to address the deterioration of the soil environment caused by excessive fertilization. However, the effects and relationships of fertilization treatments on stoichiometric characteristics, rhizosphere soil microorganisms, and metabolites are still unclear. To determine the optimal amount and frequency, two fertilization intervals (every 5 days and every 10 days) and four total fertilization levels (378.5, 529.9, 605.6, and 757.0 kg·ha−1) were considered, along with a control (CK). Among the treatments, T6 (every 10 days with a total fertilization amount of 605.6 kg·ha−1) resulted in the best pepper plant growth, highest photosynthetic capacity, and maximum yield. Fertilization significantly changed the species composition and community structure of rhizosphere microorganisms. It also affected the composition of rhizosphere metabolites, with differential metabolites significantly enriched in alanine, aspartate, and glutamate metabolism, as well as butanoate metabolism. This study provides insights into high-quality and high-yield cultivation of peppers, as well as the rhizosphere microorganisms and metabolites that play an important role in production.

1. Introduction

In greenhouses, excessive fertilizer application has become a common practice to maintain yield levels in vegetable production [1]. However, excessive fertilization can result in various problems, including secondary salinization and nutrient imbalances [2,3,4]. To address these problems that hinder the sustainable development of agriculture, soilless cultivation technology has emerged [5]. Substrate culture, as a form of soilless cultivation, holds a significant position in greenhouse cultivation. Nevertheless, fertilization remains a crucial factor influencing plant growth and development [6,7]. Therefore, it is imperative to develop precision fertilization strategies for sustainable substrate culture. Rational fertilizer use that ensures crop yield and quality is essential, and the appropriate dosage needs to be quantified.
Nitrogen (N), phosphorus (P), and potassium (K) are the most demanded elements, which are involved in plant growth, development, and metabolic processes [8,9,10,11]. Rational application of fertilizers can effectively promote plant growth. However, excessive fertilizer use in soil results in nutrient accumulation, which may be toxic to crops and soil microorganisms, and can seriously damage the soil ecological environment [12]. As a key component of the soil ecosystem, microorganisms promote the growth and health of plants by enhancing nutrient uptake, inhibiting pathogens, and maintaining community stability [13]. Microorganisms are deeply involved in nutrient cycling between plants and soil and play a key role in sustaining ecosystem stability [14]. The application of N and P can affect the activity of microorganisms involved in carbon (C) and N cycling [15]. Saxena et al. found that plant growth-promoting rhizobacteria (PGPRs) promote the growth of tobacco plants [16], while Ansari et al. suggested that arbuscular mycorrhizal fungi (AMFs) and rhizobia enhance plant biomass by synthesizing hormones, fixing N, and dissolving P and K compounds [17]. Microorganisms strongly affect crop growth and soil quality and are now recognized as important indicators of soil fertility and health [18]. Soil metabolites also play an important factor in assessing soil health, as their composition and concentration are closely related to microbial community structure [19]. These metabolites are important C sources for microorganisms and can act as signaling molecules [20,21]. Plants, in turn, can affect the metabolite composition by changing the structure and activity of soil microbial communities [22]. The interaction between soil microorganisms and their associated metabolites and plants reflects a complex relationship [23], and understanding the dynamic changes in rhizosphere soil microorganisms and metabolites during plant growth is crucial to guide plant production.
Peppers (Capsicum annuum L.) are among the most important crops in greenhouse cultivation and one of the most widely cultivated vegetables [24]. However, the optimal fertilization treatment, as well as the rhizosphere microorganisms and secondary metabolites that play an important role in pepper production under substrate cultivation, remain unclear. Therefore, the main objectives of this study were to: (i) determine the optimal fertilization frequency and amount for peppers grown in substrate cultivation; (ii) identify the key microorganisms and metabolites contributing to pepper yield and quality; and (iii) analyze the interrelationships among microorganisms, metabolites, and pepper production. The results of this study provide valuable information for fertilizer management and sustainable development of substrate cultivation for peppers.

2. Materials and Methods

2.1. Experimental Materials

This experiment was conducted from March to July 2024 in a plastic greenhouse located at the Science and Education Park of Henan Agricultural University, Zhengzhou, Henan, China. The pepper variety used in the trials was ‘Jinfu 175’. Seedlings were transplanted into substrate cultivation at the six-leaf stage on 21 March, and mature plants were harvested on 9 July. The physicochemical properties of the cultivation substrate were as follows: pH 6.33, EC 4.07 μS·cm−1, organic C 23.64 mg·g−1, total N 19.7 g·kg−1, total P 13.9 g·kg−1, available N 774.90 mg·kg−1, and available P 139.90 mg·kg−1.

2.2. Experimental Design

The experiment involved two fertilization frequencies and four total fertilization amounts, resulting in eight treatments (T1 to T8) plus a control (CK). The fertilization frequencies and amounts are listed in Table 1. One week after planting, plants received their first fertilization treatment (28 March). The amount of fertilizer applied each time was set according to the pepper growth period, which consisted of a 40-day vegetative growth period (28 March to 7 May 2024), followed by a 60-day fruiting period (8 May to 6 July 2024). Urea served as the N source, monoammonium phosphate as the P source, and potassium nitrate as the K source, mixed in a 1:2:1 ratio and applied with water and fertilizer integration technology. Each plot measured 4.5 m2 (3.5 m long × 1.3 m wide). The center of each plot contained a cultivation trough filled with substrate (15 cm deep × 15 cm wide), lined with plastic film, with 15 plants planted in a single row. Each condition was tested in triplicate.

2.3. Determination of Physiological Indices of Plants and Cultivation Substrates

2.3.1. Determination of Plant Morphology and Biomass of Peppers

Plant morphology characteristics were measured on 28 March (day 0), 17 April (day 20), 7 May (day 40), and 27 May (day 60). During the fruit ripening period, fruits from each treatment were harvested, and the yield of peppers for each experimental plot was recorded. The plants were cleaned with water and divided into aboveground and belowground parts for fresh weight determination on 9 July.

2.3.2. Determination of Plant Photosynthetic Capacity

At the mid-growth stage (22 April; day 25), five plants were randomly selected from each treatment. Photosynthetic parameters of pepper leaves, including net photosynthetic rate, intercellular CO2 concentration, transpiration rate, and stomatal conductance were measured between 9:00 and 11:00 am on 16 May (day 49) using a photosynthetic instrument (LI-COR 6400XT, LI-COR, Inc., Lincoln, NE, USA). Measurements were carried out at a constant photosynthetic photon flux density of 1000 μmol m−2 s−1 and a flow rate of 500 μmol m−2 s−1. The contents of chlorophyll a, chlorophyll b, total chlorophyll, and carotenoid in the leaves were determined by spectrophotometry, with the sample extracted using 96% ethanol at room temperature for 24 h [25].

2.4. Analysis of Plant and Soil Elemental Content

Dry samples of plants and cultivation substrates were digested with concentrated sulfuric acid. The total N content in roots, stems, leaves, fruits, and substrates was determined using a K1160 automatic Kjeldahl analyzer (Hanon Advanced Technology Group Co., Ltd., Jinan, China). P content was measured by ammonium molybdate spectrophotometry, and organic C content was determined by potassium dichromate oxidation spectrophotometry. The available N content in the substrate was determined using the diffusion absorption method, while the available P content was measured by sodium bicarbonate extraction followed by molybdenum-antimony anti-spectrophotometry [26].

2.5. Determination of Pepper Fruit Quality

Fruits of uniform ripeness were selected. Soluble sugar, vitamin C, and organic acid contents were determined according to the method described by Gao [27]. Coomassie brilliant blue spectrophotometry was used to determine the soluble protein content [25]. To determine the nitrate content, the sample was extracted with deionized water in a boiling water bath for 30 min. The extract was then mixed with 5% sulfuric acid–salicylic acid solution. After 20 min, 8% NaOH was added to the mixed solution. Absorbance was measured at 410 nm using a spectrophotometer [25]. The soluble solids content was determined using a digital refractometer (PAL-1 portable digital refractometer).

2.6. Analysis of Microbial Diversity in Cultivation Substrates

At harvest time (9 July), rhizosphere soil (<2 mm) from pepper plants was collected. Using a sampler, six sites were sampled from each plot, resulting in three soil samples per treatment. The collected rhizosphere soil samples were stored at −80 °C. Total genomic DNA was extracted using the MagBeads FastDNA Kit for Soil (116564384) (MP Biomedicals, Santa Ana, CA, USA). Molecular sizing was performed by 0.8% agarose gel electrophoresis, and DNA concentrations were quantified using a Nanodrop spectrophotometer (Thermo Fisher Scientific, Waltham, MA, USA; NC2000). PCR amplification of the bacterial 16S rRNA gene V3–V4 region was performed using the forward primer 5′-ACTCCTACGGGAGGCAGCA-3′ and the reverse primer 5′-GGACTACHVGGGTWTCTAAT-3′. PCR amplicons were purified with Vazyme VAHTSTM DNA Clean Beads (Vazyme, Nanjing, China) and quantified using the Quant-iT PicoGreen dsDNA Assay Kit (Invitrogen, Carlsbad, CA, USA). After quantification, amplicons were pooled in equal amounts, and paired-end 2 × 250 bp sequencing was performed using the Illumina NovaSeq (PE250 Duplex Sequencing) platform (Illumina, Inc., San Diego, CA, USA) at Shanghai Personal Biotechnology Co., Ltd. (Shanghai, China). Sequence data analyses were performed using QIIME2 according to official tutorials. Alpha-diversity metrics, including Chao1 [28], Shannon [29], and Simpson [30] indices, were calculated based on the amplicon sequence variants.

2.7. Non-Targeted Metabolome Analysis of Cultivation Substrates

Samples (0.1 g) were placed in 2 mL centrifuge tubes, and 300 μL of pre-chilled methanol was added. The mixture was vortexed for 30 s, followed by grinding in a high-throughput tissue grinder. This step was repeated once. Samples were then placed in an ultrasonic cleaner for 10 min, frozen at −20 °C for 30 min, and centrifuged at 12,000 rpm and 4 °C for 10 min. The resulting supernatant was filtered through a 0.22 μm membrane. Subsequently, 10–20 μL of each sample filtrate was mixed with a quality control (QC) sample used to assess instrument stability and data reliability. Thermo Orbitrap Exploris 120 mass spectrometer was used to collect DDA mass spectrometric data in positive and negative ion modes under the control of Xcalibur software (version 4.7, Thermo). Metabolite identification was based on the self-built PSNGM database (Shanghai Personal Biotechnology Co., Ltd., Shanghai, China), mzCloud (https://www.mzcloud.org/), LIPID MAPS (https://www.lipidmaps.org/), HMDB (https://hmdb.ca/, accessed on 11 December 2023), MoNA (https://mona.fiehnlab.ucdavis.edu/) and NIST_2020_MSMS spectral library. The metabolite molecule was considered statistically significant when the p value was <0.05 and the variable importance in projection value was >1. Functional analysis of differential metabolites was primarily performed using KEGG enrichment analysis via the clusterProfiler package (version 4.6.0), revealing significantly enriched metabolic pathways.
The top 20 differentially expressed microbial genera and metabolites were screened for correlation analysis. Associations with a Pearson correlation coefficient |R| > 0.6 and p < 0.05 were used to construct the association network.

2.8. Data Analysis

The Shapiro–Wilk test was performed to assess the normality of the data. If necessary, data were log-transformed to obtain variance homogeneity. SPSS 19.0 statistical software was used to perform variance analysis, and the differences between treatments were determined using the least significant difference (LSD) test. The technique for order preference by similarity to ideal solution (TOPSIS) was used to calculate comprehensive scores for each treatment [31]. The partial least squares structural equation modeling (PLS-SEM) was constructed using SmartPLS 4.1 to analyze the relationships among plant growth, microorganisms, and metabolites.

3. Results

3.1. Effects of Fertilization Amount and Frequency on the Substrate Element Content

As shown in Table 2, both the amount and frequency of fertilization at different growth stages had significant effects on the organic C, total P, available N, and available P contents of the substrate. The organic C content in all fertilization treatments (T1–T8) was lower than that in the CK. However, no significant difference was observed in total N content among treatments. Total P content was the highest and available P content was the lowest under the T5 treatment. In contrast, total P and available P contents in the T6 treatment were higher than those in the CK. The available N content under T4 was the lowest, reaching only 60% of that in the CK.

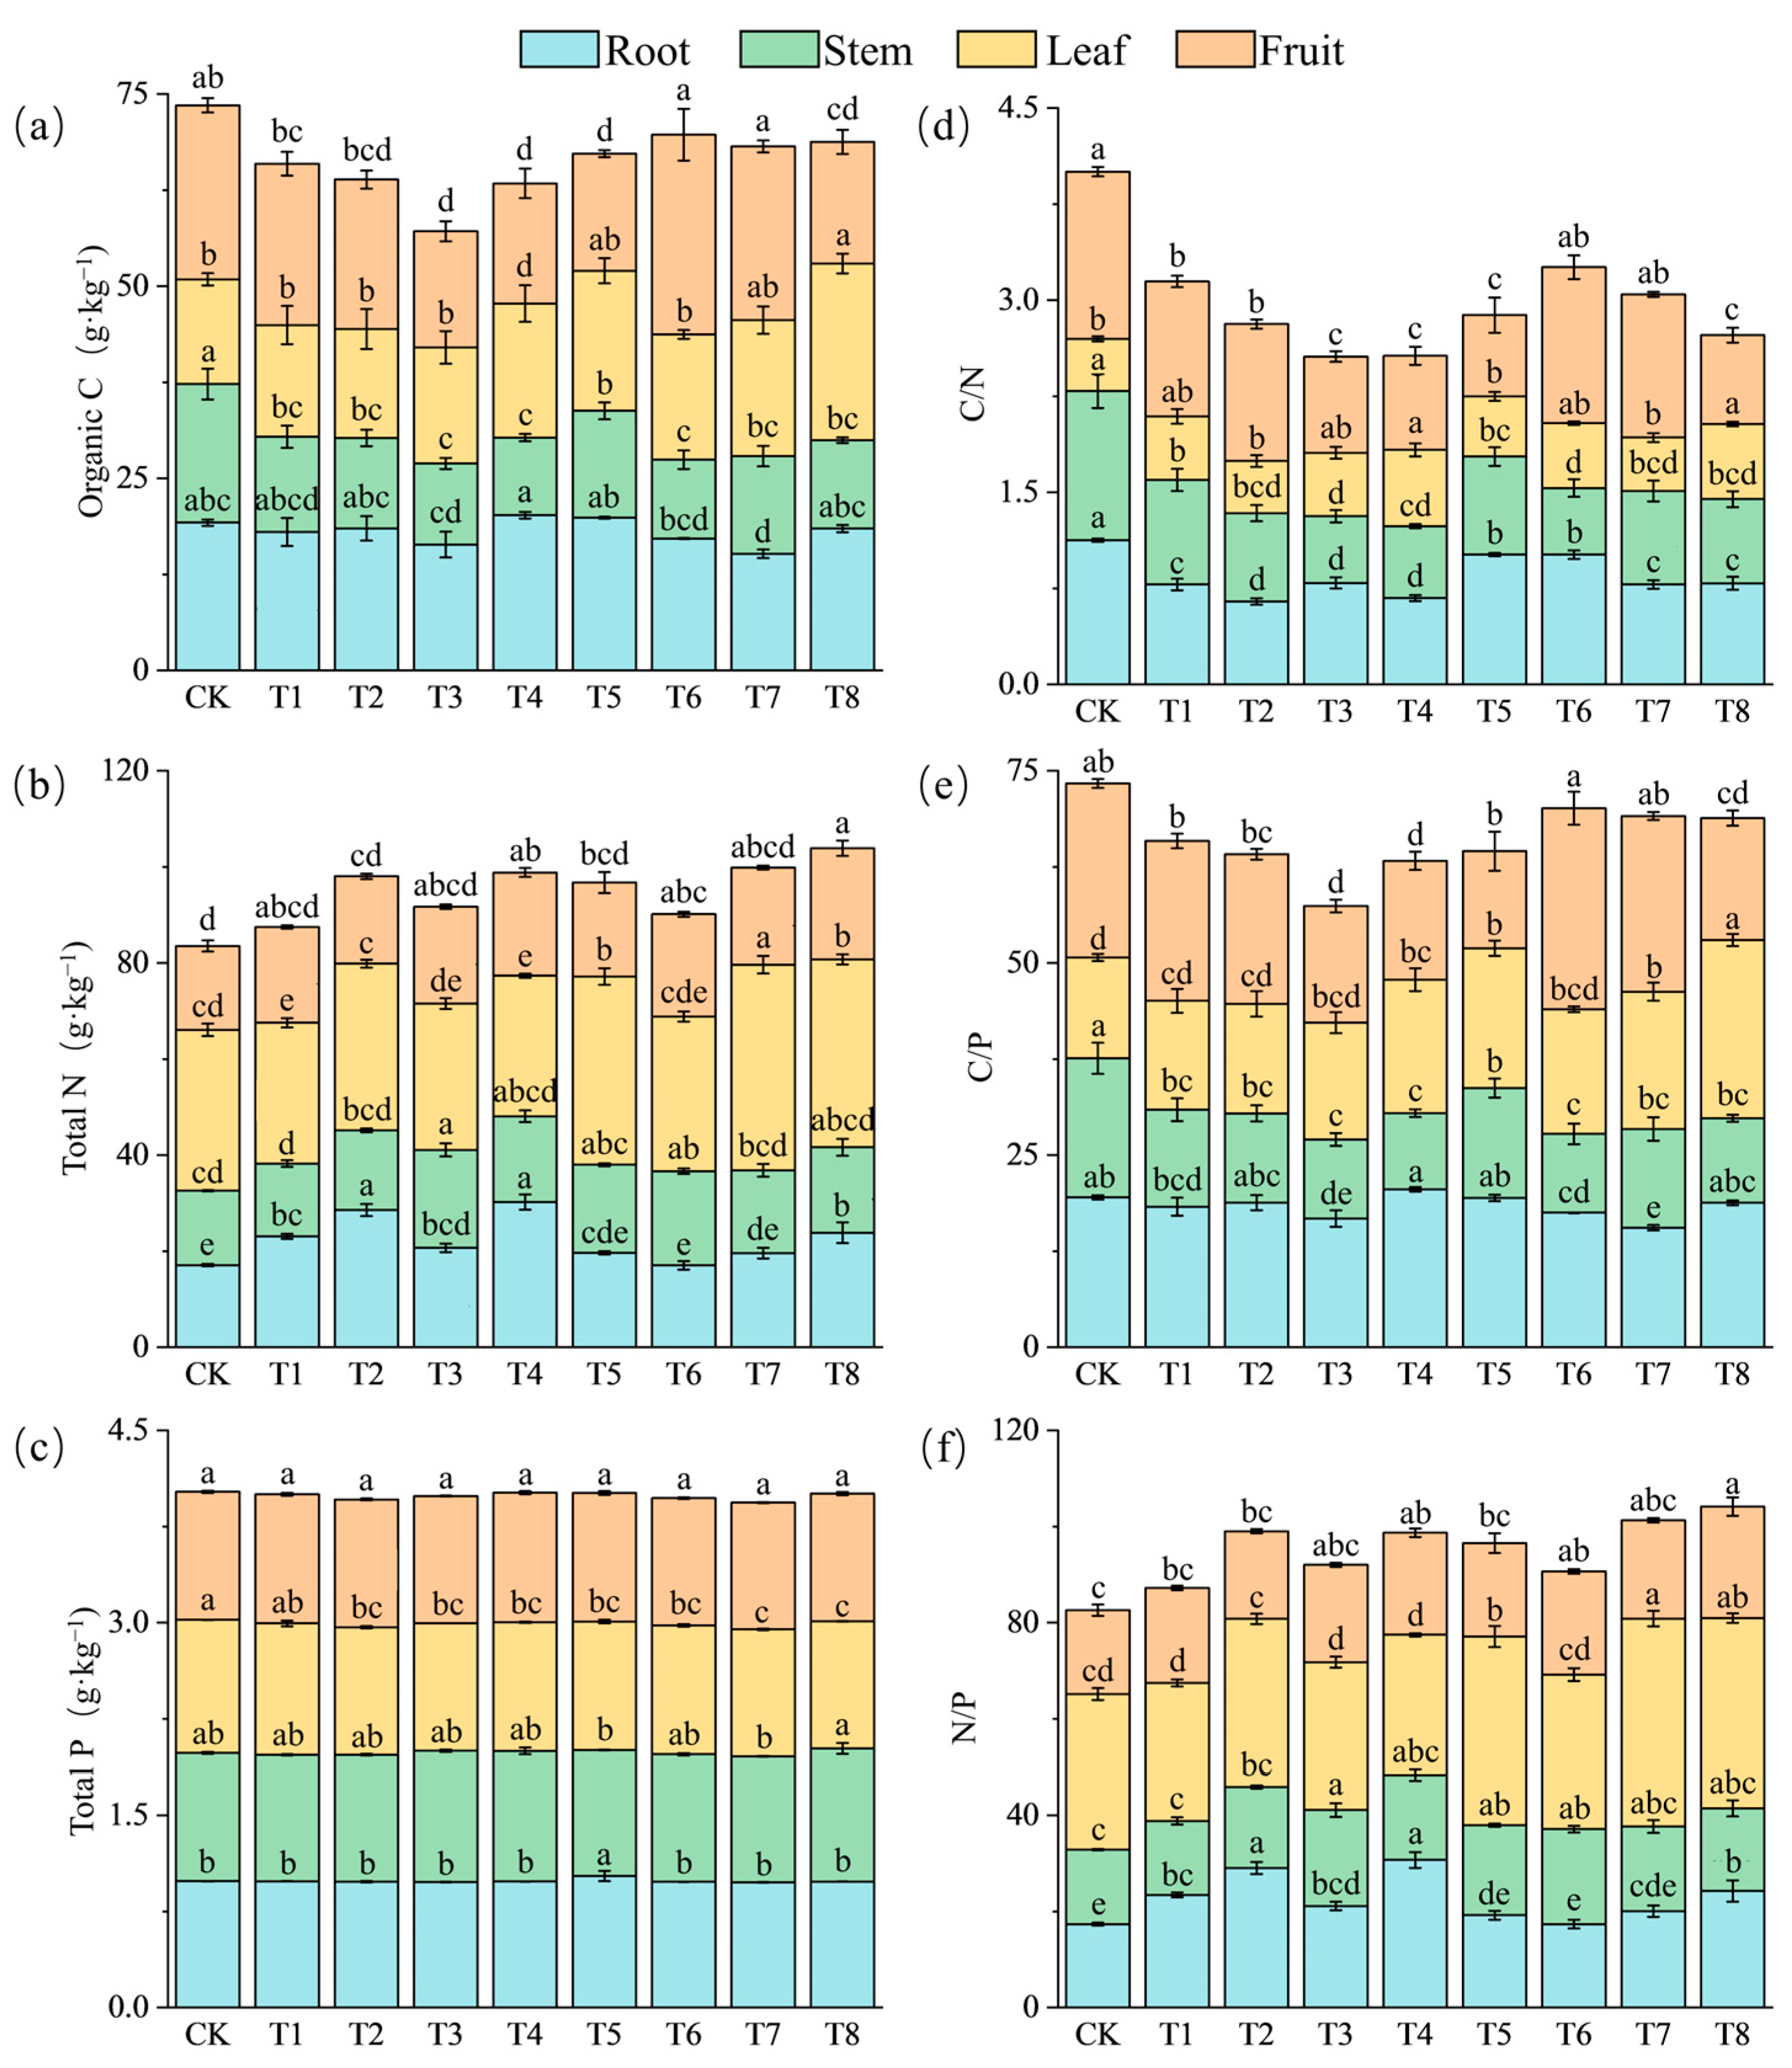
3.2. Effects of Fertilization Amount and Frequency on Element Content of Pepper Plants

The organic C content in pepper roots was highest under the T4 treatment, while that in stems was lower than in the other treatments. The organic C content in leaves was highest under the T8 treatment, reaching 1.69 times the value of CK. The organic C content of the fruit was highest under the T6 treatment (Figure 1a). The T2 and T4 treatments had the highest total N content in pepper roots at 167% and 177% of CK, respectively. Compared to CK, the total N content in stems only significantly increased under the T3 and T6 treatments. The T8 treatment showed the highest total N content in leaves and fruits, with values significantly higher than CK (Figure 1b). The total P content in roots was significantly higher under the T5 treatment than in other treatments. Under the T8 treatment, total P content in stems was significantly higher, while that in leaves was lower compared to some other treatments. There was no significant difference in total P content in fruits (Figure 1c).
The C/N ratios of roots and stems in the CK treatment were significantly higher than those in all fertilization treatments. The leaf C/N ratio in CK was significantly higher than those in the T4 and T8 treatments. The fruit C/N ratio in CK was significantly higher than in all treatments except T6 and T7 (Figure 1d). The C/P ratios of roots and stems in the T3, T4, T6, and T7 treatments were significantly lower than those in CK. The leaf C/P ratio was highest under the T8 treatment, reaching 1.77 times that of CK. The fruit C/P ratio was highest under the T6 treatment, 15.47% higher than that of CK (Figure 1e). The N/P ratio in roots under the T2 and T4 treatments was significantly higher than under any of the other treatments. The stem N/P ratio was highest under the T3 treatment at 129% of the CK value. Compared to CK, the N/P ratios in leaves and fruits significantly increased under the T8 treatment (Figure 1f).

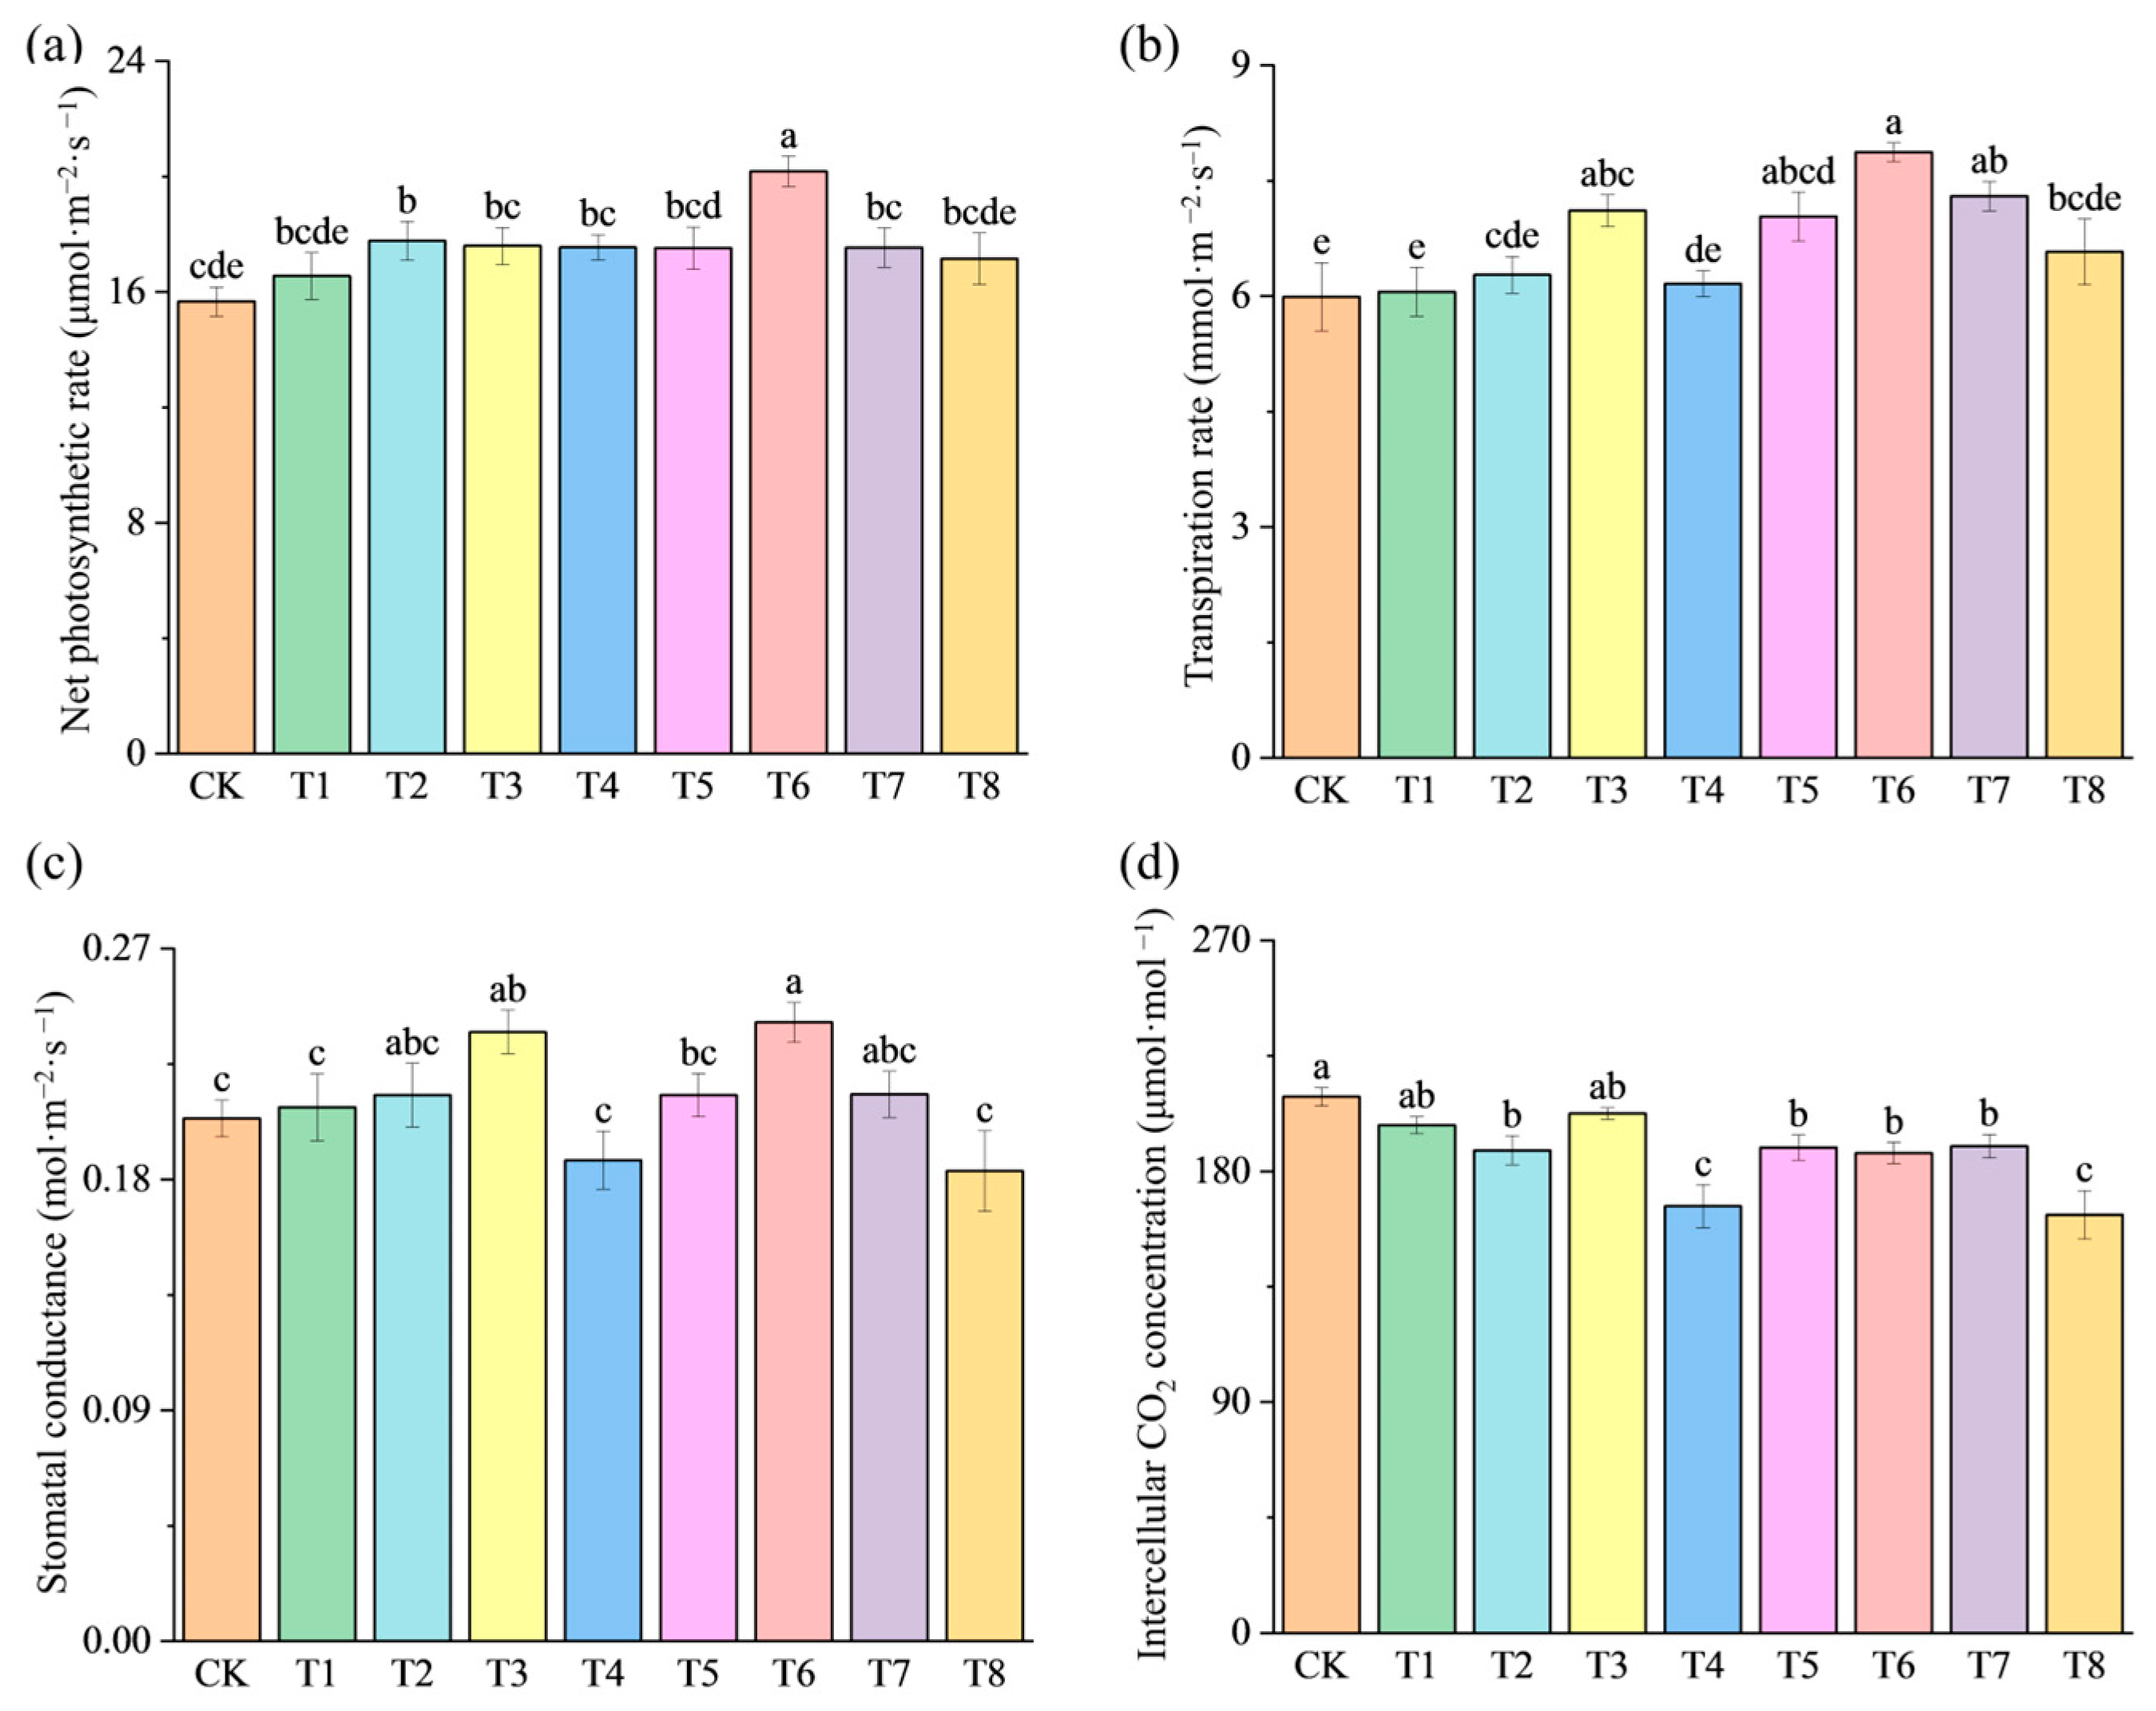
3.3. Effects of Fertilization Amount and Frequency on Photosynthesis of Pepper Plants

The net photosynthetic rate, transpiration rate, and stomatal conductance of pepper plants peaked under the T6 treatment, with values significantly higher than those of CK (Figure 2a–c). In addition, the net photosynthetic rate and transpiration rate under all fertilization treatments were higher than those of CK. However, the intercellular CO2 concentration under all treatments was lower than that of CK, with the T4 and T8 treatments reaching only 79.57% and 77.95% of CK value, respectively (Figure 2d).

3.4. Effects of Fertilization Amount and Frequency on Pepper Quality

The soluble sugar content of the pepper fruit was highest under the CK treatment and significantly lower under the T1, T3, T4, T7, and T8 treatments (Table 3). However, only the T3 treatment showed a significantly lower soluble protein content, at 96% of the CK value. The soluble solids content under the T4 treatment was significantly higher, reaching 1.81 times that of CK. The vitamin C content under the T8 treatment was significantly higher than that under the CK, T5, T6, and T7 treatments, and was lowest under T5. Compared to CK, the organic acid content under the T2 and T3 treatments was significantly lower, while the nitrate-N content under T6 was significantly higher.

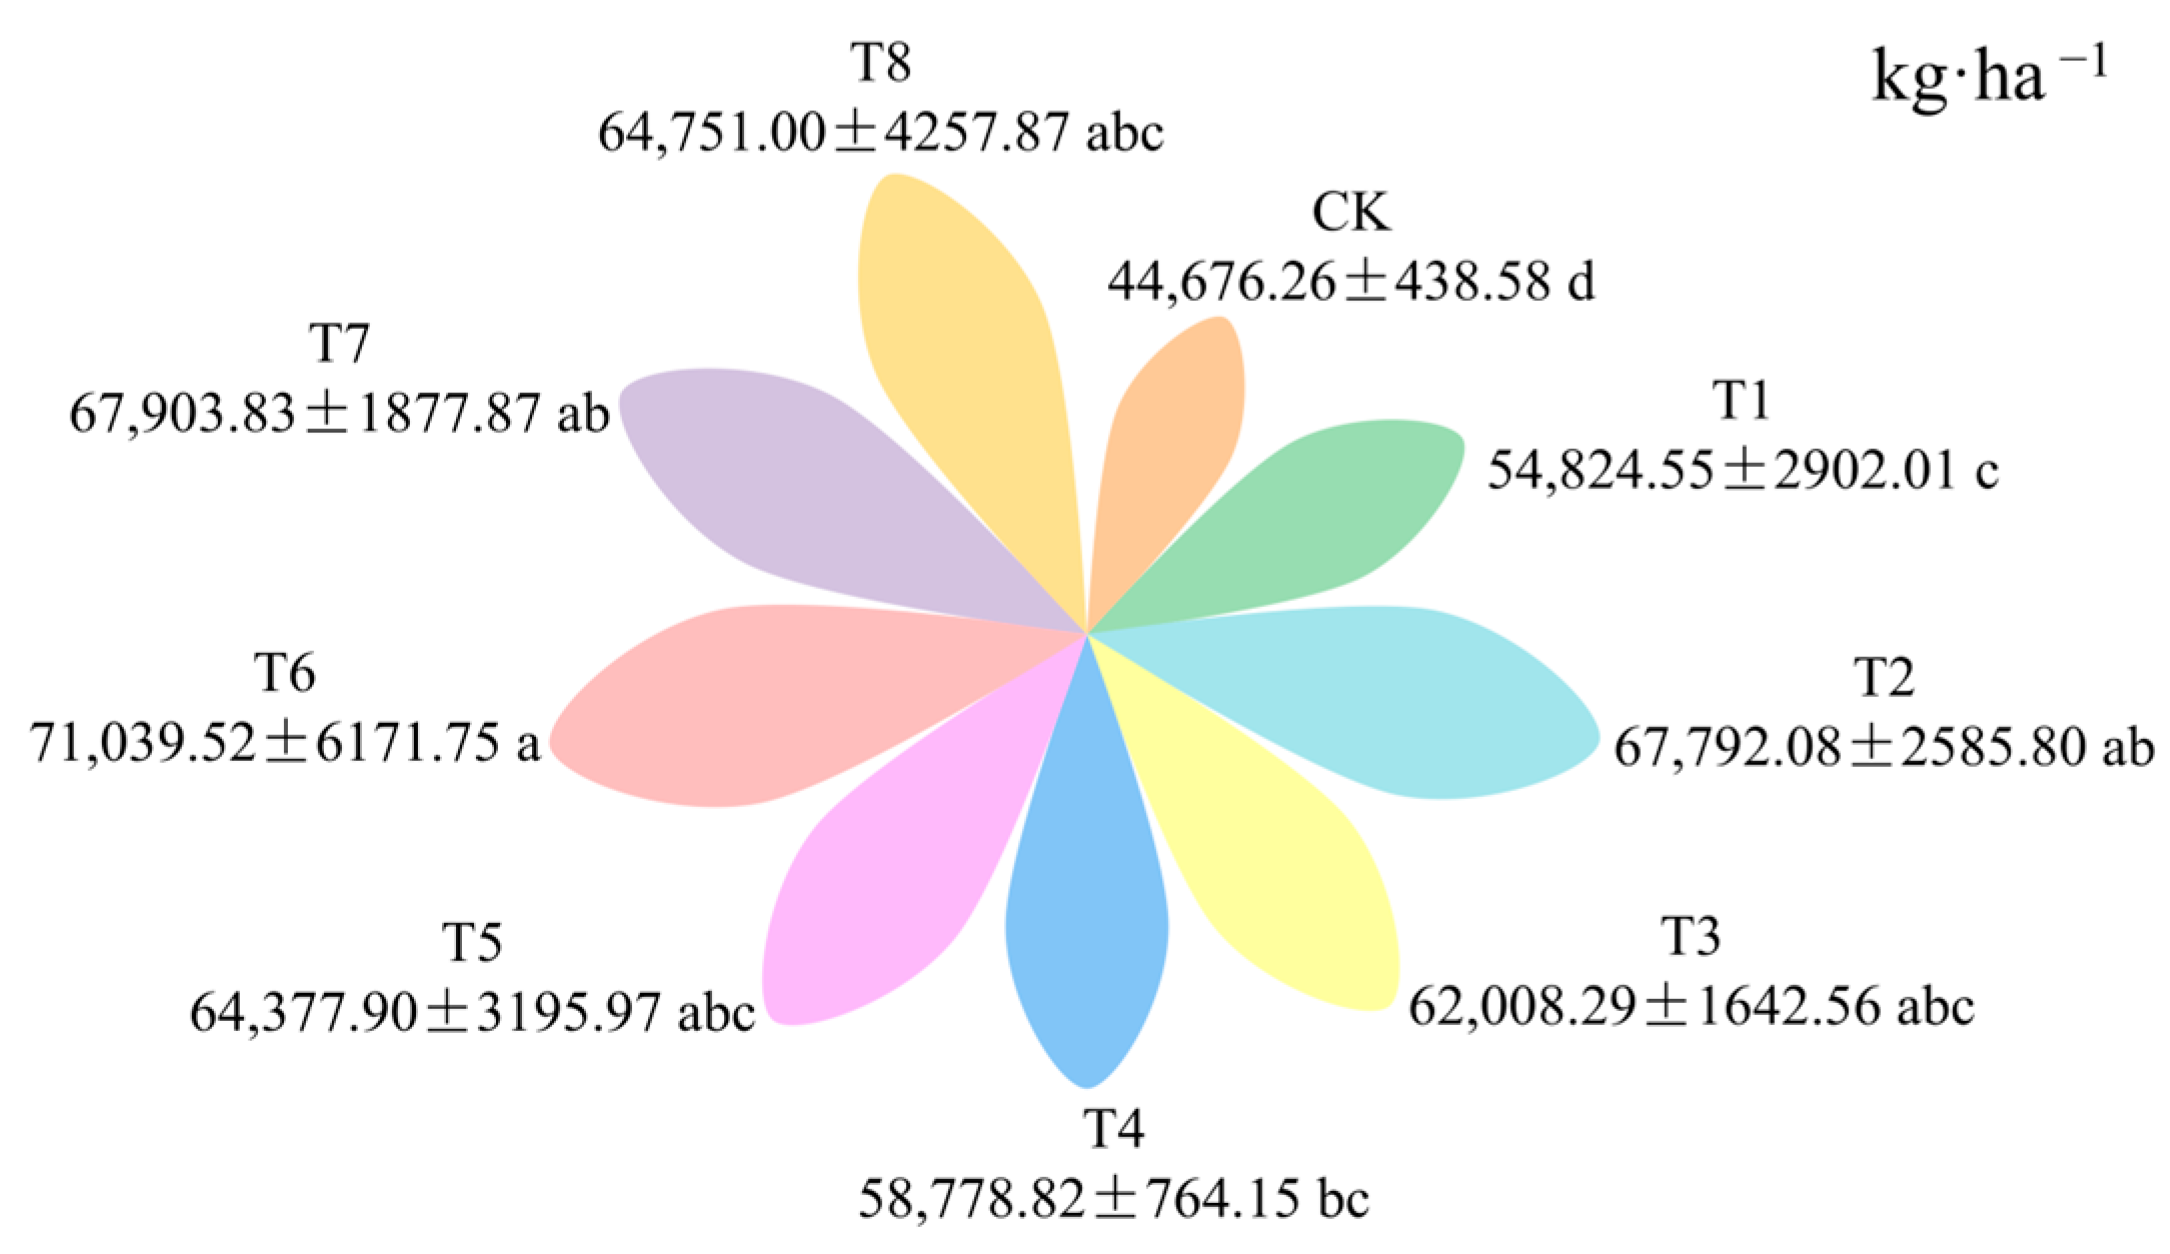
3.5. Effects of Fertilization Amount and Frequency on Pepper Yield

The yields of the treatments, ranked from highest to lowest, were as follows: T6, T7, T2, T8, T5, T3, T4, T1, and CK (Figure 3). Under the same fertilization frequency, the yield of pepper first increased and then decreased with increasing total fertilizer amount. In addition, for the same total amount of fertilization, the yield was higher at a frequency of once every 10 days. Overall, the yield significantly increased under all fertilization treatments compared to CK, with the T6 treatment increasing yield by 59%.

3.6. Comprehensive Evaluation of the Effects of Fertilization Amount and Frequency on Pepper

A correlation analysis (Figure 4) showed significant relationships between the yield of pepper and both net photosynthetic rate and transpiration rate. Additionally, transpiration rate showed significant positive correlations with net photosynthetic rate and stomatal conductance. A significant negative correlation was observed between soluble sugar and nitrate content. The TOPSIS method was used to comprehensively evaluate the plant growth, photosynthesis, quality, and yield under the different treatments (Figure 5). The T6 treatment ranked the highest in the comprehensive evaluation across all treatments.

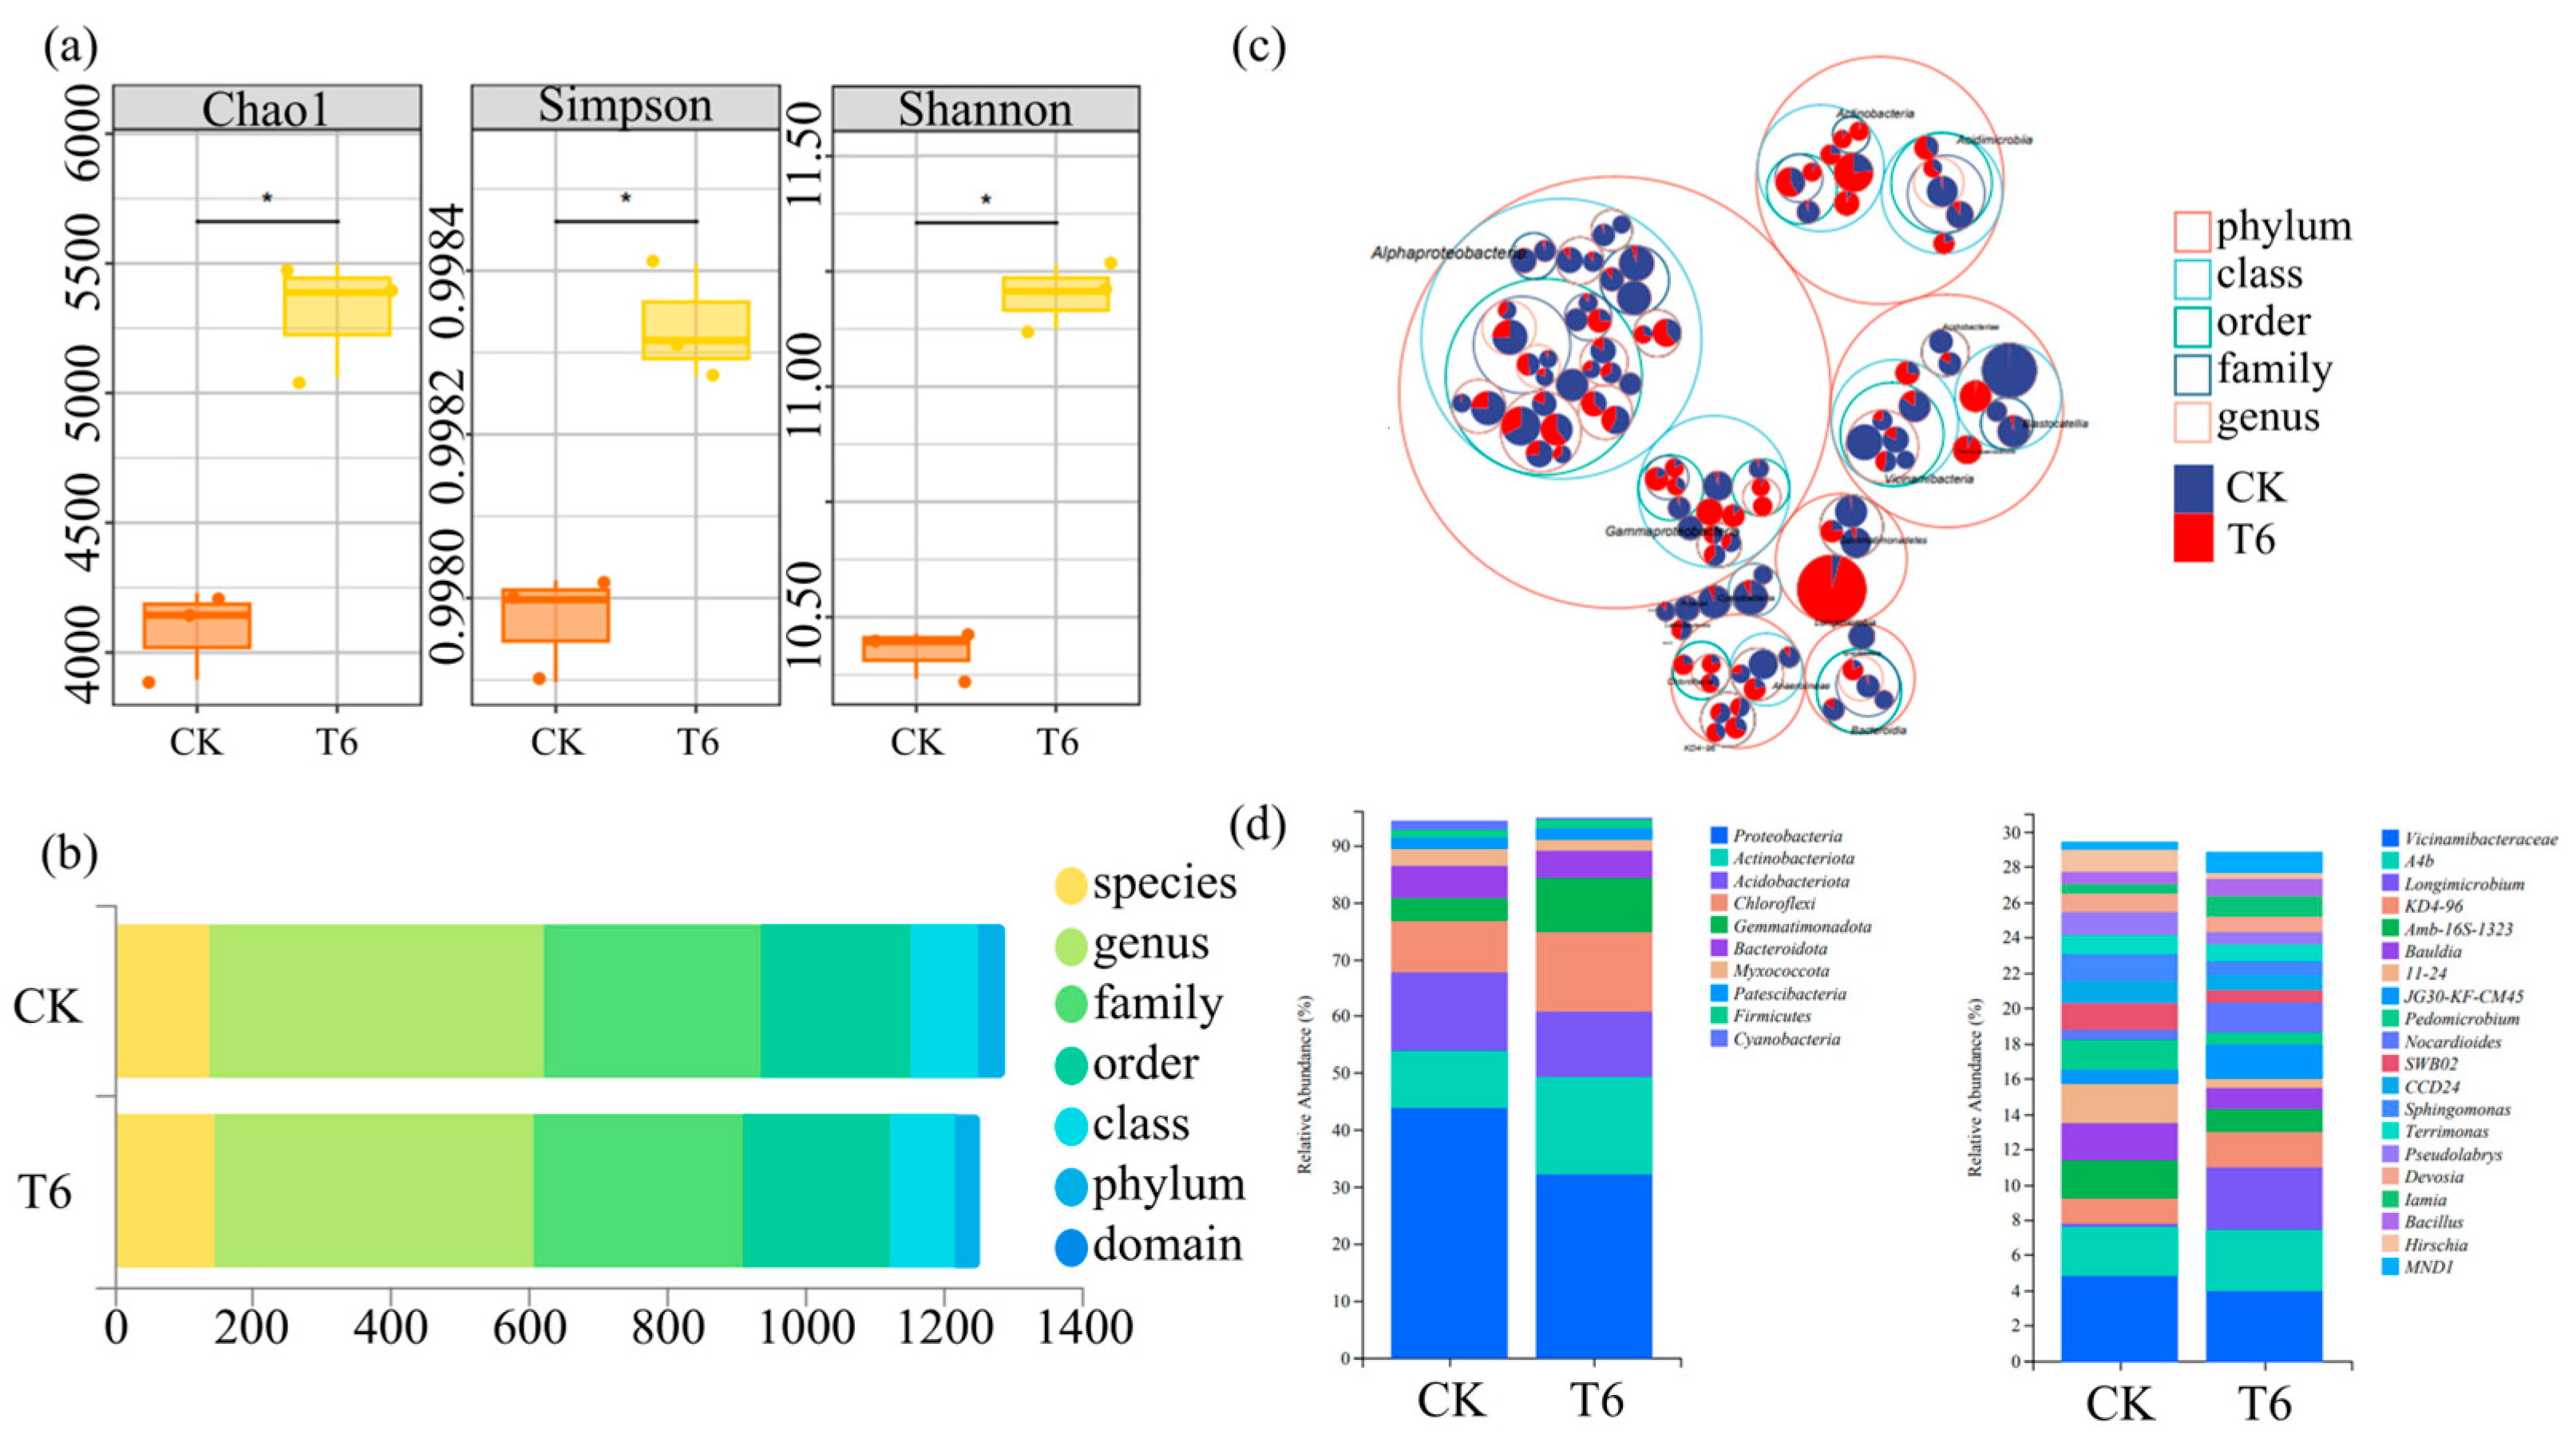
3.7. Effects of Fertilization Amount and Frequency on Rhizosphere Microorganisms

The Chao1 index under the T6 treatment was higher than that of CK, indicating significantly greater microbial richness. The Shannon and Simpson indices also increased under T6, reflecting enhanced microbial community diversity (Figure 6a). The microbial species exhibited significant differences at taxonomic levels (Figure 6b,c). Significant differences were noted between the CK and T6 treatments at the genus level. At the phylum level, the dominant groups included Proteobacteria, Actinobacteriota, Acidobacteriota, Chloroflexi, Gemmatimonadota, Bacteroidota, Myxococcota, Patescibacteria, Firmicutes, and Cyanobacteria (Figure 6d). At the genus level, the dominant taxa included Vicinamibacteraceae, A4b, Longimicrobium, KD4-96, Amb-16S-1323, Bauldia, 11-24, JG30-KF-CM45, Pedomicrobium, Nocardioides, SWB02, CCD24, Sphingomonas, Terrimonas, Pseudolabrys, Devosia, Iamia, Bacillus, Hirschia, and MND1 (Figure 6d).

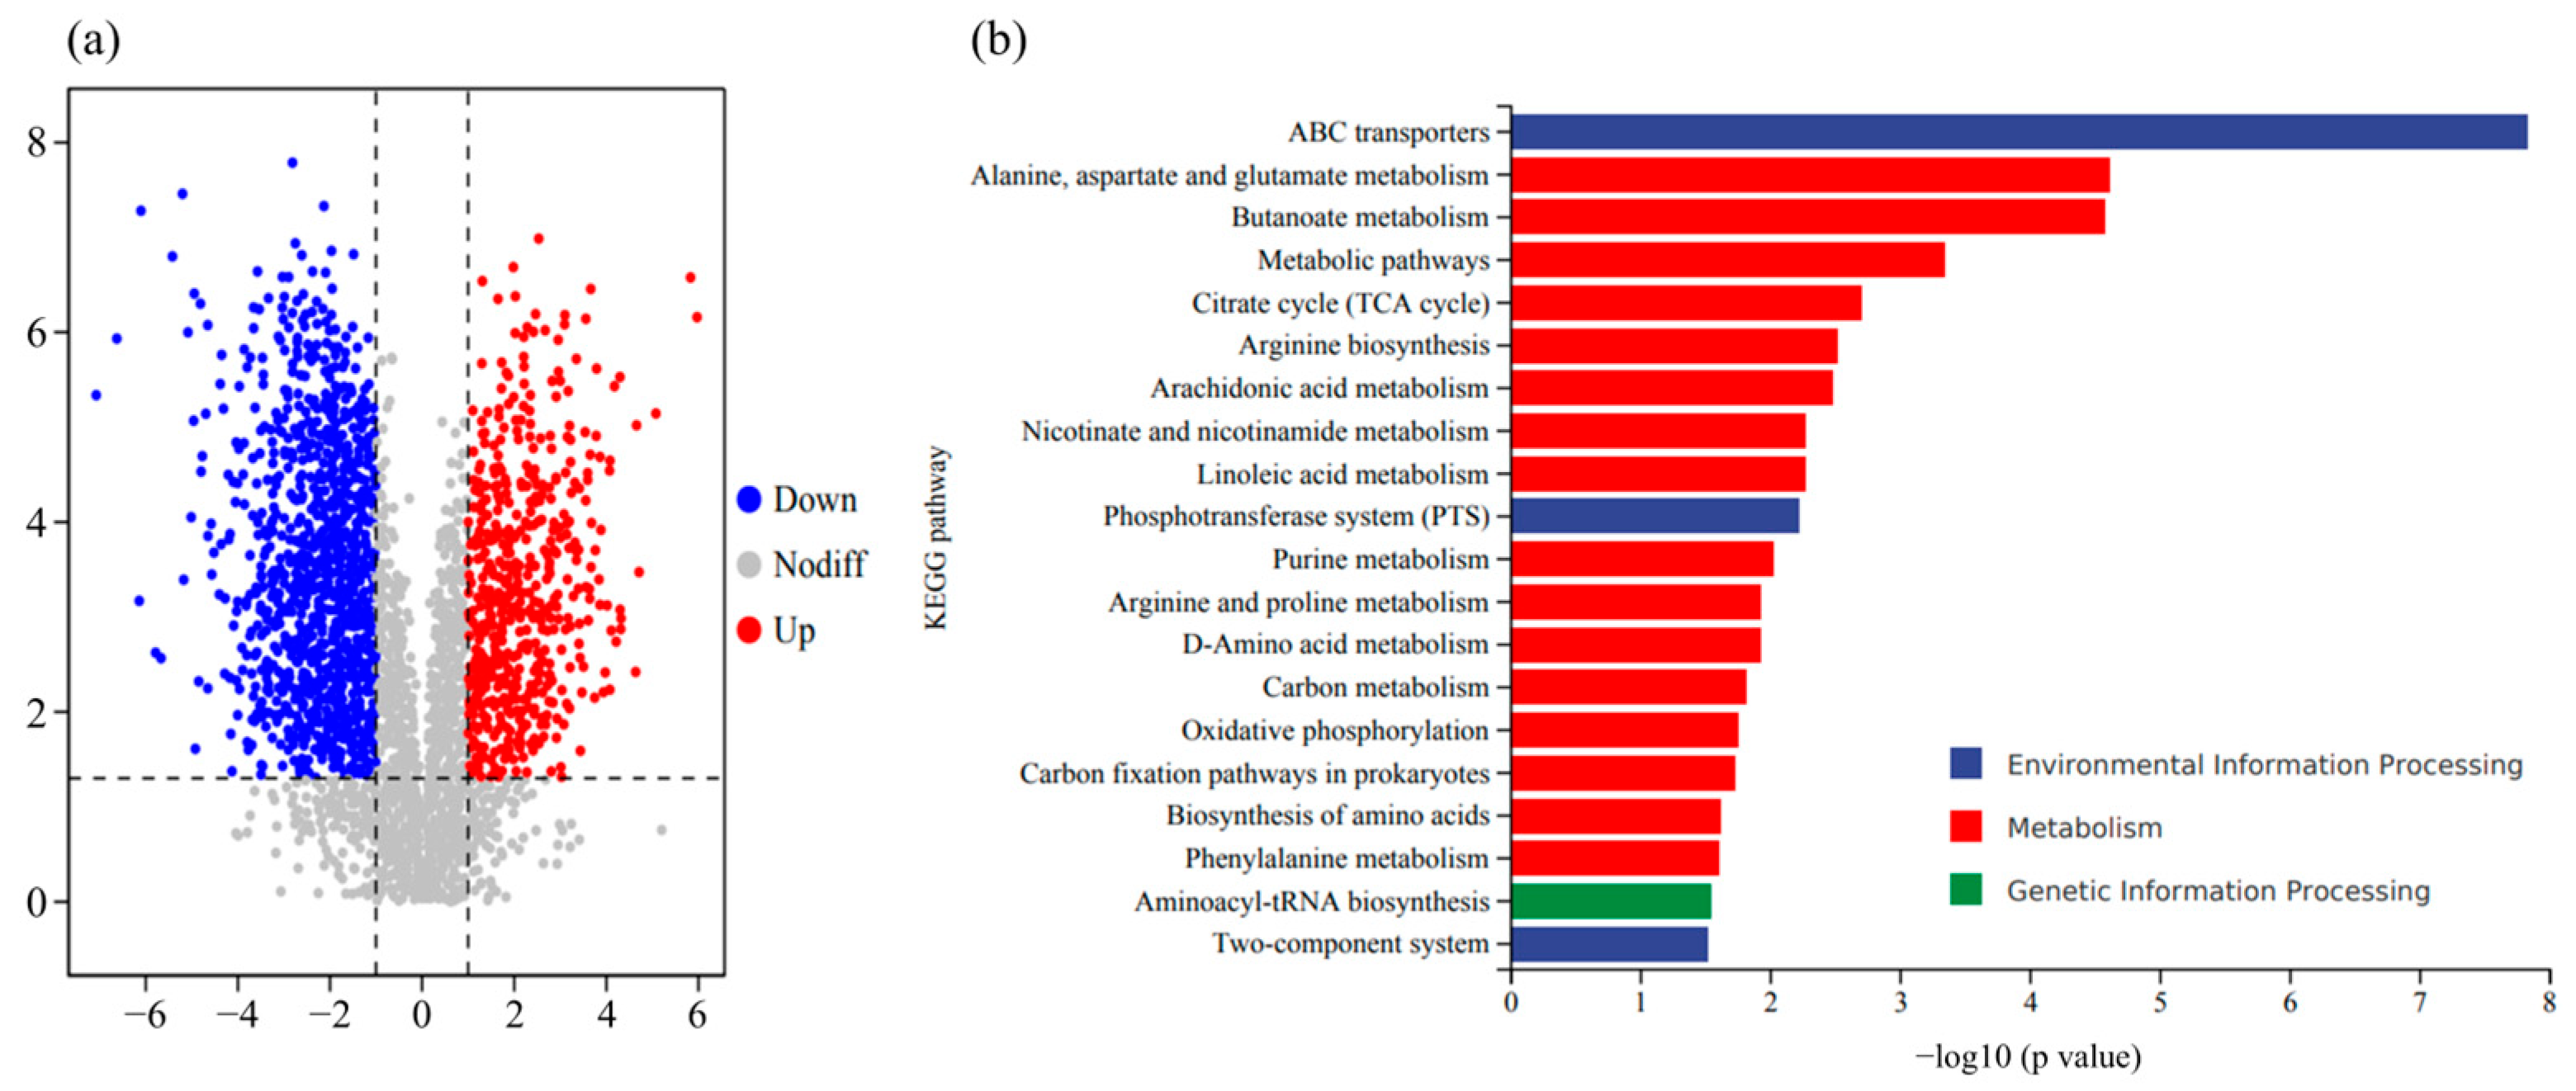
3.8. Effects of Fertilization Amount and Frequency on Pepper Metabolites

A comparison of differential metabolites between the T6 and CK treatments identified 100 upregulated and 147 downregulated metabolites (Figure 7a). KEGG pathway analysis showed that the top five enriched metabolic pathways among the differential metabolites were ABC transporters; alanine, aspartate and glutamate metabolism; butanoate metabolism; general metabolic pathways; and the citrate cycle (TCA cycle) (Figure 7b).
Comprehensive microbiological and metabolomic analyses were used to construct an association network based on correlations with |rho| > 0.6 and p < 0.05. The genera Amb-16S-1323, CCD24, and Bauldia were significantly positively correlated with a variety of metabolites, while Bacillus, Nocardioides, and MND1 were negatively correlated with a variety of metabolites (Figure 8).

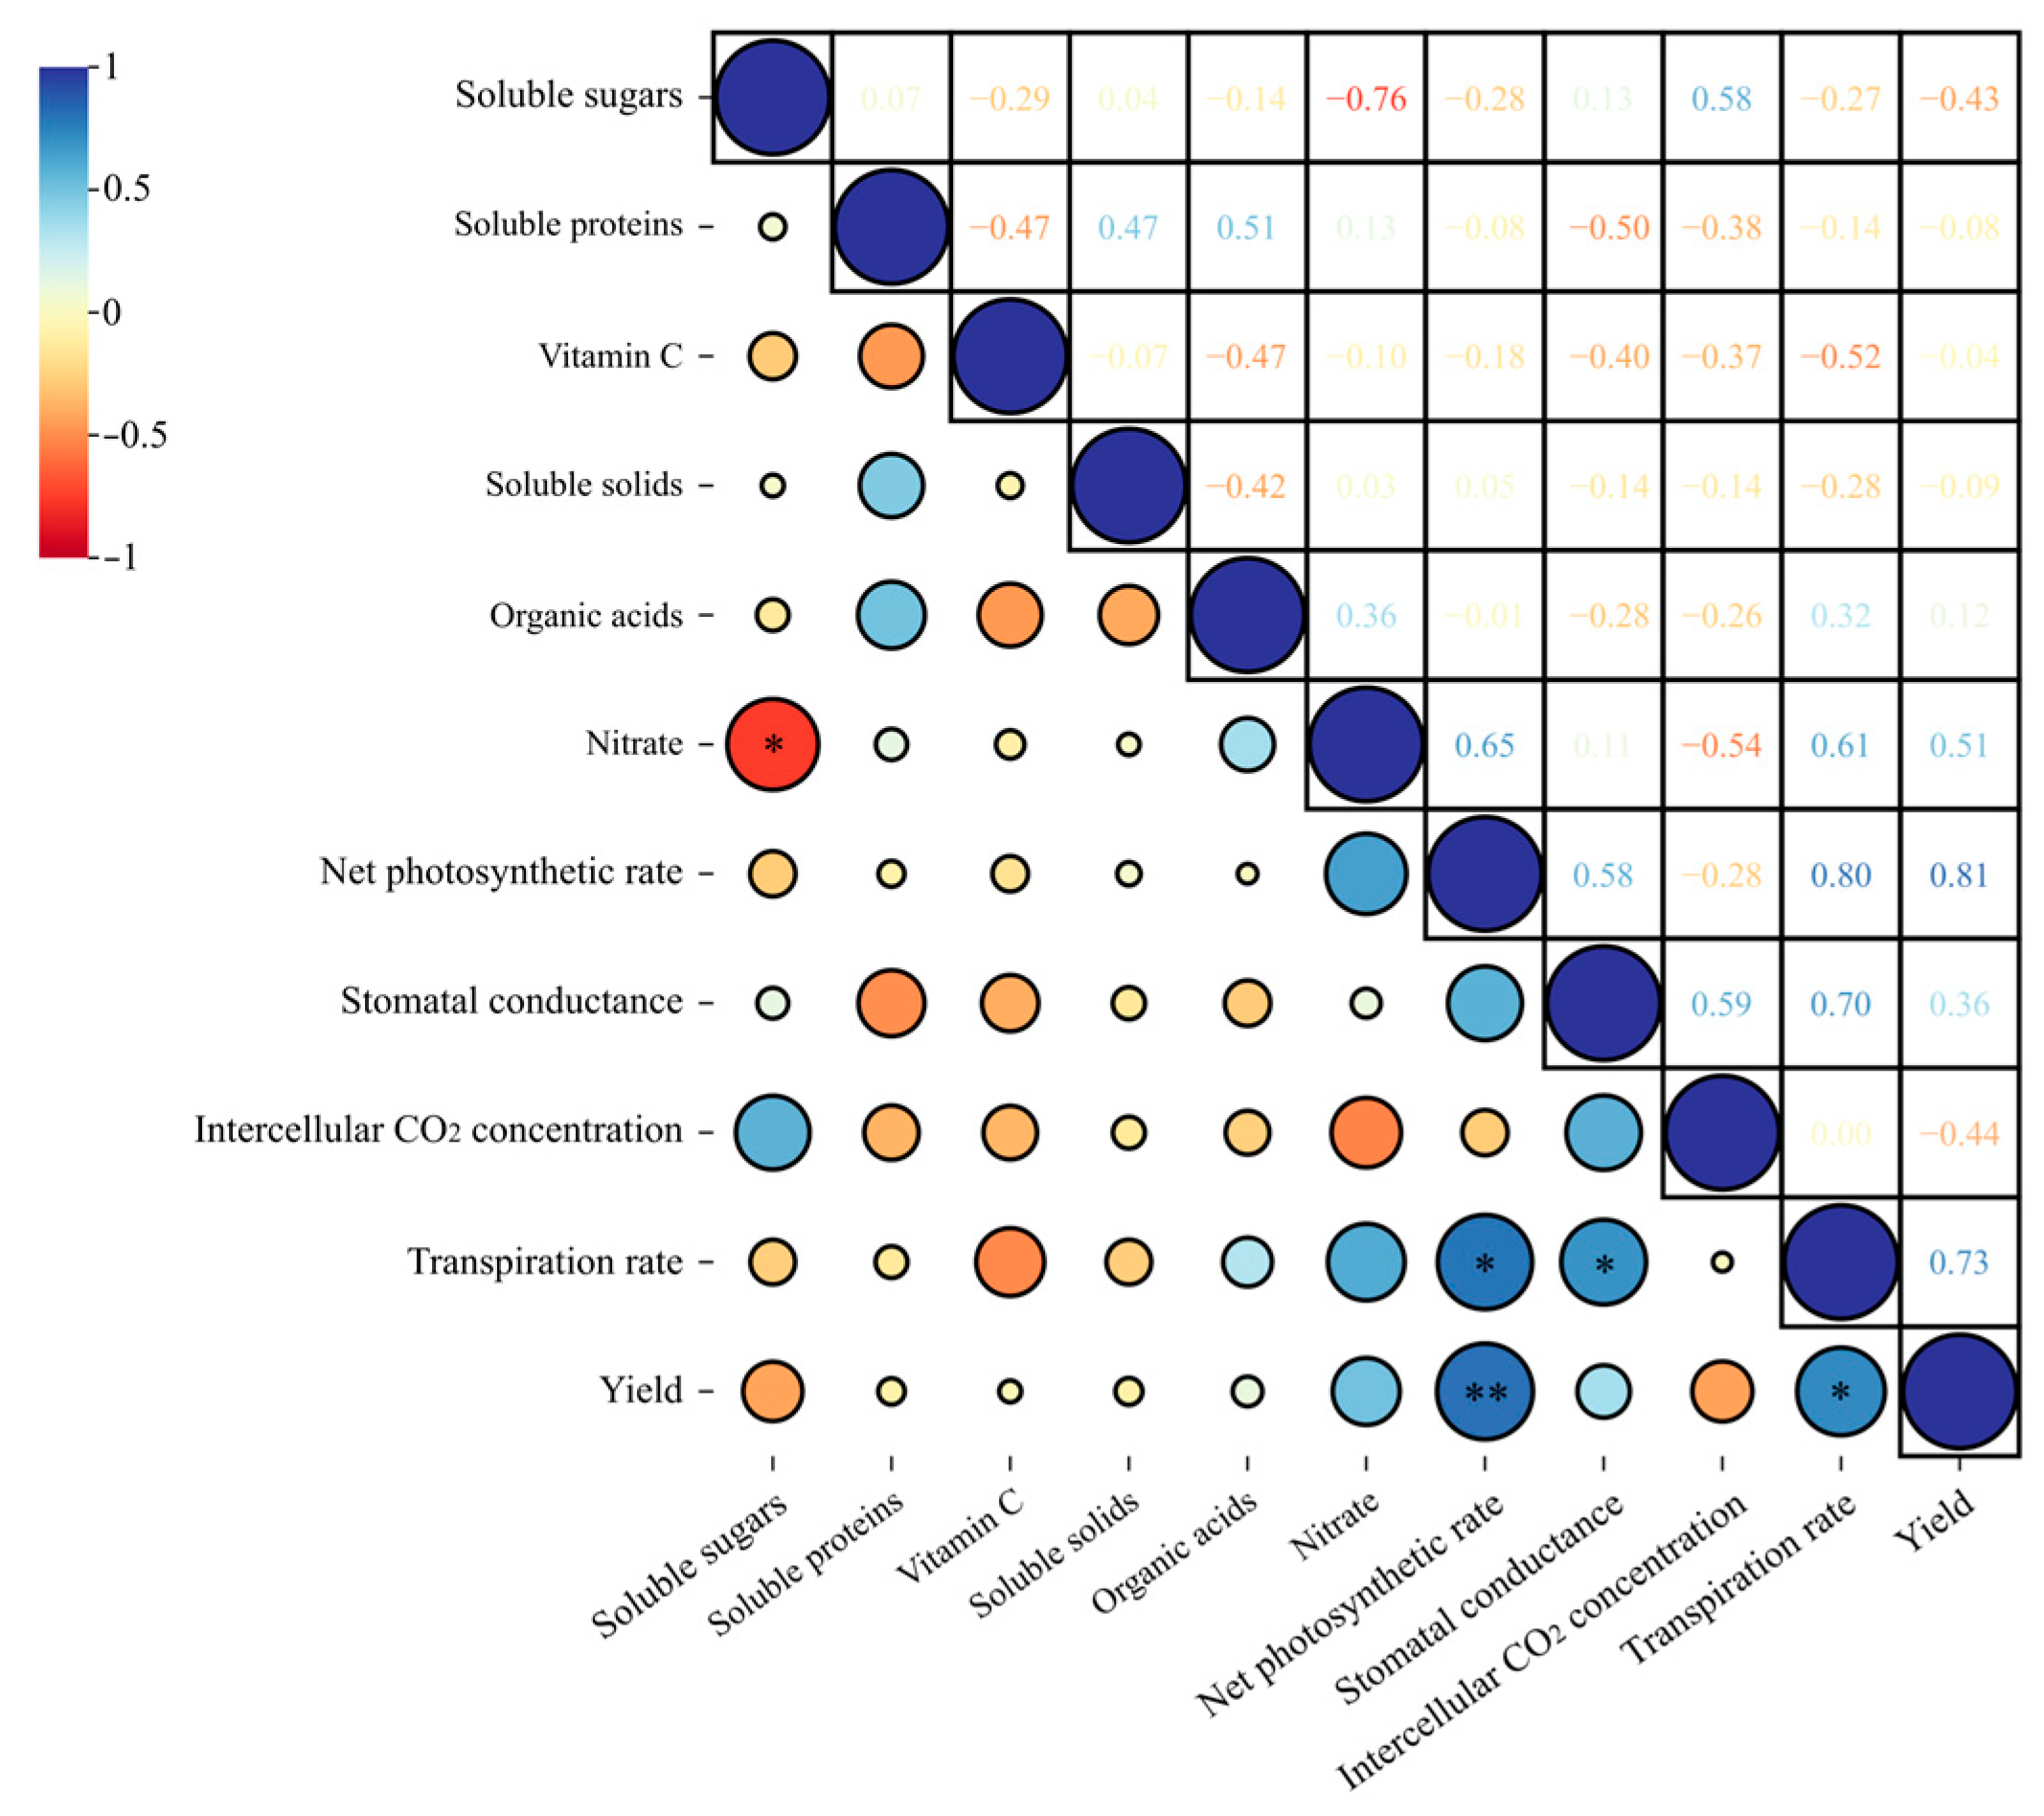
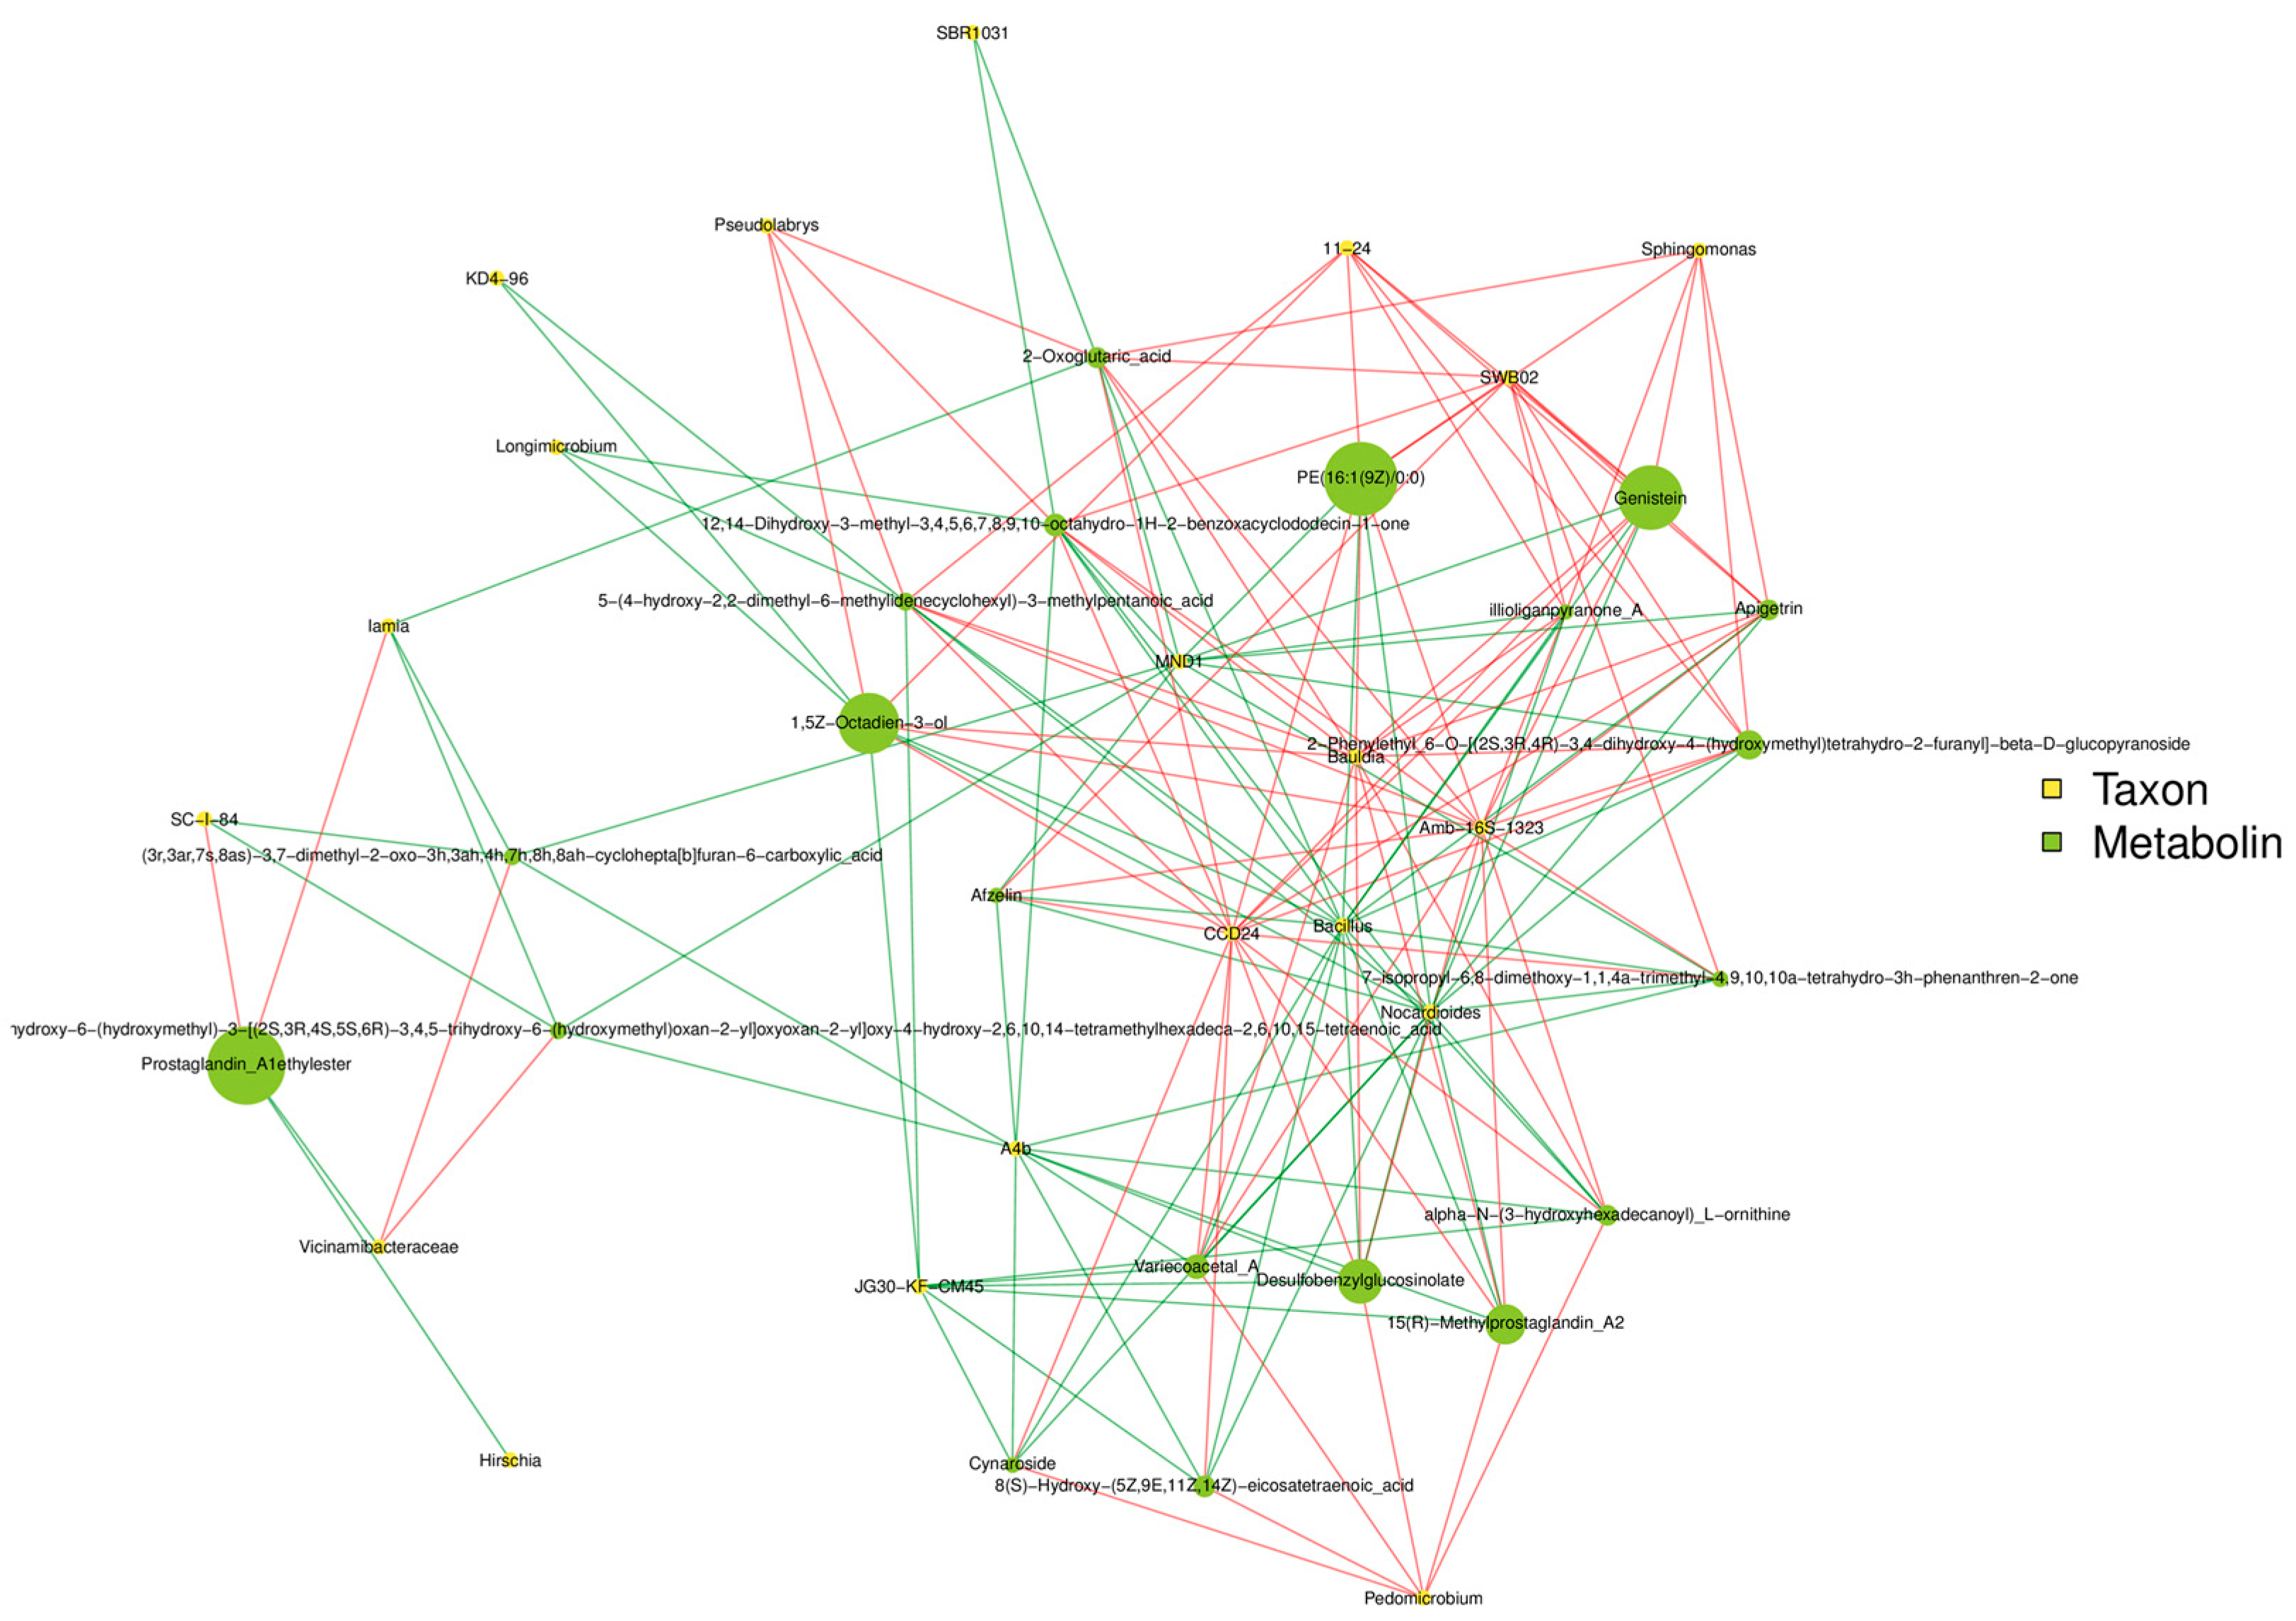
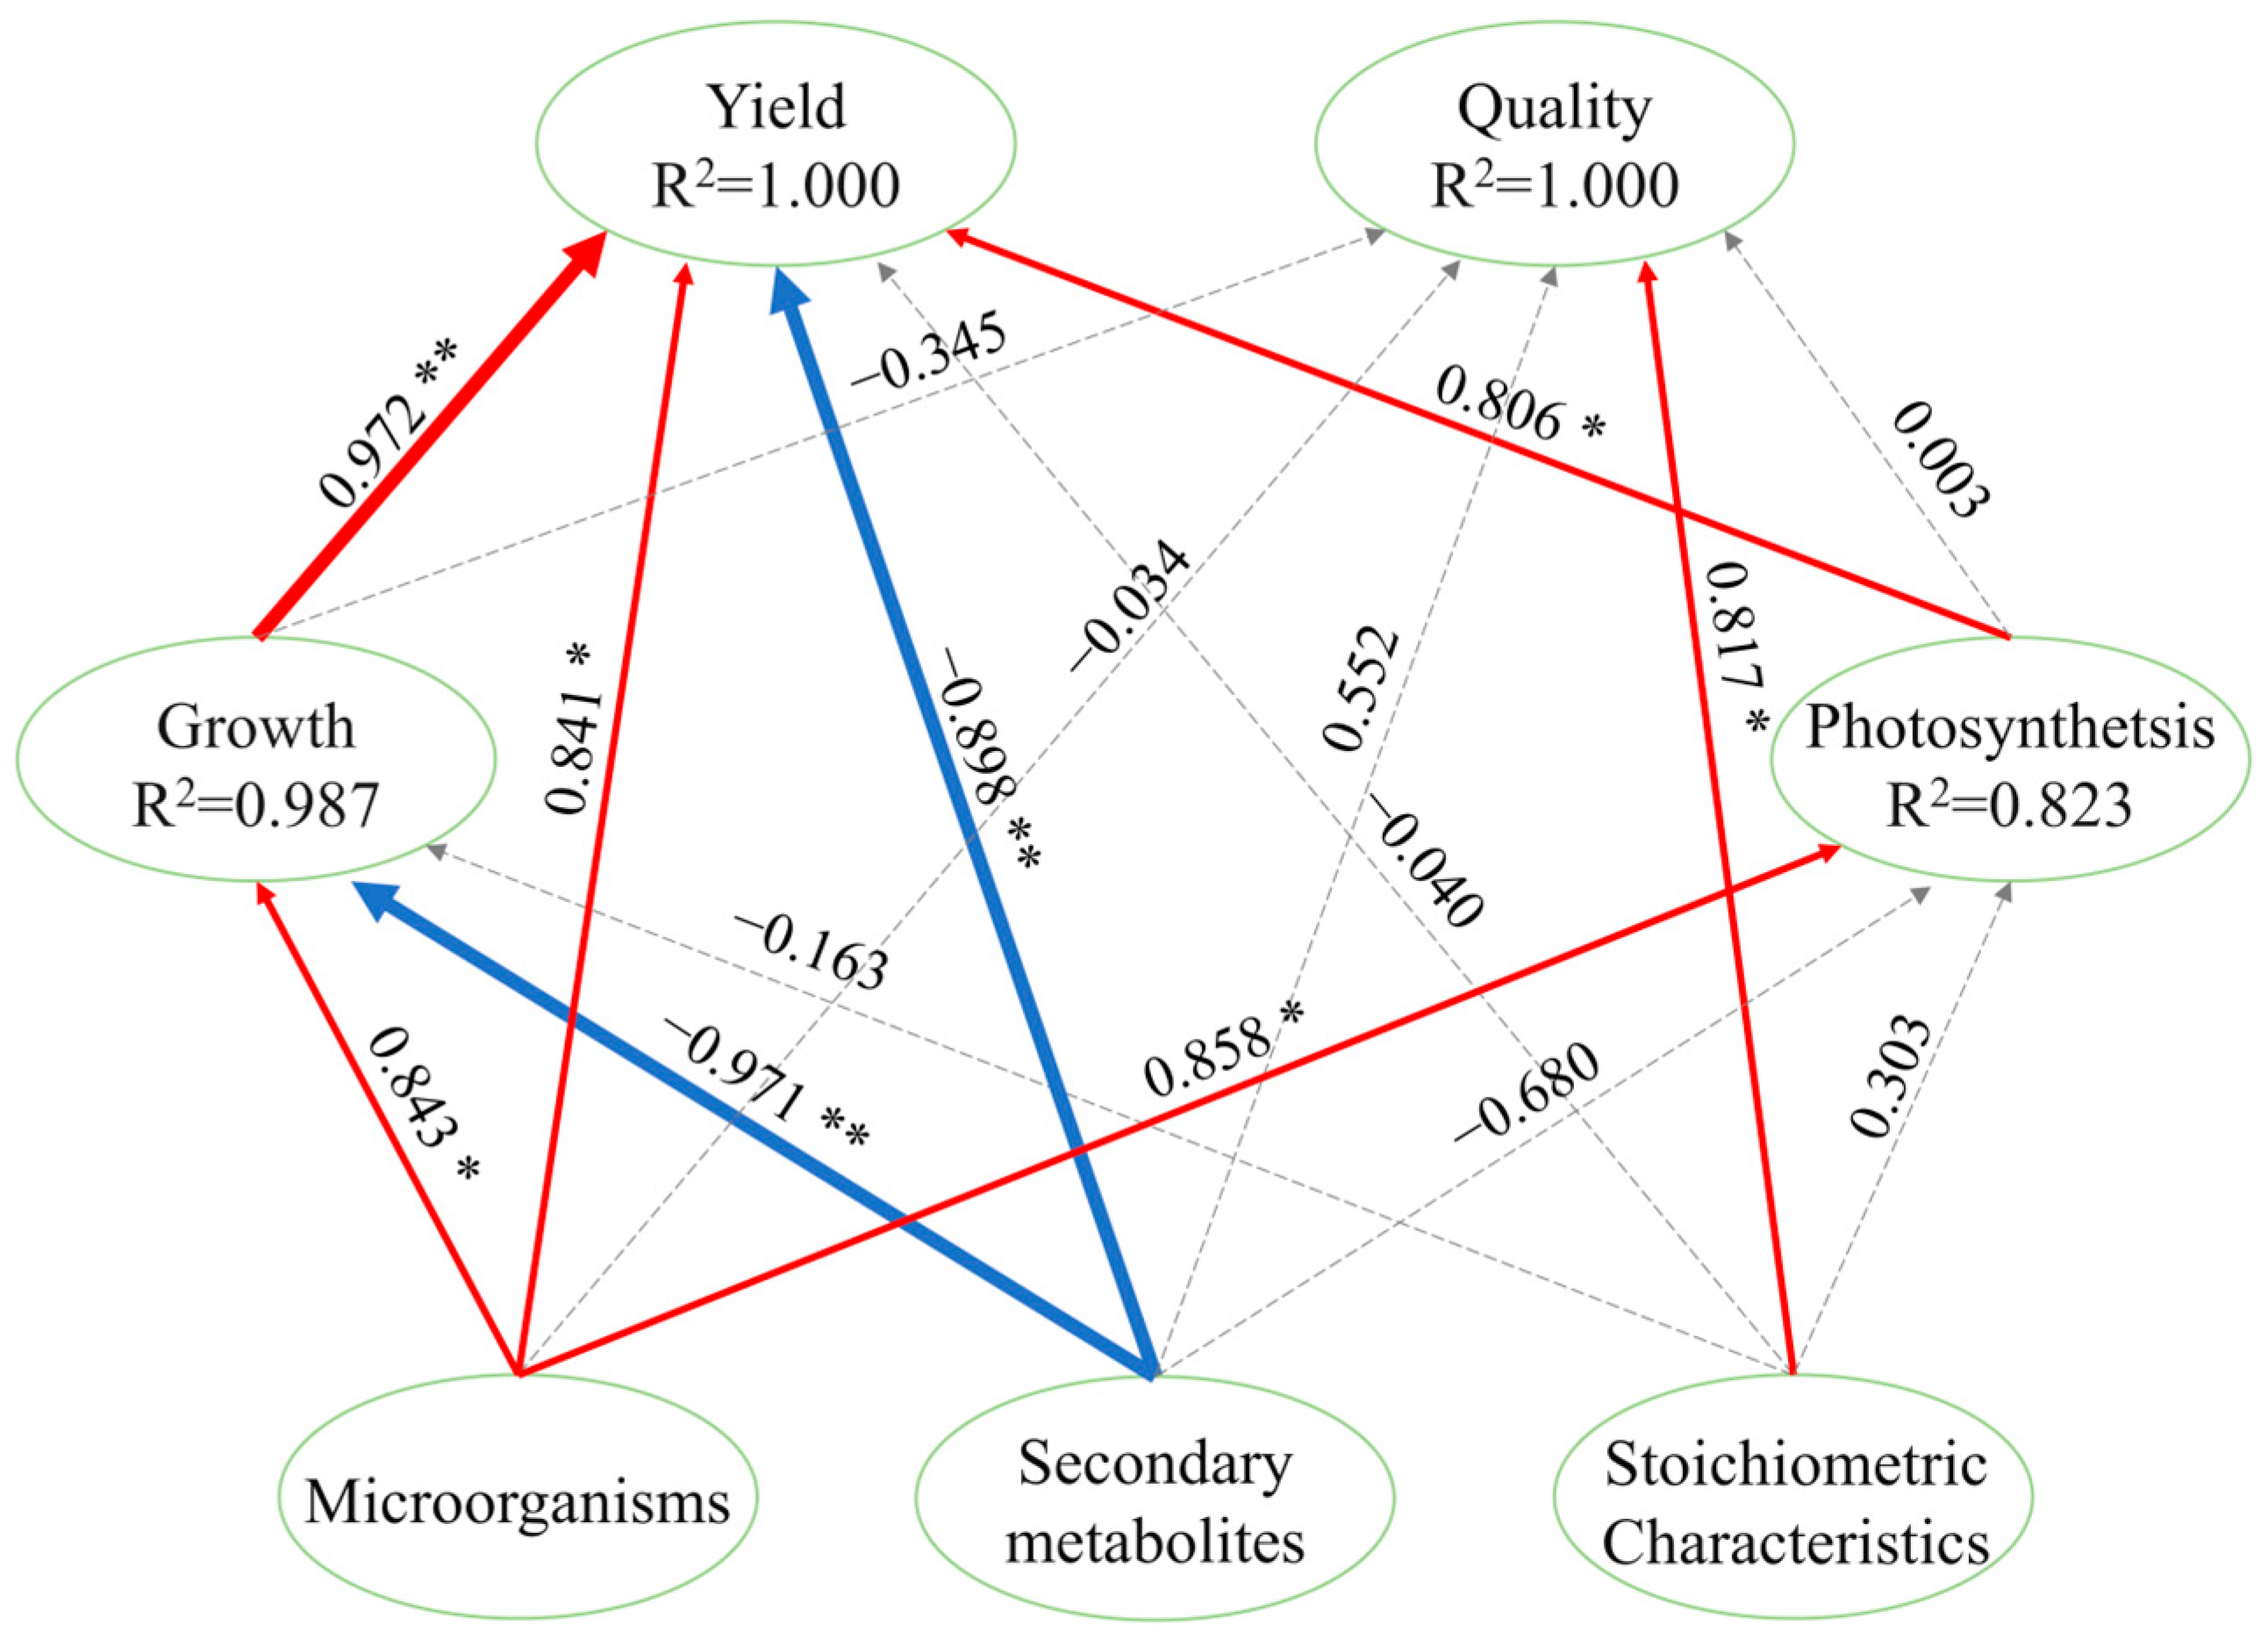
3.9. Combined Analysis of Pepper Yield and Quality Considering Growth, Stoichiometric Characteristics, Microorganisms, and Metabolites

A PLS model further revealed the relationships among microorganisms, metabolites, plant growth, stoichiometric characteristics, yield, and quality. The microorganism, photosynthetic capacity, and biomass of pepper plants significantly promoted yield (Figure 9). Stoichiometric characteristics and metabolites were positively correlated with quality, while the yield was negatively correlated with metabolite production.

4. Discussion

Cultivation substrates significantly affect crop growth and yield. The substrate organic C content was lower in all treatments compared to the CK (Table 2). This result differs from a previous study where combined organic and inorganic fertilization increased the organic C content [32], possibly because no additional organic matter was added during cultivation in the present study. Both C/N and C/P ratios are important indicators for evaluating soil nutrient availability. In this study, C/N and C/P ratios of the substrate and plants decreased under the T6 treatment. The lower C/N and C/P in plants under T6 indicated that the substrate contained higher levels of available N and P, which enhanced N and P uptake. In addition, C/N is the key factor limiting the growth of microorganisms in this soil [33]. N deficiency can slow microbial growth and disrupt metabolism. Thus, the high C/N ratio under CK may be responsible for the decline in microbial abundance.
The net photosynthetic rate and transpiration rate both significantly contributed to the increase in yield (Figure 2 and Figure 4). The higher photosynthetic rate provided energy for plant growth, and the net photosynthetic rate significantly increased under the T6 treatment [34]. The stomata act as a conduit for the exchange of water and CO2 between the inside and outside of plants and are directly involved in C assimilation and water use efficiency [35,36]. The higher transpiration rate facilitates increased plant growth and yield. A significant negative correlation was noted between soluble sugar content and nitrate content in pepper fruits. Soluble sugar functions as an energy storage substance in vegetables, while nitrate-N absorbed from the soil must be converted to ammonia-N for plant uptake and utilization, explaining the negative correlation [37]. The T6 treatment ranked the highest in the comprehensive evaluation, which was attributed to higher yields and better growth conditions.
Soil microorganisms are an important component of soil ecosystems, influencing the C, N, and P cycles in plants and playing an important role in plant growth [38]. The dominant microorganisms in the optimal treatment (T6) and CK were analyzed to identify the key microbial populations that promote the growth and quality formation of peppers. The growth status of plants under the T6 treatment was significantly higher than under the CK conditions (Figure S1). Growth and yield require substantial energy, and Chloroflexi can stimulate the decomposition of humus to release energy that supports plant growth [39]. In addition, Actinobacteriota contribute to maintaining bacterial stability within microbial communities [40]. In this experiment, microorganisms impacted the growth and yield of peppers by influencing crop photosynthesis (Figure 2 and Figure S2). Gemmatimonadota have been shown to promote the synthesis of photosynthetic pigments [41]. Moreover, microorganisms promote photosynthesis and growth through the release of volatile compounds [42,43,44]. Actinobacteriota, Chloroflexi, and Gemmatimonadota were more abundant under the T6 treatment than in CK (Figure 6).
Plants are living chemical factories capable of biosynthesizing large amounts of secondary metabolites [45]. Although a negative correlation was observed between plant growth and pepper metabolites, a positive correlation was found between quality indicators and metabolites (Figure 9). Under the CK treatment, nutrient deficiency in the substrate exposed the plants to environmental stress, resulting in the production of numerous metabolites that enabled them to survive under unfavorable stress conditions [46]. The metabolites produced under CK were mainly phenols. Phenolic compounds can inhibit plant growth and development and are a major obstacle to continuous cropping [47]. The T6 treatment reduced the secretion of phenols, resulting in better growth of the pepper plants. Previous studies have demonstrated that microorganisms can decompose phenols, which improves the growth of plants [48,49]. This is consistent with the present finding that microorganisms are significantly positively correlated with plant growth. Nevertheless, it should be noted that root exudate composition may also lead to changes in microorganisms [50]. Further research is suggested to better understand the relationship between microorganisms and plants growth mediated by rhizosphere metabolites.

5. Conclusions

In conclusion, the T6 fertilization treatment significantly promoted pepper yield compared to the CK by improving plant growth and photosynthetic capacity. The optimal fertilization rate and frequency for substrate-cultivated pepper was 605.6 kg·ha−1 applied once every 10 days. Under this treatment, pepper plants exhibited improved growth and photosynthetic performance, and the soil supported a higher abundance of beneficial microorganisms that contributed to a 59% increase in fruit yield compared to CK. In addition, fertilization changed the composition of rhizosphere metabolites, with differential metabolites significantly enriched in alanine, aspartate, and glutamate metabolism as well as butanoate metabolism.

Supplementary Materials

The following supporting information can be downloaded at: https://www.mdpi.com/article/10.3390/horticulturae11070764/s1. Figure S1: Growth parameters of pepper under different fertilization treatments. Different letters indicate significant differences (p < 0.05). Figure S2: Chlorophyll content of pepper under different fertilization treatments. Different letters indicate significant differences (p < 0.05).

Author Contributions

Q.D. (Qianqian Di) and Q.D. (Qingjie Du) designed the experiment. Q.D. (Qianqian Di), E.J., G.G., J.L., M.L., H.W. and P.W. performed the experiment and analyzed the data. Q.D. (Qianqian Di) wrote this paper. Q.D. (Qingjie Du) and H.X. reviewed and checked all the details. All authors have read and agreed to the published version of the manuscript.

Funding

This work was supported financially by Major Science and Technology Special Project of Henan Province (241100110200) and the Special Fund for Henan Agriculture Research System, China (HARS-22-07-G4).

Data Availability Statement

Data are contained within the article and supplementary materials. Further inquiries can be directed to the corresponding author.

Conflicts of Interest

The authors declare no conflicts of interest.

References

  1. Wang, Y.Y.; Piao, F.Z.; Di, Y.C.; Xu, J.X.; Wang, Z.C.; Wang, T.; Li, P.J.; Hu, C.Y.; Du, N.S.; Zhang, T.; et al. Serratia plymuthica HK9-3 enhances tomato resistance against Phytophthora capsici by modulating antioxidant defense systems and rhizosphere micro-ecological condition. Physiol. Plant. 2024, 176, e14323. [Google Scholar] [CrossRef] [PubMed]
  2. Ren, Y.; Yu, P.B.; Wang, Y.; Hou, W.X.; Yang, X.; Fan, J.L.; Wu, X.H.; Lv, X.L.; Zhang, N.; Zhao, L.; et al. Development of a rapid approach for detecting sharp eyespot resistance in seedling-stage wheat and its application in Chinese wheat cultivars. Plant Dis. 2020, 104, 1662–1667. [Google Scholar] [CrossRef] [PubMed]
  3. Feng, Z.H.; Wang, L.Y.; Yang, Z.Q.; Zhang, Y.Y.; Li, X.; Song, L.; He, L.; Duan, J.Z.; Feng, W. Hyperspectral monitoring of powdery mildew disease severity in wheat based on machine learning. Front. Plant Sci. 2022, 13, 828454. [Google Scholar] [CrossRef]
  4. Lai, Y.; Ma, J.H.; Zhang, X.B.; Xuan, X.B.; Zhu, F.Y.; Ding, S.; Shang, F.D.; Chen, Y.Y.; Zhao, B.; Chen, L.; et al. High-quality chromosome-level genome assembly and multi-omics analysis of rosemary (Salvia rosmarinus) reveals new insights into the environmental and genome adaptation. Plant Biotechnol. J. 2024, 22, 1833–1847. [Google Scholar] [CrossRef]
  5. Lakhiar, I.A.; Gao, J.M.; Syed, T.N.; Chandio, F.A.; Buttar, N.A. Modern plant cultivation technologies in agriculture under controlled environment: A review on aeroponics. J. Plant Interact. 2018, 13, 338–352. [Google Scholar] [CrossRef]
  6. Wang, R.N.; Qian, J.J.; Fang, Z.M.; Tang, J.H. Transcriptomic and physiological analyses of rice seedlings under different nitrogen supplies provide insight into the regulation involved in axillary bud outgrowth. BMC Plant Biol. 2020, 20, 197. [Google Scholar] [CrossRef]
  7. Verruma-Bernardi, M.R.; Pimenta, D.M.; Levrero, G.R.; Forti, V.A.; Medeiros, S.D.; Ceccato-Antonini, S.R.; Covre, E.A.; Ferreira, M.D.; Moret, R.; Bernardi, A.C.; et al. Yield and quality of curly kale grown using organic fertilizers. Hortic. Bras. 2021, 39, 112–121. [Google Scholar] [CrossRef]
  8. Liu, W.X.; Wang, J.R.; Wang, C.Y.; Ma, G.; Wei, Q.R.; Lu, H.F.; Xie, Y.X.; Ma, D.Y.; Kang, G.Z. Root growth, water and nitrogen use efficiencies in winter wheat under different irrigation and nitrogen regimes in North China Plain. Front. Plant Sci. 2018, 9, 1798. [Google Scholar] [CrossRef] [PubMed]
  9. Liu, W.X.; Ma, G.; Wang, C.Y.; Wang, J.R.; Lu, H.F.; Li, S.S.; Fang, W.; Xie, Y.X.; Ma, D.Y.; Kang, G.Z. Irrigation and nitrogen regimes promote the use of soil water and nitrate nitrogen from deep soil layers by regulating root growth in wheat. Front. Plant Sci. 2018, 9, 32. [Google Scholar] [CrossRef]
  10. Pahuja, S.; Bheri, M.; Bisht, D.; Pandey, G.K. Calcium signalling components underlying NPK homeostasis: Potential avenues for exploration. Biochem. J. 2023, 48, 1015–1034. [Google Scholar] [CrossRef]
  11. Nosheen, S.; Ajmal, I.; Song, Y.D. Microbes as biofertilizers, a potential approach for sustainable crop production. Sustainability 2021, 13, 1868. [Google Scholar] [CrossRef]
  12. Zhou, Z.F.; Shi, X.J.; Zheng, Y.; Qin, Z.X.; Xie, D.T.; Li, Z.L.; Guo, T. Abundance and community structure of ammonia-oxidizing bacteria and archaea in purple soil under long-term fertilization. Eur. J. Soil Biol. 2014, 60, 24–33. [Google Scholar] [CrossRef]
  13. Stringlis, I.A.; Yu, K.; Feussner, K.; Jonge, R.D.; Bentum, S.V.; Verk, M.C.V.; Berendsen, R.L.; Bakker, P.A.H.M.; Feussner, I.; Pieterse, C.M.J. MYB72-dependent coumarin exudation shapes root microbiome assembly to promote plant health. Proc. Natl. Acad. Sci. USA 2018, 115, 5213–5222. [Google Scholar] [CrossRef]
  14. Thakur, M.P.; Geisen, S. Trophic regulations of the soil microbiome. Trends Microbiol. 2019, 27, 771–780. [Google Scholar] [CrossRef]
  15. Leff, J.W.; Jones, S.E.; Prober, S.M.; Barberán, A.; Borer, E.T.; Firn, J.L.; Harpole, W.S.; Hobbie, S.E.; Hofmockel, K.S.; Knops, J.M.H.; et al. Consistent responses of soil microbial communities to elevated nutrient inputs in grasslands across the globe. Proc. Natl. Acad. Sci. USA 2015, 112, 10967–10972. [Google Scholar] [CrossRef]
  16. Saxena, D.; Stewart, C.N.; Altosaar, I.; Shu, Q.Y.; Stotzky, G. Larvicidal Cry proteins from Bacillus thuringiensis are released in root exudates of transgenic B. thuringiensis corn, potato, and rice but not of B. thuringiensis canola, cotton, and tobacco. Plant Physiol. Biochem. 2004, 42, 383–387. [Google Scholar] [CrossRef] [PubMed]
  17. Ansari, M.M.; Bisht, N.; Singh, T.; Chauhan, P.S. Symphony of survival: Insights into cross-talk mechanisms in plants, bacteria, and fungi for strengthening plant immune responses. Microbiol. Res. 2024, 285, 127762. [Google Scholar] [CrossRef] [PubMed]
  18. Yang, T.; Siddique, K.; Liu, K. Cropping systems in agriculture and their impact on soil health-A review. Glob. Ecol. Conserv. 2020, 23, e01118. [Google Scholar] [CrossRef]
  19. Xu, L.T.; Jin, S.; Lyu, X.C.; Yan, S.S.; Wang, C.; Cao, L.; Yan, C.; Ma, C.M. Combined metagenomics and metabolomic analysis of microbial community structure and metabolic function in continuous soybean cropping soils of Songnen Plain, China. Chem. Biol. Technol. Agric. 2024, 11, 46. [Google Scholar] [CrossRef]
  20. Eichler-Löbermann, B.; Köhne, S.; Köppen, D. Effect of organic, inorganic, and combined organic and inorganic P fertilization on plant P uptake and soil P pools. J. Plant Nutr. Soil Sci. 2007, 170, 623–628. [Google Scholar] [CrossRef]
  21. You, C.; Qin, A.; Wang, Y.M.; Lan, W.Y.; Li, Y.H.; Yu, B.H.; Peng, Y.J.; Xu, J.R.; Dong, J.Y. Plant triterpenoids regulate endophyte community to promote medicinal plant Schisandra sphenanthera growth and metabolites accumulation. J. Fungi 2022, 7, 788. [Google Scholar] [CrossRef] [PubMed]
  22. Lucas, J.; Koester, I.; Wichels, A.; Niggemann, J.; Dittmar, T.; Callies, U.; Wiltshire, K.H.; Gerdts, G. Short-term dynamics of north sea bacterioplankton-dissolved organic matter coherence on molecular level. Front. Microbiol. 2016, 7, 321. [Google Scholar] [CrossRef] [PubMed]
  23. Huang, W.J.; Sun, D.L.; Chen, L.J.; An, Y.X. Integrative analysis of the microbiome and metabolome in understanding the causes of sugarcane bitterness. Sci. Rep. 2021, 11, 6024. [Google Scholar] [CrossRef]
  24. Stipcovich, T.; Barbero, G.F.; Ferreiro-González, M.; Palma, M.; Barroso, C.G. Fast analysis of capsaicinoids in Naga Jolokia extracts (Capsicum chinense) by high-performance liquid chromatography using fused core columns. Food Chem. 2018, 239, 217–224. [Google Scholar] [CrossRef] [PubMed]
  25. Li, H.S. Principles and Techniques of Plant Physiological and Biochemical Experiments; Higher Education Press: Beijing, China, 2000. (In Chinese) [Google Scholar]
  26. Bao, S.D. Analysis of Soil Agrochemistry, 3rd ed.; China Agriculture Press: Beijing, China, 2000. (In Chinese) [Google Scholar]
  27. Gao, J.F. Plant Physiology Experimental Guidance; Higher Education Press: Beijing, China, 2006. (In Chinese) [Google Scholar]
  28. Chao, A. Nonparametric Estimation of the Number of Classes in a Population. Scand. J. Stat. 1984, 11, 265–270. [Google Scholar]
  29. Shannon, C.E. A mathematical theory of communication. Bell Syst. Tech. J. 1948, 27, 379–423. [Google Scholar] [CrossRef]
  30. Simpson, E.H. Measurement of Diversity. Nature 1949, 163, 688. [Google Scholar] [CrossRef]
  31. Chen, P.Y. A novel coordinated TOPSIS based on coefficient of variation. Mathematics 2019, 7, 614. [Google Scholar] [CrossRef]
  32. Yang, Q.; Li, J.L.; Xu, W.X.; Wang, J.J.; Jiang, Y.M.; Ali, W.Q.; Liu, W.J. Substitution of inorganic fertilizer with organic fertilizer influences soil carbon and nitrogen content and enzyme activity under rubber plantation. Forests 2024, 15, 756. [Google Scholar] [CrossRef]
  33. Brown, R.W.; Chadwick, D.R.; Bending, G.D.; Collins, C.D.; Whelton, H.L.; Daulton, E.; Covington, J.A.; Bull, I.D.; Jones, D.L. Nutrient (C, N and P) enrichment induces significant changes in the soil metabolite profile and microbial carbon partitioning. Soil Biol. Biochem. 2022, 172, 108779. [Google Scholar] [CrossRef]
  34. Lian, X.L.; Liu, S.; Sikandar, A.; Kang, Z.L.; Feng, Y.X.; Jiang, L.Y.W.; Wang, Y.Y. The influence of 6-Benzylaminopurine (BAP) on yield responses and photosynthetic physiological indices of soybean. Kuwait J. Sci. 2023, 50, 345–352. [Google Scholar] [CrossRef]
  35. Sade, N.; Gebretsadik, M.; Seligmann, R.; Schwartz, A.; Wallach, R.; Moshelion, M. The role of tobacco aquaporin1 in improving water use efficiency, hydraulic conductivity, and yield production under salt stress. Plant Physiol. 2010, 152, 245–254. [Google Scholar] [CrossRef]
  36. Weksler, S.; Rozenstein, O.; Haish, N.; Moshelion, M.; Wallach, R.; Ben-Dor, E. Detection of potassium deficiency and momentary transpiration rate estimation at early growth stages using proximal hyperspectral imaging and extreme gradient boosting. Sensors 2021, 21, 958. [Google Scholar] [CrossRef] [PubMed]
  37. Sheikh, F.R.; Jose-Santhi, J.; Kalia, D.; Singh, K.; Singh, R.K. Sugars as the regulators of dormancy and sprouting in geophytes. Ind. Crops Prod. 2022, 189, 115817. [Google Scholar] [CrossRef]
  38. Glockow, T.; Kaster, A.; Rabe, K.S.; Niemeyer, C.M. Sustainable agriculture: Leveraging microorganisms for a circular economy. Appl. Microbiol. Biotechnol. 2024, 108, 452. [Google Scholar] [CrossRef] [PubMed]
  39. Krzmarzick, M.J.; Crary, B.B.; Harding, J.J.; Oyerinde, O.O.; Leri, A.C.; Myneni, S.C.B.; Novak, P.J. Natural niche for organohalide-respiring Chloroflexi. Appl. Environ. Microbiol. 2012, 78, 393–401. [Google Scholar] [CrossRef]
  40. Pan, Y.Q.; Kang, P.; Qu, X.; Zhang, H.X.; Li, X.R. Response of the soil bacterial community to seasonal variations and land reclamation in a desert grassland. Ecol. Indic. 2024, 165, 112227. [Google Scholar] [CrossRef]
  41. Mujakić, I.; Piwosz, K.; Koblížek, M. Phylum gemmatimonadota and its role in the environment. Microorganisms 2022, 10, 151. [Google Scholar] [CrossRef]
  42. Sánchez-López, A.M.; Bahaji, A.; Diego, N.D.; Baslam, M.; Li, J.; Muñoz, F.J.; Almagro, G.; García-Gómez, P.; Ameztoy, P.; Ricarte-Bermejo, A.; et al. Arabidopsis responds to Alternaria alternata volatiles by triggering plastid phosphoglucose isomerase-independent mechanisms. Plant Physiol. 2016, 172, 1989–2001. [Google Scholar] [CrossRef]
  43. Gámez-Arcas, S.; Baroja-Fernández, E.; García-Gómez, P.; José Muñoz, F.; Almagro, G.; Bahaji, A.; Sánchez-López, A.M.; Pozueta-Romero, J. Action mechanisms of small microbial volatile compounds in plants. J. Exp. Bot. 2022, 73, 498–510. [Google Scholar] [CrossRef]
  44. Wu, Y.J.; Ma, L.Y.; Liu, Q.Z.; Sikder, M.M.; Vestergård, M.; Zhou, K.; Wang, Q.; Yang, X.; Feng, Y. Pseudomonas fluorescens promote photosynthesis, carbon fixation and cadmium phytoremediation of hyperaccumulator Sedum alfredii. Sci. Total Environ. 2020, 726, 138554. [Google Scholar] [CrossRef] [PubMed]
  45. Li, Y.Q.; Kong, D.X.; Fu, Y.; Sussman, M.R.; Wu, H. The effect of developmental and environmental factors on secondary metabolites in medicinal plants. Plant Physiol. Biochem. 2020, 148, 80–89. [Google Scholar] [CrossRef] [PubMed]
  46. Chaiwanon, J.; Wang, W.F.; Zhu, J.Y.; Oh, E.; Wang, Z.Y. Information integration and communication in plant growth regulation. Cell 2016, 164, 1257–1268. [Google Scholar] [CrossRef]
  47. Wang, S.; Bian, T.; Wu, T.; Zhang, Y.D.; Awais, M.; Fu, H.D.; Sun, Z.P. Co-analysis of cucumber rhizosphere metabolites and microbial PLFAs under excessive fertilization in solar greenhouse. Frotiers Microbiol. 2022, 13, 1004836. [Google Scholar] [CrossRef]
  48. Fernandez, M.; Paulucci, N.S.; Reynos, E.; Morales, G.M.; Agostini, E.; González, P.S. Morphological and structural response of Bacillus sp. SFC 500-1E after Cr(VI) and phenol treatment. J. Basic Microbiol. 2020, 60, 679–690. [Google Scholar] [CrossRef] [PubMed]
  49. Mahgoub, S.A.; Qattan, S.Y.A.; Salem, S.S.; Abdelbasit, H.M.; Raafat, M.; Ashkan, M.F.; Al-Quwaie, D.A.; Motwali, E.A.; Alqahtani, F.S.; El-Fattah, H.A. Characterization and biodegradation of phenol by Pseudomonas aeruginosa and Klebsiella variicola strains isolated from sewage sludge and their effect on soybean seeds germination. Molecules 2023, 28, 1203. [Google Scholar] [CrossRef]
  50. Fang, K.; Kou, Y.P.; Tang, N.; Liu, J.; Zhang, X.Y.; He, H.L.; Xia, R.X.; Zhao, W.Q.; Li, D.D.; Liu, Q. Differential responses of soil bacteria, fungi and protists to root exudates and temperature. Microbiol. Res. 2024, 286, 127829. [Google Scholar] [CrossRef]
Figure 1. Elemental composition of pepper plants under different fertilization treatments. (a) organic C; (b) total N; (c) total P; (d) C/N; (e) C/P; (f) N/P. CK represents the no-fertilization treatment. T1–T4 were fertilized once every 5 days, with total fertilizer amounts of 378.5, 605.6, 529.9, and 757.0 kg·ha−1, respectively. T5–T8 were fertilized once every 10 days, with the same total fertilizer amounts of 378.5, 605.6, 529.9, and 757.0 kg·ha−1, respectively. Different letters indicate significant differences (p < 0.05).
Horticulturae 11 00764 g001
Figure 2. Photosynthetic parameters of pepper plants under different fertilization treatments. (a) net photosynthetic rate; (b) transpiration rate; (c) stomatal conductance; (d) intercellular CO2 concentration. CK represents the no-fertilization treatment. T1–T4 were fertilized once every 5 days, with total fertilizer amounts of 378.5, 605.6, 529.9, and 757.0 kg·ha−1, respectively. T5–T8 were fertilized once every 10 days with the same total fertilizer amounts of 378.5, 605.6, 529.9, and 757.0 kg·ha−1, respectively. Different letters indicate significant differences (p < 0.05).
Horticulturae 11 00764 g002
Figure 3. Yield of pepper plants under different fertilization treatments. CK indicates the no-fertilization treatment. T1–T4 were fertilized once every 5 days with total fertilizer amounts of 378.5, 605.6, 529.9, and 757.0 kg·ha−1, respectively. T5–T8 were fertilized once every 10 days with the same total fertilizer amounts of 378.5, 605.6, 529.9, and 757.0 kg·ha−1, respectively. Different letters indicate significant differences (p < 0.05).
Horticulturae 11 00764 g003
Figure 4. Correlation of pepper indices under different fertilization treatments. * p < 0.05; ** p < 0.01.
Horticulturae 11 00764 g004
Figure 5. Relative closeness and rank of each treatment under the TOPSIS method. CK indicates the no-fertilization treatment. T1–T4 were fertilized once every 5 days with total fertilizer amounts of 378.5, 605.6, 529.9, and 757.0 kg·ha−1, respectively. T5–T8 were fertilized once every 10 days with the same total fertilizer amounts of 378.5, 605.6, 529.9, and 757.0 kg·ha−1, respectively. The numbers represent the ranking of the different treatments.
Horticulturae 11 00764 g005
Figure 6. Responses of rhizosphere microbial communities to different fertilization treatments. (a) Chao1, Shannon, and Simpson indices under CK and T6; (b) number of microbial taxa identified under CK and T6; (c) taxonomic hierarchy tree diagram at different levels; (d) relative abundance (%) of dominant bacterial phyla and genera under CK and T6. CK represents the no-fertilization treatment. T6 was fertilized once every 10 days with a total fertilizer amount of 605.6 kg·ha−1. * p < 0.05.
Horticulturae 11 00764 g006
Figure 7. Metabolite responses to different fertilization treatments. (a) Volcano map of differential metabolite analysis under different treatments; (b) KEGG analysis of pathways to which differential metabolites belong under different treatments.
Horticulturae 11 00764 g007
Figure 8. Correlation analysis of rhizosphere microorganisms and metabolites. The red line indicates a positive correlation, and the green line indicates a negative correlation; the larger the node area, the higher the species abundance/detection index value represented by the node.
Horticulturae 11 00764 g008
Figure 9. Relationships among pepper growth, stoichiometric characteristics, rhizosphere microorganisms, and metabolites. The blue and red arrows indicate negative and positive flows of causality, respectively. The dotted gray arrows represent non-significant path relationships. R2 denotes the variance score for explanation; * p < 0.05; ** p < 0.01.
Horticulturae 11 00764 g009
Table 1. The fertilization scheme after pepper planting.
TreatmentFertilization FrequencyFertilization Amount/kg·ha−1
Amount of Fertilizer Applied Each Time During Vegetative Growth Period
(28 March to 7 May 2024)
Amount of Fertilizer Applied Each Time During Fruiting Period
(8 May to 6 July 2024)
Total Amount of Fertilizer over the Growing Period
CKNot fertilized000
T1Once every 5 days18.93 (8 times in total)18.93 (12 times in total)378.5
T2Once every 5 days18.93 (8 times in total)37.85 (12 times in total)605.6
T3Once every 5 days37.85 (8 times in total)18.93 (12 times in total)529.9
T4Once every 5 days37.85 (8 times in total)37.85 (12 times in total)757.0
T5Once every 10 days37.85 (4 times in total)37.85 (6 times in total)378.5
T6Once every 10 days37.85 (4 times in total)75.70 (6 times in total)605.6
T7Once every 10 days75.70 (4 times in total)37.85 (6 times in total)529.9
T8Once every 10 days75.70 (4 times in total)75.70 (6 times in total)757.0
Table 2. Properties of pepper cultivation substrate under different fertilization treatments.
TreatmentOrganic C/g·kg−1Total N/g·kg−1Total P/g·kg−1Available N/mg·kg−1Available P/mg·kg−1
CK16.14 ± 0.96 a8.42 ± 0.11 a0.99 ± 0.00 c350.00 ± 0.00 a7.21 ± 0.58 ab
T113.01 ± 0.20 bc8.05 ± 0.77 a1.01 ± 0.01 abc350.00 ± 0.00 a8.02 ± 0.06 a
T213.68 ± 0.10 abc8.27 ± 0.31 a1.00 ± 0.01 abc233.33 ± 23.33 bc7.33 ± 0.69 ab
T314.32 ± 0.19 ab8.65 ± 0.30 a1.00 ± 0.00 bc303.33 ± 46.67 bc7.40 ± 0.66 ab
T411.54 ± 0.96 bcd8.12 ± 0.41 a1.00 ± 0.01 bc210.00 ± 0.00 c6.89 ± 0.49 ab
T511.08 ± 2.41 cde8.09 ± 0.45 a1.04 ± 0.01 a233.33 ± 46.67 bc5.93 ± 0.59 b
T610.80 ± 1.19 cde8.20 ± 0.24 a1.01 ± 0.03 abc233.33 ± 23.33 bc7.40 ± 0.48 ab
T78.40 ± 0.27 e7.93 ± 0.12 a1.02 ± 0.01 abc326.67 ± 46.67 a6.64 ± 0.66 ab
T89.53 ± 0.30 de8.50 ± 0.16 a1.03 ± 0.01 ab373.33 ± 23.33 a6.51 ± 0.73 ab
Note: CK indicates the no-fertilization treatment. T1–T4 were fertilized once every 5 days, with total fertilizer amounts of 378.5, 605.6, 529.9, and 757.0 kg·ha−1, respectively. T5–T8 were fertilized once every 10 days, with the same total fertilizer amounts of 378.5, 605.6, 529.9, and 757.0 kg·ha−1, respectively. Different letters within the same column indicate significant differences (p < 0.05).
Table 3. Quality of pepper under different fertilization treatments.
TreatmentSoluble Sugars/%Soluble Proteins/mg·g−1Soluble Solids/%Vitamin C/mg·100g−1Organic Acids/%Nitrate/mg·kg−1
CK59.25 ± 12.32 a28.20 ± 0.14 abc2.43 ± 0.09 bc111.67 ± 18.78 bcd0.12 ± 0.01 ab9.76 ± 0.01 b
T141.26 ± 0.46 bc28.03 ± 0.15 bc2.93 ± 0.32 b144.22 ± 6.90 abc0.11 ± 0.01 bc10.41 ± 0.24 ab
T253.17 ± 1.36 ab27.80 ± 0.28 cd3.03 ± 0.18 b155.72 ± 15.91 ab0.10 ± 0.00 c9.75 ± 0.11 b
T343.42 ± 1.57 bc27.09 ± 0.13 d2.37 ± 0.49 bc128.76 ± 10.42 abcd0.10 ± 0.00 c10.34 ± 0.25 ab
T443.08 ± 2.20 bc29.02 ± 0.13 a4.40 ± 0.47 a129.60 ± 27.90 abcd0.11 ± 0.01 bc10.71 ± 0.13 ab
T548.70 ± 3.53 abc28.84 ± 0.23 ab2.17 ± 0.35 bc86.10 ± 14.15 d0.13 ± 0.00 a10.23 ± 0.08 ab
T645.12 ± 6.52 abc27.99 ± 0.51 bcd2.53 ± 0.38 b107.97 ± 7.49 bcd0.12 ± 0.01 bc11.18 ± 0.79 a
T743.64 ± 1.80 bc28.51 ± 0.24 abc3.07 ± 0.20 b94.72 ± 28.32 cd0.13 ± 0.00 a10.68 ± 0.13 ab
T837.86 ± 2.69 c27.90 ± 0.57 cd1.47 ± 0.48 c164.48 ± 7.81 a0.13 ± 0.00 a10.78 ± 0.41 ab
Note: CK indicates the no-fertilization treatment. T1–T4 were fertilized once every 5 days, with total fertilizer amounts of 378.5, 605.6, 529.9, and 757.0 kg·ha−1, respectively. T5–T8 were fertilized once every 10 days with the same total fertilizer amounts of 378.5, 605.6, 529.9, and 757.0 kg·ha−1, respectively. Different letters within the same column indicate significant differences (p < 0.05).
Disclaimer/Publisher’s Note: The statements, opinions and data contained in all publications are solely those of the individual author(s) and contributor(s) and not of MDPI and/or the editor(s). MDPI and/or the editor(s) disclaim responsibility for any injury to people or property resulting from any ideas, methods, instructions or products referred to in the content.

