Article

Skeleton Photoperiod Enhances Photosynthetic Yield in Celery via Circadian-Regulated Metabolic Coordination

1
State Key Laboratory of Crop Genetics & Germplasm Innovation and Utilization, Key Laboratory of Biology and Genetic Improvement of Horticultural Crops (East China), Ministry of Agriculture and Rural Affairs of China, Engineering Research Center of Germplasm Enhancement and Utilization of Horticultural Crops, Ministry of Education of China, Nanjing Agricultural University, Nanjing 210095, China
2
College of Sciences, Nanjing Agricultural University, Nanjing 210095, China
*
Author to whom correspondence should be addressed.
These authors contributed equally to this work.
Horticulturae 2025, 11(5), 520; https://doi.org/10.3390/horticulturae11050520
Submission received: 9 April 2025 / Revised: 3 May 2025 / Accepted: 6 May 2025 / Published: 12 May 2025
(This article belongs to the Section Protected Culture)

Abstract

:
The circadian clock orchestrates photosynthetic and metabolic processes in plants, but the molecular mechanisms underlying the photoperiodic regulation of photosynthetic yield remain poorly understood. Here, we integrated computational modeling and experimental validation to investigate how the skeletal photoperiod modulates photosynthetic efficiency in celery (Apium graveolens L.). Our model revealed that endogenous circadian rhythms dynamically regulate photosynthetic gene expression (e.g., Lhcb1, psbA, RbcS1, and atpA) and photosynthetic parameters (net photosynthetic rate and stomatal conductance) through interactions between clock components (CCA1/LHY and PRR9/PRR7) and light signaling. In particular, the 3L:3D skeleton photoperiod induced the highest 24 h photosynthetic accumulation (a 32% and 22% increase in chlorophyll and nitrogen content, respectively, vs. 12L:12D), outperforming continuous light (LL) and longer photoperiods. Rhythmic peaks of photosynthetic genes aligned with circadian-driven oscillations in the photosynthetic parameters, while a strong negative correlation between the net photosynthetic rate (Pn) and intercellular CO2 concentration (Ci) emerged under 3L:3D cycles. Model simulations demonstrated robustness in capturing phase-specific gene expression and parameter dynamics across photoperiods, highlighting the role of the circadian clock in optimizing energy use. These results demonstrate that abnormal L/D cycles, particularly 3L:3D, increase photosynthetic yield by enhancing circadian-regulated metabolic coordination, providing a low-energy, high-efficiency strategy for agricultural productivity. This work advances our understanding of photoperiodic manipulation in crop systems and provides a predictive framework for circadian-informed crop management.

1. Introduction

Celery (Apium graveolens L.), an annual or biennial herb, is cultivated across Europe, Asia, Africa, and Oceania [1,2,3]. This plant is known for its low-fat, low-calorie, aromatic, and high-fiber content. Its leaves and petioles, the main edible parts, are rich in various bioactive compounds [1]. Regarding medicinal value, apigenin, a unique compound found in celery, exhibits a wide range of pharmacological activities, including antimicrobial, antioxidant, and cardiovascular protective effects [4,5]. In recent years, there has been a growing number of studies conducted on celery, particularly focusing on yield improvement [6,7,8]. Nevertheless, research on the molecular mechanisms and physiological processes that enhance celery yield is still insufficient, especially those related to using anomalous photoperiods to regulate photosynthesis for yield enhancement, which is even rarer.
Light is a key environmental factor that regulates plant growth, development, and chemical synthesis [9]. As sequestering organisms, plants have developed sophisticated mechanisms for sensing photoperiods and adapting to them [10,11]. Changes in photoperiods directly affect the photosynthetic efficiency, growth, and development processes, and the dynamics of starch metabolism in plants [12]. Studies have shown that an appropriate extension of the photoperiod can significantly enhance the photosynthetic capacity of plants and promote their growth [13,14]. However, continuous light or excessive prolongation of the photoperiod may result in negative effects such as reduced photosynthetic capacity, excessive starch accumulation, and light stress [15]. For example, Arabidopsis thaliana exhibited rapid growth under long-day conditions, while its flowering time was significantly shorter under short-day conditions [16]. Waterlogged lesions can form in the leaves of plants that are sensitive to photoperiodic stress, ultimately resulting in cell death [17,18]. Under a 12 h light/12 h dark cycle, the apigenin content of the celery variety “Zhang Qiubao Qin” was the highest, whereas that of “Hongcheng Hongqin” peaked only under a 16 h light/8 h dark cycle [19]. Therefore, providing appropriate light and dark periods may be essential for both plant growth and the optimal production of target products [20].
Photosynthesis is the core physiological process through which plants convert light energy into chemical energy and synthesize organic matter. This complex process consists of four key stages: light capture, electron transfer, carbon fixation, and ATP synthesis. The realization of photosynthesis depends on the synergistic expression of multiple functional genes, such as Lhcb1, psbA, RbS1, and atpA, which are precisely regulated by circadian clock genes and play irreplaceable roles in the biosynthesis of organic matter [21].
The core components of the circadian clock, CCA1 and LHY, act as MYB-like transcription factors that maintain the stability of circadian rhythms by repressing genes from the PRR family, including PRR1/TOC1, PRR5, PRR7, and PRR9. In turn, TOC1 and other PRR proteins provide feedback to inhibit the expression of CCA1 and LHY, thus forming a negative feedback regulatory loop [22,23,24]. Additionally, the evening complex (EC) interacts with these coregulators to form a complex regulatory network that is multilayered and interconnected [22,24,25]. This complex molecular mechanism ensures the stability and environmental adaptability of plant circadian rhythms.
Mathematical modeling is a tool that integrates mathematics and physiology to enhance our understanding of living systems. It is particularly valuable for elucidating the regulatory relationships among genes within the circadian clock, the output of regulatory signals from this biological clock, and the influence of environmental factors on the circadian oscillator [21,26,27,28,29]. Additionally, mathematical modeling provides a clear visualization of gene regulatory relationships and the effects of environmental changes on the biological clock. Common mathematical modeling approaches include Boolean models [30] and differential equation-based methods [28,29], both of which aim to capture the interrelated positive–negative feedback loops in different ways [31,32]. Boolean models simplify genes into on/off states and have been successfully employed to model circadian rhythms. Similarly, differential equation-based models have successfully reproduced the response of the Arabidopsis circadian clock to different light conditions [33].
In this study, we investigated the regulatory mechanism of a skeleton photoperiod on photosynthetic yield using celery as the experimental material. By modeling differential equations, we simulated the endogenous circadian oscillations induced by changes in the photoperiod and their cascading effects on photosynthesis. These effects included (1) the rhythmic expression of key photosynthetic genes (e.g., Lhcb1, psbA); (2) cyclic fluctuations in photosynthetic parameters (such as the net photosynthesis rate and the transpiration rate); and (3) variations in photosynthetic yield. Through a combination of model predictions and experimental validation, this study not only achieves accurate predictions of celery’s photosynthetic yield under different photoperiodic conditions but also provides theoretical support for the optimal regulation of light environments in controlled cultivation systems.

2. Materials and Methods

2.1. Plant Materials and Growth Conditions

All 40 experimental celery seedlings (“Ningqin 1”) were cultivated in a climatic greenhouse at Nanjing Agricultural University (longitude 188.84° E, latitude 32.04° N). All seedlings were planted in biodegradable pots measuring 10 cm × 10 cm × 10 cm and filled with a mixture of coir, vermiculite, and perlite (5:3:2). The temperature in the climate chamber was maintained at 22 °C, with relative humidity ranging from 70% to 80%. The CO2 concentration was set at 400 µmol/mol, and the light source consisted of an LED cool light lamp providing a light intensity of 180 µmol/m2/s. The distance between the LED panel and the plants was maintained at 20 to 30 cm, and the plants were spaced 15 cm apart. The position of the seedlings was adjusted daily to ensure they received adequate light, and they were watered every three days to maintain sufficient moisture in the substrate.

2.2. Photoperiodic Treatments

Initially, all seedlings were cultured under a 12 h light/12 h dark (12L:12D) cycle for 5 days. They were then transferred to photoperiods of 3L:3D, 6L:6D, and 24L:0D for 6 days, respectively. The seedlings maintained under the 12L:12D condition were the control group and continued to be kept in this photoperiod. Seedlings were sampled starting when they had 5 leaves (day 5 after transfer). Seedlings grown under 6L:6D, 12L:12D, and 24L:0D conditions had their leaves collected at 3 h intervals following light treatment. For seedlings grown under 3L:3D conditions, leaves were collected at 1.5 h intervals after light treatment, ensuring that the samples were not all collected at moments of alternating light and dark. ZT0 is the control time. All samples were collected in three replicates, then all samples were uniformly processed and immediately stored in an ultra-low temperature refrigerator at −80 °C (Thermo Company, Waltham, MA, USA).

2.3. Determination of Photosynthetic Characteristic Index

The photosynthetic characteristic index was determined in the climatic chamber where the seedlings were grown. Before the collection of samples, the top leaves of each group of celery plants were selected, and four photosynthetic characteristics, including the net photosynthetic rate, the transpiration rate, intercellular CO2 concentration, and stomatal conductance, were measured using a Yaxin-1102G portable photosynthesis analyzer (Yaxin-1102G portable photosynthesis analyzer, Beijing, China). Five plants from each treatment were randomly selected for measurement, and measurements were repeated three times with different leaves from each plant, and the results were averaged.

2.4. Extraction of Total RNA and Preparation of cDNA

Total RNA from the celery leaves of each group was extracted according to the instructions of the RNA Simple Total RNA Kit (Tiangen, Beijing, China). RNA concentration and quality were detected by a Nanodrop 2000 micro UV spectrophotometer (Molecular Devices, Inc., California, USA). A Prime Script RT reagent Kit (TaKaRa, Dalian, China) was used for reverse transcription. The extracted total RNA was reverse-transcribed into cDNA.

2.5. Real-Time Fluorescence Quantitative (RT-qPCR) Analysis

Total RNA was extracted from the celery leaves using a Simple Total RNA Extract Kit (Tiangen, Beijing, China). The integrity and purity of the RNA were assessed through 1.2% agarose gel electrophoresis. The concentration of the RNA samples was measured using a micro UV detector (Nanodrop ND-1000, Thermo Fisher Scientific, Waltham, MA, USA). The expression levels of photosynthesis-related genes associated with plant circadian rhythms were quantified using real-time quantitative PCR (RT-qPCR). Quantitative primers were designed using the online primer design tool Primer-BLAST (https://www.ncbi.nlm.nih.gov/tools/primer-blast/). Reverse transcription amplification was conducted with a DynaPro Reverse Transcription Kit SynScript® III RT SuperMix for qPCR. The cDNA products obtained from reverse transcription were diluted eightfold and used as templates for qPCR, which was performed with a DynaPro ArtiCanCEO SYBR qPCR Mix on a Bio-Rad CFX96 Real-Time PCR Platform. The amplification program consisted of an initial denaturation at 95 °C for 5 min, followed by 40 cycles of denaturation at 95 °C for 15 s, annealing at 60 °C for 20 s, and extension at 72 °C for 20 s. The specificity of the amplified fragments was verified, and the melting curves were generated (95 °C for 15 s; 65 °C for 1 min; 95 °C with a ramp rate of 0.1 °C/s; and 95 °C for 15 s). Three biological replicates were performed, with BcGAPDH (BraC09g068080) serving as the internal reference gene for normalization. The differences in expression levels were calculated based on the Ct values using the 2 C t method [34], assuming an amplification efficiency of 100%.

2.6. Measurement of Chl and N Contents in Leaves

Celery seedlings were subjected to photoperiods of 3L:3D, 6L:6D, and 24L:0D for 5 days, during which the plants developed 5 leaves. Chl and N contents in the leaves were measured using a Konica Minolta Model 502 Portable Chlorophyll Analyzer (made in Sakawa, Japan). Additional measurements were taken on the 10th day of the seedlings under a 12L:12D cycle. Five biological replicates were performed for all measurements.

2.7. Statistical Analyses

All statistics were calculated using R (4.4.0) software. To determine statistical significance, Spearman’s rank correlation analysis, linear regression analysis, and one-way ANOVA were performed on the data. Data are presented as mean ± standard deviation when reporting experimental values in the text. Values of p < 0.05 were considered statistically significant. For data normalization, we divided all data by their respective maximum values.

2.8. Model Description and Construction

To better understand the molecular mechanism of celery circadian clock regulation, the celery circadian clock model was proposed, which consists of 17 ordinary differential equations and 48 parameters (see Supplementary Material). Equations (S1)–(S8) describe the instantaneous expression of the core components of the circadian clock concerning time. Equation (S9) describes the photosensitive protein in the rhythmic oscillator, which is degraded during the day and accumulates at night. Equations (S10)–(S17) represent the downstream photosynthetic genes of the circadian clock that are directly regulated by CCA1 and PRR9. Hill functions were used to represent transcriptional responses, while translation and degradation responses followed the linear mass action law.

2.9. Numerical Simulation

The open-source software Python 3.11.2 (https://www.python.org/downloads/) was used for the numerical simulations in this paper. In Python, the numerical solution of the ODE is obtained using the classical fourth-order Runge–Kutta method.
In this numerical simulation study, we not only reproduced the experimentally observed circadian expression patterns of photosynthetic genes and photosynthetic parameters but also reproduced the photosynthetic yields under the four photoperiodic conditions used in the experiment. Additionally, we further simulated the photosynthetic yields under four photoperiods not included in the experiment (1L:1D, 1.5L:1.5D, 8L:16D, and 16L:8D), as well as the response of skeleton photoperiod genes to the circadian clock.

3. Results

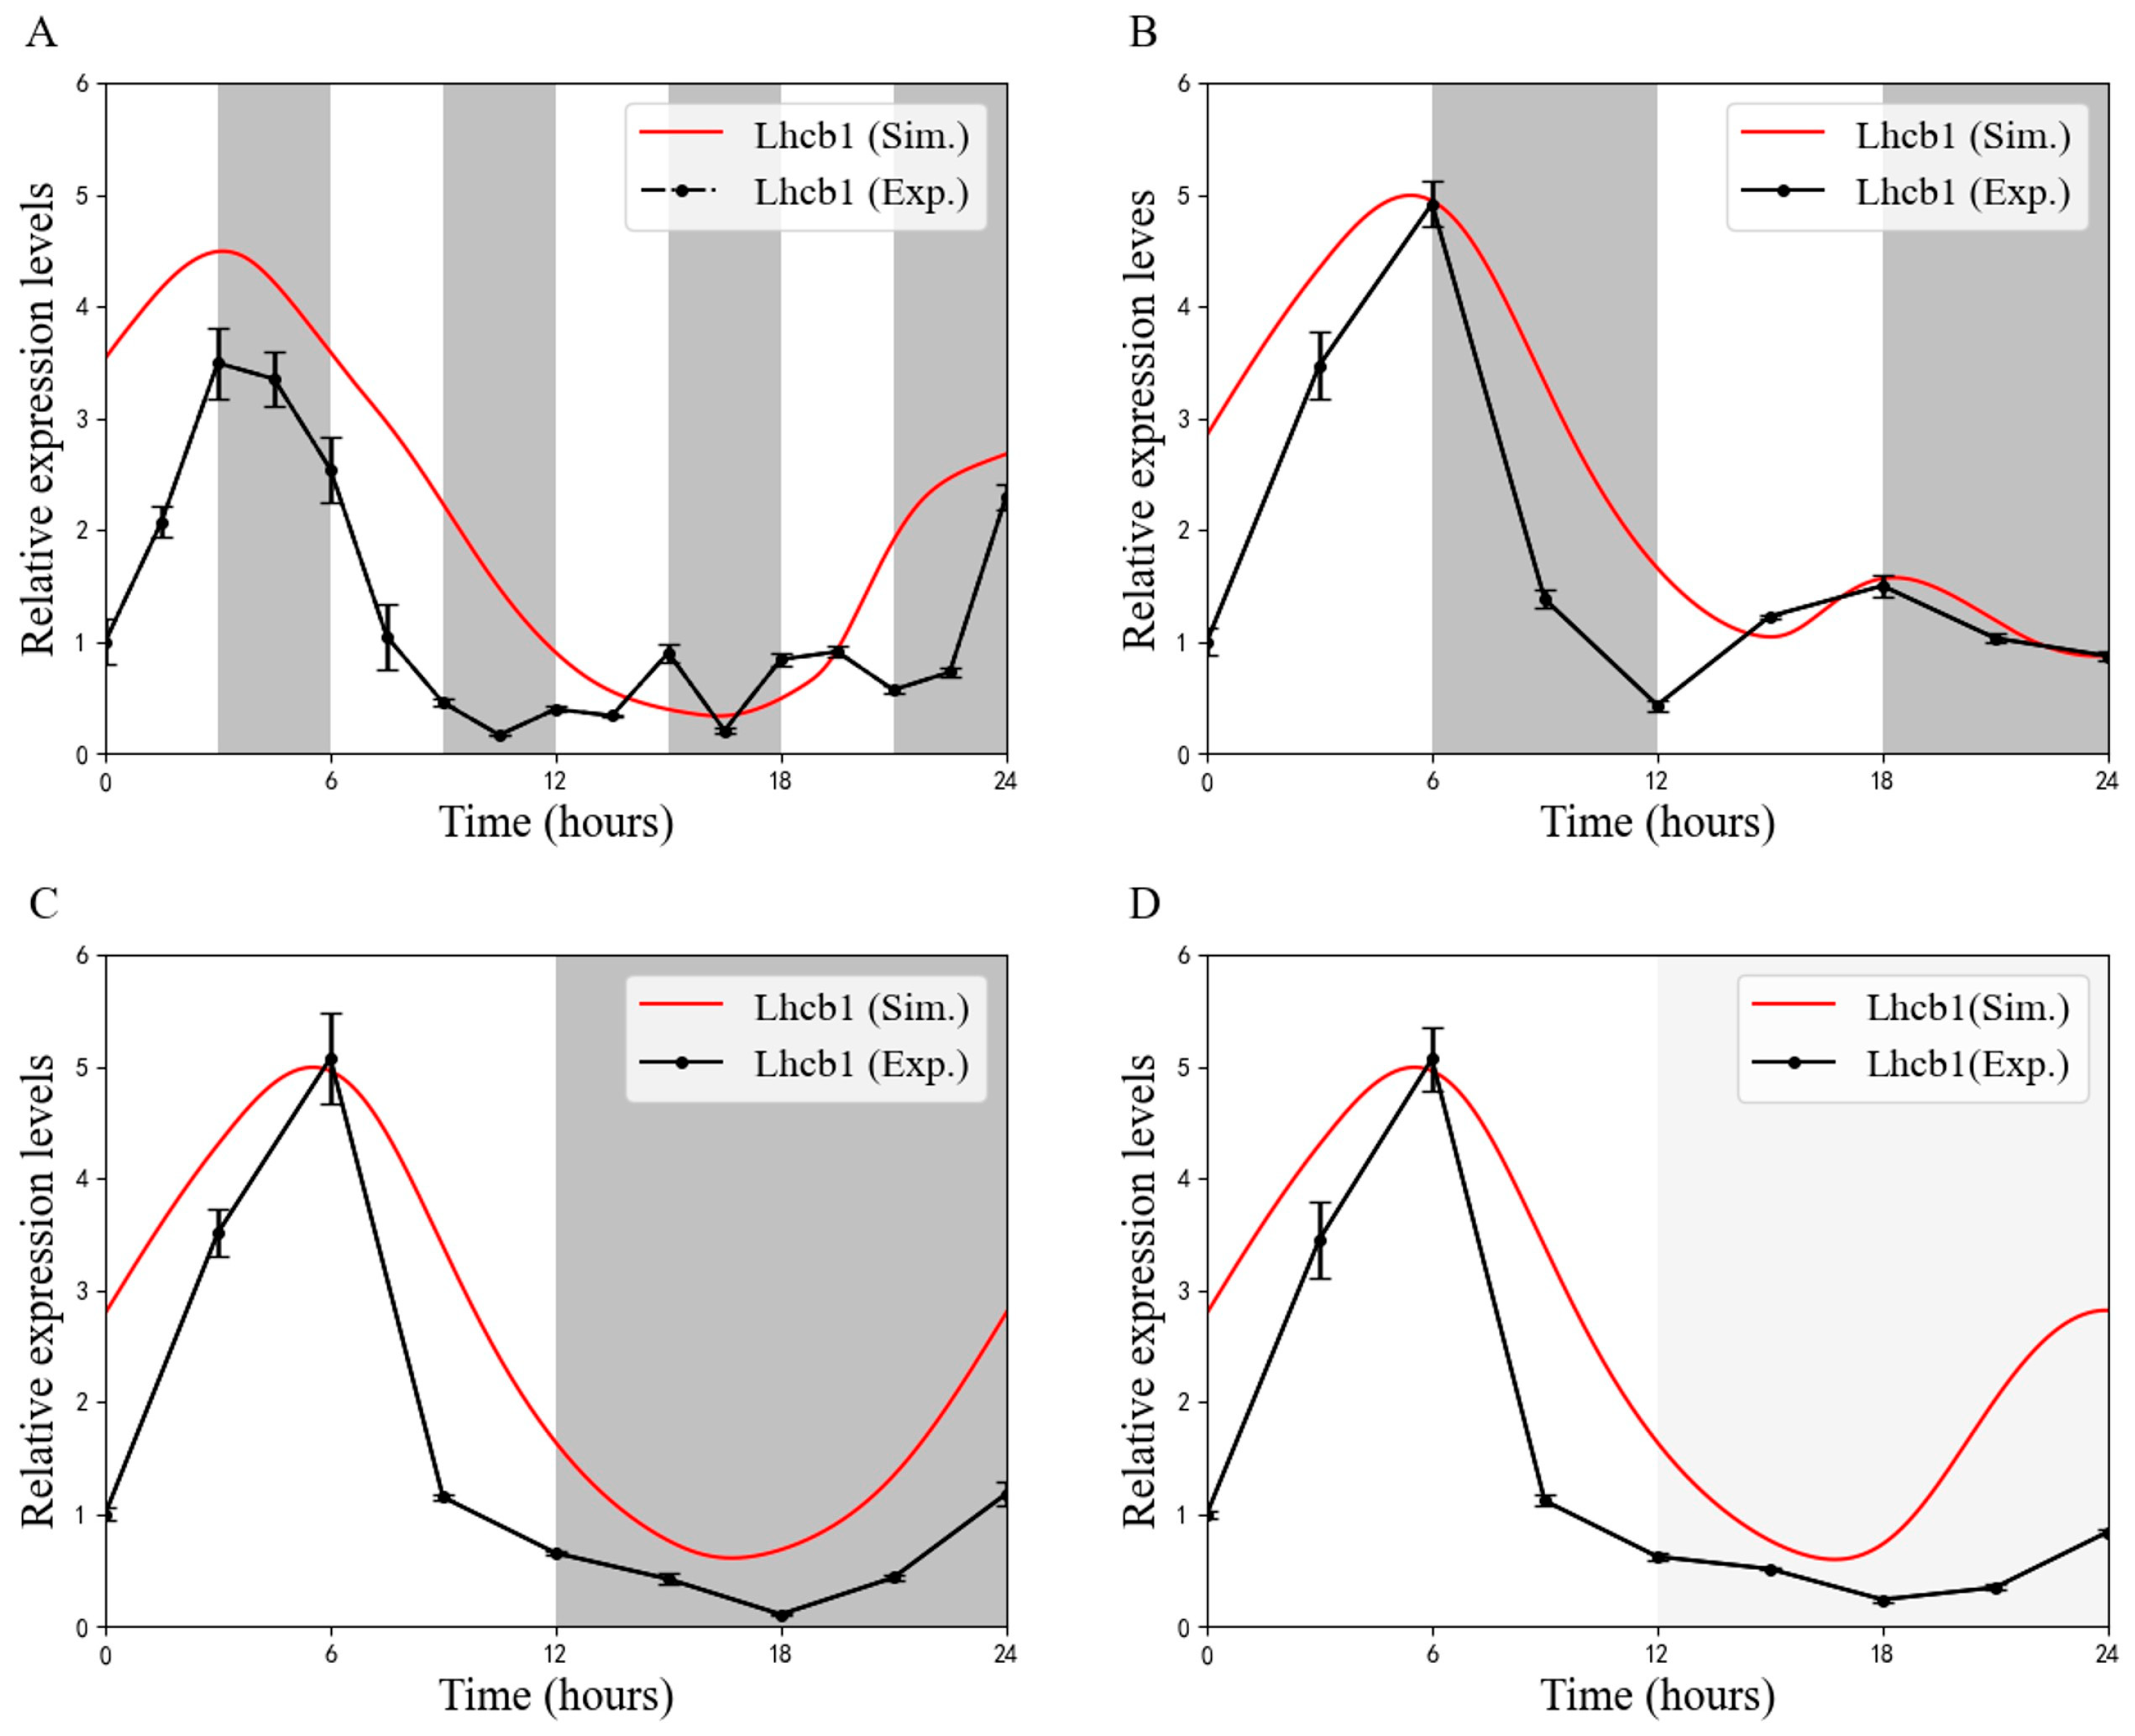
3.1. Circadian Expression of Lhcb1 During the Skeleton Photoperiod

Under a 3 h light/3 h dark (3L:3D) cycle, Lhcb1 expression peaked at dusk and subsequently entered a period of low expression later in the day, characterized by multiple smaller peaks (see Figure 1A). Under a 6 h light/6 h dark (6L:6D) cycle, the expression of Lhcb1 exhibited a peak at dusk, followed by degradation during the night. There was a lower expression, which rose more slowly during the second photoperiod, with a smaller peak at dusk (see Figure 1B). In Figure 1A,B, an interesting phenomenon is observed: two peaks were reached at dusk during the expression of Lhcb1. The second peak is lower than the first, and both peaks appear symmetrically. Surprisingly, the expression pattern of Lhcb1 under LL conditions was very similar to that observed under 12 h light/12 h dark (12L:12D) cycles (see Figure 1C,D). From the results of the experiment, it is evident that the photosynthetic genes consistently exhibit a more robust circadian rhythm under different photoperiods. The dynamics of the simulated Lhcb1 mRNA is consistent with that of the experiment, especially the phase, which indicates that the model has good qualitative adaptability.
The experimental data conclusively establish that skeletal photoperiods (3L:3D and 6L:6D) amplify circadian-driven expression robustness compared to conventional cycles (12L:12D) or continuous light (LL), validating the model’s predictive capacity for circadian-regulated gene dynamics (Figure 1A–D). This phase-consistent synchronization between the experimental and simulated profiles underscores the model’s utility in decoding photoperiodic responses at a molecular resolution.

3.2. Photosynthetic Parameters Have Different Expression Patterns in the Skeleton Photoperiod

In plant photosynthetic systems, four key parameters—the net photosynthetic rate (Pn), the transpiration rate (Tr), intercellular CO2 concentration (Ci), and stomatal conductance (Gs)—serve as critical physiological indicators of photosynthetic efficiency. Among these, Pn represents the net carbon assimilation capacity and exhibits pronounced circadian rhythmicity under skeletal photoperiods [35], making it a primary metric for evaluating circadian-photosynthetic coupling.
To mechanistically decode the regulatory interplay between circadian clocks and photosynthesis, we developed a system of ordinary differential equations (ODEs) integrating transcriptional control by core circadian oscillators (CCA1/LHY [CL] and PRR9/PRR7 [P97]) and light-responsive photosynthetic genes (Lhcb1, psbA, RbcS1, and atpA). The generalized model for photosynthetic parameter dynamics is defined as:
P i = α + C L 2 K i 1 2 + C L 2 + P 97 2 K i 2 2 + P 97 2 + j X j 2 H i j 2 + X j 2 ,
where P i   ( i = 1 ,   2 ,   3 ,   4 ) represents the photosynthetic parameters Pn, Tr, Ci, and Gs, respectively. [CL] and [P97] represent the abundance of CCA1/LHY protein and PRR9/PRR7 protein, and X j (j = 1, 2, 3, 4) denotes the protein abundance of Lhcb1, psbA, RbcS1, and atpA, respectively. α is the basic photosynthetic rate. K i 1 , K i 2 , and H i j   ( i , j = 1 ,   2 ,   3 ,   4 ) denote the activation constants.
The circadian clock has been demonstrated to regulate photosynthetic parameters by controlling the expression of photosynthetic genes in response to photoperiods. As illustrated in Figure 2, under 3L:3D cycles, Pn displays a robust circadian rhythm, reaching its maximum in the evening, decreasing throughout the night, and commencing an upward trend again at dawn (Figure 2A). In contrast to the expression spectrum observed under 3L:3D cycles, two distinct peaks appear under the 6L:6D cycle, with each peak occurring during the day (Figure 2B). Conversely, under 12L:12D, a solitary peak in Pn is evident, manifesting in the morning and subsequently declining to a nadir during the nocturnal hours (Figure 2C). In comparison with the expression patterns of Pn under other photoperiods, the peaks of Pn manifest a more gently sloping profile, with diminished amplitudes and more moderate rhythmic expression under continuous light (LL) conditions (Figure 2D). As demonstrated by the experimental findings, an increase in the duration of light exposure is accompanied by a gradual decline in the frequency of Pn oscillation and an enhancement in the flattening of the peaks. This finding suggests that changes in photoperiods can affect photosynthesis, especially during shorter photoperiods (3L:3D and 6L:6D), where photosynthesis may be greatly affected. As demonstrated by the simulation results, the model effectively captures the variation of Pn in response to photoperiodic changes, reproducing the circadian rhythm of Pn (Figure 2). This result suggests that photosynthesis has a circadian rhythm, which is consistent with previous studies [36,37]. Furthermore, enhancing photosynthesis’s circadian rhythm may improve the organisms’ survival and competitive advantage [37].
Experimentally, it was observed that Tr also exhibits a robust circadian rhythm and displays distinct expression profiles under different photoperiods (see Supplementary Figure S1). A notable finding was that Tr exhibited a lower expression level at dawn, a characteristic that persisted across different cycles. This pattern suggests that plants reduce respiration at night, thereby decreasing biomass consumption and promoting sugar storage. The results of the simulation show that the model effectively simulates the characteristic of higher Tr in celery during the evening or just before dusk. Additionally, we observed that Tr fluctuated more gently under LL conditions compared to Pn (see Figure 2 and Figure S1).

3.3. Skeletal Photoperiod Can Increase Intracellular Chl and N Contents

Research has indicated that the presence of adequate levels of chlorophyll and nitrogen in the medium can substantially augment the photosynthetic rate and encourage plant growth [38,39]. Conversely, insufficient levels of these nutrients have been demonstrated to reduce the efficiency of utilization and exert a negative impact on plant growth and development. Our experimental findings demonstrate that, under conditions of a light/dark cycle, there was a gradual decline in the average contents of Chl and N as the cycle length increased. Compared to the 12L:12D photoperiod, the average contents of both Chl and N were significantly higher under LL conditions, although they remained lower than those observed under the 3L:3D cycle conditions. Specifically, chlorophyll and N contents increased by 32% and 22%, respectively, under the 3L:3D cycle compared to the 12L:12D cycle, while the Chl content increased by 1% and the N content increased by 5% compared to continuous light (see Table 1). This finding indicates that, while continuous light has been shown to enhance chlorophyll and nitrogen contents, it is imperative to consider energy consumption. Indeed, the energy consumption of continuous light is almost double that of the 3L:3D cycle. Consequently, when taking into account both energy consumption and yield, the 3L:3D photoperiod emerges as the more favorable option for agricultural production, achieving the dual objectives of low energy consumption and high yield.

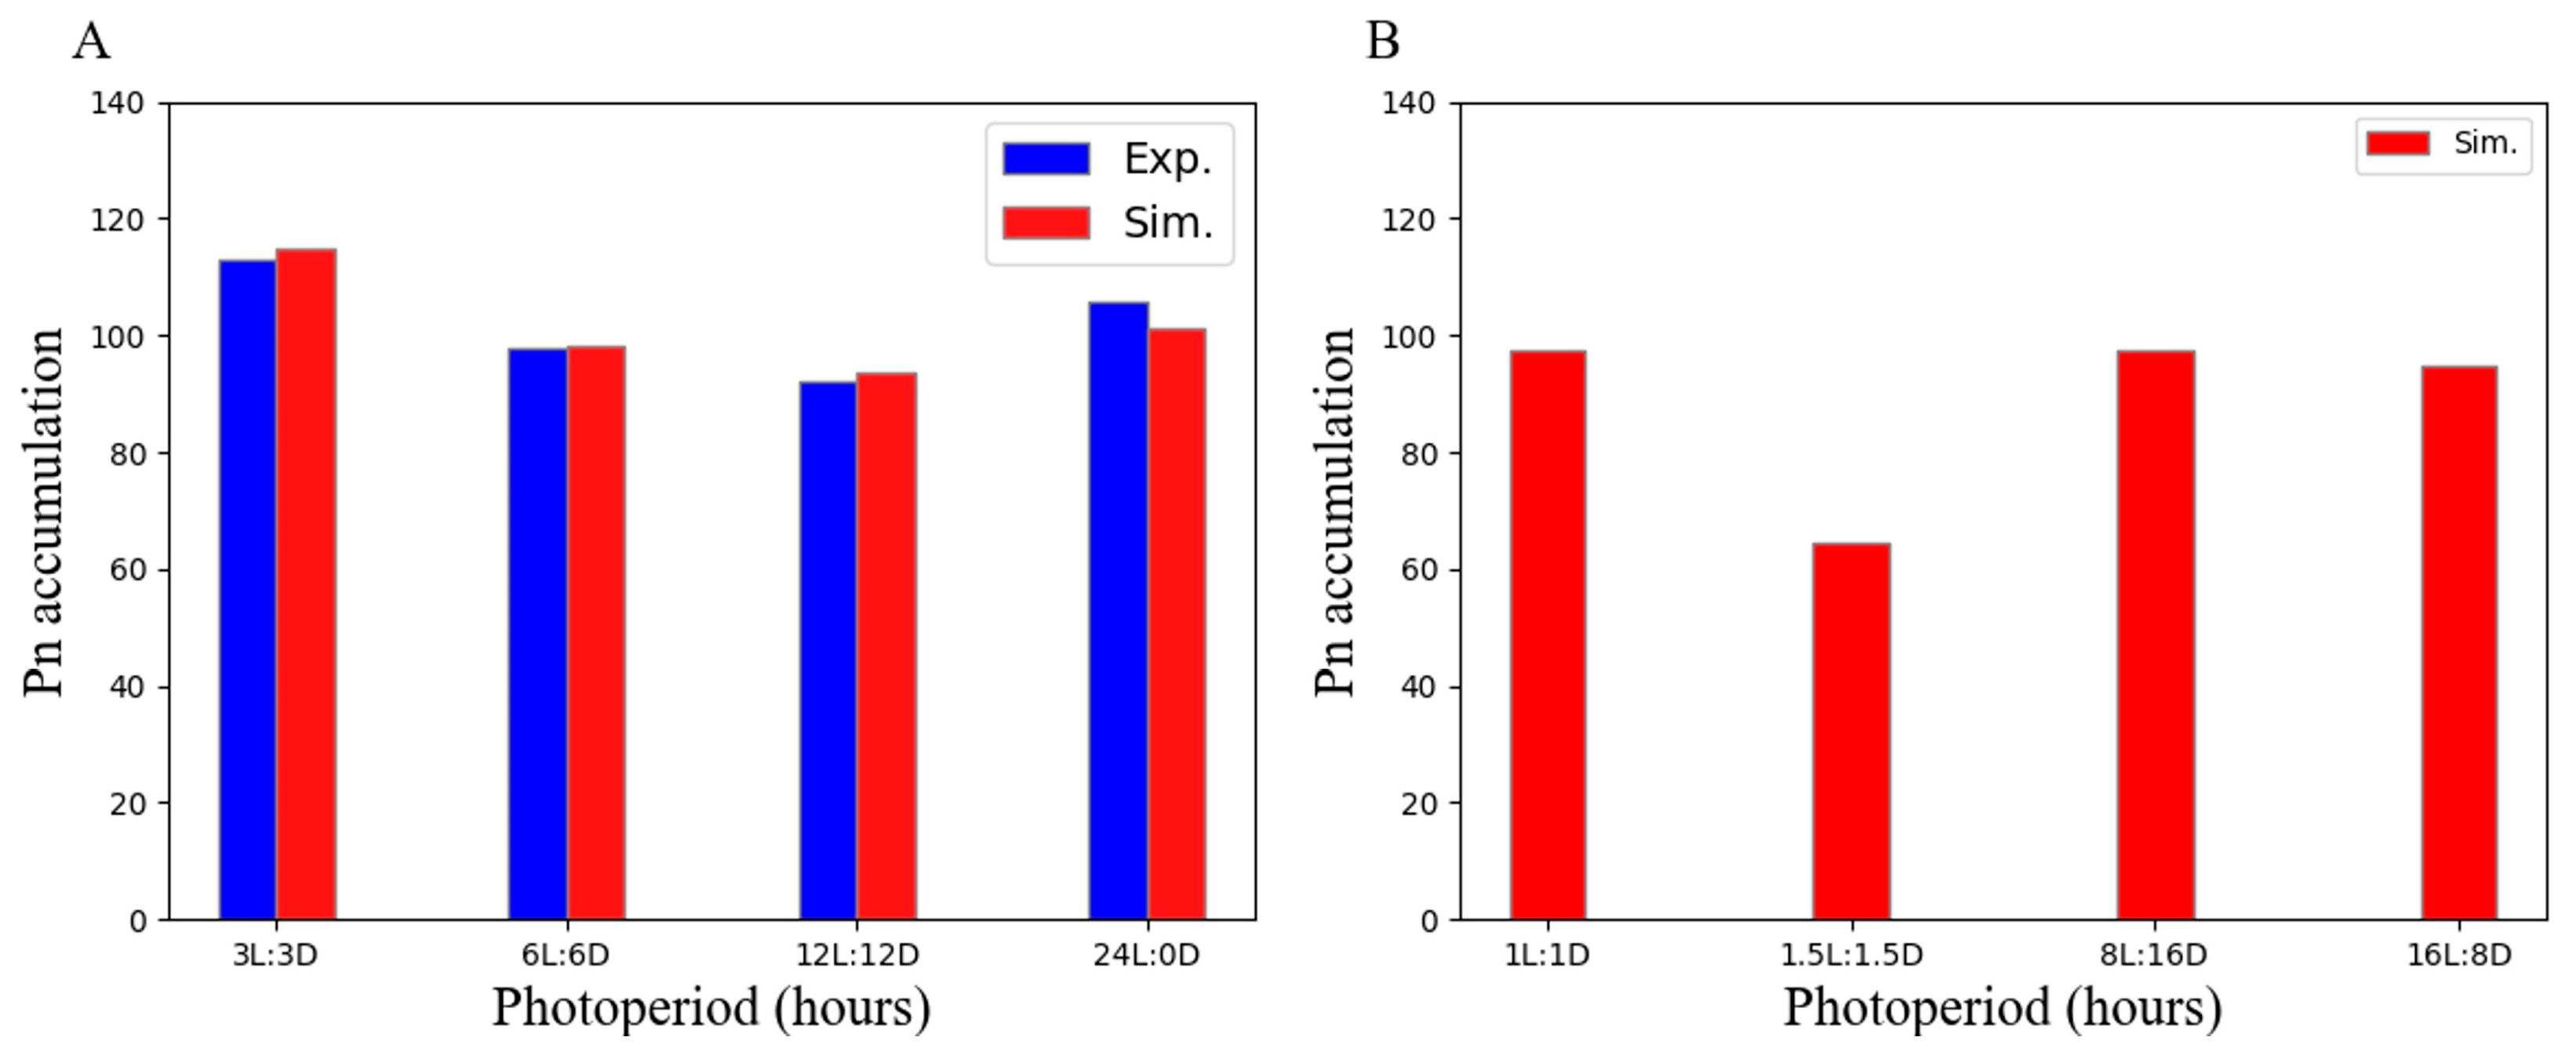
3.4. Skeletal Photoperiod Enhances Pn Accumulation

In order to investigate the effect of photoperiods on photosynthesis, the cumulative amount of Pn was calculated by integrating the curve of Pn in order to represent the photosynthetic yield. As demonstrated in Supplementary Figure S2, the area enclosed by the Pn curve and the axes is indicative of the cumulative amount.
Calculations indicate that under light/dark cycling conditions, the accumulation of Pn gradually decreased with increasing photoperiods (see Figure 3A). It is noteworthy that under LL conditions, the accumulation of Pn did not decrease with the extension of the photoperiod; instead, it increased but was still lower than that observed under 3L:3D cycling conditions. This result suggests that the 3L:3D photoperiod is more conducive to the production of photosynthetic products. The accumulation of Pn under the four photoperiods was modeled by an integrating curve (1) over the interval [0, 24] (see red bars in Figure 3A). The simulated results were found to be in close agreement with the experimentally measured accumulation of Pn.
To conduct a comprehensive investigation into the effect of photoperiods on photosynthetic yield and identify the optimal photoperiod conditions for celery growth, a numerical simulation was performed. This simulation involved the accumulation of Pn under four different photoperiods: 1L:1D, 1.5L:1.5D, 8L:16D, and 16L:8D. The results demonstrate that, except for the significantly lower Pn accumulation observed under the 1.5L:1.5D photoperiod, Pn accumulation under the other three photoperiods was comparable to that observed under the 6L:6D photoperiod (see Figure 3B). Using a combination of experimental data with numerical simulation analysis, we found that Pn accumulation reached the highest value under the 3L:3D photoperiod, indicating that this photoperiod is optimal for the photosynthesis and growth of celery. Furthermore, the trend in the accumulation of Tr was found to be analogous to that of Pn. A further detailed discussion of Tr is not provided here.

3.5. Skeleton Photoperiod Can Sustain High Photosynthetic Yields

We measured the amount of photosynthetic products every three hours under different photoperiodic conditions to investigate the effects of different photoperiods on photosynthesis. Our experimental findings demonstrate a gradual increase in the number of photosynthetic products over time. However, the growth process was characterized by distinct phases, as illustrated in Figure 4A. During the first half of the day, despite the different photoperiod conditions, the differences in photosynthetic yield among the photoperiods were not significant, and the overall growth trend remained relatively consistent. Nevertheless, as the experiment progressed into the second half of the day, a marked divergence in photosynthetic yield became apparent, characterized by a decline in the growth rate to different extents (see Figure 4B). Notably, the growth rate under the 3L:3D condition was significantly below that of the other conditions, followed by the growth rate under continuous light; however, there remained a substantial gap compared to the growth rate under the 3L:3D condition. This finding indicates that the 3L:3D photoperiod is more conducive to photosynthesis in plants and suggests that the plant’s response to photoperiod begins in the second half of the day. Further experimental data demonstrate a significant negative correlation between photosynthetic yield and photoperiod length at 21 and 24 h.

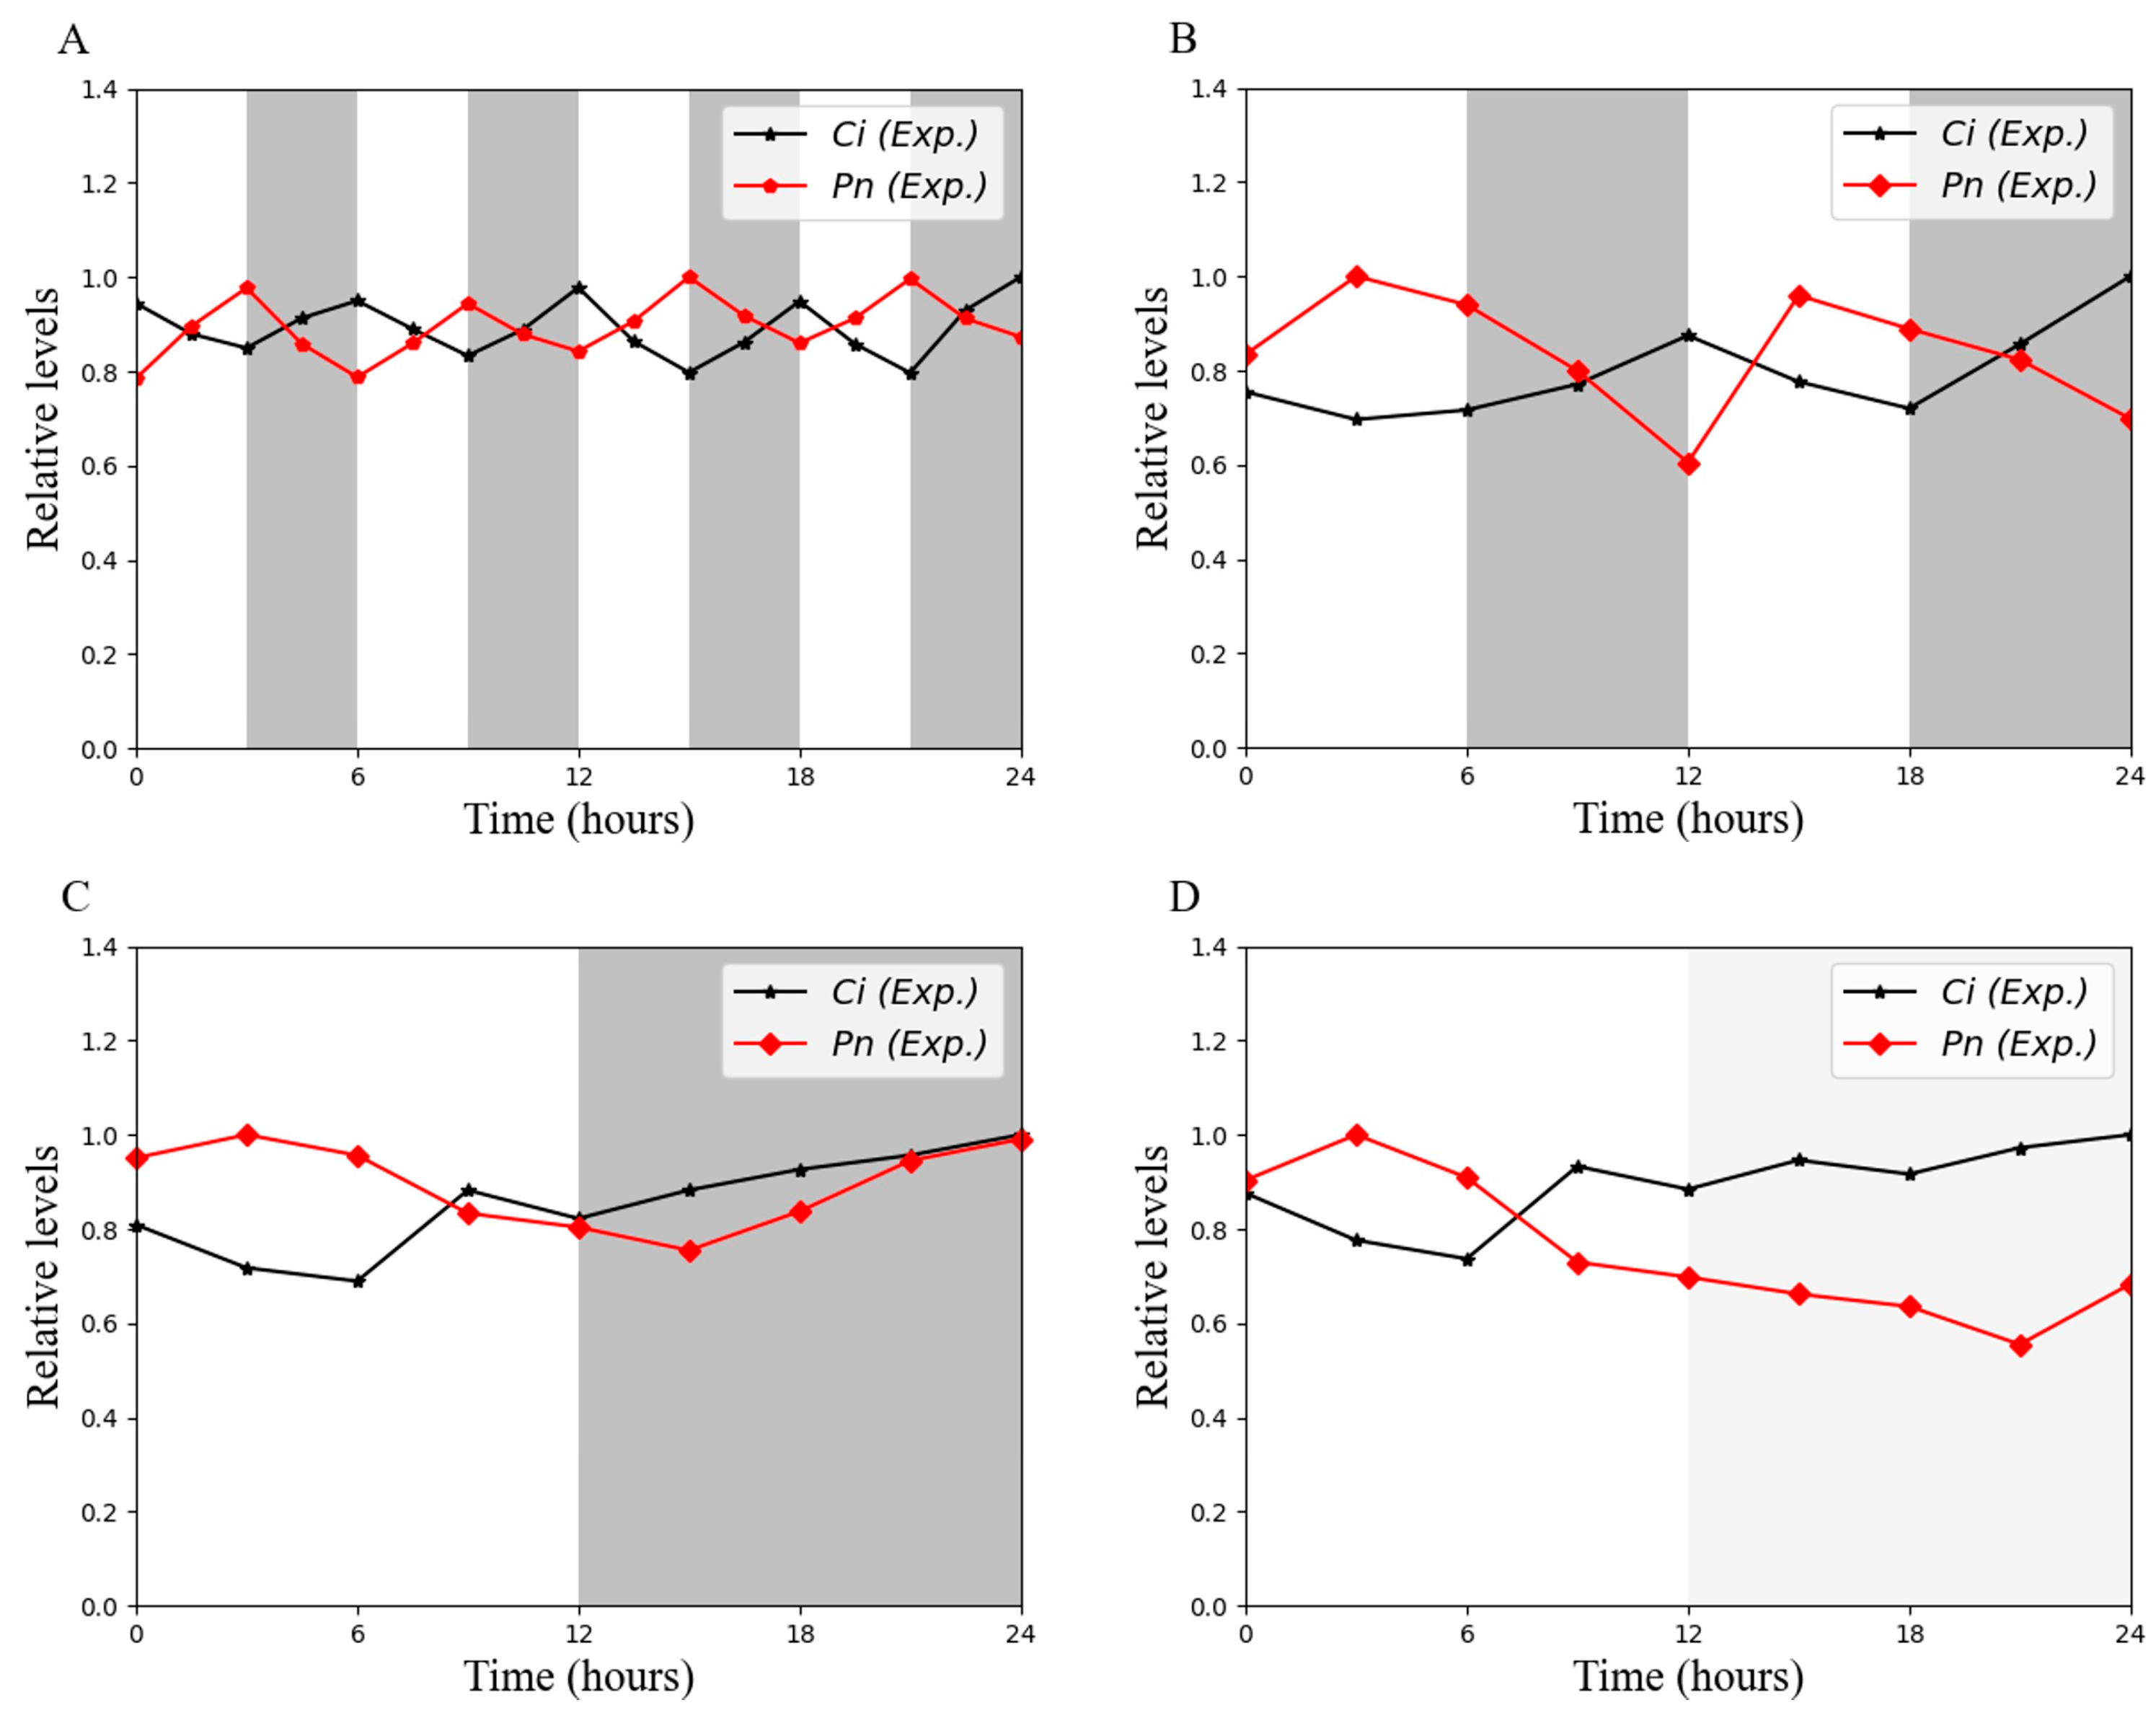
3.6. Effect of Ci on Photosynthesis Under Skeleton Photoperiod

C O 2 is the primary substrate for photosynthesis in plants, and its concentration directly affects the accumulation of organic matter during the process of photosynthetic carbon fixation. The enhancement of Ci signifies an augmentation in plant respiration, leading to an acceleration in the consumption of organic matter and a concomitant decrease in Pn. The data presented in Figure 5 show that, under light–dark cycles, Ci is at its lowest during dusk and reaches its maximum at dawn, while Pn exhibits the opposite pattern. Concurrently, Ci and Pn demonstrated robust circadian rhythms under both 3L:3D and 6L:6D cycles (see Figure 5A,B). Under 12L:12D cycle conditions, Ci exhibited a low concentration during the day and increased at night. This phenomenon can be attributed to the plant’s self-protective mechanisms, which are activated during periods of high light intensity. These mechanisms involve the closure of stomata, which are the small openings on the leaves that allow gas exchange. This results in a decrease in respiration, leading to a reduction in the consumption of organic matter for respiration. Consequently, this increases Pn (see Figure 5C). In the LL condition, Ci and Pn exhibited expression patterns analogous to those observed in light and dark conditions during the initial phase of the day, a phenomenon attributed to the memory function of the circadian clock. However, under constant light conditions in the second half of the day, respiration remains consistent, and the level of organic matter consumed remains constant, resulting in Pn maintaining a flat and low abundance (see Figure 5D).
To conduct a thorough investigation into the negative correlation between the net photosynthetic rate (Pn) and intercellular C O 2 concentration (Ci), two statistical methods were utilized. Specifically, we employed Spearman’s rank correlation coefficient and linear regression analysis. The results of the analysis show that there were significant differences in the degree of negative correlation between Pn and Ci under various photoperiodic conditions. Notably, the 3L:3D cycle exhibited the strongest negative correlation ( r = 0.87 ,   P = 7.3 × 10 6 < 0.05 ), followed by the continuous light (LL) condition, which demonstrated a weaker correlation ( r = 0.78 ,   P = 0.01 < 0.05 ), despite the fact that plants continued to photosynthesize under continuous light. In contrast, the 12 h light/12 h dark (12L:12D) cycle showed the weakest negative correlation ( r = 0.22 ,   P = 0.58 > 0.05 ) , which did not reach statistical significance (see Supplemental Figure S3). The findings indicate the existence of three key points: firstly, a significant negative correlation between Pn and Ci does exist; secondly, the strength of this correlation is regulated by photoperiods, which is shown to diminish with increasing photoperiod duration (from 3L:3D to 12L:12D); and thirdly, continuous light conditions do not yield the strongest negative correlation, suggesting that a moderate alternation of light and darkness may be more beneficial for maintaining plant photosynthesis and stomatal conductance. This finding provides a novel experimental foundation for a more profound understanding of the interactions between plant photosynthesis and environmental factors.

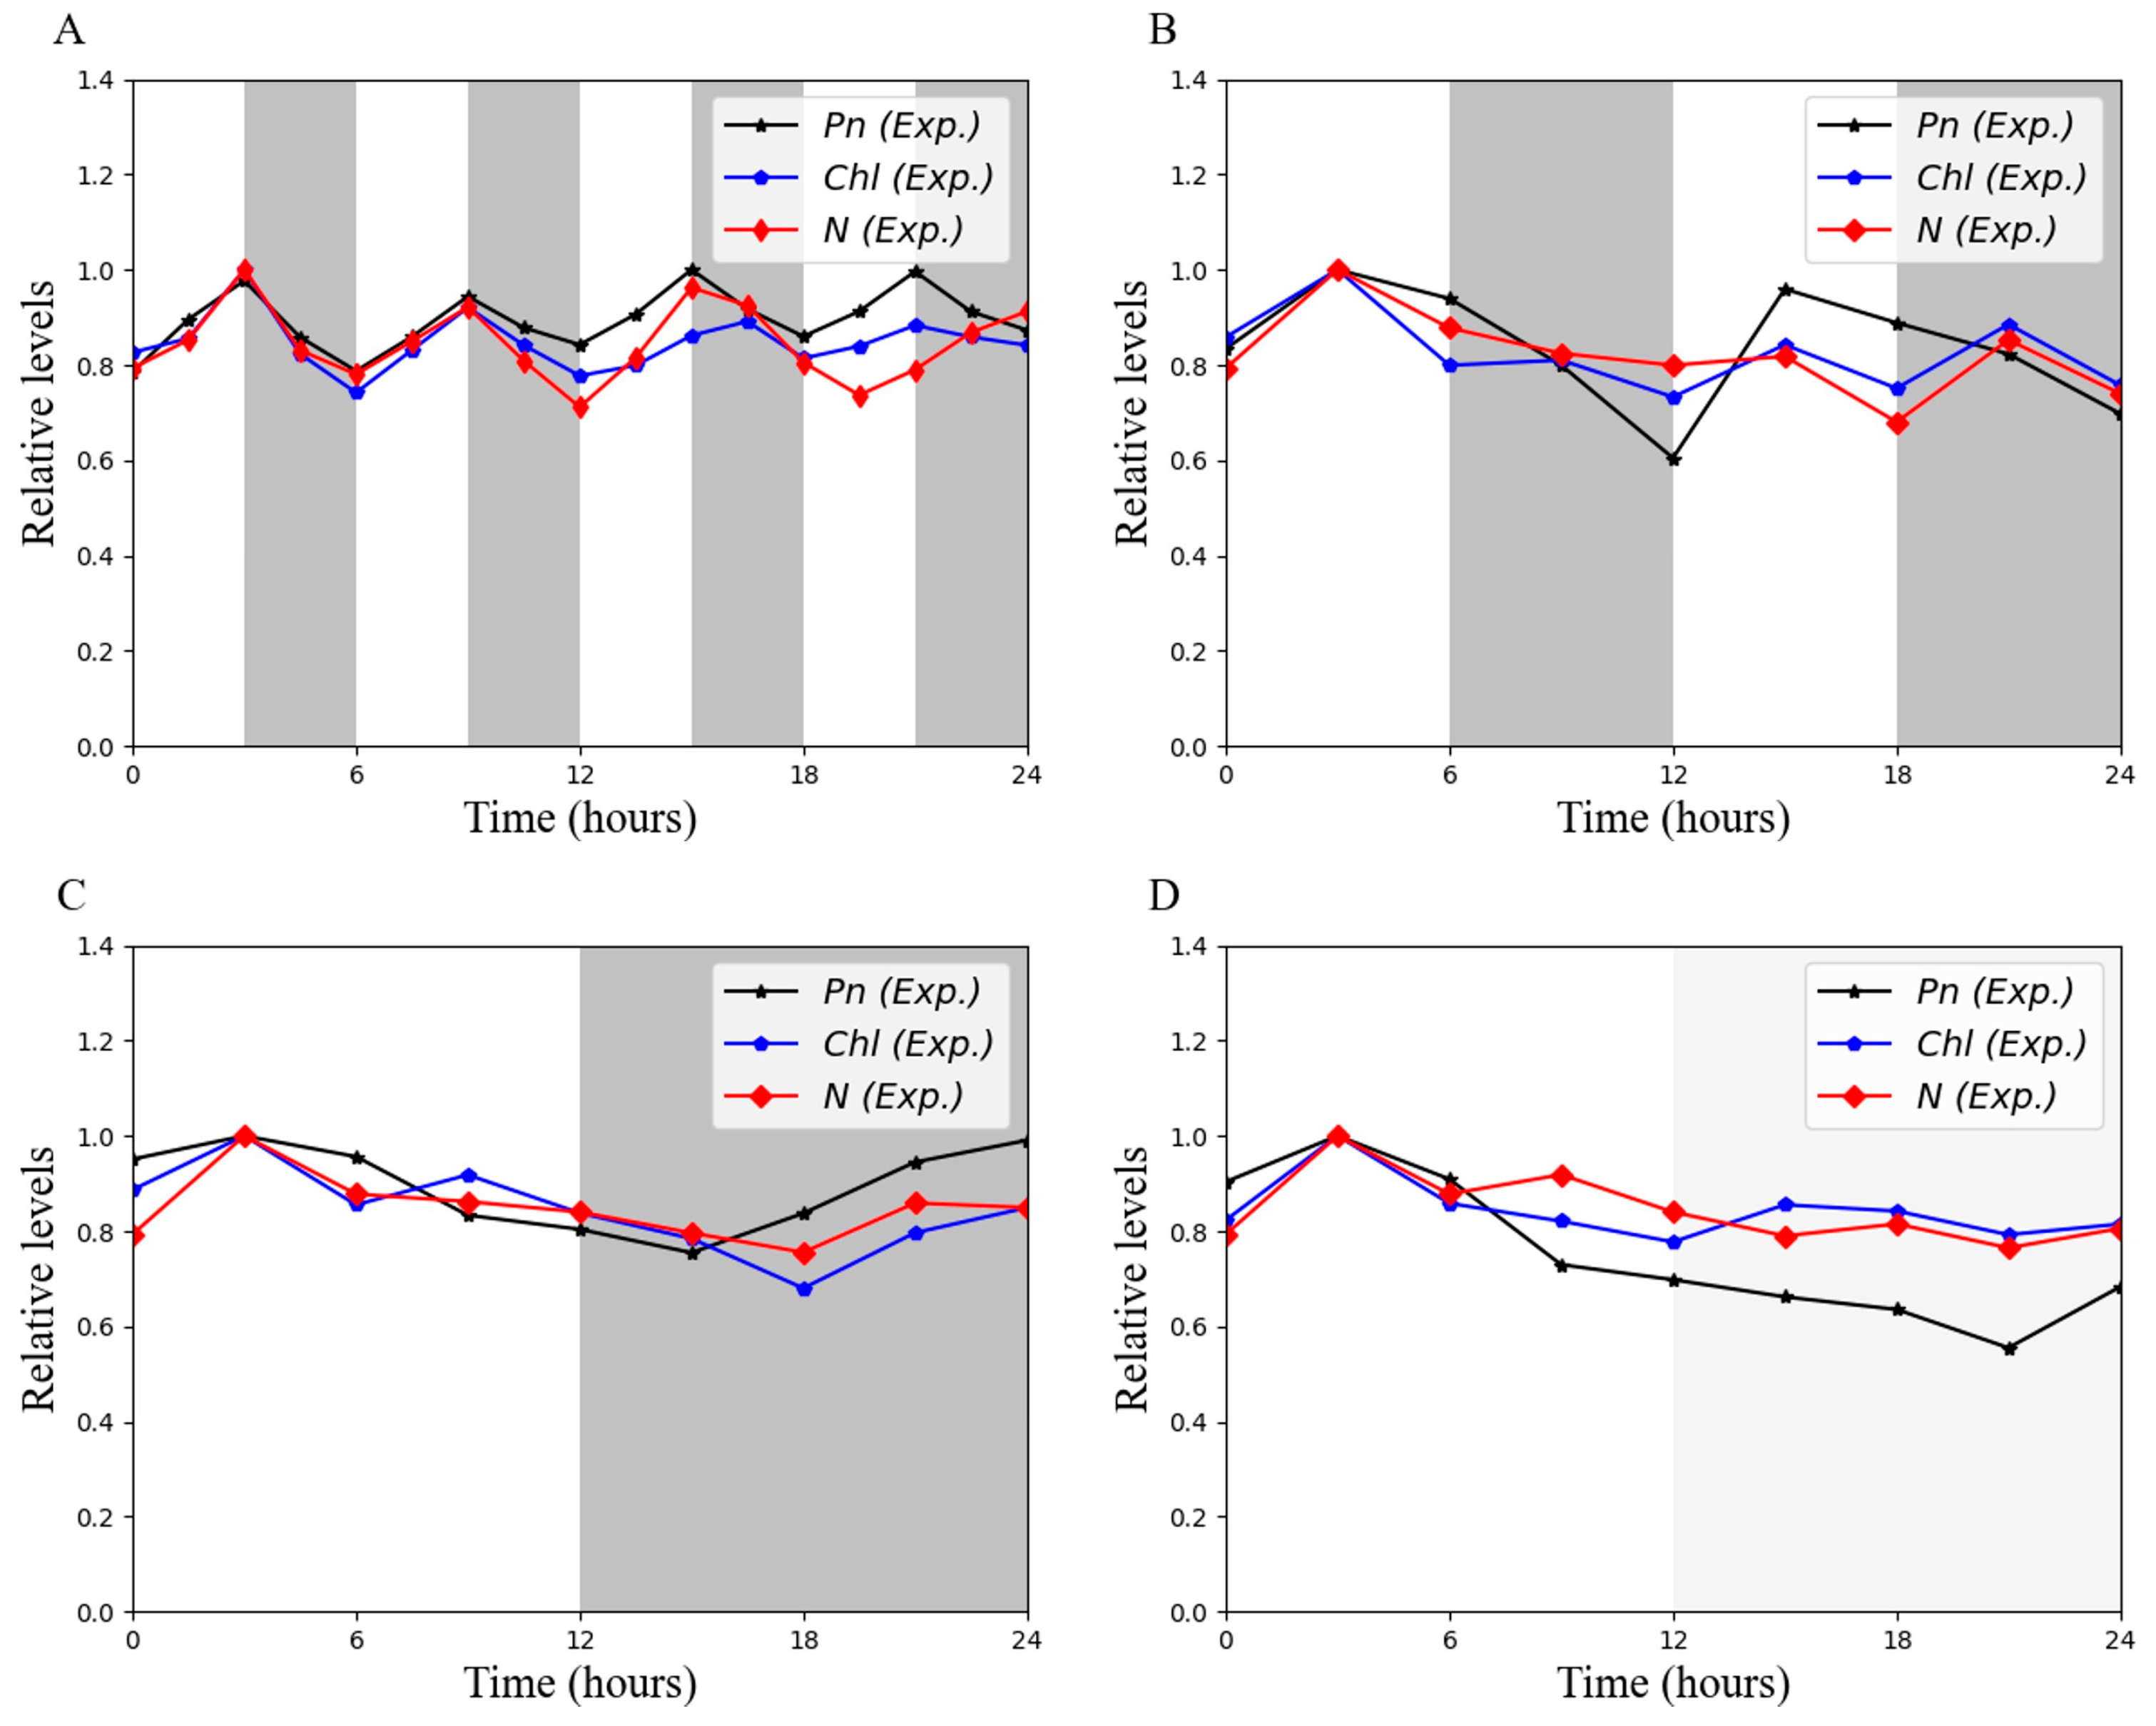
3.7. Chl and N Collectively Influence the Rate of Photosynthesis

Chlorophyll, a pivotal molecule in the process of photosynthesis, is responsible for capturing light energy in plants and facilitating the conversion of carbon dioxide and water into organic compounds. As illustrated in Figure 6, the trends of Pn under varying photoperiods exhibit a notable similarity to those of Chl and N. A particularly salient finding is that, in the context of a 3L:3D skeletal photoperiod, Chl and N are found to be under the regulation of the circadian clock. This photoperiod is observed to manifest significant circadian rhythmicity, with both parameters contributing collectively to the process of photosynthesis. Pn was significantly and strongly positively correlated with Chl ( r = 0.73 ,   P = 0.001 ) and moderately positively correlated with N ( r = 0.56 ,   P = 0.02 ). Under the 6L:6D photoperiod, both Chl and N exhibited a triple-peak pattern, with peaks occurring at similar times. This resulted in a weakened correlation with Pn. Specifically, Pn was strongly positively correlated with Chl, although this correlation was not statistically significant ( r = 0.65 ,   P = 0.06 ). In contrast, Pn showed a moderate correlation with N, which was also not statistically significant ( r = 0.45 ,   P = 0.20 ). Under the natural photoperiod (12L:12D), Chl showed a bimodal pattern, while N had an unimodal pattern. Pn was moderately correlated with both Chl ( r = 0.65 ,   P = 0.19 ) and N ( r = 0.56 ,   P = 0.12 ). However, neither correlation reached statistical significance. The circadian rhythmicity of Chl and N was significantly diminished compared to the 3L:3D photoperiod under continuous light (LL) conditions. The parameter pn exhibited a strong positive correlation with Chl ( r = 0.69 ,   P = 0.04 ) and N ( r = 0.68 ,   P = 0.04 ). All values are normalized to their respective maximum. This suggests that Pn is influenced not only by Chl and N but also by the photoperiod.

3.8. Circadian Rhythms in Photosynthetic Yield

As demonstrated in Supplementary Figure S2, the photoperiodic conditions significantly influenced the distinct expression patterns of Pn, with its oscillation frequency gradually weakening as the photoperiod extended. The established calculation method for photosynthetic yield demonstrates that fluctuations directly influence the level of photosynthetic yield in Pn. Consequently, it can be deduced that the rhythmic expression of photosynthetic yield is predominantly governed by variations in Pn. The figure indicates that photosynthetic yield fluctuates in synchrony with the rhythmic alterations of Pn, and the frequency of these fluctuations similarly decreases with an increase in photoperiod duration. It is noteworthy that the circadian rhythm of yield is most prominently observed under conditions of an abnormal light/dark cycle.

4. Model

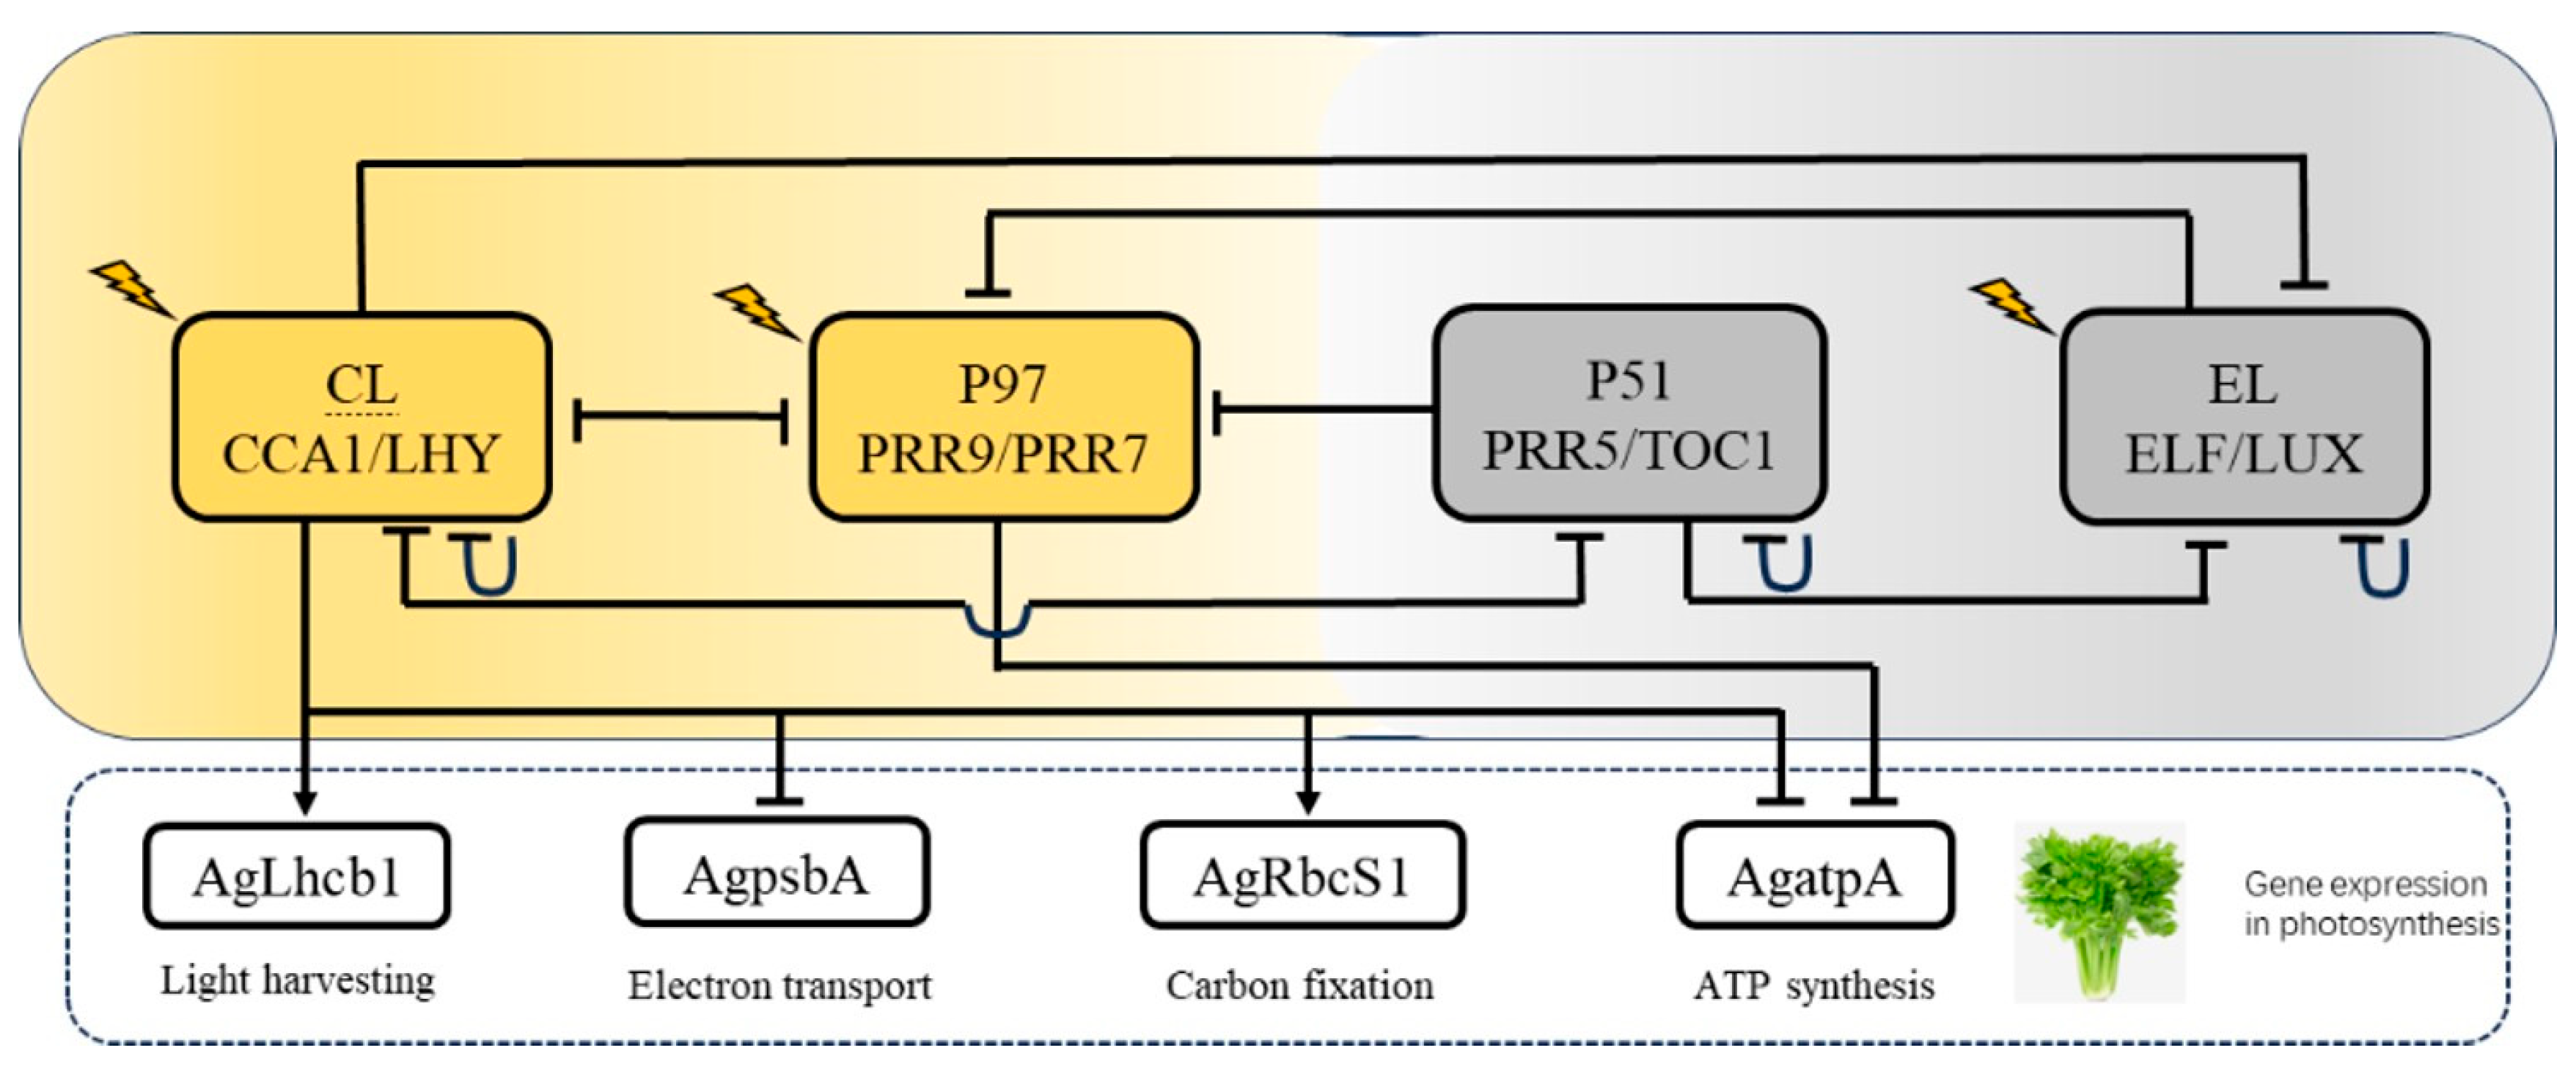
4.1. Biological Implications of Model Components

In this model, Equations (S1)–(S8) describe the dynamics of transcript levels and protein abundance in the core circadian clock components CL (CCA1 and LHY), P97 (PRR9 and PRR7), P51 (PRR5 and TOC1), and EL (ELF4 and LUX). Collectively, these equations form the core regulatory network of the circadian clock. Equation S9 describes the proportion of photosensitive proteins that are activated, and it was proposed by Greenwood et al. [40] to characterize the role of light signaling in regulating circadian rhythms. Furthermore, the model encompasses eight additional equations (see Equations (S10)–(S17) in the Supplemental Material) that characterize the expression levels of photosynthetic genes involved in photosynthesis and the abundance of their corresponding proteins. Specifically, Equation S10 describes the transcription of Lhcb1 mRNA in Arabidopsis, which is promoted by the CCA1 protein [41]. The transcription of the other three photosynthetic genes (psbA, RbcS1, and atpA) also relies on CCA1 expression; however, their modulation patterns differ. psbA and atpA are repressed by CCA1, while CCA1 activates RbcS1. These genes were modeled analogously to Lhcb1 based on the regulatory mechanisms of CCA1 expression. The comprehensive mathematical model of the circadian clock is elaborated in the Supplemental Material, which integrates the interactions between core circadian clock genes and photosynthetic genes, thereby providing a theoretical framework for understanding the interconnected mechanisms of plant circadian rhythms and photosynthesis.

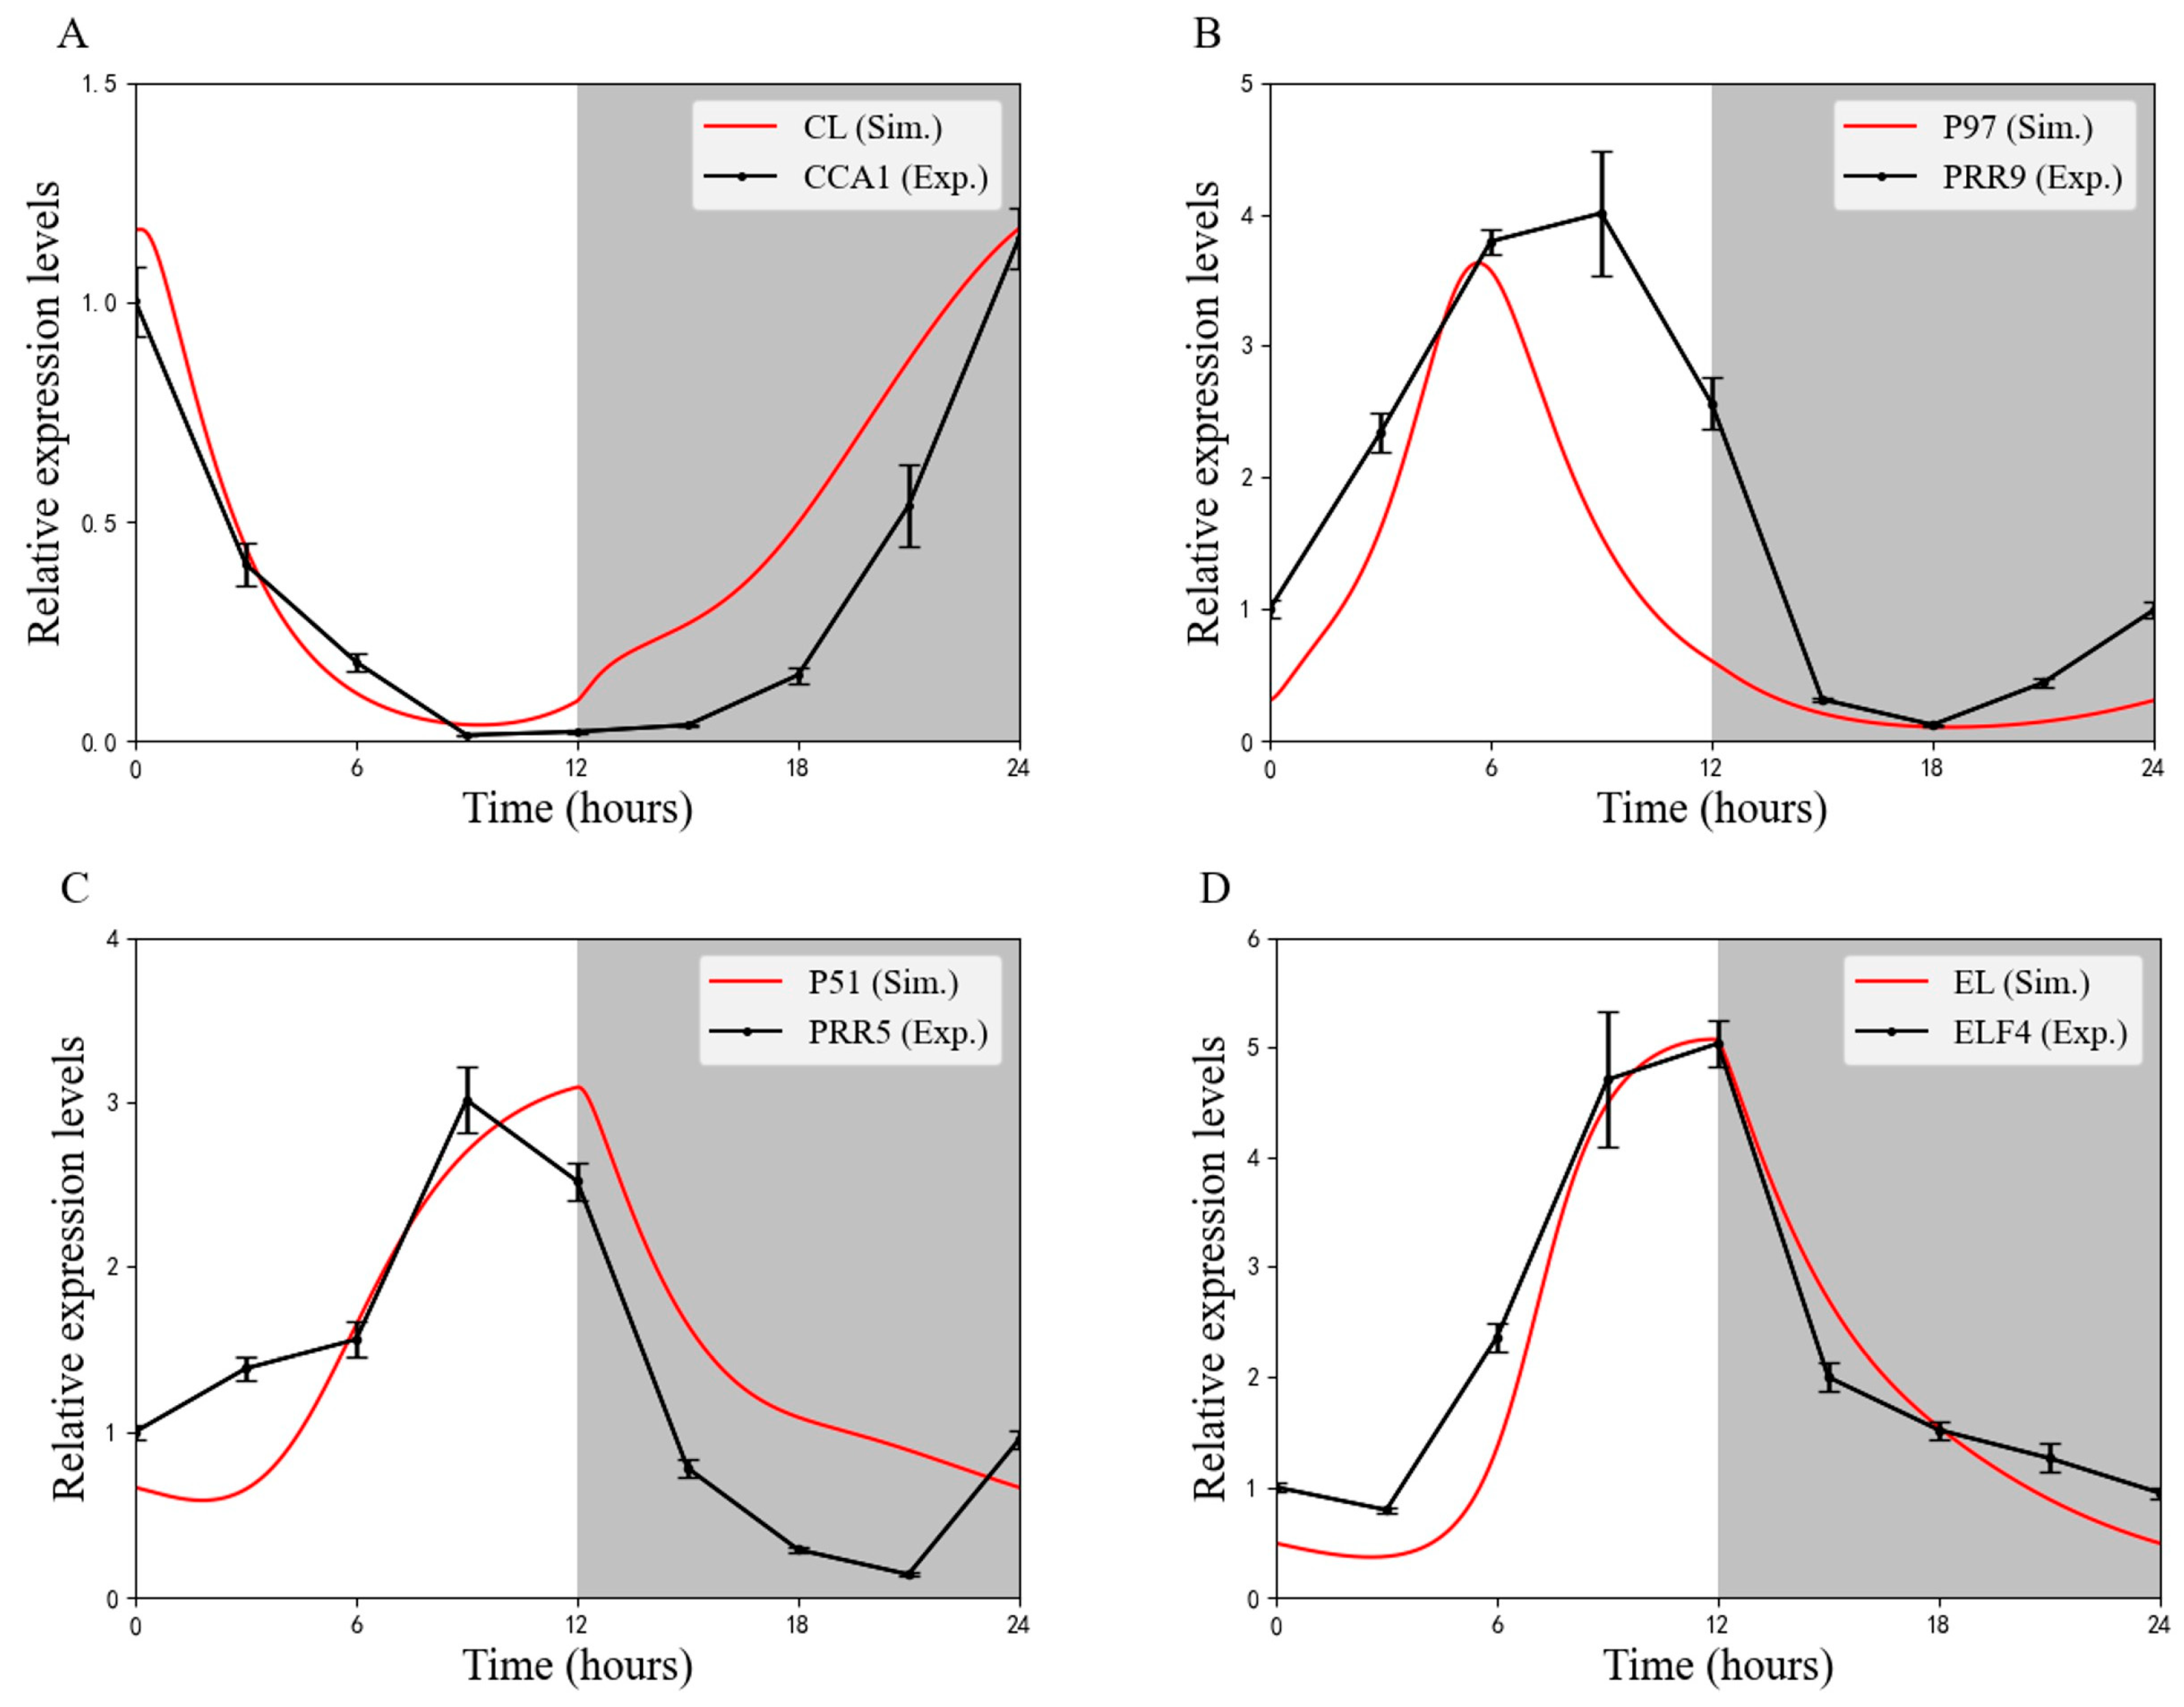
4.2. Parameter Estimation of the Model

To better understand the molecular mechanisms and biological significance of the regulatory network of the core components of the celery circadian clock, experimental data under 12L:12D cycles were used to fit the parameters. The mRNAs of the circadian clock components were fitted to the experimental dataset, and the estimated parameters were optimized by the classical annealing algorithm that minimizes the cost function e, which is shown below:
e = i = 1 N C L m * i C L m i 2 N × m a x C L m * i + i = 1 N P 97 m * i P 97 m i 2 N × m a x P 97 m * i + i = 1 N P 51 m * i P 51 m i 2 N × m a x ( P 51 m * i ) + i = 1 N E L m * i E L m i 2 N × m a x ( E L m * i )
where the superscript * denotes the reference profiles, the subscript m represents the mRNA, the notation “max” indicates the maximum value of the reference profiles, and N ” denotes the total simulation time points. Using the estimated parameter values and through numerical simulation, our model exhibits the dynamics characteristic of the circadian clock and reproduces more intuitively the expression pattern of the biological clock (see Figure 7). Under the 12L:12D cycling condition, the dynamic behavior of the simulated biological clock closely matches the experimental expression profile, which also indicates that the cost function we constructed is reasonable.

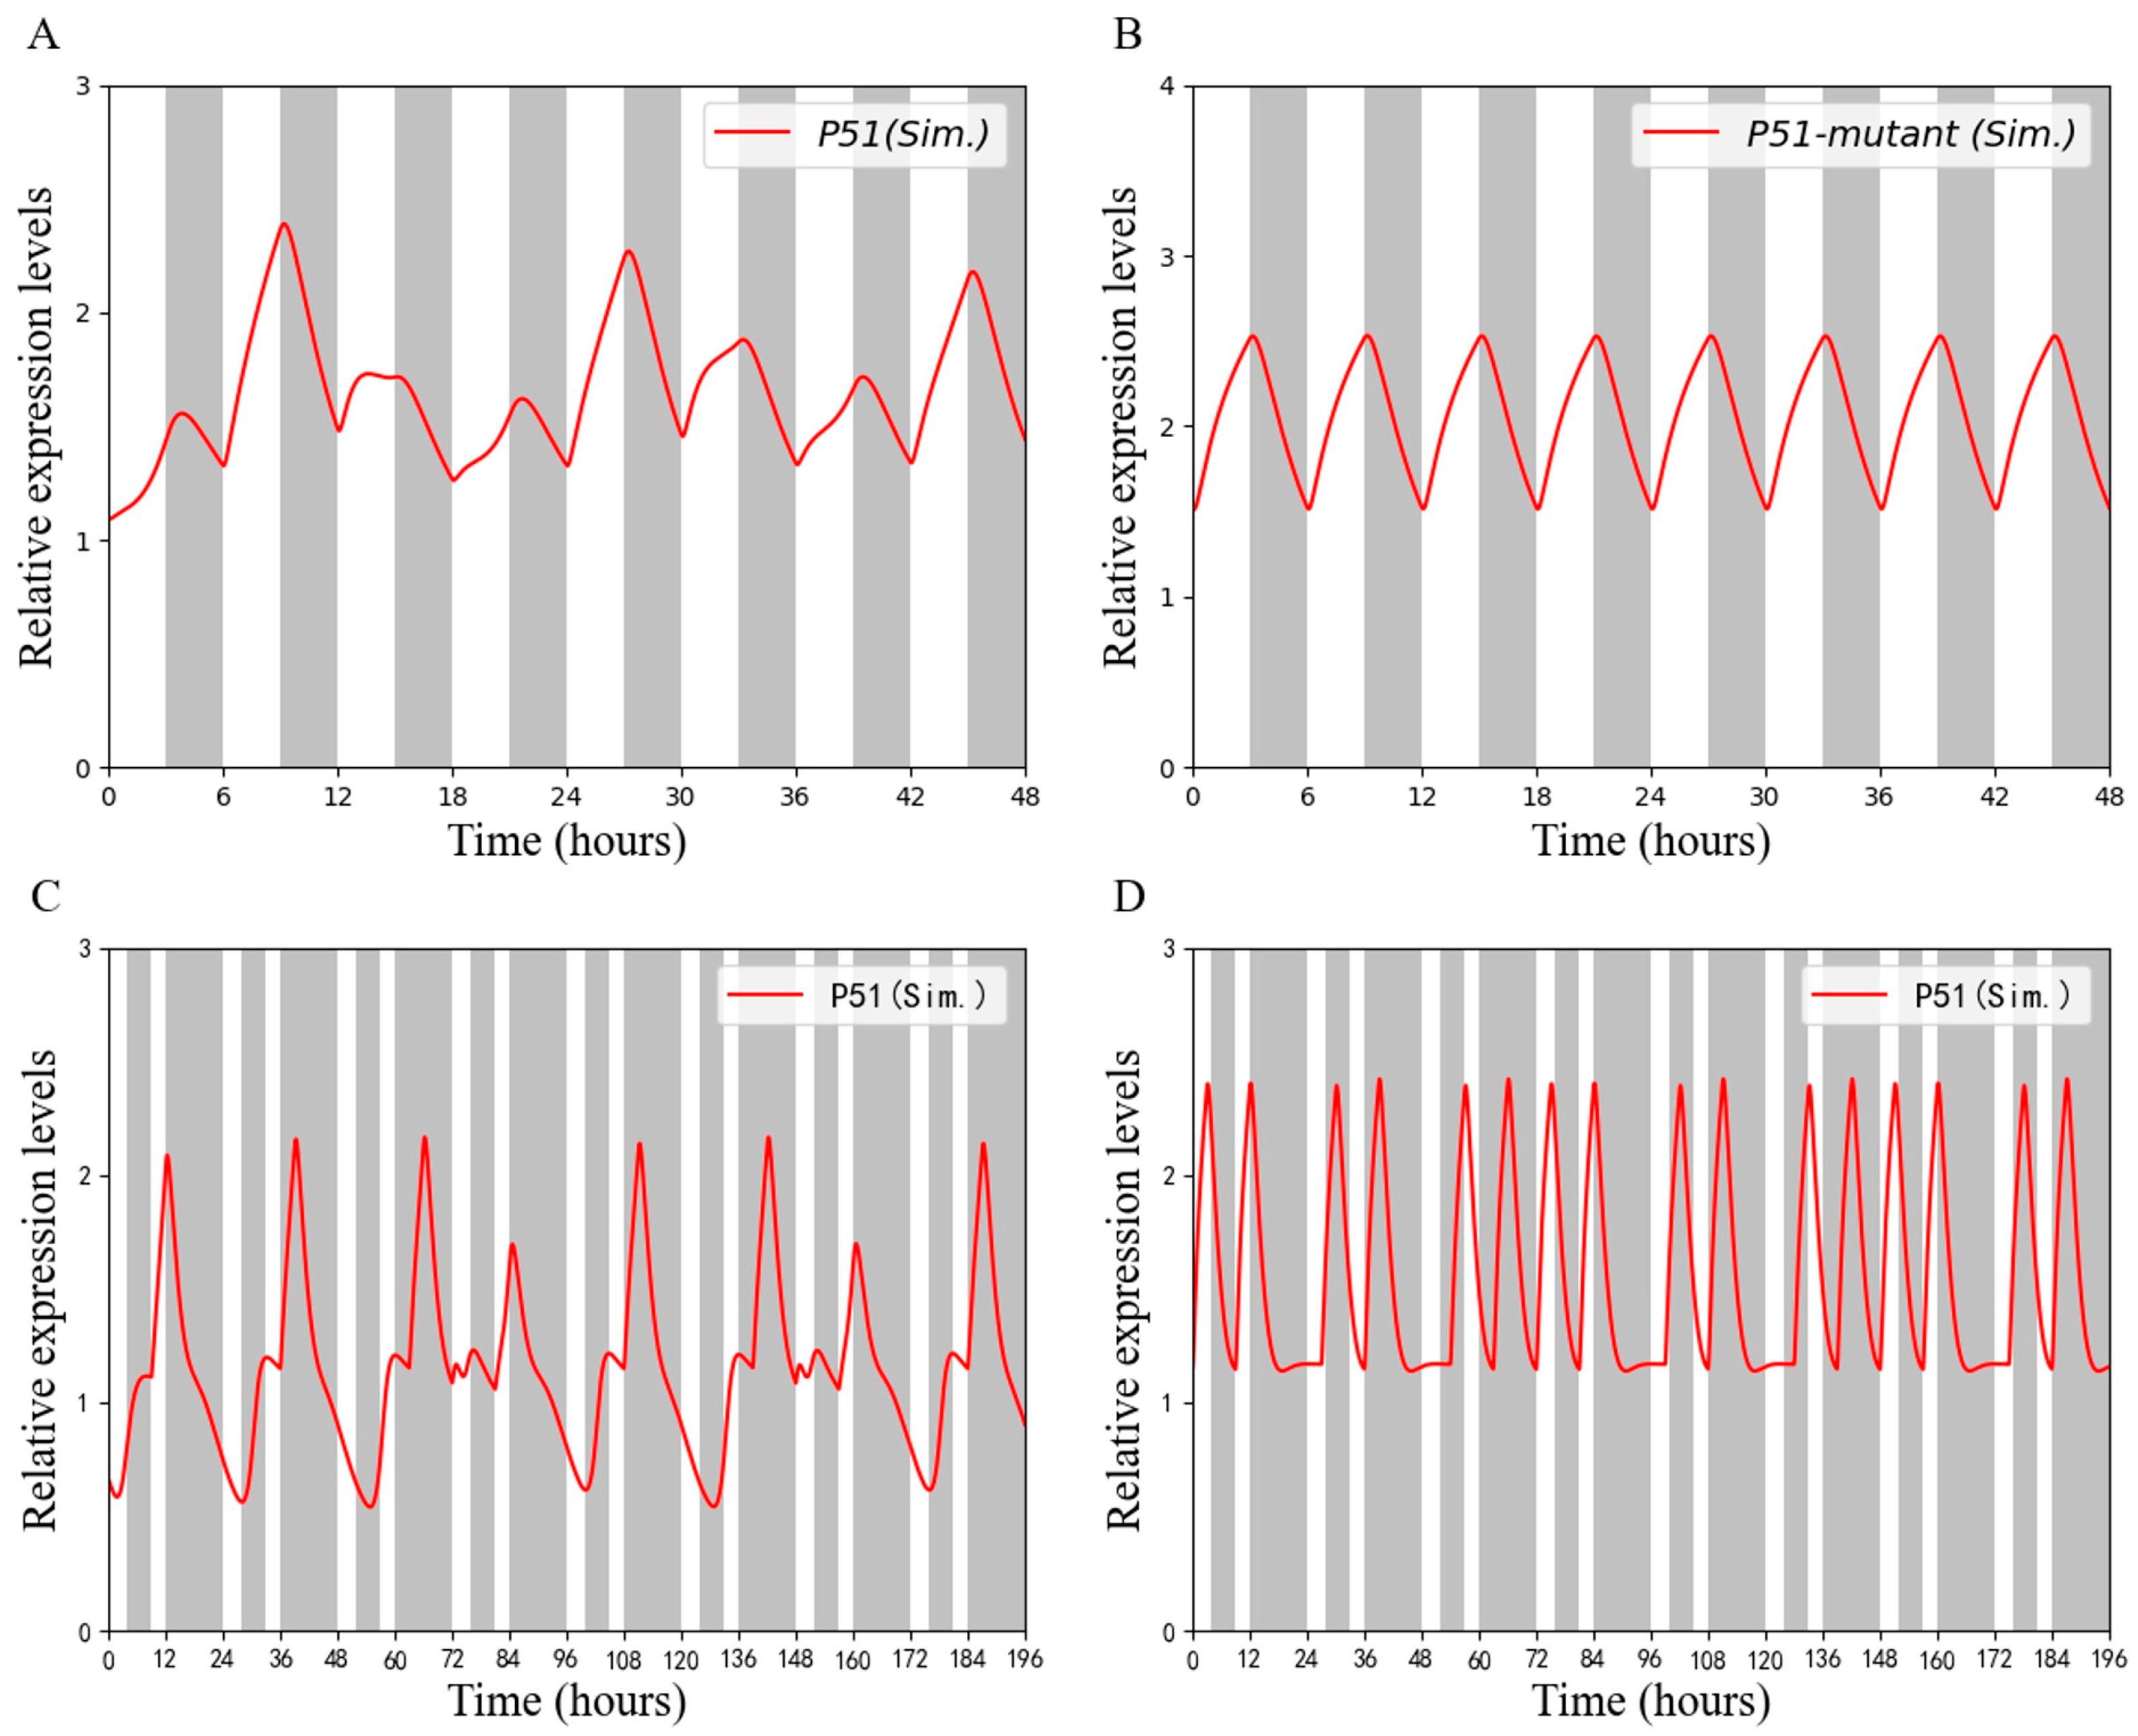
4.3. Robustness Analysis of the Model

To evaluate the robustness of the model, small perturbations were introduced to each of the 35 parameters associated with the clock component. The effects of these perturbations on the period and phase of the circadian clock component under constant conditions were then analyzed. Specifically, the perturbation value was increased and decreased in 5% increments for each parameter individually. The results obtained indicate that the period and phase data points following the perturbations are closely clustered around the periods and phases (blue dots) observed before the perturbations, with no significant dispersion. This outcome demonstrates the model’s resilience to perturbations in the parameters (see Figure S4).

4.4. Parameter Sensitivity Analysis

Sensitivity analysis of model parameters is an integral component of modeling. It assists in identifying the parameters that exert a substantial influence on the model’s performance using an evaluation of their impact on the model’s output. This enhanced understanding of the model’s dynamic behavior and decision-making processes is of significant value. Additionally, it has been shown to enhance the robustness of the model, ensuring stability under parameter fluctuations or input noise. Additionally, it facilitates the optimization of resource allocation, leading to a reduction in unnecessary computational overheads. Furthermore, it provides a foundation for the selection of features and the simplification of the model. The celery seedlings were subjected to an incubation period under the 12L:12D cycles for five days. Thereafter, they were transferred to the continuous darkness (DD) environment. In the sensitivity analysis, each base parameter was subjected to a ± 10% perturbation. Within this range, 50,000 sets of parameters were randomly generated. The maximum change interval in the parameters was identified under the specified output conditions and subsequently normalized to reflect the change, with shorter blue bands indicating greater sensitivity of the corresponding parameter (Figure S5).

4.5. Rhythmic Expression of Clock Genes in Skeleton Photoperiod

During the entrainment process, it has been determined that not all circadian clocks can be entrained within a specific photoperiodic range. Once the maximum entrainment threshold is surpassed, a state of arrhythmia is initiated.
From the experimental data and the results of the simulations, it was determined that the circadian clock lost its rhythmicity during a 3L:3D photoperiod (see Figure S6). To further illustrate the loss of circadian clock rhythm under very short photoperiods, we once again simulated the expression patterns of the circadian clock genes under 1L:1D and 1.5L:1.5D photoperiods. As demonstrated in Figures S7 and S8, the circadian clock exhibited a loss of rhythmicity, despite the model’s capacity to reproduce a very short photoperiod. This finding indicates that the circadian clock is not capable of entrainment during such a brief photoperiod. However, the model has been engineered to facilitate the restoration of the rhythm. As demonstrated in Figure 8A, the circadian clock loses rhythm during the 3L:3D light–dark cycle. However, severely affected/arrhythmic mutations, such as the cca1lhy double mutant (see Figure 8B) or the CCA1-OX line (see Figure S9), have been observed to immediately restore the 3L:3D short cycle in Figure 8B. The ability of the circadian clock to be influenced by abnormal photoperiods is another marker of a functional circadian clock. During this photoperiod, the organism is kept in the dark except for light pulses at dawn and dusk. As demonstrated in Figure 8C, the simulated wild-type circadian clock has a period of 72 h, accompanied by two higher peaks that occur during this period. However, the irregular cca1/lhy line prediction in Figure 8D is sensitive to the light signal only when degraded.

5. Discussion

A skeleton photoperiod was originally used to entrain plant circadian clocks. An important hallmark of a functional circadian clock is its ability to be entrained by a skeleton photoperiod [27], indicating that the impact of a skeleton photoperiod on plant growth should not be overlooked. By precisely regulating photoperiodic parameters, it may be possible to achieve targeted improvements in crop agronomic traits, thereby significantly enhancing crop yields. As a common medicinal vegetable, if celery can optimize its lighting scheme based on a skeleton Photoperiod, it can not only increase its biomass and active ingredient content but also significantly enhance its economic value.
As a model plant, most crops have been shown to share similar regulation patterns of clock genes with Arabidopsis thaliana [42]. Utilizing the biological clock model proposed by Greenwood et al. [40], we developed a celery clock model and its corresponding regulators. Lhcb1, a downstream photosynthetic gene regulated by the circadian clock, is positively regulated by CCA1 within the circadian clock regulatory network [43,44]. Furthermore, PRR7 expression is coordinately regulated by light and photosynthesis, allowing PRR7 to act as a transcriptional repressor during circadian sugar signaling [45]. Consequently, it was hypothesized that PRR7 exerts a repressive effect on atpA expression. Yeast one-hybrid and transient experiments show that CCA1 directly binds to the Lhcb1 promoter, resulting in increased Lhcb1 expression and enhanced carbon fixation in hybrid progeny [46]. It is inferred that CCA1 promotes the expression of RbcL, thereby enhancing the carbon fixation function of RbcL in photosynthesis, which contributes to the establishment of a celery clock regulatory network (see Figure 9).
Circadian rhythms are the central coordinators of photosynthetic activity by synchronizing metabolic processes with diurnal light fluctuations. Our findings demonstrate that the circadian regulation of photosynthesis is conserved across distinct light–dark (L/D) cycles, with rhythmic transcriptional control of photosynthetic genes being essential for maintaining optimal photosynthetic efficiency.
Photosynthesis is a component of several interrelated physiological and molecular processes, each of which exhibits strong circadian rhythms, such as the net carbon assimilation rate, stomatal conductance, and chlorophyll content [47,48]. The circadian clock can predict dawn and dusk [49]. Transcript levels of genes involved in photosynthesis lend further support to the hypothesis that the circadian clock may “warm” the photosynthetic machinery at dawn in anticipation of light to maximize carbon fixation and “cool” it at dusk to maximize water use efficiency [49,50]. The LHY gene has been shown to inhibit photosynthesis during nocturnal hours and anticipate dusk in natural environments [51].
Light supply with a circadian rhythm has led to the evolution of circadian clocks that regulate the physiology, photosynthesis, metabolism, and development of most plants [43]. Crop yield has always been a hot issue in agricultural production, and how to improve crop yield is the focus of the hot issue. The latest findings suggest that two different photoperiods can be measured in plants during their natural day cycle. They can control flowering time by detecting the absolute photoperiod with a low-light detection photoreceptor system. At the same time, they can measure the photosynthetic cycle as the metabolic day length to control growth [16]. This finding suggests that plants are capable of measuring photoperiods to regulate photosynthesis and thereby achieve maximum photosynthetic efficiency. In the present experiment, it was demonstrated that, under equivalent light conditions, the 3L:3D photoperiod resulted in the greatest photosynthesis accumulation. This finding suggests that plants can select the most efficient photosynthetic mechanism by measuring the photoperiod, thereby maximizing the photosynthetic yield.

6. Conclusions

In this study, we obtained a set of optimal parameters related to the biological clock by constructing a differential equation model of celery’s circadian clock and employing a cost function optimization method. We also conducted a systematic verification of the model’s reliability. Based on the validated circadian clock model, we further developed a circadian clock pathway model to regulate photosynthesis, enabling the quantitative calculation of the photosynthetic yield in celery. The results indicate that the 3L:3D photoperiod condition exhibited the best photosynthetic yield performance among all the tested photoperiods. To assess the generalizability of this finding, we extended the simulation to various photoperiods not included in the experiments (1L:1D, 1.5L:1.5D, 8L:16D, and 16L:8D), and the results consistently confirm the significant advantage of the 3L:3D photoperiod. Statistical analyses of key photosynthetic parameters (Pn, Chl, and N) further support these conclusions: under the 3L:3D photoperiod, the highest levels of Chl and N content were observed in the cells. Simultaneously, net Pn showed the strongest positive correlation with Chl and N while exhibiting the strongest negative correlation with Ci. It is important to note that this study focused on the mechanism of photoperiodic influence on photosynthetic yield without considering the interactions of other environmental factors such as light intensity, light quality, and temperature. The regulatory effects of these factors on photosynthesis warrant further exploration in subsequent studies.
This study offers a theoretical foundation and technical support for the photoperiod regulation of celery and other crops. The established modeling framework can be extended and applied to the investigation of circadian rhythms and photosynthesis in various crops. The findings of this research are highly significant for optimizing light management strategies in controlled environment agriculture.

Supplementary Materials

The following supporting information can be downloaded at: https://www.mdpi.com/article/10.3390/horticulturae11050520/s1. Figure S1. Experimentally measured and modeled circadian profiles of Tr under different photoperiods. (A) Tr exhibits a pronounced circadian rhythm under the 3L:3D skeleton cycle, characterized by multiple peaks over 24 hours, with the maximum rate occurring in the evening and a minimum at dawn. (B) In the 6L:6D skeleton cycle, Tr displays two peaks within one cycle, each followed by a similar trend of decreasing rates, both reaching a minimum before the end of the dark period. (C) Under the 12L:12D photoperiod, Tr peaks just before noon, followed by a rapid then gradual decline that minimizes late at night, subsequently rebounding with the onset of dawn. (D) Under LL conditions, Tr rises and falls more gradually over time, exhibiting broader peaks and troughs. Significance analysis of experimental values, p < 0.05. Figure S2. Pn accumulation under different photoperiods. The cumulative amount of Pn is represented by the integral of the curve Pn over the interval [120, 148]. Figure S3. Linear regression analysis between Pn and Ci. (A) Under the 3L:3D cycle, there is a significant negative correlation between Pn and Ci. (B) In the 6L:6D cycle, the negative correlation between Pn and Ci is obvious. (C) Within the 3L:3D cycle, the negative correlation between Pn and Ci is weak. (D) The strength of the negative correlation between Pn and Ci is lower than that observed in the 3L:3D cycle but significantly higher than in the 6L:6D and 12L:12D cycles under 24L continuous light conditions. Figure S4. Robustness analysis of the model. For each parameter value, the average period and amplitude were calculated in DD over 250 hours, with each parameter value being increased and decreased by 5% in turn. The blue dots represent the period and phase corresponding to the original parameter values for (A) CL and (B) P51. Figure S5. Parameter sensitivity analysis based on period and phase. Figure S6. Experimental and simulated expression profiles of CL in 3L:3D cycles. The results of both experiments and simulations conducted under the 3L:3D cycle show that the circadian clock of celery falls outside the range of domesticated cycles, leading to an arrhythmic pattern. Figure S7. Simulation of the expression profiles of wild-type clock genes. Under the 1L:1D cycle, both experimental and simulated results indicate that the celery circadian clock falls outside the range of domesticated cycles, leading to its arrhythmic behavior. Figure S8. The expression profiles of simulated wild-type clock genes. Under the 1.5L:1.5D cycle, the experimental and simulated results were comparable to those of the 1L:1D cycle, and none of the celery circadian clocks exhibited rhythmicity. Figure S9. Abnormal photoperiod entrainment. (A) Simulated relative expression levels of PRR5/TOC1 in WT; (B) Simulated relative expression levels of PRR5/TOC1 in CCA1-OX.

Author Contributions

The ideas of this paper were proposed by X.Y., A.X., and X.H. H.L. was responsible for the modeling and simulation, while C.C. focused on molecular experiments. J.L. and M.X. contributed by conducting literature reviews and extracting experimental data. All authors have read and agreed to the published version of the manuscript.

Funding

This study was partially supported by the National Natural Science Foundation of China (11171155), the Natural Science Foundation of Jiangsu Province, China (BK20171370), the National Vegetable Industry Technology System (CARS-23-A16), the Primary Research & Development Plan (Modern Agriculture) of Jiangsu Province (BE2023350), the Priority Academic Program Development of Jiangsu Higher Education Institutions (PAPD), the Key Research and Development Program of Jiangsu (BE2022386), and Science and Technology Capacity Enhancement Program-Joint Guidance for Regional Innovative Development of NJAU (KYLH2025002).

Data Availability Statement

The article contains all the information required to support its conclusions.

Acknowledgments

The authors gratefully acknowledge all lab members for their help in collecting celery and data organization.

Conflicts of Interest

The authors declare no conflicts of interest.

References

  1. Li, M.-Y.; Feng, K.; Hou, X.-L.; Jiang, Q.; Xu, Z.-S.; Wang, G.-L.; Liu, J.-X.; Wang, F.; Xiong, A.-S. The Genome Sequence of Celery (Apium graveolens L.), an Important Leaf Vegetable Crop Rich in Apigenin in the Apiaceae Family. Hortic. Res. 2020, 7, 9. [Google Scholar] [CrossRef] [PubMed]
  2. Singh, M.; Nara, U.; Kaur, K.; Rani, N.; Jaswal, C. Genetic, Genomic and Biochemical Insights of Celery (Apium graveolens L.) in the Era of Molecular Breeding. J. Appl. Res. Med. Aromat. Plants 2022, 31, 100420. [Google Scholar] [CrossRef]
  3. Duan, A.-Q.; Feng, K.; Wang, G.; Liu, J.-X.; Xu, Z.-S.; Xiong, A.-S. Elevated Gibberellin Enhances Lignin Accumulation in Celery (Apium graveolens L.) Leaves. Protoplasma 2019, 256, 777–788. [Google Scholar] [CrossRef]
  4. Funakoshi-Tago, M.; Nakamura, K.; Tago, K.; Mashino, T.; Kasahara, T. Anti-Inflammatory Activity of Structurally Related Flavonoids, Apigenin, Luteolin and Fisetin. Int. Immunopharmacol. 2011, 11, 1150–1159. [Google Scholar] [CrossRef]
  5. Huang, C.-S.; Lii, C.-K.; Lin, A.-H.; Yeh, Y.-W.; Yao, H.-T.; Li, C.-C.; Wang, T.-S.; Chen, H.-W. Protection by Chrysin, Apigenin, and Luteolin against Oxidative Stress Is Mediated by the Nrf2-Dependent up-Regulation of Heme Oxygenase 1 and Glutamate Cysteine Ligase in Rat Primary Hepatocytes. Arch. Toxicol. 2013, 87, 167–178. [Google Scholar] [CrossRef]
  6. Huang, T.; Shui, Y.; Wu, Y.; Hou, X.; You, X. Red Light Resets the Expression Pattern, Phase, and Period of the Circadian Clock in Plants: A Computational Approach. Biology 2022, 11, 1479. [Google Scholar] [CrossRef]
  7. Li, T.; Fang, K.; Tie, Y.; Lu, Y.; Lei, Y.; Li, W.; Zheng, T.; Yao, X. NAC Transcription Factor ATAF1 Negatively Modulates the PIF-regulated Hypocotyl Elongation under a Short-day Photoperiod. Plant Cell Environ. 2024, 47, 3253–3265. [Google Scholar] [CrossRef]
  8. Zheng, Z.; Zhou, W.; Yang, Q.; Jiang, J.; Miao, M. Effect of Furrow Straw Mulching and Straw Decomposer Application on Celery (Apium graveolens L.) Production and Soil Improvement. Agronomy 2023, 13, 2774. [Google Scholar] [CrossRef]
  9. Proietti, S.; Moscatello, S.; Riccio, F.; Downey, P.; Battistelli, A. Continuous Lighting Promotes Plant Growth, Light Conversion Efficiency, and Nutritional Quality of Eruca vesicaria (L.) Cav. in Controlled Environment With Minor Effects Due to Light Quality. Front. Plant Sci. 2021, 12, 730119. [Google Scholar] [CrossRef]
  10. Osnato, M. Photoperiod Control of Plant Growth: Flowering Time Genes Beyond Flowering. Front. Plant Sci. 2022, 12, 805635. [Google Scholar] [CrossRef]
  11. Roeber, V.M.; Schmülling, T.; Cortleven, A. The Photoperiod: Handling and Causing Stress in Plants. Front. Plant Sci. 2022, 12, 781988. [Google Scholar] [CrossRef] [PubMed]
  12. Roeber, V.M.; Bajaj, I.; Rohde, M.; Schmülling, T.; Cortleven, A. Light Acts as a Stressor and Influences Abiotic and Biotic Stress Responses in Plants. Plant Cell Environ. 2021, 44, 645–664. [Google Scholar] [CrossRef] [PubMed]
  13. Gendron, J.M.; Leung, C.C.; Liu, W. Energy as a Seasonal Signal for Growth and Reproduction. Curr. Opin. Plant Biol. 2021, 63, 102092. [Google Scholar] [CrossRef]
  14. Wu, S.; Li, R.; Bu, C.; Zhu, C.; Miao, C.; Zhang, Y.; Cui, J.; Jiang, Y.; Ding, X. Photoperiodic Effect on Growth, Photosynthesis, Mineral Elements, and Metabolome of Tomato Seedlings in a Plant Factory. Plants 2024, 13, 3119. [Google Scholar] [CrossRef]
  15. Bhatta, M.; Sandro, P.; Smith, M.R.; Delaney, O.; Voss-Fels, K.P.; Gutierrez, L.; Hickey, L.T. Need for Speed: Manipulating Plant Growth to Accelerate Breeding Cycles. Curr. Opin. Plant Biol. 2021, 60, 101986. [Google Scholar] [CrossRef]
  16. Wang, Q.; Liu, W.; Leung, C.C.; Tarté, D.A.; Gendron, J.M. Plants Distinguish Different Photoperiods to Independently Control Seasonal Flowering and Growth. Science 2024, 383, eadg9196. [Google Scholar] [CrossRef] [PubMed]
  17. Abuelsoud, W.; Cortleven, A.; Schmülling, T. Photoperiod Stress Induces an Oxidative Burst-like Response and Is Associated with Increased Apoplastic Peroxidase and Decreased Catalase Activities. J. Plant Physiol. 2020, 253, 153252. [Google Scholar] [CrossRef]
  18. Cortleven, A.; Roeber, V.M.; Frank, M.; Bertels, J.; Lortzing, V.; Beemster, G.T.S.; Schmülling, T. Photoperiod Stress in Arabidopsis Thaliana Induces a Transcriptional Response Resembling That of Pathogen Infection. Front. Plant Sci. 2022, 13, 838284. [Google Scholar] [CrossRef]
  19. Chu, Q.; Qin, Y.; Li, C.; Cheng, S.; Su, L.; He, Z.; Zhou, X.; Shao, D.; Guo, X. Effects of Different Photoperiods on the Growth and Nutritional Characteristics of Two Celery Cultivars in Plant Factory. Agronomy 2023, 13, 3039. [Google Scholar] [CrossRef]
  20. Xu, Y.; Ibrahim, I.M.; Harvey, P.J. The Influence of Photoperiod and Light Intensity on the Growth and Photosynthesis of Dunaliella Salina (Chlorophyta) CCAP 19/30. Plant Physiol. Biochem. 2016, 106, 305–315. [Google Scholar] [CrossRef]
  21. Huang, T.; Liu, H.; Tao, J.-P.; Zhang, J.-Q.; Zhao, T.-M.; Hou, X.-L.; Xiong, A.-S.; You, X. Low Light Intensity Elongates Period and Defers Peak Time of Photosynthesis: A Computational Approach to Circadian-Clock-Controlled Photosynthesis in Tomato. Hortic. Res. 2023, 10, uhad077. [Google Scholar] [CrossRef] [PubMed]
  22. Pokhilko, A.; Mas, P.; Millar, A.J. Modelling the Widespread Effects of TOC1 Signalling on the Plant Circadian Clock and Its Outputs. BMC Syst. Biol. 2013, 7, 23. [Google Scholar] [CrossRef]
  23. Hsu, P.Y.; Harmer, S.L. Wheels within Wheels: The Plant Circadian System. Trends Plant Sci. 2014, 19, 240–249. [Google Scholar] [CrossRef]
  24. Creux, N.; Harmer, S. Circadian Rhythms in Plants. Cold Spring Harb. Perspect. Biol. 2019, 11, a034611. [Google Scholar] [CrossRef]
  25. Nakamichi, N.; Kiba, T.; Henriques, R.; Mizuno, T.; Chua, N.-H.; Sakakibara, H. PSEUDO-RESPONSE REGULATORS 9, 7, and 5 Are Transcriptional Repressors in the Arabidopsis Circadian Clock. Plant Cell 2010, 22, 594–605. [Google Scholar] [CrossRef] [PubMed]
  26. Ohara, T.; Fukuda, H.; Tokuda, I.T. An Extended Mathematical Model for Reproducing the Phase Response of Arabidopsis Thaliana under Various Light Conditions. J. Theor. Biol. 2015, 382, 337–344. [Google Scholar] [CrossRef] [PubMed]
  27. De Caluwé, J.; Xiao, Q.; Hermans, C.; Verbruggen, N.; Leloup, J.-C.; Gonze, D. A Compact Model for the Complex Plant Circadian Clock. Front. Plant Sci. 2016, 7, 74. [Google Scholar] [CrossRef]
  28. Pay, M.L.; Kim, D.W.; Somers, D.E.; Kim, J.K.; Foo, M. Modelling of Plant Circadian Clock for Characterizing Hypocotyl Growth under Different Light Quality Conditions. In Silico Plants 2022, 4, diac001. [Google Scholar] [CrossRef]
  29. Zhang, R.; Gonze, D.; Hou, X.; You, X.; Goldbeter, A. A Computational Model for the Cold Response Pathway in Plants. Front. Physiol. 2020, 11, 591073. [Google Scholar] [CrossRef]
  30. Akman, O.E.; Watterson, S.; Parton, A.; Binns, N.; Millar, A.J.; Ghazal, P. Digital clocks: Simple Boolean models can quantitatively describe circadian systems. J. R. Soc. Interface 2012, 9, 2365–2382. [Google Scholar] [CrossRef]
  31. Dixon, L.E.; Knox, K.; Kozma-Bognar, L.; Southern, M.M.; Pokhilko, A.; Millar, A.J. Temporal Repression of Core Circadian Genes Is Mediated through EARLY FLOWERING 3 in Arabidopsis. Curr. Biol. 2011, 21, 120–125. [Google Scholar] [CrossRef]
  32. Fogelmark, K.; Troein, C. Rethinking Transcriptional Activation in the Arabidopsis Circadian Clock. PLoS Comput. Biol. 2014, 10, e1003705. [Google Scholar] [CrossRef] [PubMed]
  33. Solanas, G.; Welz, P.-S. (Eds.) Circadian Regulation: Methods and Protocols; Methods in Molecular Biology; Humana Press: New York, NY, USA, 2022; ISBN 978-1-0716-2249-0. [Google Scholar]
  34. Schaffer, A.A. Improving the Accuracy of PSI-BLAST Protein Database Searches with Composition-Based Statistics and Other Refinements. Nucleic Acids Res. 2001, 29, 2994–3005. [Google Scholar] [CrossRef] [PubMed]
  35. Hu, Z.-H.; Zhang, N.; Qin, Z.-Y.; Li, J.-W.; Tao, J.-P.; Yang, N.; Chen, Y.; Kong, J.-Y.; Luo, W.; Chen, X.; et al. Circadian Rhythm Response and Its Effect on Photosynthetic Characteristics of the Lhcb Family Genes in Tea Plant. BMC Plant Biol. 2024, 24, 333. [Google Scholar] [CrossRef] [PubMed]
  36. Green, R.M.; Tingay, S.; Wang, Z.-Y.; Tobin, E.M. Circadian Rhythms Confer a Higher Level of Fitness to Arabidopsis Plants. Plant Physiol. 2002, 129, 576–584. [Google Scholar] [CrossRef]
  37. Dodd, A.N.; Salathia, N.; Hall, A.; Kévei, E.; Tóth, R.; Nagy, F.; Hibberd, J.M.; Millar, A.J.; Webb, A.A.R. Plant Circadian Clocks Increase Photosynthesis, Growth, Survival, and Competitive Advantage. Science 2005, 309, 630–633. [Google Scholar] [CrossRef]
  38. Mandal, R.; Dutta, G. From Photosynthesis to Biosensing: Chlorophyll Proves to Be a Versatile Molecule. Sens. Int. 2020, 1, 100058. [Google Scholar] [CrossRef]
  39. Gao, F.; Guo, J.; Shen, Y. Advances from Chlorophyll Biosynthesis to Photosynthetic Adaptation, Evolution and Signaling. Plant Stress 2024, 12, 100470. [Google Scholar] [CrossRef]
  40. Greenwood, M.; Tokuda, I.T.; Locke, J.C.W. A Spatial Model of the Plant Circadian Clock Reveals Design Principles for Coordinated Timing. Mol. Syst. Biol. 2022, 18, e10140. [Google Scholar] [CrossRef]
  41. Wang, Z.-Y.; Tobin, E.M. Constitutive Expression of the CIRCADIAN CLOCK ASSOCIATED 1 (CCA1) Gene Disrupts Circadian Rhythms and Suppresses Its Own Expression. Cell 1998, 93, 1207–1217. [Google Scholar] [CrossRef]
  42. Das, A.; Guyer, L.; Hörtensteiner, S. Chlorophyll and Chlorophyll Catabolite Analysis by HPLC. In Plant Senescence; Guo, Y., Ed.; Methods in Molecular Biology; Springer: New York, NY, USA, 2018; Volume 1744, pp. 223–235. ISBN 978-1-4939-7670-6. [Google Scholar]
  43. Steed, G.; Ramirez, D.C.; Hannah, M.A.; Webb, A.A.R. Chronoculture, Harnessing the Circadian Clock to Improve Crop Yield and Sustainability. Science 2021, 372, eabc9141. [Google Scholar] [CrossRef] [PubMed]
  44. Hwang, Y.; Han, S.; Yoo, C.Y. Anterograde signaling controls plastid transcription via sigma factors separately from nuclear photosynthesis genes. Nat. Commun. 2022, 13, 7440. [Google Scholar] [CrossRef] [PubMed]
  45. Liu, Z.; Yu, C.; Xiang, B.; Niu, J.; Zheng, Y. Processing tomato chlorophyll a/b-binding protein 1C interacts with CMV 2b protein. Physiol. Mol. Plant Pathol. 2022, 120, 101857. [Google Scholar] [CrossRef]
  46. Liu, T.; Duan, W.; Chen, Z.; Yuan, J.; Xiao, D.; Hou, X.; Li, Y. Enhanced photosynthetic activity in pak choi hybrids is associated with increased grana thylakoids in chloroplasts. Plant J. 2020, 103, 2211–2224. [Google Scholar] [CrossRef]
  47. Müller, L.M.; Von Korff, M.; Davis, S.J. Connections between Circadian Clocks and Carbon Metabolism Reveal Species-Specific Effects on Growth Control. J. Exp. Bot. 2014, 65, 2915–2923. [Google Scholar] [CrossRef]
  48. Pan, W.-J.; Wang, X.; Deng, Y.-R.; Li, J.-H.; Chen, W.; Chiang, J.Y.; Yang, J.-B.; Zheng, L. Nondestructive and Intuitive Determination of Circadian Chlorophyll Rhythms in Soybean Leaves Using Multispectral Imaging. Sci. Rep. 2015, 5, 11108. [Google Scholar] [CrossRef] [PubMed]
  49. Dodd, A.N.; Dalchau, N.; Gardner, M.J.; Baek, S.; Webb, A.A.R. The Circadian Clock Has Transient Plasticity of Period and Is Required for Timing of Nocturnal Processes in Arabidopsis. New Phytol. 2014, 201, 168–179. [Google Scholar] [CrossRef]
  50. Covington, M.F.; Maloof, J.N.; Straume, M.; Kay, S.A.; Harmer, S.L. Global Transcriptome Analysis Reveals Circadian Regulation of Key Pathways in Plant Growth and Development. Genome Biol. 2008, 9, R130. [Google Scholar] [CrossRef]
  51. Joo, Y.; Fragoso, V.; Yon, F.; Baldwin, I.T.; Kim, S.-G. Circadian Clock Component, LHY, Tells a Plant When to Respond Photosynthetically to Light in Nature. J. Integr. Plant Biol. 2017, 59, 572–587. [Google Scholar] [CrossRef]
Figure 1. Expression levels of Lhcb1 under different photoperiods. (A) Under 3L:3D conditions, the expression of Lhcb1 peaked in the morning and exhibited a multi-peak expression pattern in the afternoon. (B) Under 6L:6D conditions, Lhcb1 displayed a bimodal expression pattern in each cycle. (C) Under 12L:12D conditions, Lhcb1 expression peaked at noon and decreased to its lowest level at night. (D) Under continuous light (LL) conditions, the expression pattern of Lhcb1 resembled that observed under 12L:12D conditions.
Horticulturae 11 00520 g001
Figure 2. Circadian patterns of Pn under different photoperiods. (A) Under the 3L:3D cycle, Pn exhibits a robust circadian rhythm. (B) Under the 6L:6D cycle, Pn displays a single peak within each cycle, with values dropping to their lowest point before the conclusion of the dark period. (C) Under the 12L:12D photoperiod, Pn peaks before noon and declines to a minimum during the late night. (D) Under LL conditions, Pn fluctuates gently, characterized by broader peaks and troughs.
Horticulturae 11 00520 g002
Figure 3. Accumulation of Pn under different photoperiodic conditions. (A) Under light–dark conditions, the accumulation of Pn gradually decreased with the prolongation of the photoperiod. Under continuous light (LL) conditions, Pn accumulation increased significantly, although it remained lower than the levels observed under 3L:3D conditions. (B) The Pn accumulation under long days, short days, and 1L:1D cycle treatments was comparable, and all were significantly higher than that observed under the 1.5L:1.5D cycle condition.
Horticulturae 11 00520 g003
Figure 4. Accumulation of Pn at different times of day. (A) Under four different cycles, no significant differences in Pn accumulation were observed from 3 to 9 h. However, with an extended accumulation time, a significant difference in Pn accumulation was noted from 12 h onward, with the highest accumulation occurring under the 3L:3D cycle and the lowest under the 12L:12D cycle. (B) With sufficiently long Pn accumulation times, a time-dependent decrease in Pn accumulation was observed as the length of the photoperiod increased in the light/dark cycle.
Horticulturae 11 00520 g004
Figure 5. Patterns of relative changes in Pn and Ci. (A) Under the 3L:3D photoperiod, Pn exhibits a peak in the evening, while Ci reaches its peak at dawn, demonstrating a strong rhythmic pattern. (B) In the 6L:6D photoperiod, Pn peaks during the day, and Ci peaks after the dark period. (C) Under a 12L:12D natural photoperiod, Pn peaks during the day, while Ci minimizes during the day, with both parameters exhibiting relatively stable changes at night. (D) Under LL conditions, Pn peaks at 3 h and subsequently remains low, whereas Ci shows an inverse pattern, with its minimum also occurring at 3 h and then remaining elevated. All values are normalized to their respective maximum.
Horticulturae 11 00520 g005
Figure 6. The interrelationships between Pn, Chl, and N. (A) Pn is significantly and strongly positively correlated with Chl and moderately positively correlated with N under a 3L:3D photoperiod. (B) Under a 6L:6D photoperiod, Pn exhibits a strong positive correlation with Chl and a moderate positive correlation with N. (C) Pn shows a moderate correlation with both Chl and N under a natural photoperiod of 12L:12D. (D) Under continuous light (LL) conditions, Pn is strongly positively correlated with both Chl and N. All values are normalized to their respective maximum.
Horticulturae 11 00520 g006
Figure 7. Experimental and simulated expression profiles in 12L:12D cycle conditions. Experimentally measured (in black) and simulated (in red) mRNA levels of (A) CCA1, (B) PRR9, (C) PRR5, and (D) ELF4.
Horticulturae 11 00520 g007
Figure 8. Entrainment by non-24 h cycles and abnormal photoperiods. (A) Entrainment of the wild-type clock by a 6 h cycle (3L:3D). The clock oscillates with a 24 h, not 12 h, period. (B) Relative expression levels of PRR5/TOC1 in cca1lhy. Response of a cca1lhy double mutant in a 6 h cycle. This arrhythmic line entrains to the short cycle. (C) Entrainment of the wild-type clock by a skeleton photoperiod (3L: 6D: 3L:12D). The functional clock entrains to the 24 h cycle. (D) Relative expression levels of PRR5/TOC1 in cca1lhy. Response of the cca1lhy to a skeleton photoperiod.
Horticulturae 11 00520 g008
Figure 9. The regulatory network is constructed by celery circadian clock and the photosynthetic genes regulated by the circadian clock. The arrows indicate facilitative relationships, the blunt heads represent inhibitory relationships, and acute light responses are indicated by yellow flashes.
Horticulturae 11 00520 g009
Table 1. Average contents of Chl and N in leaves under four photoperiods.
Photoperiod3L:3D6L:6D12L:12D24L:0D
Chlorophyll (SPAD)30.83 ± 0.32 a24.00 ± 0.44 b23.33 ± 0.78 b30.40 ± 0.46 a
Nitrogen (mg/g)9.80 ± 0.10 a8.13 ± 0.21 b8.03 ± 0.15 a9.33 ± 0.15 a
Letters a and b denote statistically significant differences among the groups (p < 0.05).
Disclaimer/Publisher’s Note: The statements, opinions and data contained in all publications are solely those of the individual author(s) and contributor(s) and not of MDPI and/or the editor(s). MDPI and/or the editor(s) disclaim responsibility for any injury to people or property resulting from any ideas, methods, instructions or products referred to in the content.

