1. Introduction
Forests are among the most important global carbon reservoirs and represent the main component of terrestrial ecosystems [
1]. Among them, urban forests play a critical role in combating climate change by acting as carbon sinks, mitigating urban heat island effects, and improving air quality [
2]. Although considerable attention has been devoted to estimating carbon stocks in natural forests and large-scale plantations, relatively few studies have systematically quantified the carbon storage potential of trees in urban environments [
3]. Nevertheless, a substantial number of trees now exist in urban landscapes—along streets, in parks, and within residential green spaces—where they contribute significantly to ecosystem services and carbon cycling [
4].
Recent literature has highlighted that urban trees, particularly mature landscape species, are capable of storing substantial amounts of carbon [
5]. However, their contribution is often underestimated in national and global carbon accounting frameworks [
6]. Therefore, understanding the biomass and carbon sequestration potential of urban tree species is essential for improving the accuracy of carbon assessments and guiding species selection in climate-resilient urban planning [
7]. Biomass refers to the total mass of living organic matter, either from a specific part of a tree (e.g., trunk, branches, leaves, or roots), an individual tree, a stand of trees, or a larger forested region.
The main methods for studying forest carbon stocks include inventory-based estimation and simulation models combining ground data with remote sensing. Among them, the most widely used is the biomass plot inventory method due to its operational simplicity and relatively high accuracy, making it favored by researchers both domestically and internationally [
8]. Biomass refers to the total dry weight of living organic matter in a tree, a forest stand, or other vegetation units at a given time, regardless of area coverage [
9]. It is a key indicator of vegetation productivity and carbon sequestration capacity and serves as the basis for estimating carbon storage in forest ecosystems [
10]. Currently, biomass estimation methods include direct field measurements, biomass–volume conversion, and remote sensing techniques [
11]. Field measurements typically rely on tree parameters such as diameter at breast height (DBH) and height to construct species-specific allometric equations. Biomass distribution is essential for understanding stand structure, function, and ecosystem-level carbon dynamics. He et al. [
12] determined the biomass of the main afforestation tree species in the Guiyang Second Ring Forest Belt by establishing relative growth models for the trunk, branches, leaves, roots, and total tree biomass. The order of biomass accumulation from largest to smallest was found to be trunk > roots > branches > leaves. Leng et al. [
13] studied two representative injured tree species,
Cinnamomum camphora (L.) J.Presl and
Magnolia grandiflora L., by constructing allometric growth models for different components and aboveground biomass, discussing the best biomass models and predictive variables, and providing a basis for estimating urban forest carbon storage. Cao et al. [
14] researched the dynamic changes in the biomass and its distribution pattern of individual
Cinnamomum camphora trees in the Yangzhou urban greening belt and found that as the diameter at breast height increased, the biomass of the whole plant and its organs showed an overall increasing trend. Xu et al. [
15] estimated the biomass of common shrubs on highway slopes in Henan Province by establishing a shrub biomass model, providing a scientific reference for biomass estimation and carbon sink management in similar artificial habitats.
While several studies in the United States and Europe have investigated urban tree carbon storage, these have largely focused on temperate city regions and relied on national tree inventories or aerial data for estimation. In contrast, our study integrates field-based biomass modeling and component-specific carbon content analysis under a subtropical monsoon climate. This offers a complementary perspective to existing literature and highlights the importance of regional calibration in carbon stock assessments. Moreover, the species composition and urban greening strategies in Chinese megacities differ significantly from those in Western cities, necessitating localized evaluation approaches.
While forests are widely recognized as vital carbon sinks in terrestrial ecosystems, most studies have traditionally focused on natural forests and plantations in non-urban areas. However, with the rapid expansion of urban areas and the increasing concentration of human populations in cities, a significant proportion of global tree cover now exists within urban environments. Urban trees, particularly those in parks, roadsides, and residential landscapes, play a crucial role not only in enhancing urban aesthetics and microclimates but also in contributing to carbon sequestration. As emphasized in recent studies, the carbon storage potential of urban vegetation, especially large landscape trees, has been underestimated in global carbon accounting frameworks [
16]. Therefore, investigating carbon storage in urban tree species is essential to fill this research gap, support urban climate resilience strategies, and guide species selection for low-carbon city planning.
Zhengzhou, a representative megacity in central China, has undergone rapid urban expansion, making it an important case for evaluating the ecological function of urban vegetation. In this study, we investigate the biomass and carbon storage of eight common urban landscaping tree species in Zhengzhou. Our goal is to identify species with high carbon sequestration potential and provide practical recommendations for tree species selection and urban greening strategies in cities with similar ecological contexts.
2. Materials and Methods
2.1. Test Site
Zhengzhou is located in the central and northern part of Henan Province, at the di viding point between the middle and lower reaches of the Yellow River. Its geographical coordinates are 34°16′–34°58′ N latitude and 112°42′–114°14′ E longitude. The spatial location of the study area and the sampling points is shown in
Figure 1. Zhengzhou has a temperate continental monsoon climate, characterized by moderate temperatures, distinct seasons, an average annual temperature of 14.7 °C, an average annual precipitation of 632.4 mm, an average frost-free period of 220 days, and an average annual sunshine duration of 2400 h. The terrain is complex, with a general trend of higher altitude in the southwest and lower altitude in the northeast. The plant resources are abundant, and in terms of plant flora classification, it belongs to the warm temperate deciduous broad-leaved forest vegetation type. The soil type is classified as that of a warm, temperate, deciduous broad-leaved forest and arid forest steppe brown soil cinnamon soil zone (northwest Henan hilly loess area) [
17]. Zhengzhou is a typical megacity in China, with a population of 13.008 million in 2023.
2.2. Materials
Field investigations were conducted to select representative sampling plots based on the Recommended List of Urban Greening Tree Species in Zhengzhou City. Field sampling and measurements were carried out between August and September 2023. By observing topography, tree growth, site conditions, and species distribution, 12 typical green zones representing three site conditions were selected across Zhengdong New District, Jinshui District, and Erqi District of Zhengzhou City for field sampling. In the selected sampling areas, the target tree species were predominantly planted in rows along streets, within parks, or in green spaces. The majority of the sampling sites included surrounding herbaceous vegetation and shrub species, which provided additional ground cover and habitat complexity. Such planting arrangements and associated vegetation were considered during the field observations to ensure that environmental influences on tree growth and carbon storage potential were appropriately documented.
For each tree species, three biological replicates (i.e., individual trees with similar growth status and environment) were selected, resulting in a total of 24 tree samples. The selected tree species included
Platanus orientalis L.,
Koelreuteria paniculata Laxm.,
Magnolia grandiflora L.,
Styphnolobium japonicum (L.) Schott,
Acer buergerianum Miq.,
Cinnamomum camphora (L.) Presl.,
Pterocarya stenoptera C. DC., and
Salix babylonica L. For each species, measurements of diameter at breast height (DBH was used as the key independent variable and is denoted as D in allometric equations), tree height, and crown spread were recorded. The sampled trees were predominantly between 25 and 35 years old. As shown in
Table 1, the average tree height ranged from 8.6 m to 15.0 m, while the average DBH varied from 28.2 cm to 40.5 cm.
For each species, three healthy and well-developed mature individuals were purposively selected, resulting in a total of 24 sampled trees. The selection was based on uniformity in growth vigor and health status to ensure comparability across species.
From each sampled tree, four types of organ samples—trunk, branches, leaves, and roots—were collected. Specifically, one increment core at breast height (DBH) was extracted from the trunk using an increment borer; high branches and small branches were sampled by cutting 5 cm sections with pruning shears; approximately 10 healthy leaves were collected from the four cardinal directions (north, south, east, and west); and root samples were obtained by excavating fine roots (diameter < 2 mm) about 0.5 m away from the trunk. Soil impurities were removed, and all samples were sealed in labeled bags and transported to the laboratory for further analysis. In total, 96 organ samples (24 trees × 4 organs) were collected for biomass and carbon content determination. In this study, biomass was quantified at both the organ level and the whole-tree level to assess carbon storage capacity.
2.3. Research Methods
2.3.1. Sample Preparation and Carbon Content Determination
The tree species samples were disinfected in a 105 °C constant-temperature oven for 15 min and dried in a 65 °C constant-temperature oven for 48 h. Three samplings were conducted, separately marked, crushed, and sieved. The temperature of the oil bath was maintained at 170 °C to 180 °C, and the potassium dichromate external heating method [
18] was used to determine and calculate the carbon content of the tree trunks, branches, leaves, and roots. The average carbon content of each organ was determined from the three sampling measurements.
2.3.2. Establishment of Allometric Equations Based on Tree Height and DBH
Some studies have shown that DBH and tree height are important variables for estimating the individual tree biomass [
19]. Biomass models can be univariate regression or bivariate regression models. Relevant studies [
20] have indicated that the independent variable D is the best in univariate relative growth models, while the independent variable D
2H is the most optimal in binary relative growth models. Based on a review of the extensive literature [
21], this study adopts the regression equation between the total biomass (
W) of each tree organ and diameter at breast height (
D) and tree height (
H):
Note: W = biomass (kg); D = diameter at breast height (cm); H = tree height (m); a, b = model parameters
Field Data Collection: DBH and tree height were measured in the field for each sampled tree; canopy width was estimated by averaging the measurements taken in the four cardinal directions (north, south, east, west).
Calculation Steps: The allometric Equation (1) was applied to calculate the biomass of each organ (leaf, branch, trunk, root) for each tree based on D and H; the organ-level values were summed to obtain the total biomass per tree; the canopy area was estimated using average crown width in four directions; the biomass per unit area was calculated by dividing total biomass by estimated canopy area for each tree.
Subsequently, the total biomass per unit area—defined here as the ground area projected by the tree canopy—was estimated based on the average canopy radius measured in the four cardinal directions (east, west, south, and north).
Due to the unavailability of species-specific allometric models for several ornamental species and the impracticality of destructive sampling in urban areas, generalized allometric equations were applied based on wood density classification (hardwood vs. softwood), as recommended by the China Forest Ecosystem Carbon Storage—Biomass Equations guideline.
2.3.3. Biomass and Relative Growth Models for Diameter at Breast Height and Tree Height
By referring to the book “Carbon Storage in China’s Forest Ecosystems Biomass Equations” [
22], the representative biomass model (1) was selected to construct the relative growth equations for the various organs of the tree species (
Table 2).
All selected species in this study are broad-leaved trees. Species categorized as having harder wood typically exhibit higher wood density, slower growth rates, and longer life spans, characteristics often associated with greater structural biomass and carbon storage capacity. Other soft and broad categories: these terms refer to broad-leaved tree species with lighter wood and lower density. They generally have a faster growth rate, relatively shorter life span, and stronger adaptability and are commonly found in secondary forests and plantations.
2.3.4. Calculation of Tree Carbon Storage
To ensure the accuracy of carbon storage estimation, this study adopted the “Forest Ecosystem Carbon Storage Measurement Guidelines” (LYT 2988-2018) issued by the National Forestry and Grassland Administration of China. The biomass of each tree organ was estimated using regression equations. The carbon storage of each organ was then calculated by multiplying the measured carbon content rate of each organ by its corresponding biomass. The formula for calculating carbon storage is as follows:
Note: C represents the carbon storage. B is the biomass of the tree species. Cc is the carbon content rate.
2.4. Statistical Analysis
All statistical analyses were performed using SPSS software (version 24.0, IBM Corp., Armonk, NY, USA). Descriptive statistics were calculated for each variable, and due to the small sample size per species (n = 3), a nonparametric Kruskal–Wallis test was applied to assess differences in carbon content and biomass among the tree organs and tree species, as it does not assume normality or homogeneity of variance. Tukey’s HSD test was applied for post hoc comparisons when significant differences were identified. Pearson correlation analysis was used to examine the relationships between tree structural parameters (e.g., DBH, height, crown width) and biomass or carbon storage.
All figures were generated using Origin software (version 2021, OriginLab Corp., Northampton, MA, USA) for statistical plots (e.g., bar charts, correlation plots) and ArcGIS (version 10.8, Esri, Redlands, CA, USA) for spatial mapping of study sites. Statistical significance was considered at p < 0.05.
3. Results
3.1. Analysis of Carbon Content in Different Organs of Various Tree Species
As indicated in
Table 3, the overall average carbon content rates for each organ were ranked as follows: trunk (50.19%) > branches (46.72%) > roots (46.29%) > leaves (46.11%). Among different tree species with the same organ,
Magnolia grandiflora L had the highest carbon content rates in the trunk, branches, and roots, while
Platanus orientalis L. had the highest carbon content rate in the leaves. For the aboveground parts of each species,
Magnolia grandiflora L. had the highest carbon content rate, followed by
Cinnamomum camphora (L.) Presl.,
Styphnolobium japonicum (L.) Schott,
Platanus orientalis L., and
Pterocarya stenoptera C. DC., with
Koelreuteria paniculata Laxm. having the lowest. For the belowground parts,
Magnolia grandiflora L. was also the highest, followed by
Salix babylonica L.,
Cinnamomum camphora (L.) Presl.,
Acer buergerianum Miq., and
Pterocarya stenoptera C. DC., with
Platanus orientalis L. having the lowest carbon content rate.
Nonparametric Kruskal–Wallis tests (p < 0.05) revealed significant differences in carbon content between the trunk and leaves of Magnolia grandiflora L., Styphnolobium japonicum (L.) Schott, and Salix babylonica L. Acer buergerianum Miq. showed significant differences in carbon content between the branches and trunk or leaves. Platanus orientalis L. exhibited significant differences among the trunk, branches, leaves, and roots. No significant differences were detected among organs in Koelreuteria paniculata Laxm., Pterocarya stenoptera C. DC., and Cinnamomum camphora (L.) Presl.
3.2. Single-Tree Biomass Allocation of Arboreal Species
As shown in
Table 4, the biomass accumulation of each organ for the tree species was ranked as follows: trunk > roots > branches > leaves. In terms of total biomass per tree,
Acer buergerianum Miq. ranked highest, which may be attributable to its relatively larger diameter and greater root biomass.
Platanus orientalis L. and
Magnolia grandiflora L. followed, both of which are characterized by high trunk mass, a key contributor to overall biomass. In contrast,
Koelreuteria paniculata Laxm. and
Salix babylonica L. exhibited lower total biomass, likely due to their smaller crown width and lower trunk allocation. For the same organ across different tree species,
Platanus orientalis L. had the highest trunk biomass, which is 246.50 kg. The tree species with the highest biomass for branches, leaves, and roots is
Acer buergerianum Miq., with values of 74.00 kg, 19.70 kg, and 93.20 kg, respectively. For the same tree species, the trunk consistently accounts for the largest proportion of biomass among the different organs.
Through multiple comparison analysis, significant differences were found among different deciduous tree species for the same organ. Magnolia grandiflora L., Styphnolobium japonicum (L.) Schott, Pterocarya stenoptera C. DC., and Salix babylonica L showed significant differences in branch biomass and root biomass compared to trunk biomass and leaf biomass (p < 0.05). Koelreuteria paniculata Laxm exhibited significant differences in trunk biomass compared to branch biomass and leaf biomass (p < 0.05). Acer buergerianum Miq. and Cinnamomum camphora (L.) Presl. had significant differences in trunk biomass compared to branch biomass, leaf biomass, and root biomass (p < 0.05), as well as significant differences between leaf biomass and root biomass (p < 0.05). Platanus orientalis L. showed significant differences in trunk biomass compared to branch biomass, leaf biomass, and root biomass (p < 0.05).
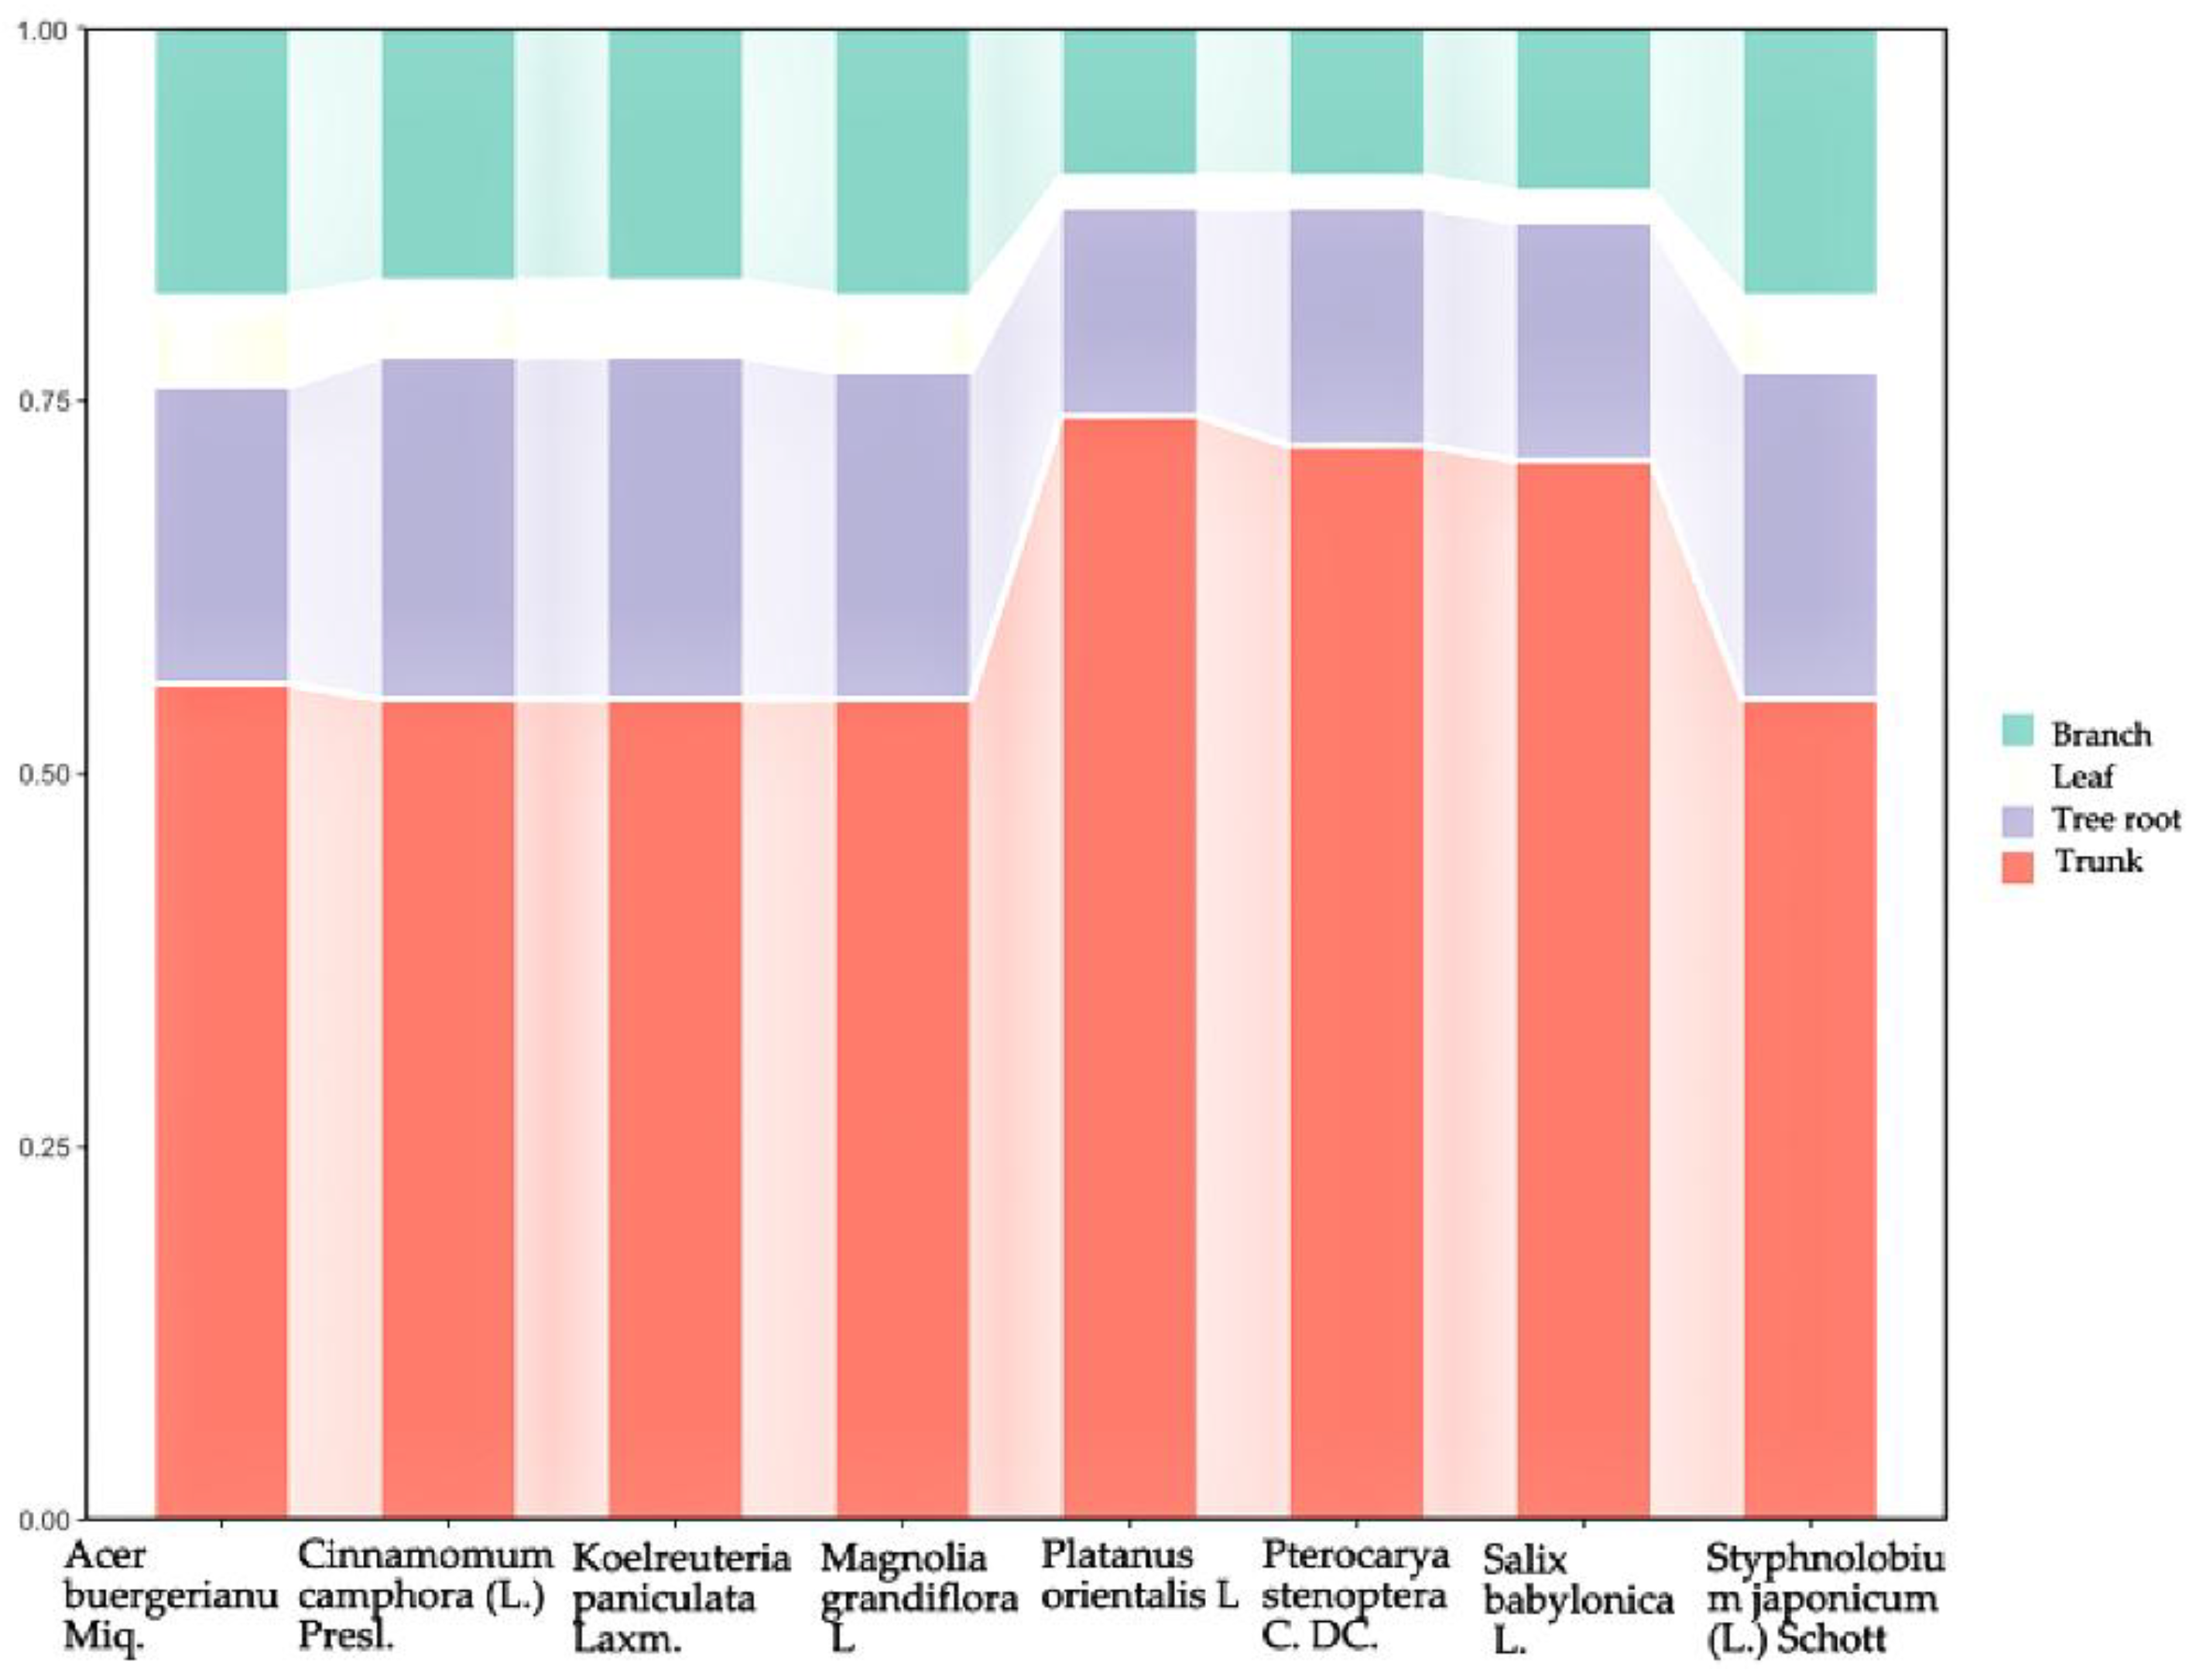
3.3. Proportion of Biomass in Various Organs of Tree Species
The biomass of eight tree species, including
Magnolia grandiflora L,
Koelreuteria paniculata Laxm.,
Styphnolobium japonicum (L.) Schott,
Acer buergerianum Miq.,
Cinnamomum camphora (L.) Presl.,
Pterocarya stenoptera C. DC., and
Salix babylonica L., was primarily concentrated in the trunk (
Figure 2).
Across species, trunk biomass accounted for the majority of the total tree biomass. Notably, Platanus orientalis L. exhibited the highest proportion of trunk biomass (73.87%), followed closely by Pterocarya stenoptera C. DC. and Salix babylonica L., suggesting that these species invest more in vertical structure. Acer buergerianum Miq. had the largest share of branch biomass (17.55%), indicating a relatively broader canopy structure. In terms of leaf biomass, Koelreuteria paniculata Laxm. showed the highest proportion (5.18%), which may be associated with its fast growth and adaptation to urban greening applications.
3.4. Analysis of Carbon Storage in Arboreal Species
The carbon storage in different organs for the various tree species is presented in
Table 5.
Platanus orientalis L. had the highest carbon storage in the trunk, amounting to 127.2 kg. For the branches, leaves, and roots,
Acer buergerianum Miq. showed the highest carbon storage, with 33.34 kg, 9.36 kg, and 42.93 kg, respectively. Across the species, the trunk consistently accounted for the largest proportion of total carbon storage at the individual tree level. In terms of trunk carbon storage, the ranking was as follows:
Platanus orientalis L. >
Acer buergerianum Miq. >
Pterocarya stenoptera C. DC. >
Magnolia grandiflora L. >
Styphnolobium japonicum (L.) Schott >
Cinnamomum camphora (L.) Presl. >
Salix babylonica L. >
Koelreuteria paniculata Laxm. For branch carbon storage, the order was
Acer buergerianum Miq. >
Magnolia grandiflora L. >
Styphnolobium japonicum (L.) Schott >
Cinnamomum camphora (L.) Presl. >
Pterocarya stenoptera C. DC. >
Platanus orientalis L. >
Koelreuteria paniculata Laxm. >
Salix babylonica L.
For leaf carbon storage, the ranking was Acer buergerianum Miq. > Magnolia grandiflora L. > Styphnolobium japonicum (L.) Schott > Cinnamomum camphora (L.) Presl. > Koelreuteria paniculata Laxm. > Platanus orientalis L. > Pterocarya stenoptera C. DC. > Salix babylonica L. In root carbon storage, the order was Acer buergerianum Miq. > Magnolia grandiflora L. > Styphnolobium japonicum (L.) Schott > Cinnamomum camphora (L.) Presl. > Pterocarya stenoptera C. DC. > Koelreuteria paniculata Laxm. > Platanus orientalis L. > Salix babylonica L.
In terms of total carbon storage per tree, Acer buergerianum Miq. was the most effective carbon sink, followed by Magnolia grandiflora L. and Platanus orientalis L. These species typically possess large trunk diameters and extensive root systems, contributing to higher biomass and thus greater carbon retention. Conversely, species such as Salix babylonica L. and Koelreuteria paniculata Laxm. stored less carbon per individual, which may reflect differences in growth habit or wood density.
3.5. The Relationship Between Variables and Biomass and Carbon Storage
Correlation analysis (
Table 6) revealed strong positive relationships between tree height and both individual biomass (r = 0.836,
p < 0.01) and carbon storage per tree (r = 0.795,
p < 0.05). DBH also showed moderate correlations with these variables. Crown width exhibited a significant negative correlation with carbon storage per unit area (r = −0.758,
p < 0.05). To account for uncertainty, all carbon storage estimates were expressed as mean ± standard deviation and based on replicate samples (n = 3 per organ), as shown in
Table 4 and
Table 5.
Although significant correlations between DBH, tree height, and crown width are commonly reported in natural forests, the urban trees sampled in this study have been subjected to frequent management interventions, such as topping and pruning, for aesthetic and safety purposes. These practices may have altered their natural growth patterns, contributing to the relatively weak correlations observed. Additionally, the limited sample size (n = 24) across eight species may have reduced the statistical power to detect stronger relationships. While tree height and DBH were both considered as independent variables in the allometric biomass models, their direct correlations with biomass were also evaluated to further illustrate biological associations. Normality assumptions were checked prior to conducting the Pearson correlation analysis, ensuring the reliability of the statistical results. Specifically, the Shapiro–Wilk test was used to assess the normality of each variable. All the variables met the normality assumption (p > 0.05), validating the use of Pearson correlation coefficients.
4. Discussion
The amount of biomass is related to various factors, such as soil fertility, stand density, forest age, climate, and the management practices in its respective region [
23]. Previous studies have consistently shown that biomass is predominantly allocated to the trunk, followed by roots, branches, and leaves, which reflects the structural and functional demands of tree growth [
24,
25,
26]. Our study confirmed this general trend among the eight commonly used urban landscaping species in Zhengzhou, suggesting consistent biomass partitioning even under urban environmental conditions [
27,
28]. Biomass measurement methods are divided into direct determination and indirect determination. Direct determination involves cutting down trees within a unit area to obtain the biomass of the species, but this method is highly destructive and rarely used. Indirect determination, on the other hand, utilizes biomass modeling methods, which can be categorized into individual tree biomass models and large-scale forest biomass models based on scale. Individual tree species biomass is estimated by establishing relative growth equations [
29]. Large-scale forest biomass models primarily use remote sensing technology to simulate and estimate forest biomass [
30]. Currently, the most commonly used variable in establishing biomass allometric equations for biomass estimation is the diameter at breast height (D) of trees, which is most easily and accurately measured [
31]. A study by Wang et al. [
32] on the allometric growth models of main tree species in Guangxi Province showed that diameter at breast height data can be obtained simply and accurately and can therefore be used to estimate the biomass of various organs of the 10 main tree species (groups) in Guangxi. Many allometric growth models add other variables, such as tree height, as the second variable on the basis of diameter at breast height to predict the biomass of various tree organs, thereby improving the accuracy of model estimation. A study by Chave [
33] on the allometric determination of tropical forest trees showed that if tree height (H) is available, the standard error of estimating stand biomass is 12.5%, and if H is not available, it is 19.5%. This paper found that the relative growth model of tree biomass was improved to varying degrees after adding tree height (H) to the biomass model. Carbon storage is one of the important indicators for evaluating the carbon cycle in forest ecosystems [
34]. Liu et al. [
35] used data from four forest resource inventories in Henan Province to estimate the dynamic changes in forest vegetation carbon storage in Henan Province from 1998 to 2013, indicating that the forest vegetation carbon storage in Henan Province increased from 45.57 Tg in 1998 to 107.98 Tg in 2013, with an average annual carbon sink of 4.16 Tg/a. Bai et al. [
36] analyzed the biomass and carbon sequestration characteristics of 38 afforestation and greening tree species in the central and northern parts of Henan Province, such as
Sabina chinensis (L.) Ant.,
Malus spectabilis,
Salix babylonica Linn,
Paulownia fortunei (Seem.) Hemsl.,
Populus tomentosa Carrière, and reasonably selected tree species with strong carbon sequestration capabilities for afforestation and greening purposes.
Across the studied species, carbon content and biomass allocation varied considerably among the organs and between species. Magnolia grandiflora L. consistently exhibited the highest carbon concentrations in the trunk, branches, and roots, whereas Platanus orientalis L. showed the highest carbon content in the leaves. Despite these differences, a consistent pattern emerged: the trunks generally had the highest carbon content across species, followed by the branches, roots, and leaves. This pattern is ecologically plausible, as trunks serve as the primary structural and long-term storage components in trees.
Biomass allocation followed a similar hierarchy, with the trunks being the dominant biomass pool across all the species, which is consistent with the demands of mechanical support and resource transport. For instance, Platanus orientalis L. demonstrated a particularly high proportion of trunk biomass, exceeding 70%, reaffirming its role as a prominent street tree known for its structural massiveness. Meanwhile, species like Acer buergerianum Miq. and Magnolia grandiflora L. also exhibited substantial trunk and root biomass, contributing to their higher overall carbon storage per tree.
Growth performance indicators such as tree height, DBH, and crown width suggested favorable development across all eight species under Zhengzhou’s urban conditions. Biomass and carbon accumulation showed strong positive associations with DBH, indicating that as trees mature, their capacity to sequester carbon increases markedly in all organs. These findings reinforce the value of selecting species with not only high growth potential but also favorable structural traits for maximizing urban carbon sinks.
Importantly, the relationship between per-tree carbon storage and per-unit-area carbon storage highlights a trade-off between individual capacity and spatial distribution. While species such as Acer buergerianum Miq. store the most carbon per tree, others like Styphnolobium japonicum (L.) Schott exhibit greater carbon storage per unit area; this is likely due to higher planting density or canopy architecture. This distinction is essential for guiding species selection in urban planning, depending on whether the goal is to maximize per-tree sequestration or overall landscape-level carbon gain. In addition to their aesthetic and ecological functions, urban trees play an increasingly critical role as carbon sinks under the pressure of rising CO2 emissions. This study provides a comprehensive, organ-specific analysis of biomass and carbon storage in eight commonly planted urban tree species in Zhengzhou—a rapidly urbanizing megacity in central China. Compared with previous research that often relied on general biomass models or remote sensing data, our study integrates field-based measurements and species-specific carbon content, offering a more precise and localized assessment of urban tree carbon stocks. Practically, the findings can inform tree species selection for climate-smart urban greening strategies. For instance, Acer buergerianum Miq. and Magnolia grandiflora L. are ideal for enhancing per-tree carbon storage, while Styphnolobium japonicum (L.) Schott and Koelreuteria paniculata Laxm. are recommended for high-density planting scenarios to maximize carbon storage per unit area. These insights provide actionable guidance for municipal planners aiming to optimize urban forest carbon sinks.
It is important to acknowledge that the observed differences in biomass and carbon storage among tree species may not solely reflect inherent interspecific traits, but could also be influenced by differences in tree size and age. Although tree height and DBH were included as covariates in the allometric models, tree age was not explicitly measured or controlled in this study. Given that even a 10-year difference in planting age can substantially affect biomass accumulation, age-related variation may have contributed to the observed patterns. Future studies should incorporate direct measurements of tree age—such as ring counts or planting records—into the analysis to better isolate species-specific carbon sequestration potential from ontogenetic effects.
Future research should expand the scope by incorporating tree age structure, growth rates, and mortality data to model long-term carbon dynamics under different urban development scenarios. Moreover, coupling these data with remote sensing and AI-based tree inventory tools would allow citywide upscaling and continuous monitoring. Ultimately, this research contributes to a growing body of work supporting evidence-based urban forest management for sustainable, low-carbon city development.


